 Kaisha N. Benjamin
 Aditi Goyal
 Ramesh V. Nair
 Drew Endy
- 1Bioengineering, Stanford University, Stanford, CA, United States
- 2Biomedical Data Science, Stanford University School of Medicine, Stanford, CA, United States
- 3Stanford Center for Genomics and Personalized Medicine, Stanford University School of Medicine, Stanford, CA, United States
Skin serves as both barrier and interface between body and environment. Skin microbes are intermediaries evolved to respond, transduce, or act in response to changing environmental or physiological conditions. We quantified genome-wide changes in gene expression levels for one abundant skin commensal, Staphylococcus epidermidis, in response to an internal physiological signal, glucose levels, and an external environmental signal, temperature. We found 85 of 2,354 genes change up to ~34-fold in response to medically relevant changes in glucose concentration (0–17 mM; adj p ≤0.05). We observed carbon catabolite repression in response to a range of glucose spikes, as well as upregulation of genes involved in glucose utilization in response to persistent glucose. We observed 366 differentially expressed genes in response to a physiologically relevant change in temperature (37–45°C; adj p ≤ 0.05) and an S. epidermidis heat-shock response that mostly resembles the heat-shock response of related staphylococcal species. DNA motif analysis revealed CtsR and CIRCE operator sequences arranged in tandem upstream of dnaK and groESL operons. We identified and curated 38 glucose-responsive genes as candidate ON or OFF switches for use in controlling synthetic genetic systems. Such systems might be used to instrument the in-situ skin microbiome or help control microbes bioengineered to serve as embedded diagnostics, monitoring, or treatment platforms.
Introduction
Skin serves as both a barrier to the external environment and home to diverse microbial communities. Approximately 1,000 species of bacteria reside on the skin, of which Staphylococcus, Corynebacterium, and Cutibacterium are the most prevalent bacterial genera (Byrd et al., 2018; Eisenstein, 2020). Skin bacteria play a significant role in promoting and maintaining human health, contributing to skin barrier homeostasis (Zheng et al., 2022), influencing our immune system (Leech et al., 2019; Lima-Junior et al., 2021), and limiting pathogen invasion (Cogen et al., 2008; Naik et al., 2015; Nakatsuji et al., 2017; Williams et al., 2019; Heilbronner et al., 2021). Skin bacteria are also adept at adapting to and thriving in the acidic, nutrient-poor, hostile environment of the human skin (Swaney et al., 2023).
One abundant skin commensal is Staphylococcus epidermidis, a Gram-positive coagulase-negative bacterium. S. epidermidis is a beneficial member of the skin microbiome but can become pathogenic in response to genetic, environmental, or host changes (Severn and Horswill, 2022). For example, S. epidermidis is a major implant-associated pathogen due to its ability to form biofilms (Oliveira et al., 2018). Transcriptomics studies on S. epidermidis and related staphylococcal species have investigated a variety of topics including survival responses to the sebaceous lipid sapienic acid (Moran et al., 2017), transcription responses to sunlight exposure in oxic and anoxic conditions (McClary and Boehm, 2018), genes and pathways implicated in the pathogenesis of S. epidermidis endophthalmitis (Liu et al., 2020), and genetic factors influencing the ability of S. epidermidis to exist as a commensal or nosocomial pathogen (Spoto et al., 2022).
S. epidermidis has also begun to emerge as a microbial chassis for enabling development of engineered microbes with enhanced functionality. For example, Chen et al. engineered an S. epidermidis strain to produce tumor-associated antigens unique to melanoma, an aggressive type of metastatic skin cancer. When mice were colonized with the engineered S. epidermidis strain, a robust antitumor T cell response against localized and metastatic melanoma was generated (Chen et al., 2023). As a second example, Azitra, Inc. indicates they are engineering S. epidermidis strains to deliver therapeutic proteins to treat skin diseases including Netherton Syndrome and to improve skin appearance (Azitra, 2023).
Unfortunately, the tools and knowledge needed to study and reprogram S. epidermidis are quite limited compared to those available for established model organisms such as Escherichia coli or Saccharomyces cerevisiae. Introduction of new genes and predictable control of heterologous gene expression remain considerable challenges in bioengineering S. epidermidis. The nascent S. epidermidis knowledge base and toolkit contains methods for transformation (Monk et al., 2012; Costa et al., 2017), methods for conjugation (Brophy et al., 2018), and a small number of functionally validated promoters for control of gene expression including sarA-P1 (Bayer et al., 1996), Ppen (Meredith et al., 2008), IPTG-inducible Pspank (Rokop et al., 2004), and xylose-inducible PxylR (Franke et al., 2007). While successful attempts have been made to identify and characterize constitutive promoters in related staphylococcal species including Staphylococcus aureus (Liu et al., 2022), native transcription control elements that can serve as starting points for endogenous and dynamic control of bioengineered circuits, as well established in E. coli (Borkowski et al., 2017; Moser et al., 2018; Ni et al., 2021), are not yet developed in S. epidermidis.
One application of bioengineered skin microbes could be to detect or respond to blood glucose levels, which could help in the diagnosis or treatment of diabetes. Commensal skin microbes such as S. epidermidis reside in subepidermal compartments of the skin with proximity to blood vessels, such as the dermis and subcutaneous adipose tissue (Nakatsuji et al., 2013; Bay et al., 2020). Such proximity could potentially facilitate the development of an engineered S. epidermidis strain that can sense and respond to elevated blood glucose levels (i.e., above 7 mM glucose) as a therapeutic strategy for diabetes, a chronic endocrine disorder characterized by elevated blood glucose levels and poor glycemic control (World Health Organization, 2023). To make such work practical, one would need to implement within S. epidermidis a transcription-based biosensor responsive to elevated blood sugar levels that results in well-regulated and rapid production of a single-chain insulin analog (Glidden et al., 2018), a stable form of insulin whose successful production does not depend on disulfide bond formation, a process that can be impaired by active reducing systems in bacteria (delCardayré et al., 1998; Manta et al., 2019). Such a use case supports the need for better characterization of glucose-inducible S. epidermidis regulatory elements.
Another class of applications for bioengineered skin microbes could be in response to environmental or physiological (e.g., exercise-induced) changes in temperature. With globally increasing intensity, frequency, and duration of heat waves (Perkins-Kirkpatrick and Lewis, 2020), there may also be value in better understanding how commensal skin bacteria, including S. epidermidis, adapt and respond to increases in temperature. While the heat-shock response has been well characterized in related staphylococcal species and other prokaryotes, only three efforts have investigated the S. epidermidis heat-shock response by using semi-quantitative protein assays (Ooronfleh et al., 1990), focusing on only a small number of genes (Vandecasteele et al., 2001), or using comparative genomics (Chastanet et al., 2003). We thus chose to also quantitatively explore the genome-wide transcription response of S. epidermidis to heat shock, both as a reference case for glucose response and for its own merits.
We investigated the genome-wide transcription response of S. epidermidis strain (ATCC 12228) to heat shock and medically relevant glucose concentrations. We chose ATCC 12228 in part because it is a non-biofilm forming (i.e., non-pathogenic) strain and thus should be safer for future applications. We performed RNA sequencing on samples exposed to a sudden temperature increase and a glucose challenge to investigate the ability of the organism to adapt and respond to changing environmental conditions. We used differential expression analysis of samples taken during the mid-exponential growth phase to identify candidate genes that are either upregulated or downregulated in response to each condition. We further curated a subset of glucose-responsive genes that might serve as templates for ON or OFF switches.
Materials and methods
Bacterial strain and culture
We started each S. epidermidis ATCC 12228 culture from a fresh colony plate (<7 days old) using a single colony. We used Tryptic Soy Broth (TSB) without Dextrose (BD 286220) as the culture medium for all experiments.
Heat-shock experiments
We grew overnight broth cultures in fresh medium supplemented with 0.2% w/v glucose for 18 h at 37°C with shaking. Cultures were then diluted 32-fold in fresh medium supplemented with 0.2% w/v glucose (OD600 ~ 0.28) so that ~1 h of continued growth at 37°C with shaking resulted in mid-exponential phase (OD600 ~ 0.5) cells. We transferred them to pre-warmed Erlenmeyer flasks followed by incubation at 45°C for 10 min. We then harvested cultures for RNA sequencing (below). Control cultures in mid-exponential phase were not exposed to heat shock but instead were immediately harvested for RNA sequencing. We performed our heat-shock experiments in triplicate to generate three biological replicates.
Glucose challenge experiments
We grew overnight broth cultures in fresh medium supplemented with 13.9 mM glycerol for 25 h at 37°C with shaking. We then diluted cultures 50-fold in fresh medium supplemented with 13.9 mM glycerol (OD600 ~ 0.15) so that ~2.25 h of continued growth at 37°C with shaking resulted in mid-exponential phase (OD600 ~ 0.5) cells. We then added glucose and measured the glucose concentration (2, 5, 10, 17, or 50 mM) of each culture using the Contour NEXT ONE Blood Glucose Monitoring System. We added an equivalent volume of fresh medium lacking glucose to the control cultures. We grew cultures at 37°C with shaking for an additional 20 min and then harvested for RNA sequencing (below). We performed our glucose challenge experiments in triplicate to generate three biological replicates.
Step-down experiments
We grew overnight broth cultures in fresh medium supplemented with 13.9 mM glycerol for 25 h at 37°C with shaking. We diluted cultures 50-fold in fresh medium supplemented with 13.9 mM glycerol and continued growth at 37°C with shaking. When cultures were in mid-exponential phase (OD600 ~ 0.5), we added glucose and measured the glucose concentration (10 mM) of each culture using the Contour NEXT ONE Blood Glucose Monitoring System. Cultures were then grown at 37°C with shaking for 20 min and then pelleted at 5,000 × g for 10 min at 24°C. We then resuspended the pellets in fresh medium supplemented with 2 mM glucose. We grew cultures at 37°C with shaking for an additional 20 min and harvested for RNA sequencing (below). We used the 10 mM glucose challenge condition (above) as the control condition for our step-down experiments. We performed our step-down experiments in triplicate to generate three biological replicates.
Batch culture experiments
We grew overnight broth cultures in fresh medium supplemented with glucose (0.2% w/v or 1% w/v) for 18 h at 37°C with shaking. We measured the glucose concentration of each culture using the Contour NEXT ONE Blood Glucose Monitoring System. We diluted cultures 32-fold in fresh medium supplemented with glucose (0.2% w/v or 1% w/v) and grew at 37°C with shaking. We harvested mid-exponential phase cultures (OD600 ~ 0.5) for RNA sequencing (below). We performed our batch culture experiments in duplicate to generate two biological replicates.
RNA stabilization and extraction
Immediately after each experiment, we pelleted samples by centrifugation at 5,000 × g for 10 min at 4°C and then resuspended the pellets in RNAlater (Invitrogen AM7021); samples were incubated in RNAlater at 4°C for 24 h. After incubation, we pelleted samples by centrifugation at 5,000 × g for 10 min at 4°C and resuspended the pellets in 1 μL of 100X TE Buffer, 50 μL of lysostaphin (1 mg mL−1), and 50 μL of mutanolysin (5KU mL−1). We performed lysis for 25 min at 37°C with vortexing at 5-min intervals. We then treated samples with 25 μL of Proteinase K (Qiagen 19131) and incubated for an additional 30 min at 37°C. We added 700 μL of Buffer RLT (Qiagen 79216) to each sample and vortexed vigorously for 5–10 s. We transferred the resulting suspension to a 2 mL Safe-Lock tube (Eppendorf 0030123620) and mechanically disrupted the samples using a TissueLyser LT (Qiagen 85600) for 5 min at maximum speed with intervals of 30 s of bead beating and 30 s of resting on ice. After bead beating, we centrifuged the samples in an Eppendorf MiniSpin (022620100) for 15 s at maximum speed (12,100 × g) and then transferred the supernatant to a new tube. We mixed the supernatant well with an equal volume of 100% ethanol by pipetting. We applied this mixture to a RNeasy Mini spin column and extracted RNA according to the manufacturer’s instructions using a RNeasy Mini Kit (Qiagen 74106). We performed on-column DNase digestion using the RNase-Free DNase Set (Qiagen 79254). We eluted samples in RNase-free water according to the manufacturer’s instructions and stored recovered RNA at −80°C until library preparation. We used RNaseZap RNase Decontamination Solution (Invitrogen AM9780) on all surfaces to prevent RNA degradation. RNA quality was analyzed using an Agilent Bioanalyzer and quantified by a Qubit fluorometer according to manufacturer’s instructions. Our RNA integrity number (RIN) values ranged from 8.0 to 10.
Library preparation and sequencing
We used Novogene Co., Ltd. (Beijing, China) to carry out our rRNA depletion, cDNA library preparation, and sequencing as part of their Prokaryotic RNA Sequencing service. cDNA libraries were sequenced on an Illumina NovaSeq 6,000 Sequencing System with a 150 bp paired-end run configuration to a depth of ~30 million reads.
Raw sequence data quality control and processing
We processed raw reads (FASTQ files) using FastQC v0.12.1 (Andrews, 2010) with default settings to assess initial read quality and then examined the results using MultiQC v1.14 (Ewels et al., 2016). We processed FASTQ files using Trim Galore v0.6.10 (Krueger, 2012) with default settings to trim low-quality (Phred score < 20) ends from reads and to trim auto-detected adapters. Reads that became shorter than 20 bp because of either quality or adapter trimming were discarded.
Reference genome for mapping
We used the S. epidermidis ATCC 12228 genome assembly ASM987345v1 (GenBank accession GCA_009873455.1, RefSeq accession GCF_009873455.1) from NCBI in the FASTA format along with information on genes and other features in the GFF format. The genome consists of a chromosome (GenBank accession CP043845.1, RefSeq accession NZ_CP043845.1) of size 2,504,425 bp and a plasmid (GenBank accession CP043846.1, RefSeq accession NZ_CP043846.1) of size 21,978 bp. We converted GFF features to GTF format by using the gffread program in the Cufflinks v2.2.1 package (Trapnell et al., 2010) and to BED format by using the AGAT v1.0.0 toolkit (Dainat, 2019) for use in downstream analysis.
Mapping and transcript quantification
We used Bowtie2 v2.5.1 (Langmead and Salzberg, 2012) to build a Bowtie index from the S. epidermidis ATCC 12228 genome assembly ASM987345v1 before mapping the RNA-Seq reads in the paired-end FASTQ files to this reference genome using default settings. The resulting BAM files were coordinate-sorted and indexed; alignment summary statistics were reported using SAMtools v1.17 (Danecek et al., 2021). We ran RSeQC v5.0.1 (Wang et al., 2012) on the sorted BAM files to determine the strandedness of the reads for the strand-specific RNA-seq data. We used featureCounts in the Subread v2.0.6 package (Liao et al., 2013) to count mapped reads at both the transcript and gene levels from sorted BAM files for genomic features such as CDSs, based on previously determined read strandedness. We merged counts from each sample at both the transcript and gene levels. We used the resulting merged count matrices in subsequent differential expression analysis.
BLASTP homology search
The KEGG Pathway Database (Kanehisa and Goto, 2000) Genome Entry T00110 (Org code: sep) lists genome assembly ASM764v1 (GenBank accession GCA_000007645.1, RefSeq accession GCF_000007645.1) as the reference genome for S. epidermidis ATCC 12228. Genome assembly ASM764v1 uses alternate gene designations compared to the genome assembly ASM987345v1 used in this study. To leverage KEGG pathway gene sets for Gene Set Enrichment Analysis (GSEA), we conducted a BLASTP homology search between the two genome assemblies using NCBI BLAST+ executable v2.14.0+ (Camacho et al., 2009) to find genes in genome assembly ASM987345v1 with the highest degree of homology to genes in genome assembly ASM764v1 thereby enabling cross-mapping of the genes represented in KEGG Pathway Gene Sets.
Differential expression analysis
We used principal component analysis (PCA) to first visualize the expression data; we applied a regularized log (rlog) transformation to all expression data. We then visualized sample-to-sample distances via PCA and found that one replicate from the step-down experimental condition was over 4-fold off on the second principal component against all other experimental samples, and over 10-fold off on the first principal component against the other two step-down samples (Supplementary Figure S1). We thus excluded the data from this one step-down replicate in all further analyses. We then analyzed data from non-transformed count matrices using the DESeq2 R package (Love et al., 2014), which can evaluate differential expression on as few as two biological replicates. We defined differentially expressed genes (DEGs) of significance using the following criteria: |log2 fold change| (i.e., log2FC) ≥ 1.5 and adjusted p ≤ 0.05. We applied the apeglm (log fold change shrinkage) method (Zhu et al., 2018) to the raw counts to stabilize variability in log fold change calculations. We then constructed volcano plots using the EnhancedVolcano R package (Blighe et al., 2023) and further customized them using ggplot2 (Wickham, 2016). We designed Circle plots using shinyCircos (Yu et al., 2017). We also constructed the two scatter plots, visualizing the relationship between the heat-shock and G17 experimental conditions and between the step-down and G2 experimental conditions, using ggplot2.
Pathway and gene identification
We explored gene functions using the KEGG and GO pathways database and manually curated a gene annotation table, drawing from the KEGG (organism code sep), BioCyc (GCF_000007645), and UniProt databases. After determining gene-to-pathway annotations, we used the GSEA tool (Mootha et al., 2003; Subramanian et al., 2005) and the fgsea R package (Korotkevich et al., 2021) to conduct gene set enrichment analysis. We used Fisher’s method to combine results that overlapped across GSEA and fgsea, creating a single p-value that reflected the two independent adjusted p-values. We reduced GO term redundancy using REVIGO (Supek et al., 2011), with default parameters and a “small (0.5)” resulting list. Once KEGG and GO enriched pathways were identified, we performed independent research to cross-validate the results and combined pathways that were identified in both KEGG and GO databases.
Switch identification
We identified switches using the DRomics package, a tool used for concentration-response (or dose–response) characterization from -omics data (Larras et al., 2018; Delignette-Muller et al., 2023). We modeled all genes with an absolute log fold change ≥2. We performed a rlog transform on gene counts and then used DRomics to identify the appropriate best-fit monophasic or biphasic model; genes that failed to model due to a slope near zero were deemed dose-insensitive.
Batch culture bioinformatics analysis
Novogene (Beijing, China) completed bioinformatics analyses for our batch culture experimental condition as part of their Prokaryotic RNA Sequencing standard analysis. Raw Sequence Data Quality Control: Novogene processed raw reads (FASTQ files) using Fastp (Chen et al., 2018). Clean data for downstream analysis were obtained by removal of low-quality reads, adapters, and poly-N sequences. Reference Genome and Mapping: Novogene obtained the reference genome (GenBank accession GCA_009873455.1, RefSeq accession GCF_009873455.1) and gene model annotation files from NCBI and aligned clean reads to the reference genome using Bowtie2 (Langmead and Salzberg, 2012). Transcript Quantification: Novogene used FeatureCounts (Liao et al., 2013) to count reads mapped to each gene and then calculated the fragments per kilobase of transcript per million fragments mapped (FPKM) of each gene based on gene length and read counts mapped to the gene (Trapnell et al., 2010). Differential Expression Analysis: Novogene performed differential expression analysis using the DeSeq2 R package (Love et al., 2014) and adjusted p-values using the Benjamini and Hochberg method for controlling the false discovery rate (Benjamini and Hochberg, 1995). DEGs of significance were defined using the following criteria: |log2 fold change| (i.e., log2FC) ≥ 1.5 and adjusted p-value <0.05.
Results
The heat-shock response (HSR), a transcription program observed in several eukaryotes and prokaryotes, is crucial for cells adapting to a sudden temperature increase or other environmental stresses (Cao et al., 1999). HSR helps cells maintain protein homeostasis by protection from heat-induced protein denaturation, misfolding, and aggregation. HSR has been studied in detail in Escherichia coli, Streptomyces spp., and Bacillus subtilis (Lemaux et al., 1978; Guglielmi et al., 1991; Schumann, 2003). While the HSR is highly conserved across prokaryotes, the regulatory mechanisms that govern the expression of heat-shock genes exhibit great diversity among bacterial species (Schumann, 2016; Roncarati and Scarlato, 2017). Prior studies of the HSR in S. aureus (Chastanet et al., 2003; Anderson et al., 2006; Fleury et al., 2009) and the Gram-positive model organism B. subtilis provide a context from which to increase our understanding of the HSR of S. epidermidis and other low-GC content Gram-positive bacteria.
Differential gene expression in S. epidermidis under heat stress
To identify differentially expressed genes in heat-shocked S. epidermidis ATCC 12228 cells, we shifted mid-exponential phase cells from physiological growth (37°C) to heat-shock conditions (45°C) for 10 min (Figure 1A). We used RNA sequencing to analyze gene expression profiles and then compared the expression profiles of heat-shocked cells to those of unstressed cells. Differentially expressed genes (DEGs) of significance were defined using the following criteria: |log2 fold change| (i.e., log2FC) ≥ 1.5 and adjusted p value ≤0.05. By these criteria, we identified 366 of 2,354 genes (~15.5% of the genome) with log2FC values ≥1.5, among which 235 were upregulated and 131 were downregulated (Supplementary Tables S1, S2). Downregulated and upregulated genes were expressed over a −4 to +6 log2FC range (Figure 2A).
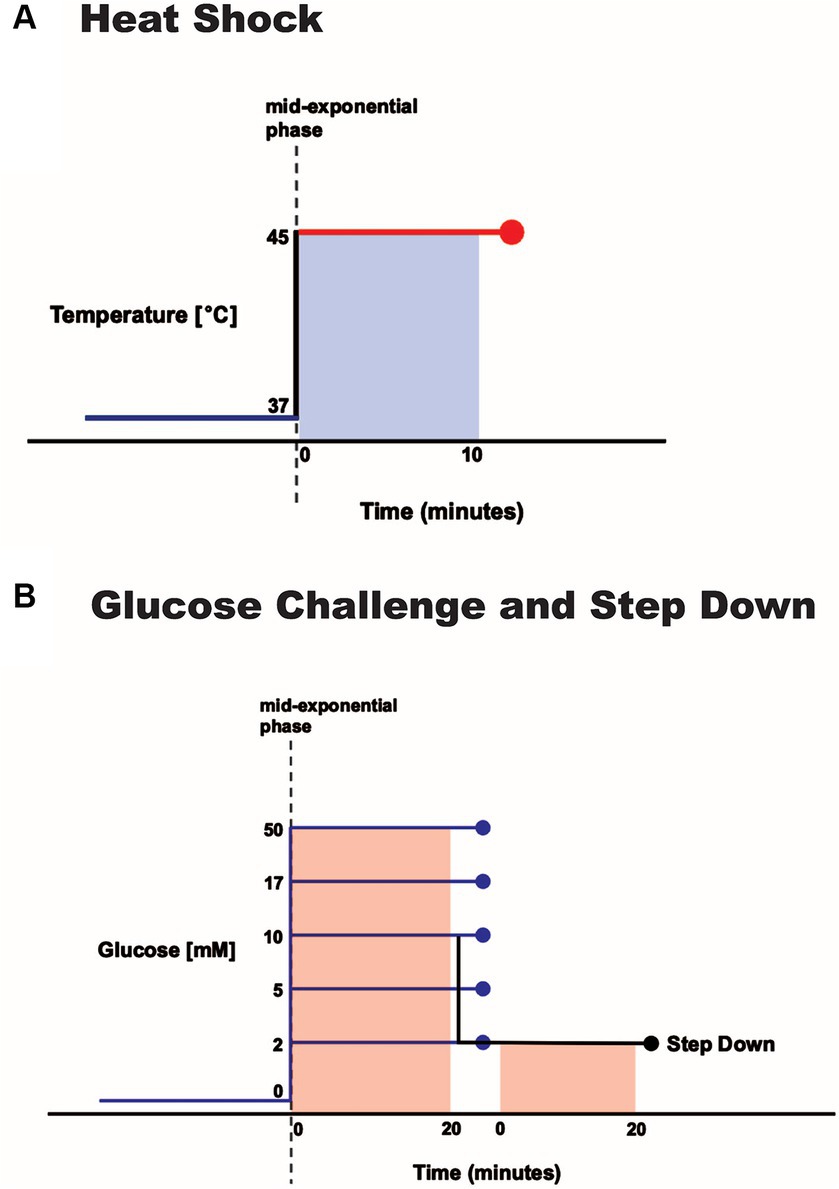
Figure 1. Environmental perturbation of S. epidermidis. Log-phase cultures were exposed to (A) a 10-min increase in temperature from 37 to 45°C or (B) a range of 20-min glucose spikes (concentrations as noted) and a 10 mM spike followed by a step down to 2 mM.
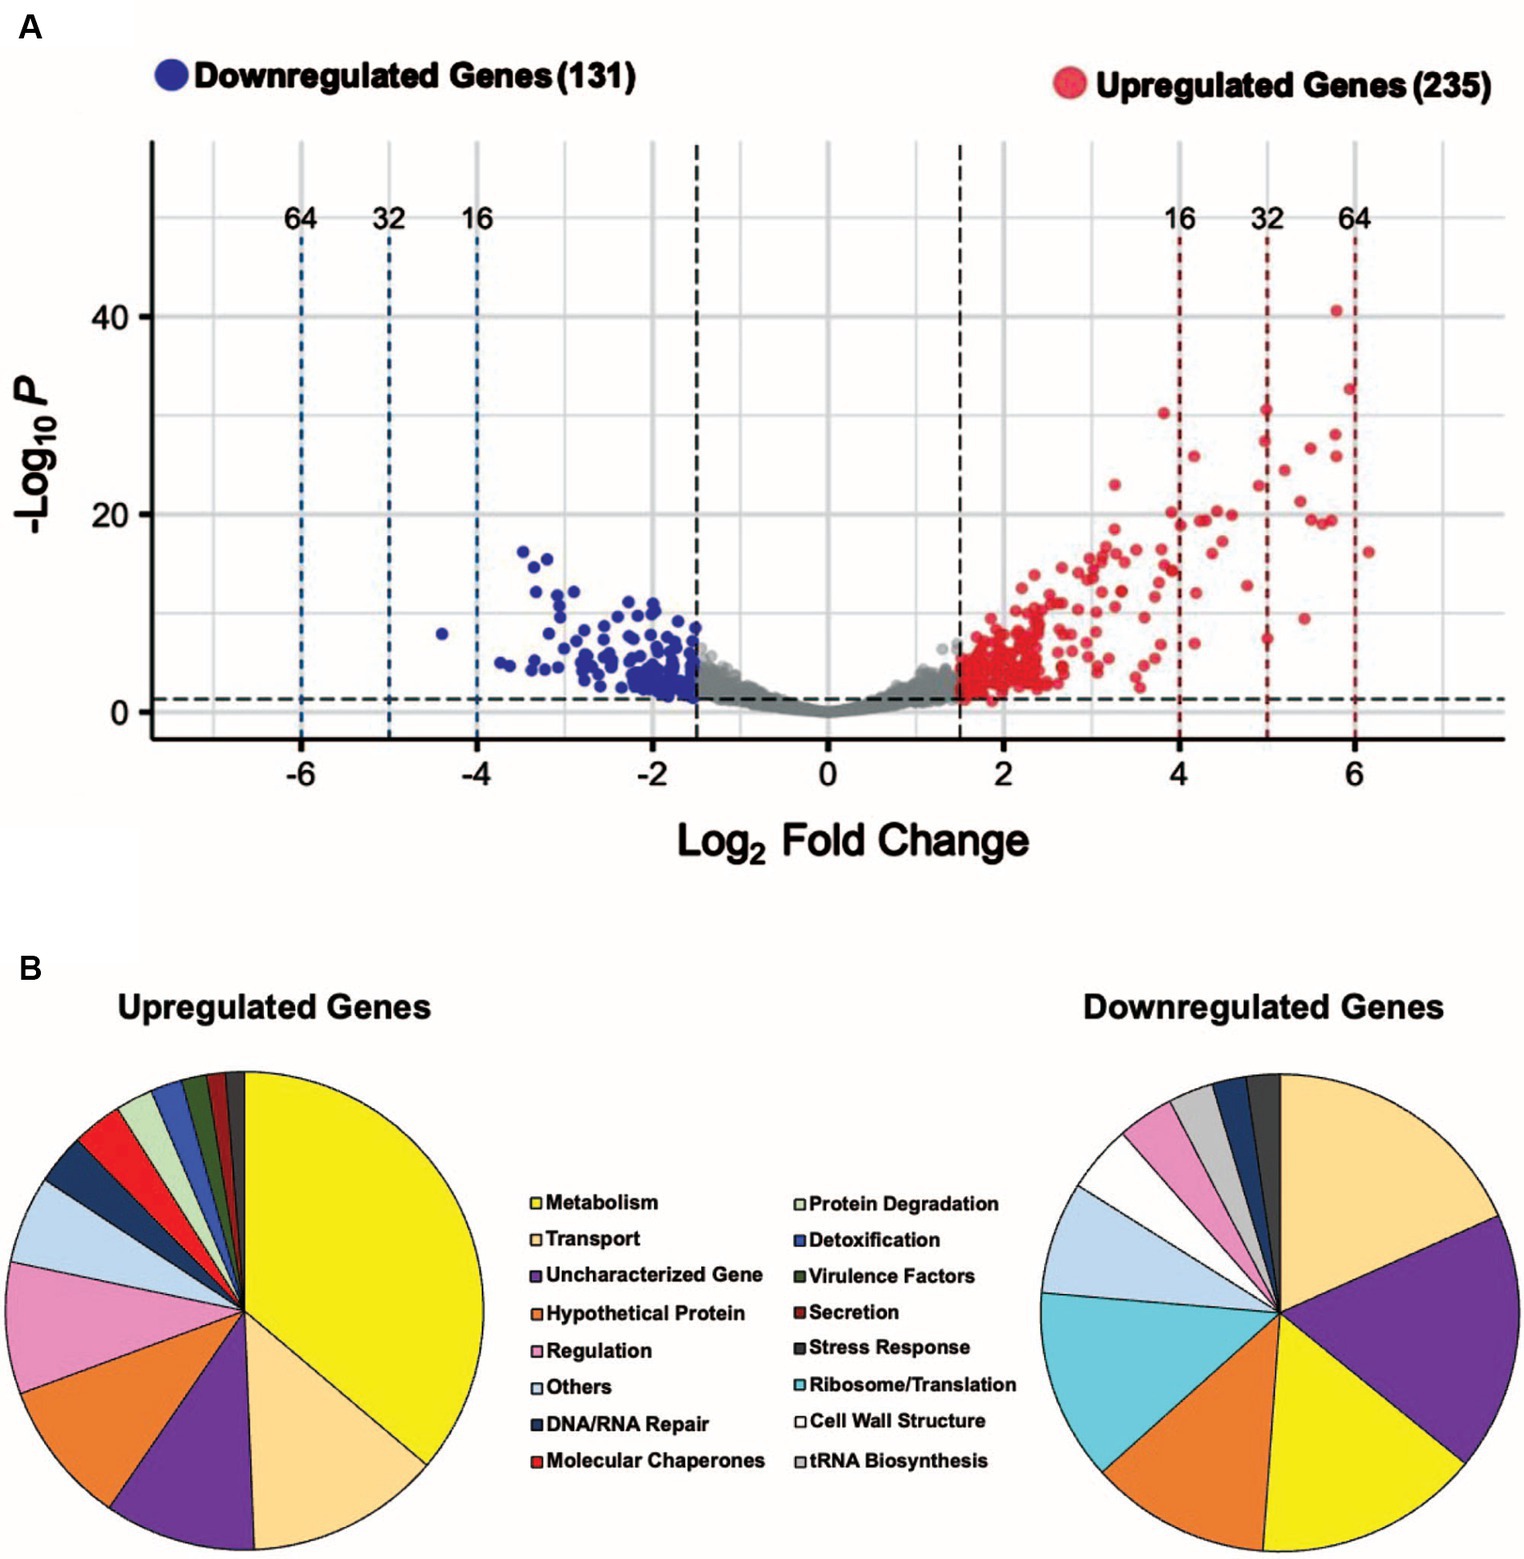
Figure 2. A sudden temperature increase causes transcript levels to change up to ~ 71-fold. (A) Volcano plot showing the differentially expressed genes (DEGs) for the heat-shock experimental condition with |log2 FC| ≥ 1.5 and adjusted p ≤ 0.05 as the threshold. The red dots represent 235 significantly upregulated genes, and the blue dots represent 131 significantly downregulated genes. (B) Summary of the significantly upregulated and downregulated genes during the heat-shock response in S. epidermidis assigned to functional groups according to GO and KEGG pathways (in %).
We observed increased expression of several heat-shock genes well-characterized in other organisms (Schumann, 2003; Anderson et al., 2006; Fleury et al., 2009). For example, transcript levels of the dnaK (hrcA, grpE, dnaK, dnaJ, prmA), groESL (groES, groL), and clpC (F1613_RS04215 (CtsR family transcription regulator), F1613_RS04220 (UvrB/UvrC motif-containing protein), F1613_RS04225 (protein arginine kinase), F1613_RS04230 (ATP-dependent Clp protease ATP-binding subunit clpC)) operons, encoding the major cell chaperones and proteases, were upregulated ~8–15, ~10–11, and ~ 42–53 absolute fold, respectively (Supplementary Table S1). Other known heat-shock genes including clpB, clpP, the Hsp33 family molecular chaperone hslO, and MecA, an adaptor protein necessary for ClpC chaperone activity (Schlothauer et al., 2003) were upregulated by 71-, 8.9-, 4.14-, and 3.84-fold, respectively (Supplementary Table S1). Among the most upregulated genes (~22-61-fold) were members of the lac operon (lacA, lacB, F1613_RS11920 (tagatose-6-phosphate kinase), lacD, F1613_RS11910 (PTS lactose/cellobiose transporter subunit IIA), F1613_RS11905 (lactose-specific PTS transporter subunit EIIC), lacG), vraX, F1613_RS03870 (ArgE/DapE family deacylase), cytochrome ubiquinol oxidase subunits I and II (F1613_RS06745 and F1613_RS06750), F1613_RS01555 (MarR family transcription regulator), F1613_RS12445 (hypothetical protein), F1613_RS01550 (NAD(P)/FAD-dependent oxidoreductase), and F1613_RS03780 (MFS transporter) (Supplementary Table S1).
We observed other upregulated genes of potential interest. For example, BlaZ, blaI, and blaR1, components of the bla operon that encode for a β-lactamase (Llarrull et al., 2010) were upregulated ~4.8–18.3-fold. Members of the urease operon (F1613_RS12320, ureE, F1613_RS12330) along with two competence protein ComK orthologs (F1613_RS10000 and F1613_RS06475) displayed increased transcript levels, consistent with previous observations of genes induced by heat shock in S. aureus (Anderson et al., 2006; Fleury et al., 2009). Twenty-three hypothetical proteins and 24 uncharacterized genes (47 total) were also upregulated under heat-shock conditions.
Among the most downregulated genes (~10-21-fold) were F1613_RS05940 and dltABCD, components of the dlt operon required for the d-alanylation of teichoic acids in Gram-positive bacterial cell walls (Kovacs et al., 2006; Supplementary Table S2). Several genes encoding ribosomal proteins (rplJ, rplL, rplT, rpmI, rpsF, rpsO, rpsR) and tRNA-ligases (ileS, thrS, serS) were also downregulated (~2.9–8.3-fold) (Supplementary Table S2), consistent with the transient inhibition of protein synthesis that occurs in response to heat shock in other organisms (Duncan and Hershey, 1989). Components of the psmβ operon (F1613_RS07060, F1613_RS07065, F1613_RS07070, F1613_RS07075) that encode for β-class phenol-soluble modulins (PSMs) (Wang et al., 2011; Cheung et al., 2014), and the PSM transporter system (pmtA, pmtB, and pmtC) (Chatterjee et al., 2013) were downregulated ~3-5-fold. In total, 24 genes involved in transport were downregulated up to ~11-fold (Supplementary Table S2), with more than half of them belonging to the ATP-binding cassette (ABC) transporter superfamily. Two cold-shock genes (cspA and F1613_RS05710) displayed decreased transcript levels, consistent with previous observations of genes repressed by heat shock in S. aureus (Fleury et al., 2009). Two helix-turn-helix transcription regulators (F1613_RS10440 and F1613_RS09035) were downregulated ~8.5 and ~ 3.5-fold, respectively (Supplementary Table S2). We also observed downregulation of other transcription regulators including rsp., F1613_RS11065 (GntR family transcription regulator), and pyrR by 5.5-, 4.6-, and 4.1-fold, respectively (Supplementary Table S2). Sixteen hypothetical proteins and 23 uncharacterized genes (39 total) were also downregulated under heat-shock conditions.
Functional classification of differentially expressed genes in S. epidermidis under heat stress
The genome of S. epidermidis ATCC 12228 contains 2,354 protein-coding genes, of which 207 are hypothetical and 71 are uncharacterized (278 total or ~ 12% of all genes), indicating their biological functions are unknown or not yet established. We manually grouped 280 of 366 heat shock DEGs (~77%) into functional groups using GO and KEGG databases (Figure 2B); 23% of heat shock DEGs had no assigned functions. We observed known functional classes that are upregulated under heat-shock conditions in all domains of life (Richter et al., 2010), namely Metabolism, Transport, Regulation, DNA/RNA Repair, Molecular Chaperones, Protein Degradation, and Detoxification (Figure 2B). A significant proportion (85; ~36%) of upregulated genes were involved in metabolism, including sugar, amino acid, and fatty acid metabolism (Supplementary Table S1; Supplementary Figure S2). We also observed increased expression of genes in the Virulence Factors, Secretion, and Stress Response functional classes (Figure 2B). Ribosome/Translation, tRNA Biosynthesis, and Ribosome Biogenesis functional classes accounted for a significant proportion (22; ~17%) of downregulated genes (Figure 2B; Supplementary Table S2), consistent with a transient inhibition of protein synthesis. Genes involved in Transport, Metabolism, Cell Wall Structure, Regulation, DNA/RNA Repair, and Stress Response were also downregulated under heat-shock conditions (Figure 2B). We assigned DEGs grouped into minor functional classes that contained only a small number of genes to the “Others” category in each pie chart (Figure 2B). Fourteen upregulated genes and 10 downregulated genes were assigned to the “Others” category and their functions are detailed in Supplementary Tables S1, S2.
Transcription responses to glucose in S. epidermidis
Six-carbon sugars (hexoses) such as glucose are the preferred carbon and energy sources for many prokaryotes including S. epidermidis. Prior studies in staphylococcal species demonstrated that glucose utilization supports faster growth and higher metabolic rates (Halsey et al., 2017). The presence of glucose also inhibits the expression of genes required for uptake and utilization of alternative carbon sources, an adaptive regulatory mechanism called carbon catabolite repression (CCR) (Görke and Stülke, 2008). We performed RNA sequencing on cultures exposed to 20-min glucose spikes across a range of concentrations and to persistent glucose to better understand the ability of S. epidermidis to adapt and respond to glucose. Our underlying goal was to support development of commensal microbes bioengineered to diagnose, monitor, or treat diabetes.
Identifying genes that might be useful starting points for controlling bioengineered bacteria in treating diabetes
Normal fasting human blood glucose levels range from 3.9 mM (70 mg/dL) to 5.6 mM (100 mg/dL). Hypoglycemic and hyperglycemic blood glucose levels are defined as below 3.9 mM (70 mg/dL) or above 10 mM (180 mg/dL), respectively (Riley, 2023). We thus challenged mid-exponential phase cells by subjecting them to 2, 5, 10, 17, or 50 mM glucose spikes for 20 min (Figure 1B).
We used RNA sequencing to analyze gene expression profiles and compared the resulting expression profiles of glucose-challenged cells to those of unchallenged cells (Figure 3A). DEGs of significance were identified using the following criteria: |log2 fold change| (i.e., log2FC) ≥ 1.5 and adjusted p-value ≤0.05 (Supplementary Tables S3–S7). We examined rlog transformed counts data from the medically relevant (G2–G17) glucose concentrations, searching for candidate transcripts that might be potential starting points for glucose-responsive switches. We found 38 potential switches by modeling all genes with absolute log2 fold change values ≥2 in at least one medically relevant glucose challenge experimental condition (Supplementary Figure S3).
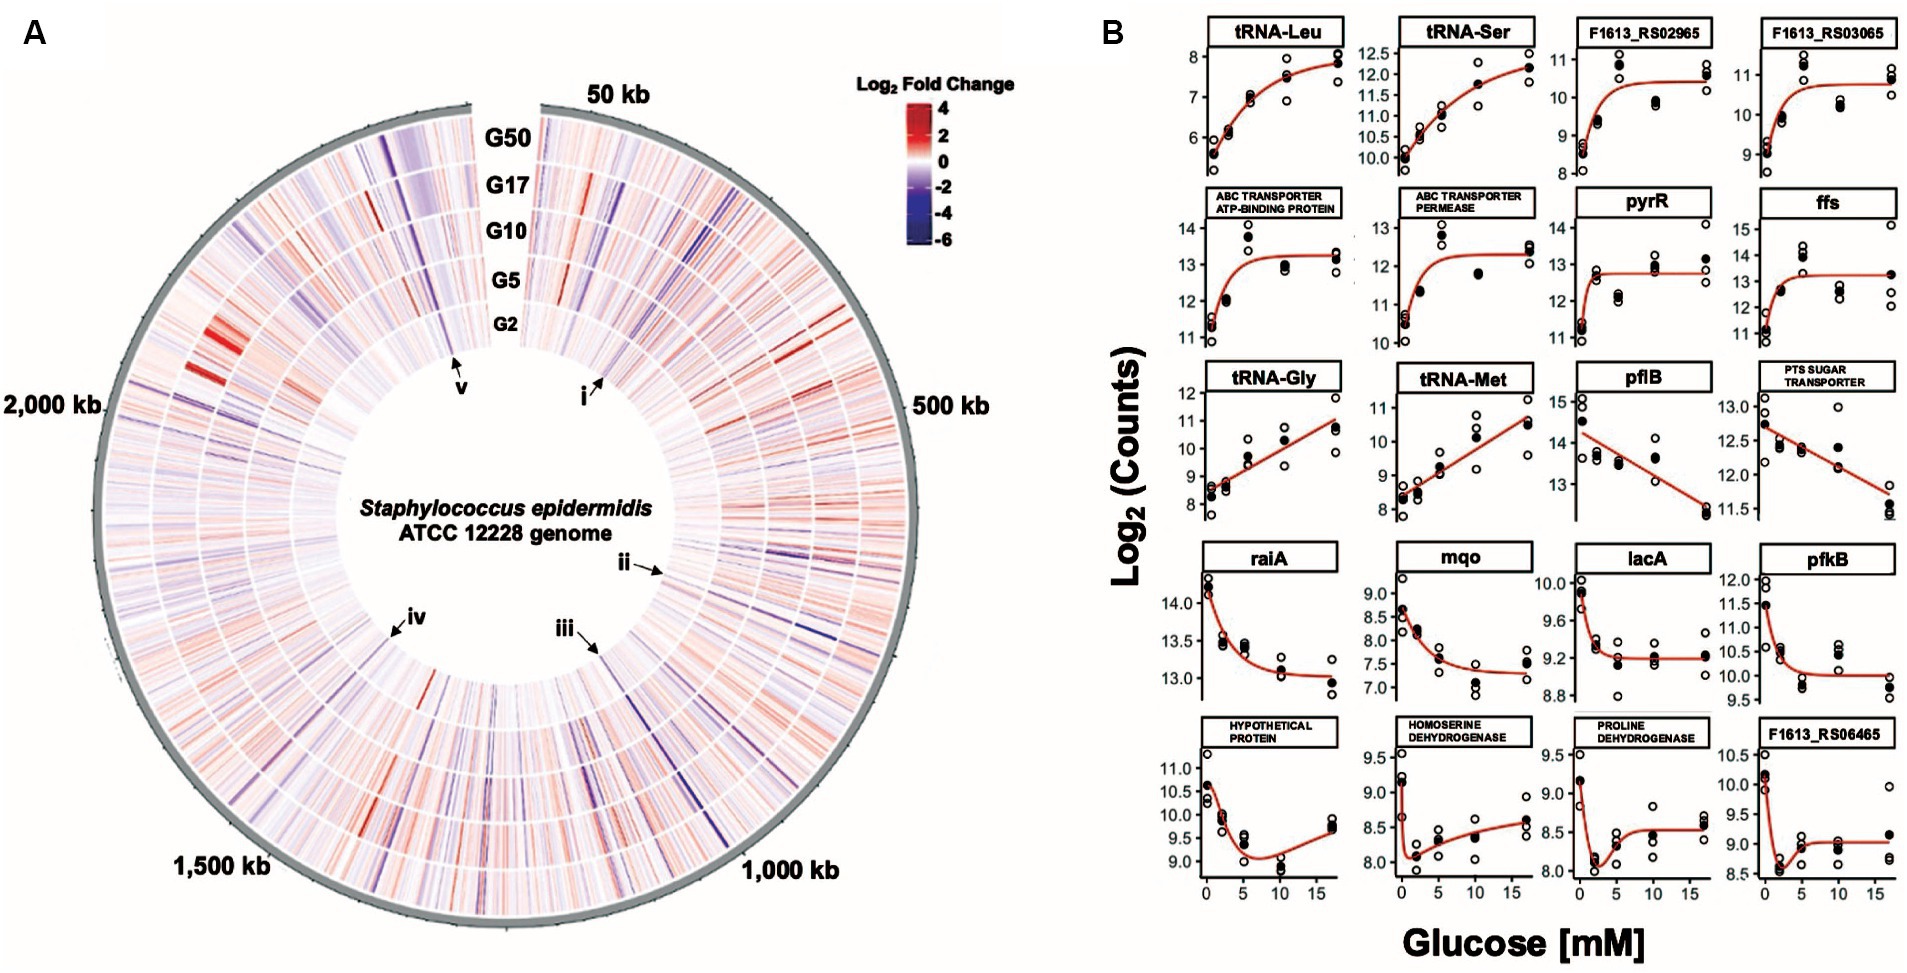
Figure 3. Eighty-five S. epidermidis genes change expression levels in response to glucose. (A) Circular transcriptome map showing normalized gene expression levels in the S. epidermidis genome in response to glucose. Log2 fold change relative to control for cells exposed to 2 mM (G2), 5 mM (G5), 10 mM (G10), 17 mM (G17), or 50 mM (G50) glucose spikes. Each bar denotes a single gene; red bars represent significantly upregulated genes and blue bars represent significantly downregulated genes. Roman numerals i (sdaAB, rbsU), ii (pflB), iii (glpR-pfkB operon), iv (F1613_RS07845 (homoserine dehydrogenase), and v (members of the lac operon) correspond to select groups of genes that are downregulated across all five glucose spike conditions. (B) Glucose concentration-response curves for a representative subset of genes that have potentially interesting glucose-responsive switch properties.
We identified twenty genes as representative starting points for potentially interesting glucose-responsive switches (Figure 3B). Among the potential genes that exhibited an OFF-to-ON transition were two DUF2871 domain-containing genes (F1613_RS03065 and F1613_RS02965), F1613_RS00340 (ABC transporter ATP-binding protein), F1613_RS00345 (ABC transporter permease), pyrR (bifunctional pyr operon transcriptional regulator), ffs (signal recognition particle sRNA), and four tRNA genes. We also identified genes likely subject to carbon catabolite repression (CCR) that might serve as potential ON-to-OFF switches, including F1613_RS01060 (PTS sugar transporter subunit IIC), lacA, pfkB, and F1613_RS09950 (proline dehydrogenase) (Görke and Stülke, 2008; Nuxoll et al., 2012). Other promising ON-to-OFF switch candidates include pflB (formate C-acetyltransferase), raiA (ribosome-associated translation inhibitor), mqo (malate dehydrogenase (quinone)), F1613_RS05750 (hypothetical protein), F1613_RS07845 (homoserine dehydrogenase), and F1613_RS06465 (IDEAL domain-containing protein) (Figure 3B). We also examined counts data from the medically relevant (G2–G17) glucose concentrations and identified a class of genes whose expression did not change in response to a glucose spike compared to an unchallenged (0 mM) control. These glucose-independent genes included lqo (L-lactate dehydrogenase (quinone)), F1613_RS08490 (transglycosylase domain-containing protein), typA (translational GTPase TypA), rnr (ribonuclease R), and noc (nucleoid occlusion protein).
Genes repressed in response to 20-min glucose spikes
We observed 18 genes that were downregulated across all five glucose spike conditions and an additional 10 genes that were downregulated across the top four glucose spike conditions (Figure 4B; Supplementary Figure S4). For example, genes involved in lactose metabolism (F1613_RS11920 (tagatose-6-phosphate kinase), lacB, and lacA), ribose transport (rbsU, rbsD), fructose utilization (F1613_RS05160 (PTS fructose transporter subunit IIABC), pfkB, and F1613_RS05150 (DeoR/GlpR family DNA-binding transcription regulator)), proline catabolism (F1613_RS09950 (proline dehydrogenase)), the glyoxalase pathway (F1613_RS05685 (glyoxalase)), the succinate dehydrogenase complex (F1613_RS07025 (succinate dehydrogenase cytochrome b558 subunit)), and ethanol degradation (adhP) were downregulated, consistent with previous observations of gene expression changes that occur during CCR (Penninckx et al., 1983; Nam, 2005; Arndt and Eikmanns, 2007; Gutierrez-Ríos et al., 2007; Görke and Stülke, 2008; Nuxoll et al., 2012; Halsey et al., 2017; Supplementary Tables S3–S7). We also observed decreased expression of sdaAB (L-serine ammonia-lyase iron–sulfur-dependent subunit beta), raiA, F1613_RS03360 (universal stress protein), F1613_RS00870 (GntR family transcription regulator), F1613_RS06465 (IDEAL domain-containing protein), F1613_RS10135 (AAA family ATPase), F1613_RS07845 (homoserine dehydrogenase), F1613_RS10140 (DUF4238 domain-containing protein), F1613_RS06500 (fatty acid desaturase), and genes involved in formate metabolism (pflA and pflB) across at least four glucose spike conditions. Four hypothetical proteins and one uncharacterized gene (five total) were also downregulated across at least four glucose spike conditions (Supplementary Tables S3–S7).
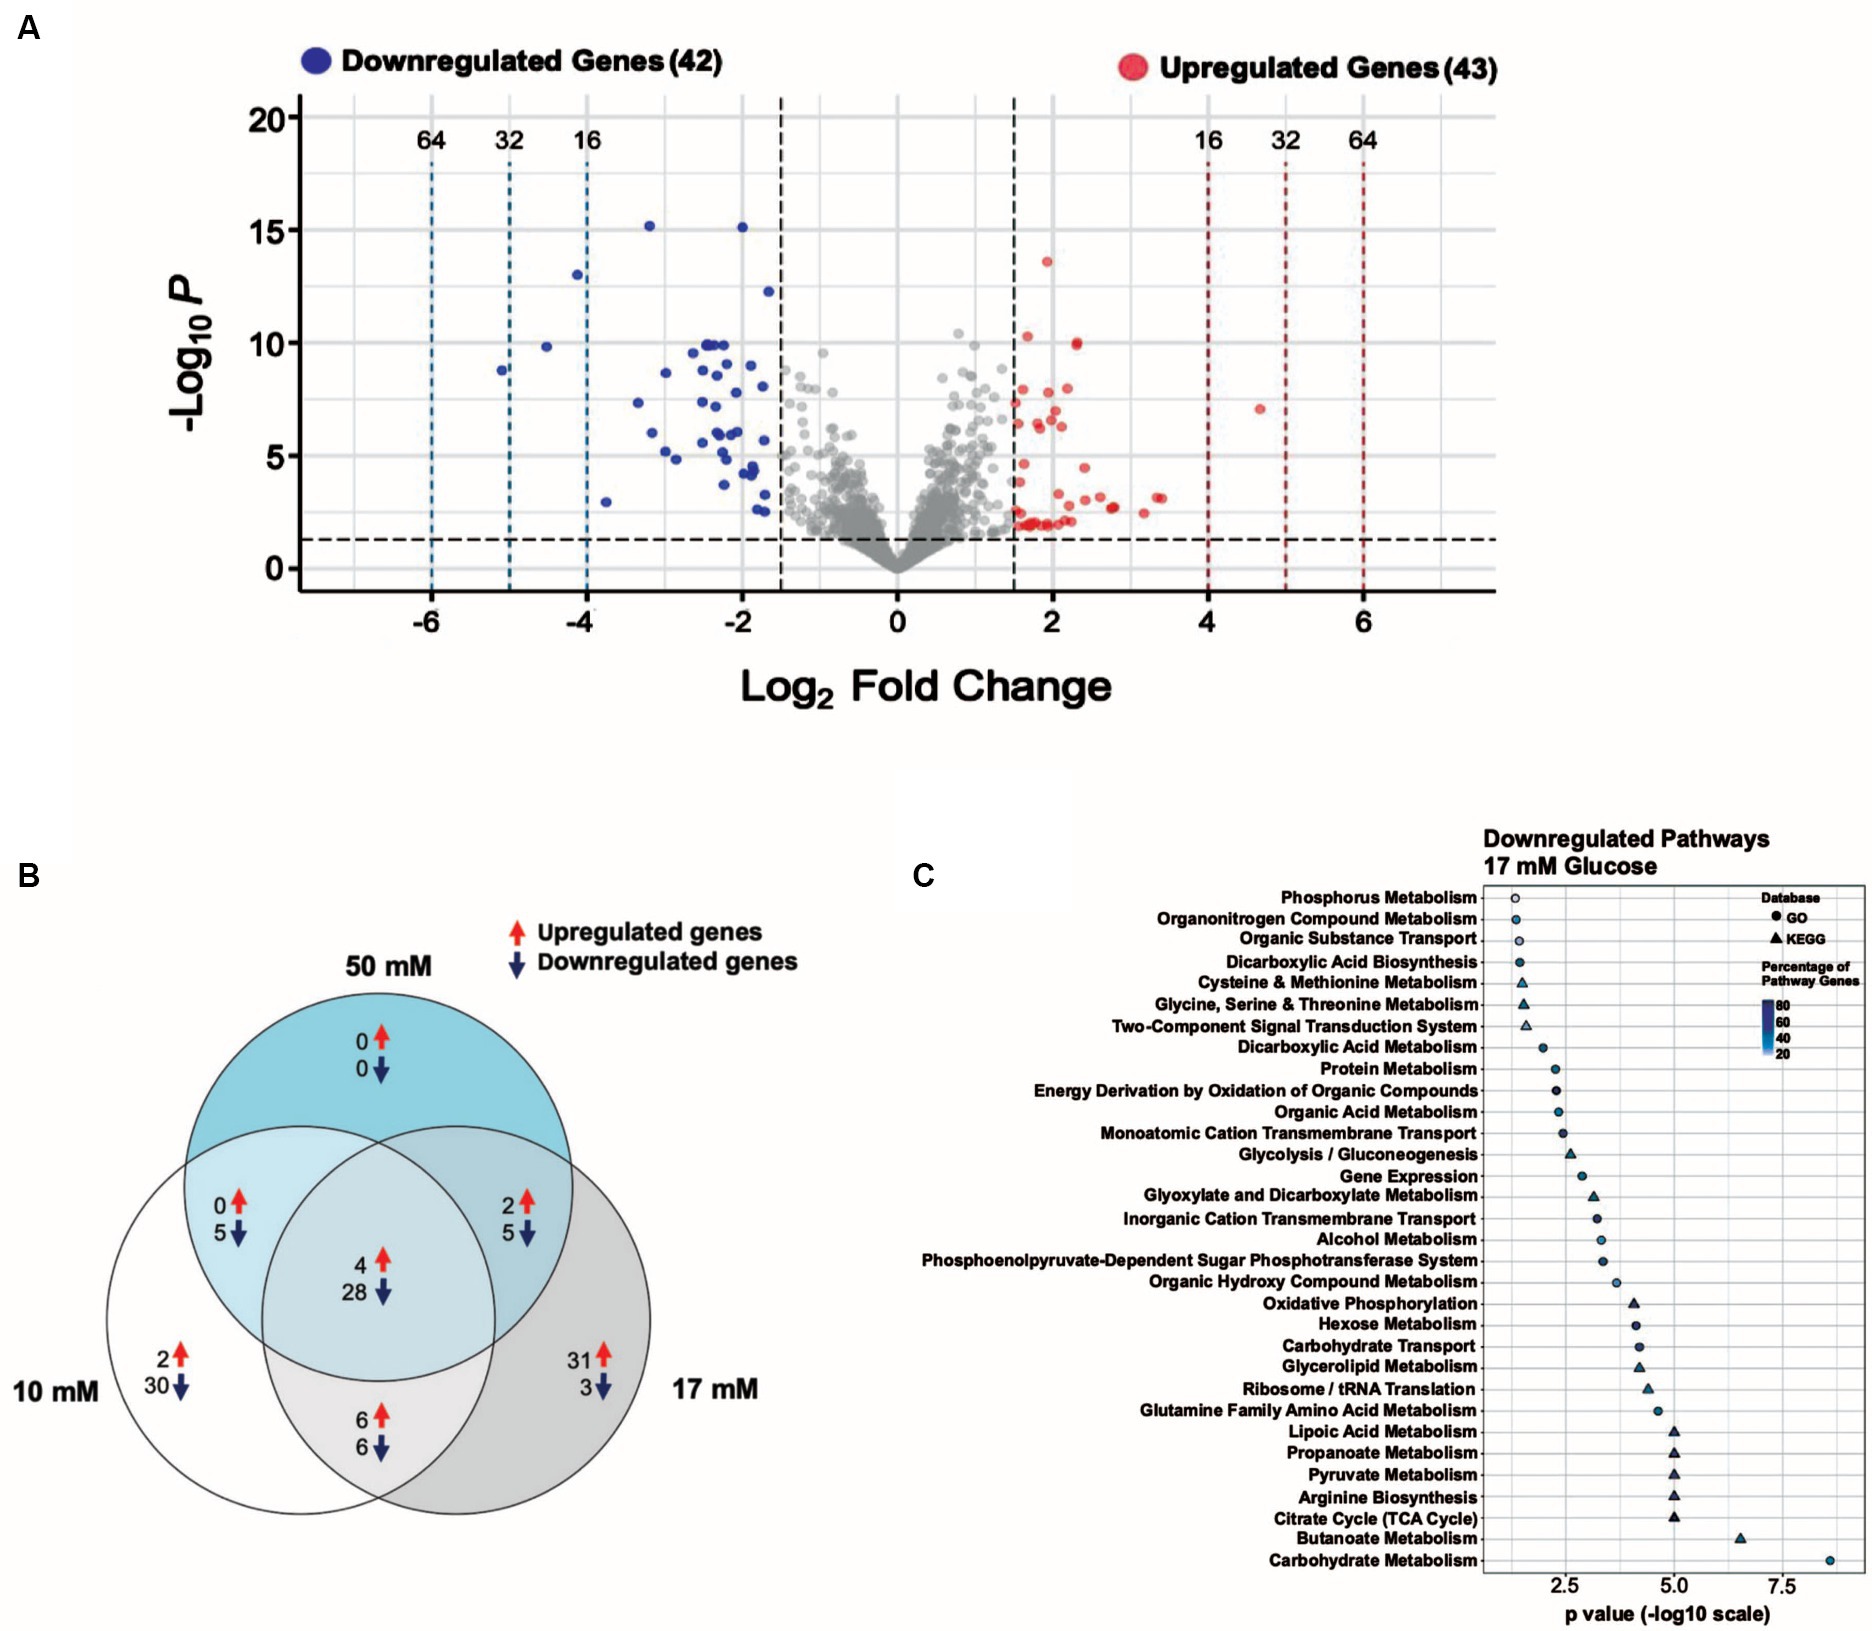
Figure 4. A 17 mM glucose spike causes transcript levels to change up to ~ 34-fold. (A) Volcano plot showing the differentially expressed genes (DEGs) for the 17 mM glucose spike experimental condition with |log2 FC| ≥ 1.5 and adjusted p ≤ 0.05 as the threshold. The red dots represent 43 significantly upregulated genes, and the blue dots represent 42 significantly downregulated genes. (B) Venn diagram illustrating the number of unique and shared DEGs from the 10, 17, and 50 mM glucose spike experimental conditions. (C) Summary of the significantly downregulated genes for the 17 mM glucose spike experimental condition assigned to functional classes according to GO and KEGG pathways.
S. epidermidis transcription response to a 20-min 17 mM glucose spike
We identified 85 of 2,354 genes (~4% of the genome) that change in response to a 17 mM glucose spike with log2FC values ≥1.5, among which 43 were upregulated and 42 were downregulated (Supplementary Table S6). Downregulated and upregulated genes were expressed over a − 5 to +5 log2FC range (Figure 4A). While gene expression changes are similar across all glucose levels, we observed a more robust change (i.e., −5 to +5 log2FC), a higher number of upregulated genes, and a higher total number of DEGs in the 17 mM glucose condition (Supplementary Tables S3–S5, S7).
Among the most downregulated genes (~6 to 34-fold) in the 17 mM glucose spike condition were pflB and members of the glpR-pfkB operon, which plays an essential role in the utilization of fructose, (F1613_RS05150 (DeoR/GlpR family DNA-binding transcription regulator), pfkB, and F1613_RS05160 (PTS fructose transporter subunit IIABC)) (Ge et al., 2024; Supplementary Table S6). We found that L-serine ammonia-lyase iron–sulfur-dependent subunits alpha and beta (sdaAA and sdaAB), raiA, F1613_RS01060 (PTS sugar transporter subunit IIC), and F1613_RS00520 (nitrate reductase subunit alpha) were also downregulated (~6 to 10-fold) (Supplementary Table S6). Six hypothetical proteins and one uncharacterized gene (seven total) were downregulated in the 17 mM glucose spike condition. tRNA genes accounted for almost 60% (24 of 43) of the upregulated genes in the 17 mM glucose spike condition, consistent with increased protein synthesis and faster growth rates in the presence of glucose (Halsey et al., 2017). F1613_RS07200 (solute carrier family 23 protein) and ffs were among the most upregulated genes (~7 to 11-fold) in the 17 mM glucose spike condition. Two hypothetical proteins and three uncharacterized genes (five total) were also upregulated.
Functional classification of downregulated genes in S. epidermidis in response to a 17 mM glucose spike
To further understand the functions of significantly downregulated genes we used the data from the 17 mM glucose spike condition to assign functional pathways against the GO and KEGG databases. We ordered pathways based on increasing significance level (p-value) (Figure 4C). Functional pathways with decreased expression include Carbohydrate Metabolism, Butanoate Metabolism, TCA Cycle, Propanoate Metabolism, Lipoic Acid Metabolism, Carbohydrate Transport, Hexose Metabolism, Oxidative Phosphorylation, Phosphoenolpyruvate-Dependent Sugar Phosphotransferase system (PTS), and Amino Acid Metabolism (Figure 4C; Supplementary Table S6). We observed several downregulated pathways likely consistent with carbon catabolite repression (CCR) (Görke and Stülke, 2008).
S. epidermidis transcription response to persistent glucose via batch culture
To identify differentially expressed genes in S. epidermidis exposed to persistent glucose via batch culture, we grew cells overnight in medium containing 0.2% w/v or 1% w/v glucose. We used RNA sequencing to analyze gene expression profiles and compared the expression profiles of cells exposed to 1% w/v glucose against cells exposed to 0.2% w/v glucose. DEGs of significance were defined using the following criteria: |log2 fold change| (i.e., log2FC) ≥ 1.5 and adjusted p value <0.05. By these criteria, we identified 195 of 2,354 genes (~8% of the genome) with log2FC values ≥1.5, among which 133 were upregulated and 62 were downregulated (Supplementary Table S8). We observed more upregulated genes, a higher total number DEGs, and unique gene expression changes in the persistent glucose via batch culture experimental condition compared to the 20-min glucose spike experimental condition (Supplementary Tables S3–S8).
Among the most upregulated genes (~13 to 30-fold) in the persistent glucose condition were members of the nrdDG operon (nrdD and nrdG), which encodes for an oxygen-independent ribonucleotide reductase (Masalha et al., 2001), and the dha operon (F1613_RS03960 (glycerol dehydrogenase), dhaK, dhaL, dhaM), which encodes for components of the glycerol dehydrogenase- and PTS-dependent dihydroxyacetone kinase system (Monniot et al., 2012; Supplementary Table S8). Genes involved in nitrate/nitrite reduction (narGHJI, nirBD, nreABC, and F1613_RS00485 (NarK/NasA family nitrate transporter)) were also upregulated (~4.8 to 11.9-fold) (Kamps et al., 2004; Supplementary Table S8). Sixteen genes involved in glycolysis, gluconeogenesis, and the TCA cycle including the glycolytic gapA operon (gap, F1613_RS05590 (phosphoglycerate kinase), tpiA, gpmI, and eno), the alsS/budA operon, F1613_RS00620 (2,3-diphosphoglycerate-dependent phosphoglycerate mutase), F1613_RS01410 (fructose bisphosphate aldolase), fdaB, F1613_RS01355 (L-lactate dehydrogenase), sdaAA, pyk, ilvB, F1613_RS06110 (glucose-6-phosphate isomerase) and sdhB were slightly upregulated (~3 to 8-fold) in the persistent glucose condition, consistent with previous observations of glucose-responsive genes in S. aureus (Seidl et al., 2009). Seven hypothetical proteins were also upregulated (Supplementary Table S8).
We observed downregulation (up to ~7-fold) of the energy-coupling factor (ECF) transporter module components (F1613_RS11970 (energy-coupling factor transporter ATPase), F1613_RS11965 (energy-coupling factor transporter ATPase), F1613_RS11960 (energy-coupling factor transporter transmembrane protein EcfT)) (Slotboom, 2013), F1613_RS03610 (isoprenylcysteine carboxyl methyltransferase family protein), and ugpC (Supplementary Table S8). F1613_RS05940, dltC, and dltD, components of the dlt operon required for the d-alanylation of teichoic acids in Gram-positive bacterial cell walls (Kovacs et al., 2006), were also downregulated (~3 to 4-fold). We observed downregulation of four transcription regulators including rsp., F1613_RS01465 (GbsR/MarR family transcription regulator), F1613_RS08735 (AraC family transcription regulator), and F1613_RS10440 (helix-turn-helix transcription regulator) by 3.3-, 3.5-, 3.7-, and 4.2-fold, respectively (Supplementary Table S8). Two hypothetical proteins were also downregulated in the persistent glucose condition (Supplementary Table S8).
S. epidermidis transcription response to a step down in glucose concentration from 10 to 2 mM
To identify differentially expressed genes in S. epidermidis exposed to a step down in glucose concentration, we challenged mid-exponential phase cells by subjecting them to a 10 mM glucose spike for 20 min immediately followed by a 2 mM glucose spike for 20 min (Figure 1B). We used RNA sequencing to analyze gene expression profiles and compared the expression profiles of cells exposed to a step down in glucose concentration against cells exposed to a 10 mM glucose spike only. DEGs of significance were defined using the following criteria: |log2 fold change| (i.e., log2FC) ≥ 1.5 and adjusted p ≤ 0.05. By these criteria, we identified 43 of 2,354 genes (~1.8% of the genome) with log2FC values ≥1.5, among which 10 were upregulated and 33 were downregulated (Supplementary Table S9; Supplementary Figure S5). Downregulated and upregulated genes were expressed over a − 6 to +3 log2FC range (Figure 5A).
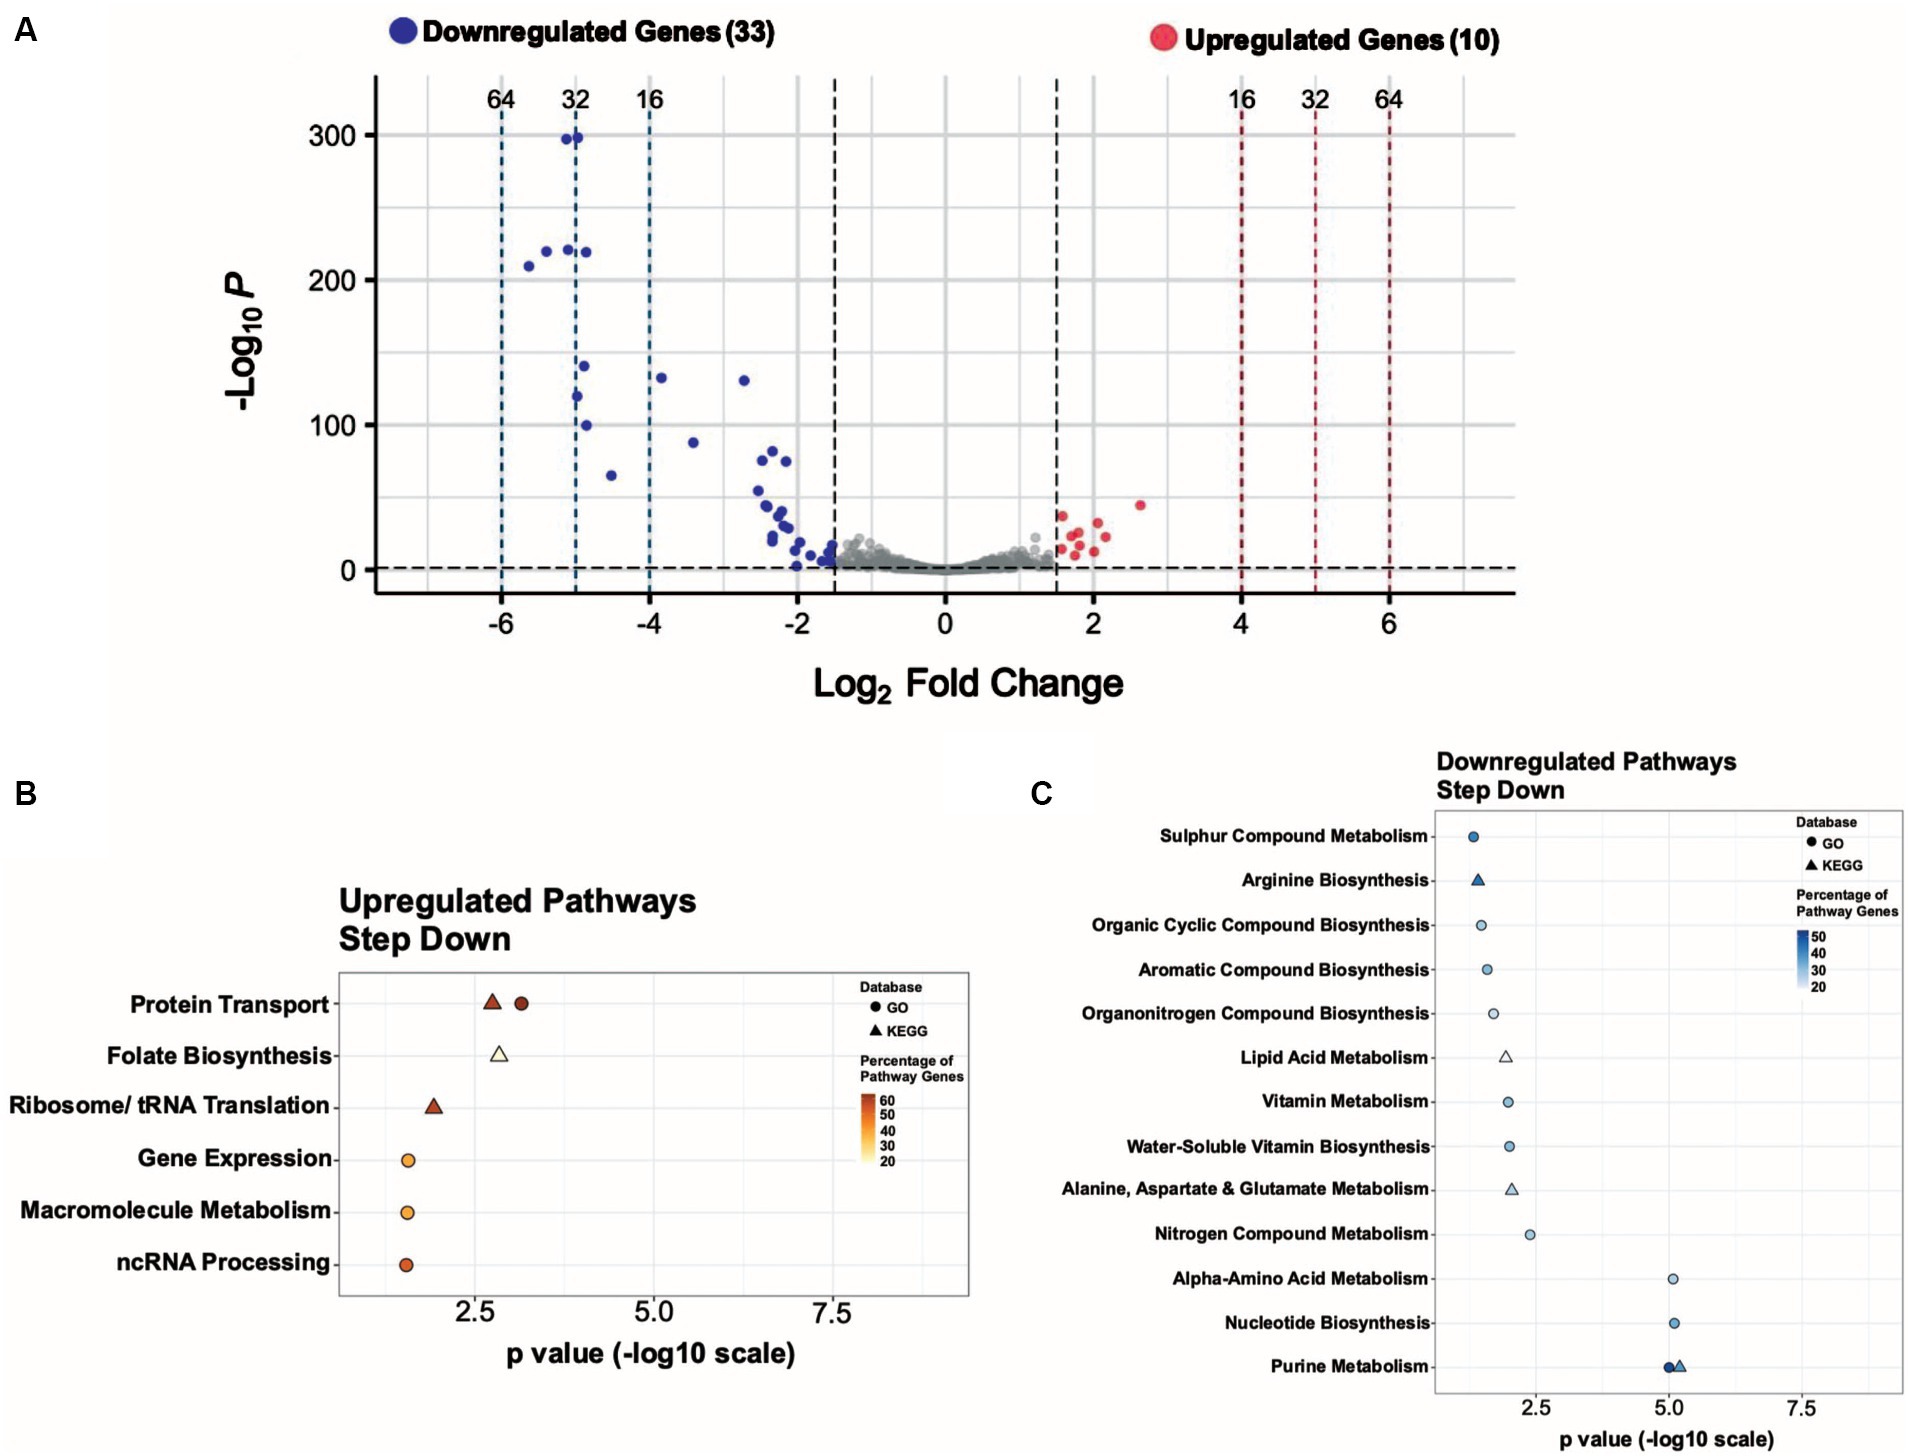
Figure 5. Genes involved in purine metabolism are significantly downregulated in response to a step down in glucose concentration from 10 to 2 mM. (A) Volcano plot showing the differentially expressed genes (DEGs) for the step-down experimental condition with |log2 FC| ≥ 1.5 and adjusted p value ≤ 0.05 as the threshold. The red dots represent 10 significantly upregulated genes, and the blue dots represent 33 significantly downregulated genes. Summary of the significantly upregulated (B) and downregulated (C) genes for the step-down experimental condition assigned to functional classes according to GO and KEGG pathways.
We observed upregulation (~3 to 6-fold) of F1613_RS03760 ((NAD(P)-binding domain-containing protein), betB, betA, F1613_RS03755 (nucleoside recognition domain-containing protein), rpsN, F1613_RS06020 (NAD(P)-binding domain-containing protein), F1613_RS00615 (putative metal homeostasis protein), F1613_RS02245 (putative sulfate exporter family transporter), F1613_RS03765 (zinc ABC transporter substrate-binding protein), and F1613_RS01245 (aminotransferase class I/II-fold pyridoxal phosphate-dependent enzyme) in the step-down experimental condition. Among the most downregulated genes (~5 to 50-fold) were members of the purine biosynthetic operon (purEKCSQLFMNHD), which encodes for 11 enzymes that convert phosphoribosyl pyrophosphate (PRPP) to inosine-5′-monophosphate (IMP) (Goncheva et al., 2019), purine biosynthesis-associated gene purB, and glycine cleavage system genes (gcvT, gcvPA, gcvPB). One hypothetical protein was also downregulated in the step-down experimental condition (Supplementary Table S9).
Functional classification of differentially expressed genes in S. epidermidis in response to a step down in glucose concentration from 10 to 2 mM
We used the data from the step-down experimental condition to assign functional pathways against the GO and KEGG databases. We ordered pathways based on increasing significance levels (p-value) (Figure 5C). Functional pathways with decreased expression include Purine Metabolism, Nucleotide Biosynthesis, Amino Acid Metabolism, Nitrogen Compound Metabolism, Vitamin Metabolism, Lipid Acid Metabolism, Organic Compound Biosynthesis, and Sulphur Compound Metabolism (Figure 5C; Supplementary Table S9). Among upregulated pathways Protein Transport scored the highest significance, according to both GO and KEGG pathway enrichment analysis, under the step-down experimental condition (Figure 5B).
We constructed a Venn diagram to understand the relationship between our step-down, 10 mM glucose spike (G10), and 2 mM glucose spike (G2) data sets (Supplementary Figure S5); we observed no shared DEGs in common among the step-down condition (from 10 to 2 mM glucose) and G10 (from 0 to 10 mM glucose). There were also no shared differentially expressed genes among the step-down (from 10 to 2 mM glucose) and G2 (from 0 to 2 mM glucose) experimental conditions either, indicating potentially unique gene expression changes as a function of increasing versus decreasing glucose concentrations (Supplementary Figure S5; Supplementary Tables S3, S9).
We sought to further understand if and how genes might be differentially expressed at an intermediate glucose concentration (2 mM glucose) as a function of whether cells had been previously exposed to a lower (0 mM) or higher (10 mM) glucose concentration. If prior glucose concentrations do not matter, we would expect no such differences. We performed scatter plot analysis of expression levels for all genes at 2 mM glucose as a function of prior glucose concentration (Figure 6). Most genes differentially expressed under a 0 to 2 mM glucose spike were similarly expressed under a 10–2 mM glucose step down (Figure 6 blue dots). Over 14 genes differentially expressed under a 10–2 mM glucose step down were not similarly expressed under a 0–2 mM glucose spike (Figure 6 red dots; Discussion). Further analysis indicated these genes are primarily involved in purine metabolism (above; Supplementary Table S9).
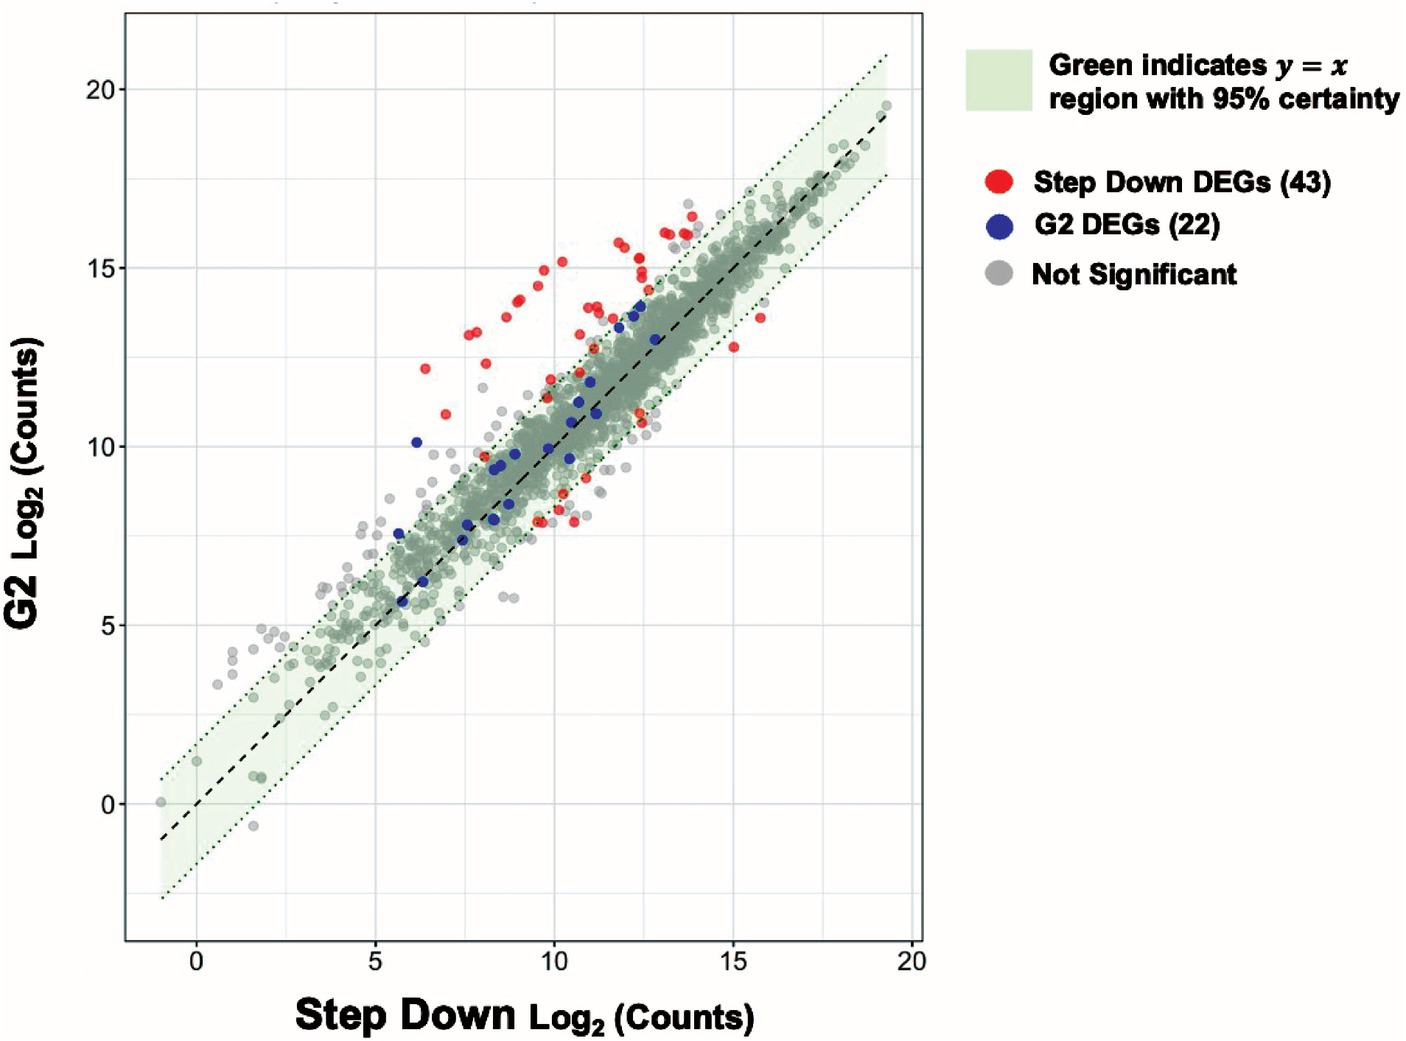
Figure 6. Expression levels of purine biosynthesis genes at intermediate glucose levels are sensitive to prior glucose levels. Scatter plot visualizing the relationship between the step-down and 2 mM glucose spike (G2) experimental conditions. Each dot denotes a single gene. The red and blue dots represent step-down, and G2 differentially expressed genes (DEGs) respectively. The gray dots represent genes with no significant change. A 95% confidence interval was calculated around the residuals of gene expression differences between the two experimental groups. Genes that fall within the green highlighted region are predicted to have near identical average expression levels with 95% certainty.
Discriminating between glucose and heat shock conditions
Differential gene expression analysis of and within the skin microbiome might be useful as a potential platform for clinical diagnosis. To explore this idea, we compared gene expression levels during heat shock to those observed during high (17 mM) glucose levels. Most (~93.6%) genes are similarly expressed (95% c.i.) under both conditions (Figure 7). However, 341 and 60 genes are differentially expressed under heat shock or high glucose, but not both conditions, respectively. Such genes may offer a starting point for developing nucleic acid amplification-based methods for determining the current or prior physical experience of microbes on patients.
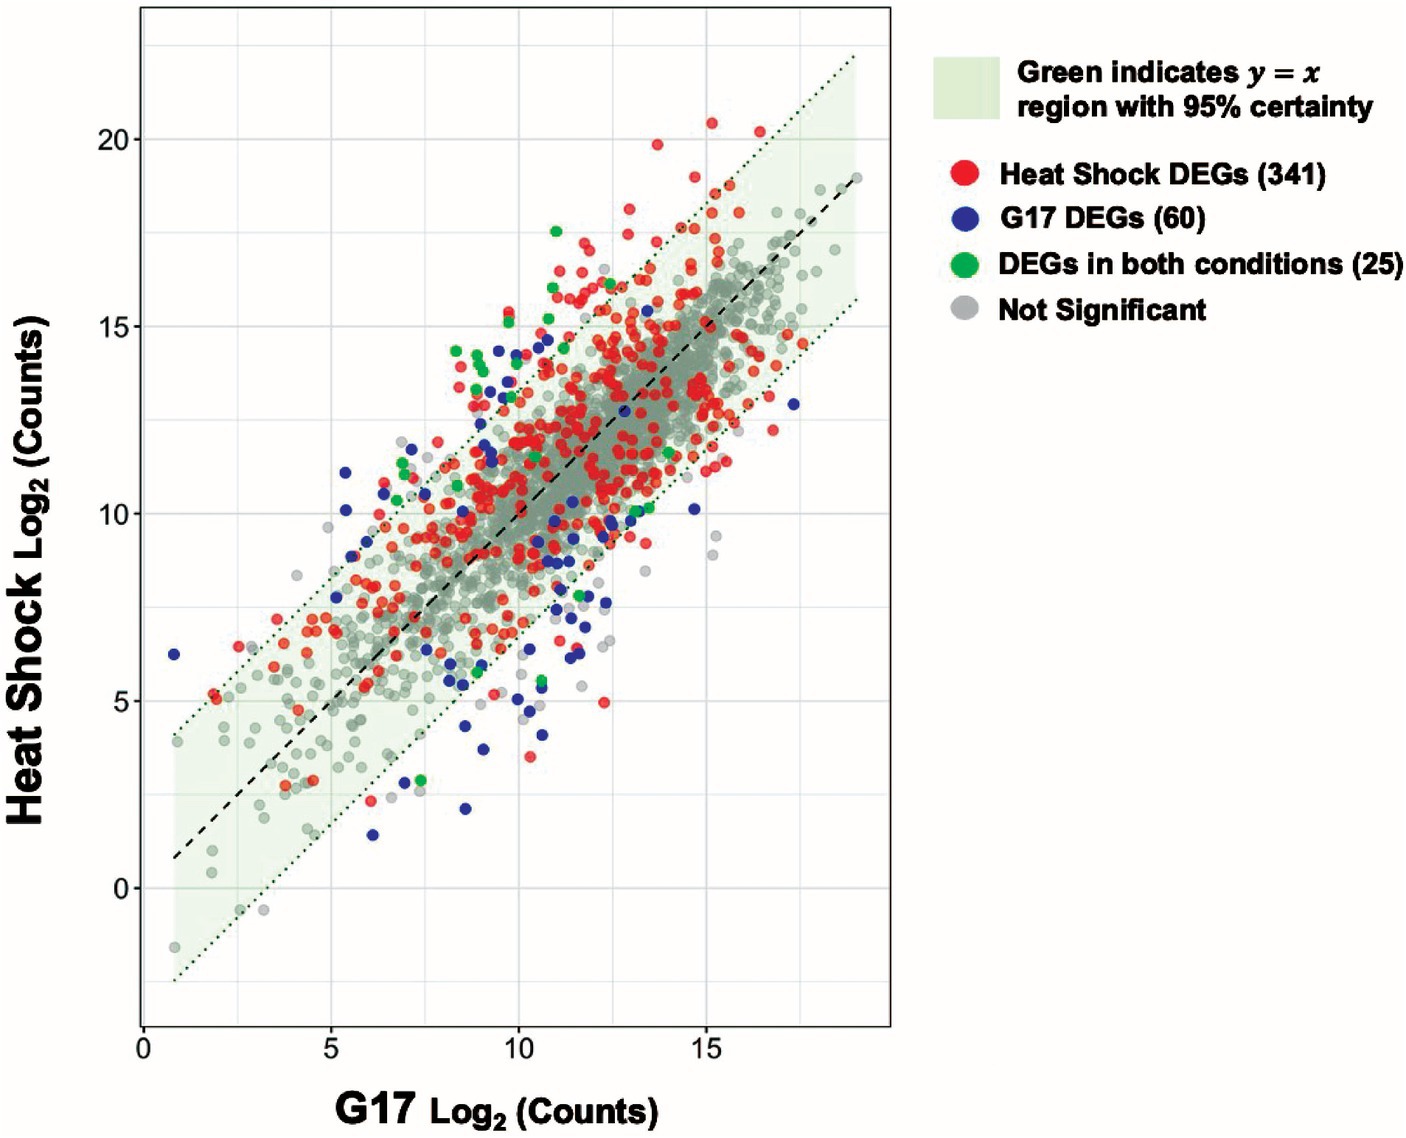
Figure 7. Heat shock and glucose spikes create statistically unique signatures. Scatter plot visualizing the relationship between the heat-shock and 17 mM glucose spike (G17) experimental conditions. Each dot denotes a single gene. The red and blue dots represent heat-shock, and G17 differentially expressed genes (DEGs) respectively. The green dots represent DEGs found in both conditions and the gray dots represent genes with no significant change. A 95% confidence interval was calculated around the residuals of gene expression differences between the two experimental groups. Genes that fall within the green highlighted region are predicted to have near identical average expression levels with 95% certainty.
Discussion
To support bioengineering of skin microbes to diagnose, monitor, or treat disease, we sought to understand how S. epidermidis responds to environmental perturbations including heat shock and changes in glucose levels. We used RNA sequencing to investigate differential gene expression followed by gene set enrichment analysis (GSEA) to understand the functions of differentially expressed genes. We observed an S. epidermidis heat-shock response that mostly resembles the heat-shock response of related staphylococcal species and other Gram-positive bacteria (below). We observed carbon catabolite repression in response to a range of glucose spikes, upregulation of genes involved in glycolysis, gluconeogenesis, and the TCA cycle in response to persistent glucose via batch culture, as well as a potentially unique gene expression signature in response to a step down in glucose concentration from 10 to 2 mM. Building on our analyses, we curated a subset of glucose-responsive genes that can serve as starting points for engineering endogenous dynamic control of circuits in S. epidermidis.
We observed contrasting patterns of gene expression depending on whether cells were exposed to a spike or persistent level of glucose. For example, we observed downregulation (up to ~34-fold) across all five glucose spike conditions for genes involved in lactose metabolism, ribose transport, fructose utilization, proline catabolism, the glyoxalase pathway, the succinate dehydrogenase complex, and ethanol degradation (Supplementary Tables S3–S7). We believe this repression of genes involved in secondary carbon source utilization is evidence of carbon catabolite repression (CCR) in our glucose spike data (Görke and Stülke, 2008); yet we found no evidence of CCR in our persistent glucose via batch culture data (Supplementary Table S8). As a second example, while we observed the induction (~3–8-fold) of several essential glycolytic genes, the dha operon, gluconeogenesis genes, and TCA cycle genes in our persistent glucose via batch culture samples (Supplementary Table S8), we did not observe such gene expression patterns among the upregulated genes in our glucose spike data. Instead, tRNA genes accounted for most of the upregulated genes in our glucose spike data (Supplementary Tables S3–S8).
One explanation for differences in gene expression response between spike and persistent glucose levels could be that S. epidermidis first adapts to glucose exposure by preferentially downregulating genes involved in secondary carbon source utilization to avoid the production of proteins that are not useful in the presence of glucose; only following sufficiently prolonged exposure to glucose does S. epidermidis adjust its transcriptome to upregulate genes involved in glucose utilization. We note that Seidl et al. found in S. aureus that a 30-min exposure to 10 mM glucose was sufficient to realize gene expression changes like our prolonged exposure conditions, suggesting that between 20 and 30 min could be sufficient to fully transition to a persistent glucose transcriptome in S. epidermidis (Seidl et al., 2009). We chose to measure the response of S. epidermidis to changing glucose levels at 37°C. Normal human skin temperatures can vary from 33 to 37°C (Bierman, 1936). Depending on the desired location for deploying a future bioengineered skin microbe it may be important to reconfirm changes in gene expression levels in response to glucose at the exact local skin temperature.
Under heat shock conditions we found patterns of gene expression like other Staphylococcus species. For example, at 45°C, we observed upregulation of F1613_RS04215 (CtsR family transcription regulator) and hrcA (Supplementary Table S1), known heat-shock gene expression regulators in S. aureus, B. subtilis, and other firmicutes (Derre et al., 1999; Chastanet et al., 2003; Schumann, 2003). We also observed rapid induction of clpB, clpP, and the dnaK, groESL, and clpC operons (Supplementary Table S1). Our data also provides evidence of an S. epidermidis heat-shock regulatory network that utilizes both the hrcA- and ctsR-encoded repressors. For example, we carried out DNA motif analysis and found CtsR (GGTCAAA/T) and CIRCE (controlling inverted repeat of chaperone expression) operator sequences arranged in tandem upstream of the dnaK and groESL operons consistent with previous observations of dual heat-shock regulation by HrcA and CtsR in S. aureus and S. epidermidis (Derre et al., 1999; Chastanet et al., 2003; Supplementary Figure S6). We also found CtsR recognition sequences upstream of clpB, clpP, and the clpC operon also consistent with previous observations of CtsR regulons in B. subtilis and Streptococcus pneumoniae (Derre et al., 1999; Chastanet et al., 2001; Supplementary Figure S6).
While we observed upregulation of universal stress proteins (F1613_RS09680 and F1613_RS09700) in response to a heat shock, we did not detect upregulation of the general stress-responsive alternative sigma factor sigB, which is a component of the heat-shock regulon in S. aureus, B. subtilis, and Listeria monocytogenes (Kullik and Giachino, 1997; Ferreira et al., 2001; Schumann, 2003). By contrast, we did observe upregulation (~5-fold) of F1613_RS09995, another sigma-70 family RNA polymerase sigma factor (Supplementary Table S1). This difference suggests that the S. epidermidis heat-shock regulatory network may differ slightly from that of S. aureus and other Gram-positive bacteria.
We compared the genome-wide S. epidermidis heat-shock response to the 17 mM glucose spike (G17) and step-down responses (Figure 8). We observed a more robust increase in gene expression in response to heat shock (i.e., −4 to +6 log2FC range) compared to G17 (i.e., −5 to +5 log2FC) and step down (i.e., −6 to +3 log2FC range) and detected more differentially expressed genes in the heat-shock condition (366 genes) compared to G17 (85 genes) and step-down conditions (43 genes) (Figures 2A, 4A, 5A). In response to acute heat stress and subsequent loss of protein homeostasis (e.g., due to heat-induced protein denaturation, misfolding, and aggregation), we observed a rapid and global reprogramming of gene expression, unlike the transcription changes observed when S. epidermidis adapts to a preferred carbon source (e.g., glucose) at non-toxic concentrations (Figures 3A, 8). We believe these disparate gene expression profiles could be of limited clinical utility; more specifically, DEGs unique to heat shock (341 genes) or high glucose (60 genes) may be a promising starting point for the development of simple nucleic acid-based tools for the diagnosis and monitoring of disease (Figure 7).
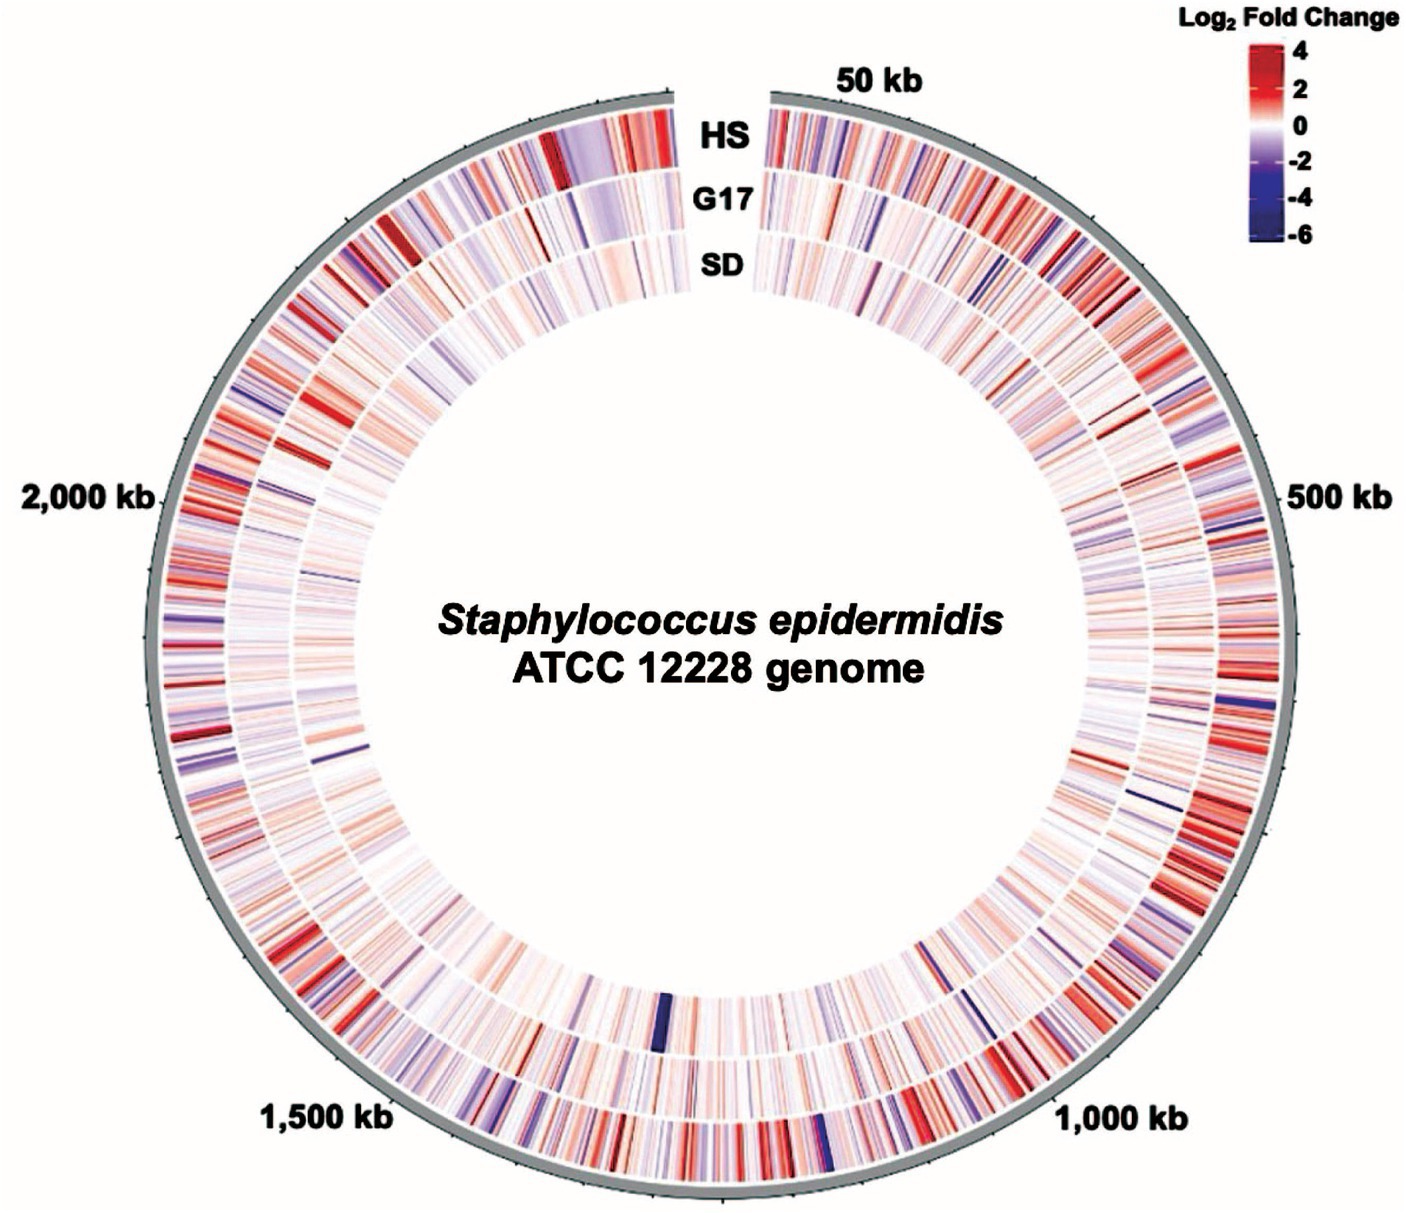
Figure 8. The genome-wide transcription response of S. epidermidis to perturbations. Circular transcriptome map showing normalized gene expression levels in the S. epidermidis genome. Log2-fold change relative to control for cells exposed to Heat Shock (HS), a 17 mM glucose spike (G17), or Step Down (SD) experimental conditions. Each bar denotes a single gene. The red bars represent significantly upregulated genes, and the blue bars represent significantly downregulated genes.
We observed downregulation (up to ~50-fold) of genes involved in purine biosynthesis (purEKCSQLFMNHD) in response to a step down in glucose concentration from 10 to 2 mM (Supplementary Table S9). We did not observe such downregulation in the G2 (from 0 to 2 mM glucose) or G10 (from 0 to 10 mM glucose) glucose spike conditions (Supplementary Tables S3, S5). Further, we found no DEGs in common among the step-down and G10 conditions and the step-down and G2 conditions (Supplementary Figure S5). Taken together we wondered if there is a unique step-down gene expression signature that does not resemble that of G2 or G10. We performed scatter plot analysis to visualize the relationship between the step-down and G2 conditions (Figure 6). We noticed that, while most genes are similarly expressed under both conditions, over 14 genes differentially expressed under step-down conditions were not similarly expressed under G2 conditions (Figure 6, red dots). Further analysis revealed that these genes were mainly involved in purine biosynthesis. We note that our step-down samples underwent two rounds of centrifugation while our G10 samples underwent a single round of centrifugation prior to RNA harvesting (Methods); this methodological difference may account for the unique step-down gene expression signature observed here.
Finally, we sought to identify glucose-responsive promoters that might eventually be used to control the expression of an insulin gene in a bioengineered S. epidermidis strain developed to aid in treating diabetes. To this end, we constructed glucose concentration-response curves across medically relevant (2–17 mM) glucose level; blood glucose levels above 10 mM are hyperglycemic and would warrant insulin expression. We identified 38 glucose-responsive genes that might serve as ON or OFF switches for controlling synthetic genetic systems (Supplementary Figure S3; Figure 3B). Most (~70%) of the potential switches that exhibited an OFF-to-ON transition were tRNA genes (Supplementary Figure S3). We suspect these switches are not specific to glucose given that increased tRNA expression might also occur in response to various other carbon sources (Dong et al., 1996). We also observed 19 potential ON-to-OFF switches (Supplementary Figure S3). Each glucose-responsive gene reported here is a starting point requiring additional characterization (e.g., response specificity) to identify those most appropriate for any given application.
For example, using a bioengineered skin microbe to help treat type 2 diabetes would require each bacterial cell to make between 0.03 and 300 molecules of insulin per second, presuming a bacterial density of 2 × 10¹³ to 2 × 10⁹ bacteria per square centimeter of skin (Benjamin, 2024). An essential aspect of bioengineering S. epidermidis strains to treat diabetes is precise and reliable control of single-chain insulin (SCI) analog production. One strategy is to implement within S. epidermidis a synthetic transcription response specific to glucose (i.e., not responsive to off-target inputs such as acetate or fructose), that activates at the appropriate threshold (i.e., fasting blood glucose ≥126 mg/dL) (American Diabetes Association, 2023), and results in well-regulated and rapid production of an SCI analog. The glucose-responsive genes we identified here can serve as a starting point for such genetically-encoded controllers.
More broadly, bioengineered sensors and actuators could be used to create a diversity of potentially useful skin microbes. For example, environmentally friendly sunscreen production (Yang et al., 2018) controlled by UV intensity. As a second example, mosquito repellents and feeding-deterrents (Kajla et al., 2019) controlled by time of day. As a third example, odorant molecules (i.e., perfume or deodorant) controlled by body temperature or salt content. As a final example, the delivery of therapeutic proteins for the treatment of disease (Azitra, 2023).
The human skin microbiome is a diverse and dynamic microbial community that plays an essential role in maintaining our health and well-being. A more intimate understanding of how our skin microbes adapt to environmental perturbations (e.g., stress or increased glucose levels) is required to ultimately enable development of bioengineered skin microbes that can help diagnose and treat disease. We hope our investigation of the genome-wide transcription response in S. epidermidis to heat shock and medically relevant glucose concentrations helps further motivate ongoing work. We are excited to imagine a future in which the bioengineering of skin microbes has been made routine, helping doctors and patients to realize healthier lives and better clinical outcomes.
Data availability statement
The datasets presented in this study can be found in the NCBI Gene Expression Omnibus (Benjamin et al., 2024) via GEO Series accession number GSE261664.
Author contributions
KB: Conceptualization, Data curation, Formal analysis, Investigation, Methodology, Validation, Visualization, Writing – original draft, Writing – review & editing. AG: Data curation, Formal analysis, Methodology, Software, Visualization, Writing – original draft, Writing – review & editing. RN: Data curation, Formal analysis, Methodology, Software, Visualization, Writing – original draft, Writing – review & editing. DE: Conceptualization, Funding acquisition, Project administration, Supervision, Writing – original draft, Writing – review & editing.
Funding
The author(s) declare that financial support was received for the research, authorship, and/or publication of this article. KB was funded by a Stanford Bio-X Bowes Graduate Fellowship, a Larry L. Hillblom Foundation Network Grant 2018-D-001-NET, and National Institute of Health Grant 5R01GM086663–11. Stanford University, the Stanford Genetics Bioinformatics Service Center (GBSC), and the Stanford Diabetes Research Center (SDRC) provided additional support. The funders were not involved in the study design, collection of samples, analysis of data, interpretation of data, the writing of this manuscript or the decision to submit this manuscript for publication.
Acknowledgments
We thank John Glass, Richard Gallo, Alberto Hayek and Yo Suzuki for their support, mentorship, and helpful comments. We also acknowledge our collaborators Michael Weiss and Saori Campen for their support. The content of this manuscript has previously appeared online in a bioRxiv preprint (Benjamin et al., 2024).
Conflict of interest
The authors declare that the research was conducted in the absence of any commercial or financial relationships that could be construed as a potential conflict of interest.
Publisher’s note
All claims expressed in this article are solely those of the authors and do not necessarily represent those of their affiliated organizations, or those of the publisher, the editors and the reviewers. Any product that may be evaluated in this article, or claim that may be made by its manufacturer, is not guaranteed or endorsed by the publisher.
Supplementary material
The Supplementary material for this article can be found online at: https://www.frontiersin.org/articles/10.3389/fmicb.2024.1408796/full#supplementary-material
References
American Diabetes Association (2023). Diagnosis : ADA. diabetes.org https://diabetes.org/about-diabetes/diagnosis.
Anderson, K. L., Roberts, C., Disz, T., Vonstein, V., Hwang, K., Overbeek, R., et al. (2006). Characterization of the Staphylococcus aureus heat shock, cold shock, stringent, and SOS responses and their effects on log-phase mRNA turnover. J. Bacteriol. 188, 6739–6756. doi: 10.1128/jb.00609-06
Andrews, S. (2010). FastQC a quality control tool for high throughput sequence data. Available at: https://www.bioinformatics.babraham.ac.uk/projects/fastqc/.
Arndt, A., and Eikmanns, B. J. (2007). The alcohol dehydrogenase gene adhA in Corynebacterium glutamicum is subject to carbon catabolite repression. J. Bacteriol. 189, 7408–7416. doi: 10.1128/JB.00791-07
Azitra, Inc . (2023) Technology. Available at: https://azitrainc.com/technology/ (Accessed December 3, 2023).
Bay, L., Barnes, C. J., Fritz, B. G., Thorsen, J., Restrup, M. E. M., Rasmussen, L., et al. (2020). Universal dermal microbiome in human skin. MBio 11. doi: 10.1128/mbio.02945-19
Bayer, M. G., Heinrichs, J. H., and Cheung, A. L. (1996). The molecular architecture of the Sar locus in Staphylococcus aureus. J. Bacteriol. 178, 4563–4570. doi: 10.1128/jb.178.15.4563-4570.1996
Benjamin, K. N. (2024). Engineering Staphylococcus epidermidis for the treatment of diabetes. Purl.Stanford.Edu. Available at: https://purl.stanford.edu/bh947ky8221 (Accessed June 21, 2024).
Benjamin, K. N., Goyal, A., Nair, R. V., and Endy, D. (2024). Genome-wide transcription response of Staphylococcus epidermidis to heat shock and medically relevant glucose levels. bioRxiv. doi: 10.1101/2024.03.18.585582
Benjamini, Y., and Hochberg, Y. (1995). Controlling the false discovery rate: a practical and powerful approach to multiple testing. J. R. Stat. Soc. 57, 289–300. doi: 10.1111/j.2517-6161.1995.tb02031.x
Bierman, W. (1936). The temperature of the skin surface. JAMA J. Am. Med. Assoc. 106:1158. doi: 10.1001/jama.1936.02770140020007
Blighe, K, Rana, S, and Lewis, M (2023). EnhancedVolcano: Publication-ready volcano plots with enhanced colouring and labeling. R package version 1.20.0, Available at: https://bioconductor.org/packages/EnhancedVolcano.
Borkowski, O., Endy, D., and Subsoontorn, P. (2017). Hands-free control of heterologous gene expression in batch cultures. bioRxiv. doi: 10.1101/150375
Brophy, J. A. N., Triassi, A. J., Adams, B. L., Renberg, R. L., Stratis-Cullum, D. N., Grossman, A. D., et al. (2018). Engineered integrative and conjugative elements for efficient and inducible DNA transfer to undomesticated bacteria. Nat. Microbiol. 3, 1043–1053. doi: 10.1038/s41564-018-0216-5
Byrd, A. L., Belkaid, Y., and Segre, J. A. (2018). The human skin microbiome. Nat. Rev. Microbiol. 16, 143–155. doi: 10.1038/nrmicro.2017.157
Camacho, C., Coulouris, G., Avagyan, V., Ma, N., Papadopoulos, J., Bealer, K., et al. (2009). BLAST+: architecture and applications. BMC Bioinformatics 10:421. doi: 10.1186/1471-2105-10-421
Cao, Y., Ohwatari, N., Matsumoto, T., Kosaka, M., Ohtsuru, A., and Yamashita, S. (1999). TGF-β1 mediates 70-kDa heat shock protein induction due to ultraviolet irradiation in human skin fibroblasts. Pflüg. Archiv Eur. J. Physiol. 438, 239–244. doi: 10.1007/s004240050905
Chastanet, A., Fert, J., and Msadek, T. (2003). Comparative genomics reveal novel heat shock regulatory mechanisms in Staphylococcus aureus and other gram-positive bacteria. Mol. Microbiol. 47, 1061–1073. doi: 10.1046/j.1365-2958.2003.03355.x
Chastanet, A., Prudhomme, M., Claverys, J.-P., and Msadek, T. (2001). Regulation of Streptococcus pneumoniae clp genes and their role in competence development and stress survival. J. Bacteriol. 183, 7295–7307. doi: 10.1128/jb.183.24.7295-7307.2001
Chatterjee, S. S., Joo, H.-S., Duong, A. C., Dieringer, T. D., Tan, V. Y., Song, Y., et al. (2013). Essential Staphylococcus aureus toxin export system. Nat. Med. 19, 364–367. doi: 10.1038/nm.3047
Chen, Y. E., Bousbaine, D., Veinbachs, A., Atabakhsh, K., Dimas, A., Yu, V. K., et al. (2023). Engineered skin bacteria induce antitumor T cell responses against melanoma. Science 380, 203–210. doi: 10.1126/science.abp9563
Chen, S., Zhou, Y., Chen, Y., and Gu, J. (2018). Fastp: an ultra-fast all-in-one FASTQ preprocessor. Bioinformatics 34, i884–i890. doi: 10.1093/bioinformatics/bty560
Cheung, G. Y. C., Joo, H.-S., Chatterjee, S. S., and Otto, M. (2014). Phenol-soluble modulins – critical determinants of staphylococcal virulence. FEMS Microbiol. Rev. 38, 698–719. doi: 10.1111/1574-6976.12057
Cogen, A. L., Nizet, V., and Gallo, R. L. (2008). Skin microbiota: a source of disease or defence? Br. J. Dermatol. 158, 442–455. doi: 10.1111/j.1365-2133.2008.08437.x
Costa, S. K., Donegan, N. P., Corvaglia, A.-R., François, P., and Cheung, A. L. (2017). Bypassing the restriction system to improve transformation of Staphylococcus epidermidis. J. Bacteriol. 199:e00271-17. doi: 10.1128/jb.00271-17
Dainat, J. (2019). AGAT: another GFF analysis toolkit to handle annotations in any GTF/GFF format. Zenodo. doi: 10.5281/zenodo.3552717
Danecek, P., Bonfield, J. K., Liddle, J., Marshall, J., Ohan, V., Pollard, M. O., et al. (2021). Twelve years of SAMtools and BCFtools. GigaScience 10:giab008. doi: 10.1093/gigascience/giab008
delCardayré, S. B., Stock, K. P., Newton, G. L., Fahey, R. C., and Davies, J. E. (1998). Coenzyme a disulfide reductase, the primary low molecular weight disulfide reductase from Staphylococcus aureus. J. Biol. Chem. 273, 5744–5751. doi: 10.1074/jbc.273.10.5744
Delignette-Muller, M. L., Siberchicot, A., Larras, F., and Billoir, E. (2023). DRomics, a workflow to exploit dose-response omics data in ecotoxicology. Peer Commun. J. 3, 1–12. doi: 10.24072/pcjournal.325
Derre, I., Rapoport, G., and Msadek, T. (1999). CtsR, a novel regulator of stress and heat shock response, controls clp and molecular chaperone gene expression in gram-positive bacteria. Mol. Microbiol. 31, 117–131. doi: 10.1046/j.1365-2958.1999.01152.x
Dong, H., Nilsson, L., and Kurland, C. G. (1996). Co-variation of tRNA abundance and codon usage in Escherichia coli at different growth rates. J. Mol. Biol. 260, 649–663. doi: 10.1006/jmbi.1996.0428
Duncan, R., and Hershey, J. W. B. (1989). Protein synthesis and protein phosphorylation during heat stress, recovery, and adaptation. J. Cell Biol. 109, 1467–1481. doi: 10.1083/jcb.109.4.1467
Ewels, P., Magnusson, M., Lundin, S., and Käller, M. (2016). MultiQC: summarize analysis results for multiple tools and samples in a single report. Bioinformatics 32, 3047–3048. doi: 10.1093/bioinformatics/btw354
Ferreira, A., O’Byrne, C. P., and Boor, K. J. (2001). Role of ς B in heat, ethanol, acid, and oxidative stress resistance and during carbon starvation in Listeria monocytogenes. Appl. Environ. Microbiol. 67, 4454–4457. doi: 10.1128/aem.67.10.4454-4457.2001
Fleury, B., Kelley, W. L., Lew, D., Götz, F., Proctor, R. A., and Vaudaux, P. (2009). Transcriptomic and metabolic responses of Staphylococcus aureus exposed to supra-physiological temperatures. BMC Microbiol. 9:76. doi: 10.1186/1471-2180-9-76
Franke, G., Dobinsky, S., Mack, D., Wang, C.-J., Sobottka, I., Martin, C., et al. (2007). Expression and functional characterization of gfpmut3.1 and its unstable variants in Staphylococcus epidermidis. J. Microbiol. Methods 71, 123–132. doi: 10.1016/j.mimet.2007.08.015
Ge, Y., Li, D., Wang, N., Shi, Y., Guo, G., Fang, L., et al. (2024). Unveiling the fructose metabolism system in Staphylococcus aureus: insights into the regulatory role of FruR and the FruRKT operon in bacterial fitness. BMC Microbiol. 24:13. doi: 10.1186/s12866-023-03151-x
Glidden, M. D., Aldabbagh, K., Phillips, N. B., Carr, K., Chen, Y.-S., Whittaker, J., et al. (2018). An ultra-stable single-chain insulin analog resists thermal inactivation and exhibits biological signaling duration equivalent to the native protein. J. Biol. Chem. 293, 47–68. doi: 10.1074/jbc.m117.808626
Goncheva, M. I., Flannagan, R. S., Sterling, B. E., Laakso, H. A., Friedrich, N. C., Kaiser, J. C., et al. (2019). Stress-induced inactivation of the Staphylococcus aureus purine biosynthesis repressor leads to hypervirulence. Nat. Commun. 10:775. doi: 10.1038/s41467-019-08724-x
Görke, B., and Stülke, J. (2008). Carbon catabolite repression in bacteria: many ways to make the most out of nutrients. Nat. Rev. Microbiol. 6, 613–624. doi: 10.1038/nrmicro1932
Guglielmi, G., Mazodier, P., Thompson, C. J., and Davies, J. (1991). A survey of the heat shock response in four Streptomyces species reveals two groEL-like genes and three groEL-like proteins in Streptomyces albus. J. Bacteriol. 173, 7374–7381. doi: 10.1128/jb.173.22.7374-7381.1991
Gutierrez-Ríos, R. M., Freyre-Gonzalez, J. A., Resendis, O., Collado-Vides, J., Saier, M., and Gosset, G. (2007). Identification of regulatory network topological units coordinating the genome-wide transcriptional response to glucose in Escherichia coli. BMC Microbiol. 7:53. doi: 10.1186/1471-2180-7-53
Halsey, C. R., Lei, S., Wax, J. K., Lehman, M. K., Nuxoll, A. S., Steinke, L., et al. (2017). Amino acid catabolism in Staphylococcus aureus and the function of carbon catabolite repression. MBio 8:e01434-16. doi: 10.1128/mbio.01434-16
Heilbronner, S., Krismer, B., Brötz-Oesterhelt, H., and Peschel, A. (2021). The microbiome-shaping roles of bacteriocins. Nat. Rev. Microbiol. 19, 726–739. doi: 10.1038/s41579-021-00569-w
Kajla, M. K., Barrett-Wilt, G. A., and Paskewitz, S. M. (2019). Bacteria: a novel source for potent mosquito feeding-deterrents. Sci. Adv. 5:eaau6141. doi: 10.1126/sciadv.aau6141
Kamps, A., Achebach, S., Fedtke, I., Unden, G., and Götz, F. (2004). Staphylococcal NreB: an O2-sensing histidine protein kinase with an O2-labile iron-Sulphur cluster of the FNR type. Mol. Microbiol. 52, 713–723. doi: 10.1111/j.1365-2958.2004.04024.x
Kanehisa, M., and Goto, S. (2000). KEGG: Kyoto encyclopedia of genes and genomes. Nucleic Acids Res. 28, 27–30. doi: 10.1093/nar/28.1.27
Korotkevich, G., Sukhov, V., Budin, N., Boris Shpak, B., Artyomov, M. N., and Sergushichev, A. (2021). Fast gene set enrichment analysis. bioRxiv :060012. doi: 10.1101/060012
Kovacs, M., Halfmann, A., Fedtke, I., Heintz, M., Peschel, A., Vollmer, W., et al. (2006). A functional dlt operon, encoding proteins required for incorporation of D-alanine in teichoic acids in gram-positive bacteria, confers resistance to cationic antimicrobial peptides in Streptococcus pneumoniae. J. Bacteriol. 188, 5797–5805. doi: 10.1128/jb.00336-06
Krueger, F. . (2012). Trim Galore: a wrapper around Cutadapt and FastQC to consistently apply adapter and quality trimming to FastQ files, with extra functionality for RRBS data. Available at: https://www.bioinformatics.babraham.ac.uk/projects/trim_galore/
Kullik, I., and Giachino, P. (1997). The alternative sigma factor σ B in Staphylococcus aureus: regulation of the sigB operon in response to growth phase and heat shock. Arch. Microbiol. 167, 151–159. doi: 10.1007/s002030050428
Langmead, B., and Salzberg, S. L. (2012). Fast gapped-read alignment with bowtie 2. Nat. Methods 9, 357–359. doi: 10.1038/nmeth.1923
Larras, F., Billoir, E., Baillard, V., Siberchicot, A., Scholz, S., Wubet, T., et al. (2018). DRomics: a turnkey tool to support the use of the dose–response framework for omics data in ecological risk assessment. Environ. Sci. Technol. 52, 14461–14468. doi: 10.1021/acs.est.8b04752
Leech, J., Dhariwala, M. O., Lowe, M. M., Chu, K. R., Merana, G. R., Cornuot, C., et al. (2019). Toxin-triggered Interleukin-1 receptor signaling enables early-life discrimination of pathogenic versus commensal skin Bacteria. Cell Host Microbe 26, 795–809.e5. doi: 10.1016/j.chom.2019.10.007
Lemaux, P. G., Herendeen, S. L., Bloch, P. L., and Neidhardt, F. C. (1978). Transient rates of synthesis of individual polypeptides in E. coli following temperature shifts. Cell 13, 427–434. doi: 10.1016/0092-8674(78)90317-3
Liao, Y., Smyth, G. K., and Shi, W. (2013). featureCounts: an efficient general purpose program for assigning sequence reads to genomic features. Bioinformatics 30, 923–930. doi: 10.1093/bioinformatics/btt656
Lima-Junior, D. S., Krishnamurthy, S. R., Bouladoux, N., Collins, N., Han, S.-J., Chen, E. Y., et al. (2021). Endogenous retroviruses promote homeostatic and inflammatory responses to the microbiota. Cell 184, 3794–3811.e19. doi: 10.1016/j.cell.2021.05.020
Liu, Q., Chen, N., Chen, H., and Huang, Y. (2020). RNA-Seq analysis of differentially expressed genes of Staphylococcus epidermidis isolated from postoperative endophthalmitis and the healthy conjunctiva. Sci. Rep. 10:14234. doi: 10.1038/s41598-020-71050-6
Liu, Q., Li, D., Wang, N., Guo, G., Shi, Y., Zou, Q., et al. (2022). Identification and application of a panel of constitutive promoters for gene overexpression in Staphylococcus aureus. Front. Microbiol. 13:818307. doi: 10.3389/fmicb.2022.818307
Llarrull, L. I., Prorok, M., and Mobashery, S. (2010). Binding of the gene repressor BlaI to the Bla operon in methicillin-resistant Staphylococcus aureus. Biochemistry 49, 7975–7977. doi: 10.1021/bi101177a
Love, M. I., Huber, W., and Anders, S. (2014). Moderated estimation of fold change and dispersion for RNA-seq data with DESeq2. Genome Biol. 15:550. doi: 10.1186/s13059-014-0550-8
Manta, B., Boyd, D., and Berkmen, M. (2019). Disulfide bond formation in the periplasm of Escherichia coli. EcoSal Plus 8, 1–20. doi: 10.1128/ecosalplus.esp-0012-2018
Masalha, M., Borovok, I., Schreiber, R., Aharonowitz, Y., and Cohen, G. (2001). Analysis of transcription of the Staphylococcus aureus aerobic class Ib and anaerobic class III ribonucleotide reductase genes in response to oxygen. J. Bacteriol. 183, 7260–7272. doi: 10.1128/jb.183.24.7260-7272.2001
McClary, J. S., and Boehm, A. B. (2018). Transcriptional response of Staphylococcus aureus to sunlight in Oxic and anoxic conditions. Front. Microbiol. 9:249. doi: 10.3389/fmicb.2018.00249
Meredith, T. C., Swoboda, J. G., and Walker, S. (2008). Late-stage Polyribitol Phosphate Wall teichoic acid biosynthesis in Staphylococcus aureus. J. Bacteriol. 190, 3046–3056. doi: 10.1128/jb.01880-07
Monk, I. R., Shah, I. M., Xu, M., Tan, M.-W., and Foster, T. J. (2012). Transforming the Untransformable: application of direct transformation to manipulate genetically Staphylococcus aureus and Staphylococcus epidermidis. MBio 3:e00277-11. doi: 10.1128/mbio.00277-11
Monniot, C., Zébré, A. C., Moussan, F., Deutscher, J., and Milohanic, E. (2012). Novel Listerial glycerol dehydrogenase- and phosphoenolpyruvate-dependent dihydroxyacetone kinase system connected to the pentose phosphate pathway. J. Bacteriol. 194, 4972–4982. doi: 10.1128/jb.00801-12
Mootha, V. K., Lindgren, C. M., Eriksson, K.-F., Subramanian, A., Sihag, S., Lehar, J., et al. (2003). PGC-1α-responsive genes involved in oxidative phosphorylation are coordinately downregulated in human diabetes. Nat. Genet. 34, 267–273. doi: 10.1038/ng1180
Moran, J. C., Alorabi, J. A., and Horsburgh, M. J. (2017). Comparative Transcriptomics reveals discrete survival responses of S. aureus and S. epidermidis to Sapienic acid. Front. Microbiol. 8:83. doi: 10.3389/fmicb.2017.00033
Moser, F., Espah Borujeni, A., Ghodasara, A. N., Cameron, E., Park, Y., and Voigt, C. A. (2018). Dynamic control of endogenous metabolism with combinatorial logic circuits. Mol. Syst. Biol. 14:e8605. doi: 10.15252/msb.20188605
Naik, S., Bouladoux, N., Linehan, J. L., Han, S.-J., Harrison, O. J., Wilhelm, C., et al. (2015). Commensal-dendritic-cell interaction specifies a unique protective skin immune signature. Nature 520, 104–108. doi: 10.1038/nature14052
Nakatsuji, T., Chen, T. H., Narala, S., Chun, K. A., Two, A. M., Yun, T., et al. (2017). Antimicrobials from human skin commensal bacteria protect against Staphylococcus aureus and are deficient in atopic dermatitis. Sci. Transl. Med. 9:eaah4680. doi: 10.1126/scitranslmed.aah4680
Nakatsuji, T., Chiang, H.-I., Jiang, S. B., Nagarajan, H., Zengler, K., and Gallo, R. L. (2013). The microbiome extends to subepidermal compartments of normal skin. Nat. Commun. 4:1431. doi: 10.1038/ncomms2441
Nam, T.-W. (2005). Glucose repression of the Escherichia coli sdhCDAB operon, revisited: regulation by the CRP{middle dot}cAMP complex. Nucleic Acids Res. 33, 6712–6722. doi: 10.1093/nar/gki978
Ni, C., Dinh, C. V., and Prather, K. L. J. (2021). Dynamic control of metabolism. Annu. Rev. Chem. Biomol. Eng. 12, 519–541. doi: 10.1146/annurev-chembioeng-091720-125738
Nuxoll, A. S., Halouska, S. M., Sadykov, M. R., Hanke, M. L., Bayles, K. W., Kielian, T., et al. (2012). CcpA regulates arginine biosynthesis in Staphylococcus aureus through repression of Proline catabolism. PLoS Pathog. 8:e1003033. doi: 10.1371/journal.ppat.1003033
Oliveira, W. F., Silva, P. M. S., Silva, R. C. S., Silva, G. M. M., Machado, G., Coelho, L. C. B. B., et al. (2018). Staphylococcus aureus and Staphylococcus epidermidis infections on implants. J. Hosp. Infect. 98, 111–117. doi: 10.1016/j.jhin.2017.11.008
Ooronfleh, M. W., Streips, U. N., and Wilkinson, B. J. (1990). Basic features of the staphylococcal heat shock response. Antonie Van Leeuwenhoek 58, 79–86. doi: 10.1007/bf00422721
Penninckx, M. J., Jaspers, C. J., and Legrain, M. J. (1983). The glutathione-dependent glyoxalase pathway in the yeast Saccharomyces cerevisiae. J. Biol. Chem. 258, 6030–6036. doi: 10.1016/s0021-9258(18)32368-8
Perkins-Kirkpatrick, S. E., and Lewis, S. C. (2020). Increasing trends in regional heatwaves. Nat. Commun. 11:3357. doi: 10.1038/s41467-020-16970-7
Richter, K., Haslbeck, M., and Buchner, J. (2010). The heat shock response: life on the verge of death. Mol. Cell 40, 253–266. doi: 10.1016/j.molcel.2010.10.006
Riley, L. (2023). Mean fasting blood glucose : World Health Organization Available at: https://www.who.int/data/gho/indicator-metadata-registry/imr-details/2380#:~:text=The%20expected%20values%20for%20normal.
Rokop, M. E., Auchtung, J. M., and Grossman, A. D. (2004). Control of DNA replication initiation by recruitment of an essential initiation protein to the membrane of Bacillus subtilis. Mol. Microbiol. 52, 1757–1767. doi: 10.1111/j.1365-2958.2004.04091.x
Roncarati, D., and Scarlato, V. (2017). Regulation of heat-shock genes in bacteria: from signal sensing to gene expression output. FEMS Microbiol. Rev. 41, 549–574. doi: 10.1093/femsre/fux015
Schlothauer, T., Mogk, A., Dougan, D. A., Bukau, B., and Turgay, K. (2003). MecA, an adaptor protein necessary for ClpC chaperone activity. Proc. Natl. Acad. Sci. USA 100, 2306–2311. doi: 10.1073/pnas.0535717100
Schumann, W. (2003). The Bacillus subtilis heat shock stimulon. Cell Stress Chaperones 8, 207–217. doi: 10.1379/1466-1268(2003)008<0207:TBSHSS>2.0.CO;2
Schumann, W. (2016). Regulation of bacterial heat shock stimulons. Cell Stress Chaperones 21, 959–968. doi: 10.1007/s12192-016-0727-z
Seidl, K., Müller, S., François, P., Kriebitzsch, C., Schrenzel, J., Engelmann, S., et al. (2009). Effect of a glucose impulse on the CcpA regulon in Staphylococcus aureus. BMC Microbiol. 9:95. doi: 10.1186/1471-2180-9-95
Severn, M. M., and Horswill, A. R. (2022). Staphylococcus epidermidis and its dual lifestyle in skin health and infection. Nat. Rev. Microbiol. 21, 97–111. doi: 10.1038/s41579-022-00780-3
Slotboom, D. J. (2013). Structural and mechanistic insights into prokaryotic energy-coupling factor transporters. Nat. Rev. Microbiol. 12, 79–87. doi: 10.1038/nrmicro3175
Spoto, M., Riera Puma, J. P., Fleming, E., Guan, C., Ondouah Nzutchi, Y., Kim, D., et al. (2022). Large-scale CRISPRi and transcriptomics of Staphylococcus epidermidis identify genetic factors implicated in lifestyle versatility. MBio 13:e0263222. doi: 10.1128/mbio.02632-22
Subramanian, A., Tamayo, P., Mootha, V. K., Mukherjee, S., Ebert, B. L., Gillette, M. A., et al. (2005). Gene set enrichment analysis: a knowledge-based approach for interpreting genome-wide expression profiles. Proc. Natl. Acad. Sci. 102, 15545–15550. doi: 10.1073/pnas.0506580102
Supek, F., Bošnjak, M., Škunca, N., and Šmuc, T. (2011). REVIGO summarizes and visualizes long lists of gene ontology terms. PLoS One 6:e21800. doi: 10.1371/journal.pone.0021800
Swaney, M. H., Nelsen, A., Sandstrom, S., and Kalan, L. R. (2023). Sweat and sebum preferences of the human skin microbiota. Microbiol. Spectr. 11:e0418022. doi: 10.1128/spectrum.04180-22
Trapnell, C., Williams, B. A., Pertea, G., Mortazavi, A., Kwan, G., van Baren, M. J., et al. (2010). Transcript assembly and quantification by RNA-Seq reveals unannotated transcripts and isoform switching during cell differentiation. Nat. Biotechnol. 28, 511–515. doi: 10.1038/nbt.1621
Vandecasteele, S. J., Peetermans, W. E., Merckx, R., and Van Eldere, J. (2001). Quantification of expression of Staphylococcus epidermidis housekeeping genes with Taqman quantitative PCR during in vitro growth and under different conditions. J. Bacteriol. 183, 7094–7101. doi: 10.1128/JB.183.24.7094-7101.2001
Wang, R., Khan, B. A., Cheung, G. Y. C., Bach, T.-H. L., Jameson-Lee, M., Kong, K.-F., et al. (2011). Staphylococcus epidermidis surfactant peptides promote biofilm maturation and dissemination of biofilm-associated infection in mice. J. Clin. Investig. 121, 238–248. doi: 10.1172/JCI42520
Wang, L., Wang, S., and Li, W. (2012). RSeQC: quality control of RNA-seq experiments. Bioinformatics 28, 2184–2185. doi: 10.1093/bioinformatics/bts356
Williams, M. R., Costa, S. K., Zaramela, L. S., Khalil, S., Todd, D. A., Winter, H. L., et al. (2019). Quorum sensing between bacterial species on the skin protects against epidermal injury in atopic dermatitis. Sci. Transl. Med. 11:eaat8329. doi: 10.1126/scitranslmed.aat8329
World Health Organization (2023). Diabetes : World Health Organization Available at: https://www.who.int/health-topics/diabetes#tab=tab_1.
Yang, G., Cozad, M. A., Holland, D. A., Zhang, Y., Luesch, H., and Ding, Y. (2018). Photosynthetic production of sunscreen Shinorine using an engineered cyanobacterium. ACS Synth. Biol. 7, 664–671. doi: 10.1021/acssynbio.7b00397
Yu, Y., Ouyang, Y., and Yao, W. (2017). shinyCircos: an R/shiny application for interactive creation of Circos plot. Bioinformatics 34, 1229–1231. doi: 10.1093/bioinformatics/btx763
Zheng, Y., Hunt, R. L., Villaruz, A. E., Fisher, E. L., Liu, R., Liu, Q., et al. (2022). Commensal Staphylococcus epidermidis contributes to skin barrier homeostasis by generating protective ceramides. Cell Host Microbe 30, 301–313.e9. doi: 10.1016/j.chom.2022.01.004
Keywords: Staphylococcus epidermidis, skin, transcriptomics, glucose, diabetes, heat-shock, synthetic biology
Citation: Benjamin KN, Goyal A, Nair RV and Endy D (2024) Genome-wide transcription response of Staphylococcus epidermidis to heat shock and medically relevant glucose levels. Front. Microbiol. 15:1408796. doi: 10.3389/fmicb.2024.1408796
Edited by:
Christoph Engl, Queen Mary University of London, United KingdomReviewed by:
Becky Hess, Pacific Northwest National Laboratory (DOE), United StatesVineet Kumar, The University of Texas at Austin, United States
Copyright © 2024 Benjamin, Goyal, Nair and Endy. This is an open-access article distributed under the terms of the Creative Commons Attribution License (CC BY). The use, distribution or reproduction in other forums is permitted, provided the original author(s) and the copyright owner(s) are credited and that the original publication in this journal is cited, in accordance with accepted academic practice. No use, distribution or reproduction is permitted which does not comply with these terms.
*Correspondence: Drew Endy, ZW5keUBzdGFuZm9yZC5lZHU=
†These authors have contributed equally to this work and share first authorship