 Sijia Liu1,2
 Nan Zheng
 Jiaqi Wang
 Shengguo Zhao
94% of researchers rate our articles as excellent or good
Learn more about the work of our research integrity team to safeguard the quality of each article we publish.
Find out more
ORIGINAL RESEARCH article
Front. Microbiol., 02 April 2024
Sec. Microorganisms in Vertebrate Digestive Systems
Volume 15 - 2024 | https://doi.org/10.3389/fmicb.2024.1376994
This article is part of the Research TopicThe Role of Nutritional Strategies in the Regulation of Gut Microbiota and Host Immune SystemView all 27 articles
Introduction: The rumen microbial community plays a crucial role in the digestion and metabolic processes of ruminants. Although sequencing-based studies have helped reveal the diversity and functions of bacteria in the rumen, their physiological and biochemical characteristics, as well as their dynamic regulation along the digestion process in the rumen, remain poorly understood. Addressing these gaps requires pure culture studies to demystify the intricate mechanisms at play. Bacteria exhibit morphological differentiation associated with different species. Based on the difference in size or shape of microorganisms, size fractionation by filters with various pore sizes can be used to separate them.
Methods: In this study, we used polyvinylidene difluoride filters with pore sizes of 300, 120, 80, 40, 20, 8, 6, 2.1, and 0.6 μm. Bacterial suspensions were successively passed through these filters for the analysis of microbial population distribution using 16S rRNA gene sequences.
Results: We found that bacteria from the different pore sizes were clustered into four branches (> 120 μm, 40–120 μm, 6–20 μm, 20–40 μm, and < 0.6 μm), indicating that size fractionation had effects on enriching specific groups but could not effectively separate dominant groups by cell size alone. The species of unclassified Flavobacterium, unclassified Chryseobacterium, unclassified Delftia, Methylotenera mobilis, unclassified Caulobacteraceae, unclassified Oligella, unclassified Sphingomonas, unclassified Stenotrophomonas, unclassified Shuttleworthia, unclassified Sutterella, unclassified Alphaproteobacteria, and unclassified SR1 can be efficiently enriched or separated by size fractionation.
Discussion: In this study, we investigated the diversity of sorted bacteria populations in the rumen for preliminary investigations of the relationship between the size and classification of rumen bacteria that have the potential to improve our ability to isolate and culture bacteria from the rumen in the future.
The rumen microbiota is crucial for the digestion and metabolism of feed in ruminants, with bacteria being the predominant microorganisms present (Li et al., 2019). The rumen contains a vast number of bacterial cells, estimated to be approximately 1010–1011 cells/mL, belonging to over 200 different species (Matthews et al., 2019). Rumen bacteria ferment complex carbohydrates, such as hemicellulose, cellulose, and lignin, which are inedible to humans, producing short-chain fatty acids used for dairy or meat production (Stewart et al., 2019). Maintaining homeostasis in the rumen microecology is crucial for the host’s ability to digest, feed, and survive, which ultimately affects its productivity. Therefore, manipulating rumen bacteria offers opportunities to regulate rumen metabolism and reduce food production costs.
Both cultivation and sequencing-based research have strived to reveal the diversity of rumen bacteria and their respective functionalities (Seshadri et al., 2018; Xue et al., 2020). Studies utilizing high-throughput sequencing have unveiled a remarkable abundance of bacteria in the rumen, identifying approximately 7,416 distinct microbial taxa (da Cunha et al., 2023). However, only a fraction of bacteria have been isolated from the rumen (Seshadri et al., 2018). Although sequencing-based studies have helped reveal the diversity, function, and distribution of bacteria in the rumen, their physiological and biochemical characteristics, as well as dynamic regulation along the digestion process, remain poorly understood. These aspects rely on pure culture for further elucidation.
Traditional plating cultivation methods are important for the isolation and cultivation of bacteria, which are frequently used to successfully isolate interested bacteria (Galvez et al., 2020; Sorbara et al., 2020), which is laborious and time-consuming. We need some new methods to minimize these potential limitations. Bacteria exhibit morphological differentiation associated with different species, including coccoid, rod, spirilla types, and various other uncommon shapes (Kysela et al., 2016; van Teeseling et al., 2017; Tian et al., 2023). Based on the difference in size or shape of microorganisms, size fractionation using filters with various pore sizes can be used to separate them (Sorokin et al., 2017; Lewis et al., 2020).
The distribution of bacterial species among various cell size categories in the rumen remains unreported. In this study, we investigated the diversity of sorted bacteria populations in the rumen to preliminarily explore the relationships between cell size and classification diversity, which have the potential to enhance our ability to isolate and culture bacteria from the rumen.
Samples of rumen fluid were obtained from three Holstein dairy cows with cannulas (weighing approximately 600 ± 50 kg) to serve as the bacterial source for rumen analysis, which is a part of our previous study and has received ethical approval (Liu et al., 2023). All the procedures involving the care and management of dairy cows were approved by the Animal Care and Use Committee for Livestock of the Institute of Animal Sciences, Chinese Academy of Agricultural Sciences (protocol no.: IAS201914). The dairy cows were fed a typical total mixed ration (DM base) consisting of 62.09% corn silage, 7.66% alfalfa hay, 10.25% corn powder, 17.87% soybean meal, and 2.13% premix. The rumen content was collected and subsequently filtered through a four-layered cheesecloth to separate the liquid. Immediately, the liquid samples were combined (in equal amounts) and injected into a penicillin bottle along with an equivalent volume of sterile glycerol (15%, v/v) using a syringe. Subsequently, they were preserved at −80°C until required.
The microbiota from the rumen were fractionated based on different cell sizes using polyvinylidene difluoride filters with 300, 120, 80, 40, 20, 8, 6, 2.1, and 0.6 μm pore sizes (Merck, Merck Millipore Ltd., Ireland). The rumen fluid was successively passed through the 300, 120, 80, 40, 20, 8, 6, 2.1, and 0.6 μm filters. Four replicates were set up for each experimental treatment. To increase the flow of filtering, we used an injector, and the volumes filtered were less than 5 mL. Retentates were washed three times using a PBS solution. Bacterial fractionation resuspensions were centrifuged (13,000× g, 2 min, 4°C), and the sediment pellets were reserved. Consequently, bacteria fractions with size ranges at ≥300 μm, 120–300 μm (120 μm ≤ * < 300 μm), 80–120 μm (80 μm ≤ * < 120 μm), 40–80 μm (40 μm ≤ * < 80 μm), 20–40 μm (20 μm ≤ * < 40 μm), 8–20 μm (8 μm ≤ * < 20 μm), 6–8 μm (6 μm ≤ * < 8 μm), 2.1–6 μm (2.1 μm ≤ * < 6 μm), 0.6–2.1 μm (0.6 μm ≤ * < 2.1 μm), and < 0.6 μm were obtained.
DNA was extracted using the cetyltrimethylammonium bromide (CTAB) method plus bead beating, as previously documented (Liu et al., 2023). The quality of DNA was assessed through the utilization of agarose gel electrophoresis (1%), while the measurement of DNA concentration was conducted using a Nanodrop spectrophotometer (Thermo Scientific, United States).
The microbial diversity was detected by sequencing the V3–V4 region of 16S rRNA, which was amplified using PCR with the primers 338F (5´-ACTCCTACGGGAGGCAGCAG-3′) and 806R (5´-GGACTACHVGGGTWTCTAAT-3′). The reactions were conducted using a MyCycler Thermal Cycler (Bio-Rad, United States) following the protocol described by Liu et al. (2020). The PCR amplicons were subjected to sequencing using the Illumina MiSeq platform at Majorbio (Shanghai, China).
Sequencing raw data were analyzed using the QIIME package (Bolger et al., 2014). First, the raw reads were trimmed to remove sequencing adaptors, followed by filtering to exclude any bases containing ambiguous information. Next, paired-end reads were merged using FLASH (Magoč and Salzberg, 2011) with parameters set at an overlap of >10 bp and a mismatch rate of <20%. Chimera sequences were removed using the UCHIME de novo algorithm (Wang et al., 2007). Operational taxonomic units (OTUs) were grouped by applying a threshold of 0.97 similarity using the USEARCH algorithm (Caporaso et al., 2010; Edgar, 2010). Finally, the OTUs were assigned to taxa by the RDP classifier based on the Greengenes database (13_5) (Wang et al., 2007).
The bacterial relative abundance data were analyzed using the Kruskal–Wallis test in SAS. The difference in alpha diversity across various pore sizes was assessed using ANOSIM within the QIIME software (Liu et al., 2020). Heatmaps and heatmap diagrams were generated using MicrobiomeAnalyst (Lu et al., 2023).
Data are deposited in the China National Microbiology Data Center (NMDC)1 with accession number NMDC10018589.2
After obtaining a total of 2,041,394 raw sequence reads, with an average of 49,510 reads, we assigned all the reads to 7,168 OTUs. The Chao1 and Shannon indices of alpha diversity in the <0.6 μm fraction were significantly higher, and there were no significant differences in the >0.6 μm fraction (Figures 1A,B).
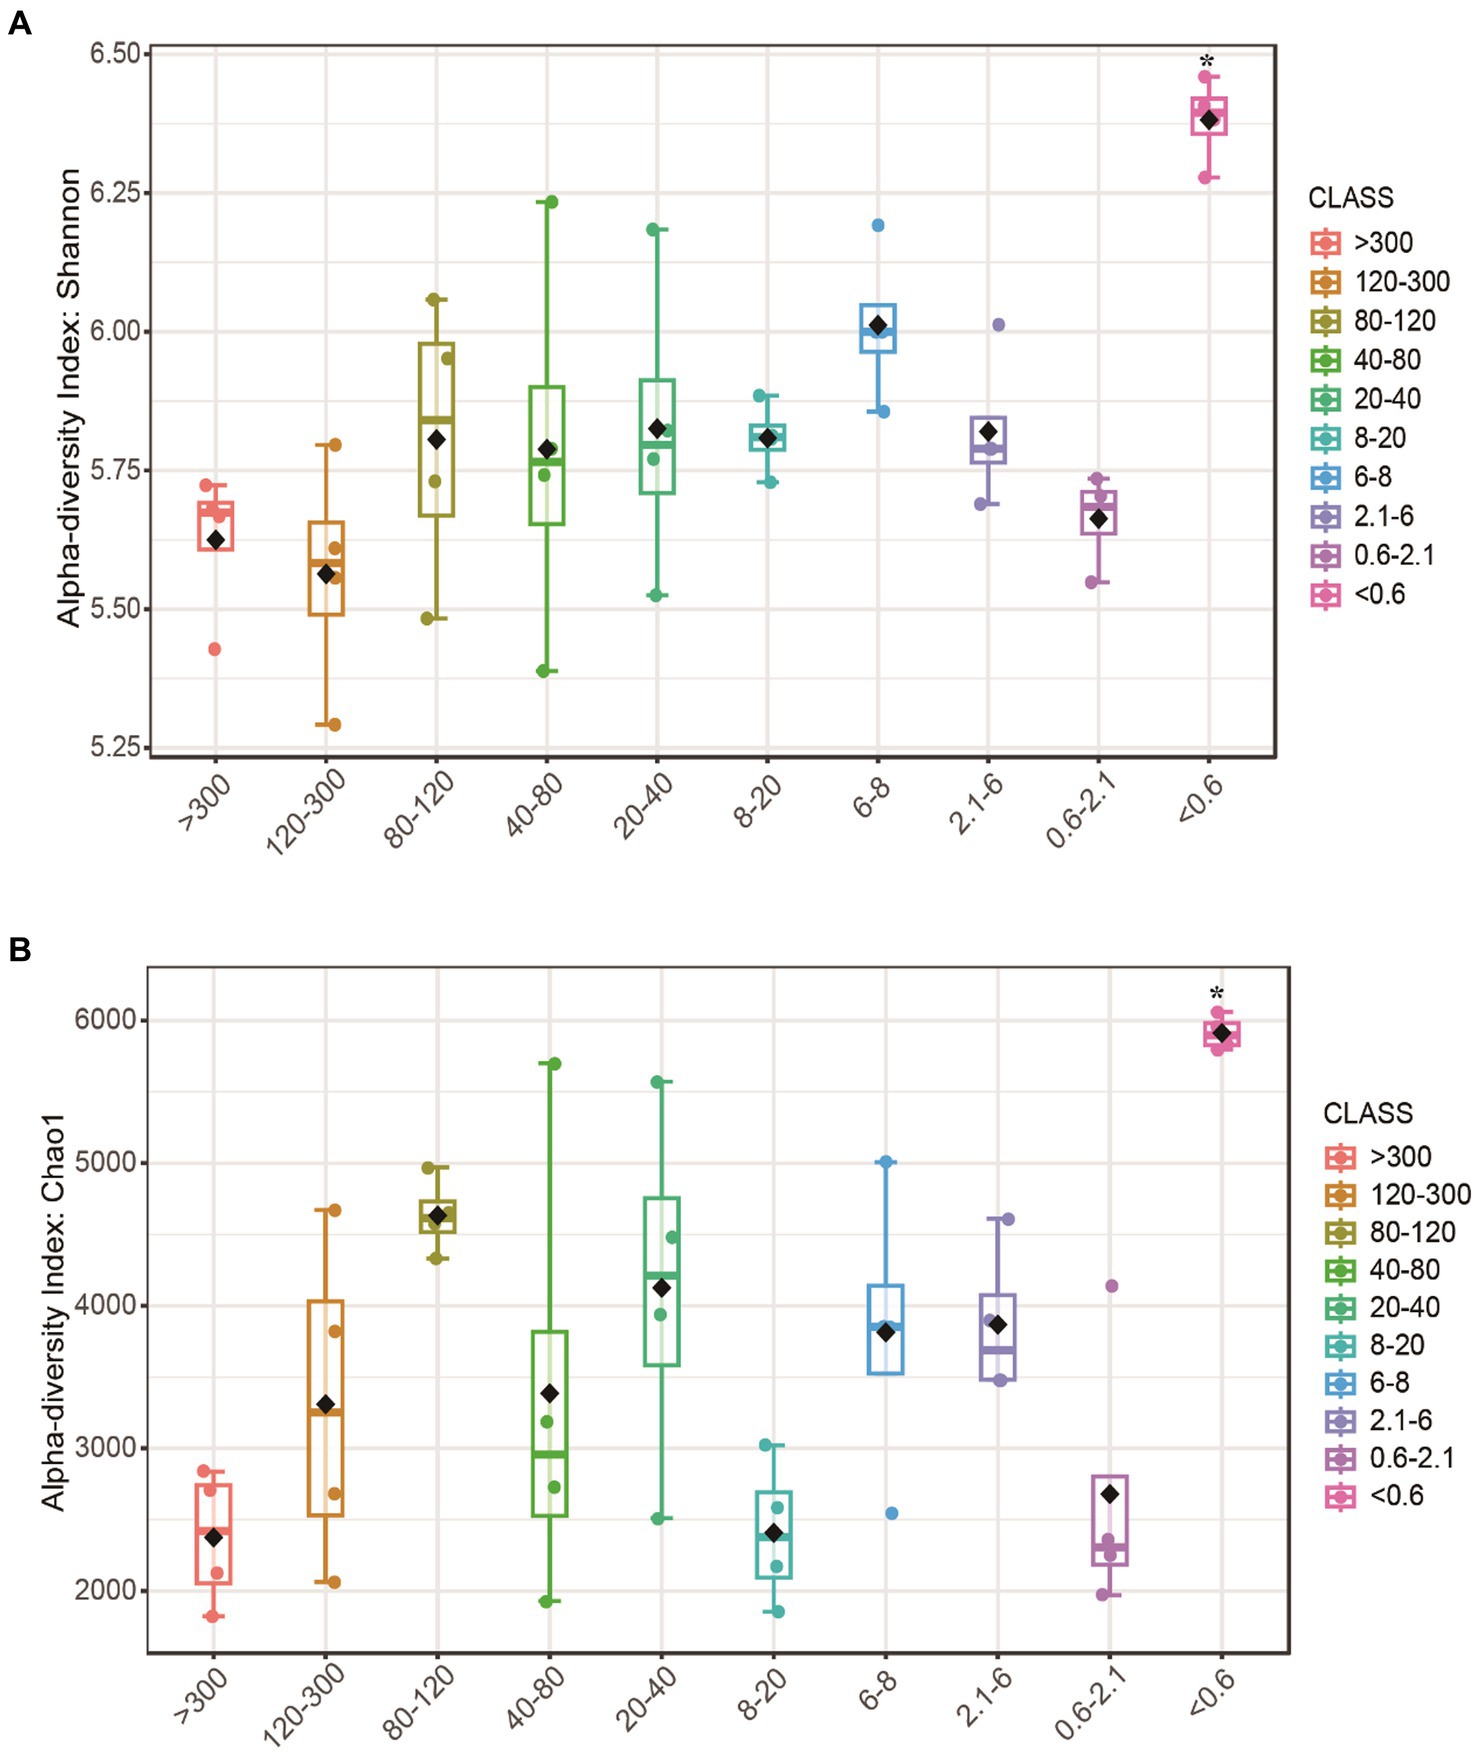
Figure 1. Alpha diversity of bacteria at different pore sizes. (A) Shannon and (B) Chao1 index. Boxplots indicate the first and third quartiles, with the median value indicated as a horizontal line. The whiskers extend to 1.5 times the interquartile range. Asterisk (*) indicates a significant difference.
The bacteria from the various pore sizes were clustered into four branches: >120 μm, 40–120 μm, 6–20 μm, and 20–40 μm, <0.6 μm (Figure 2). The changes in community composition indicate that filtration through different cell sizes could lead to the preliminary differentiation of rumen bacteria.
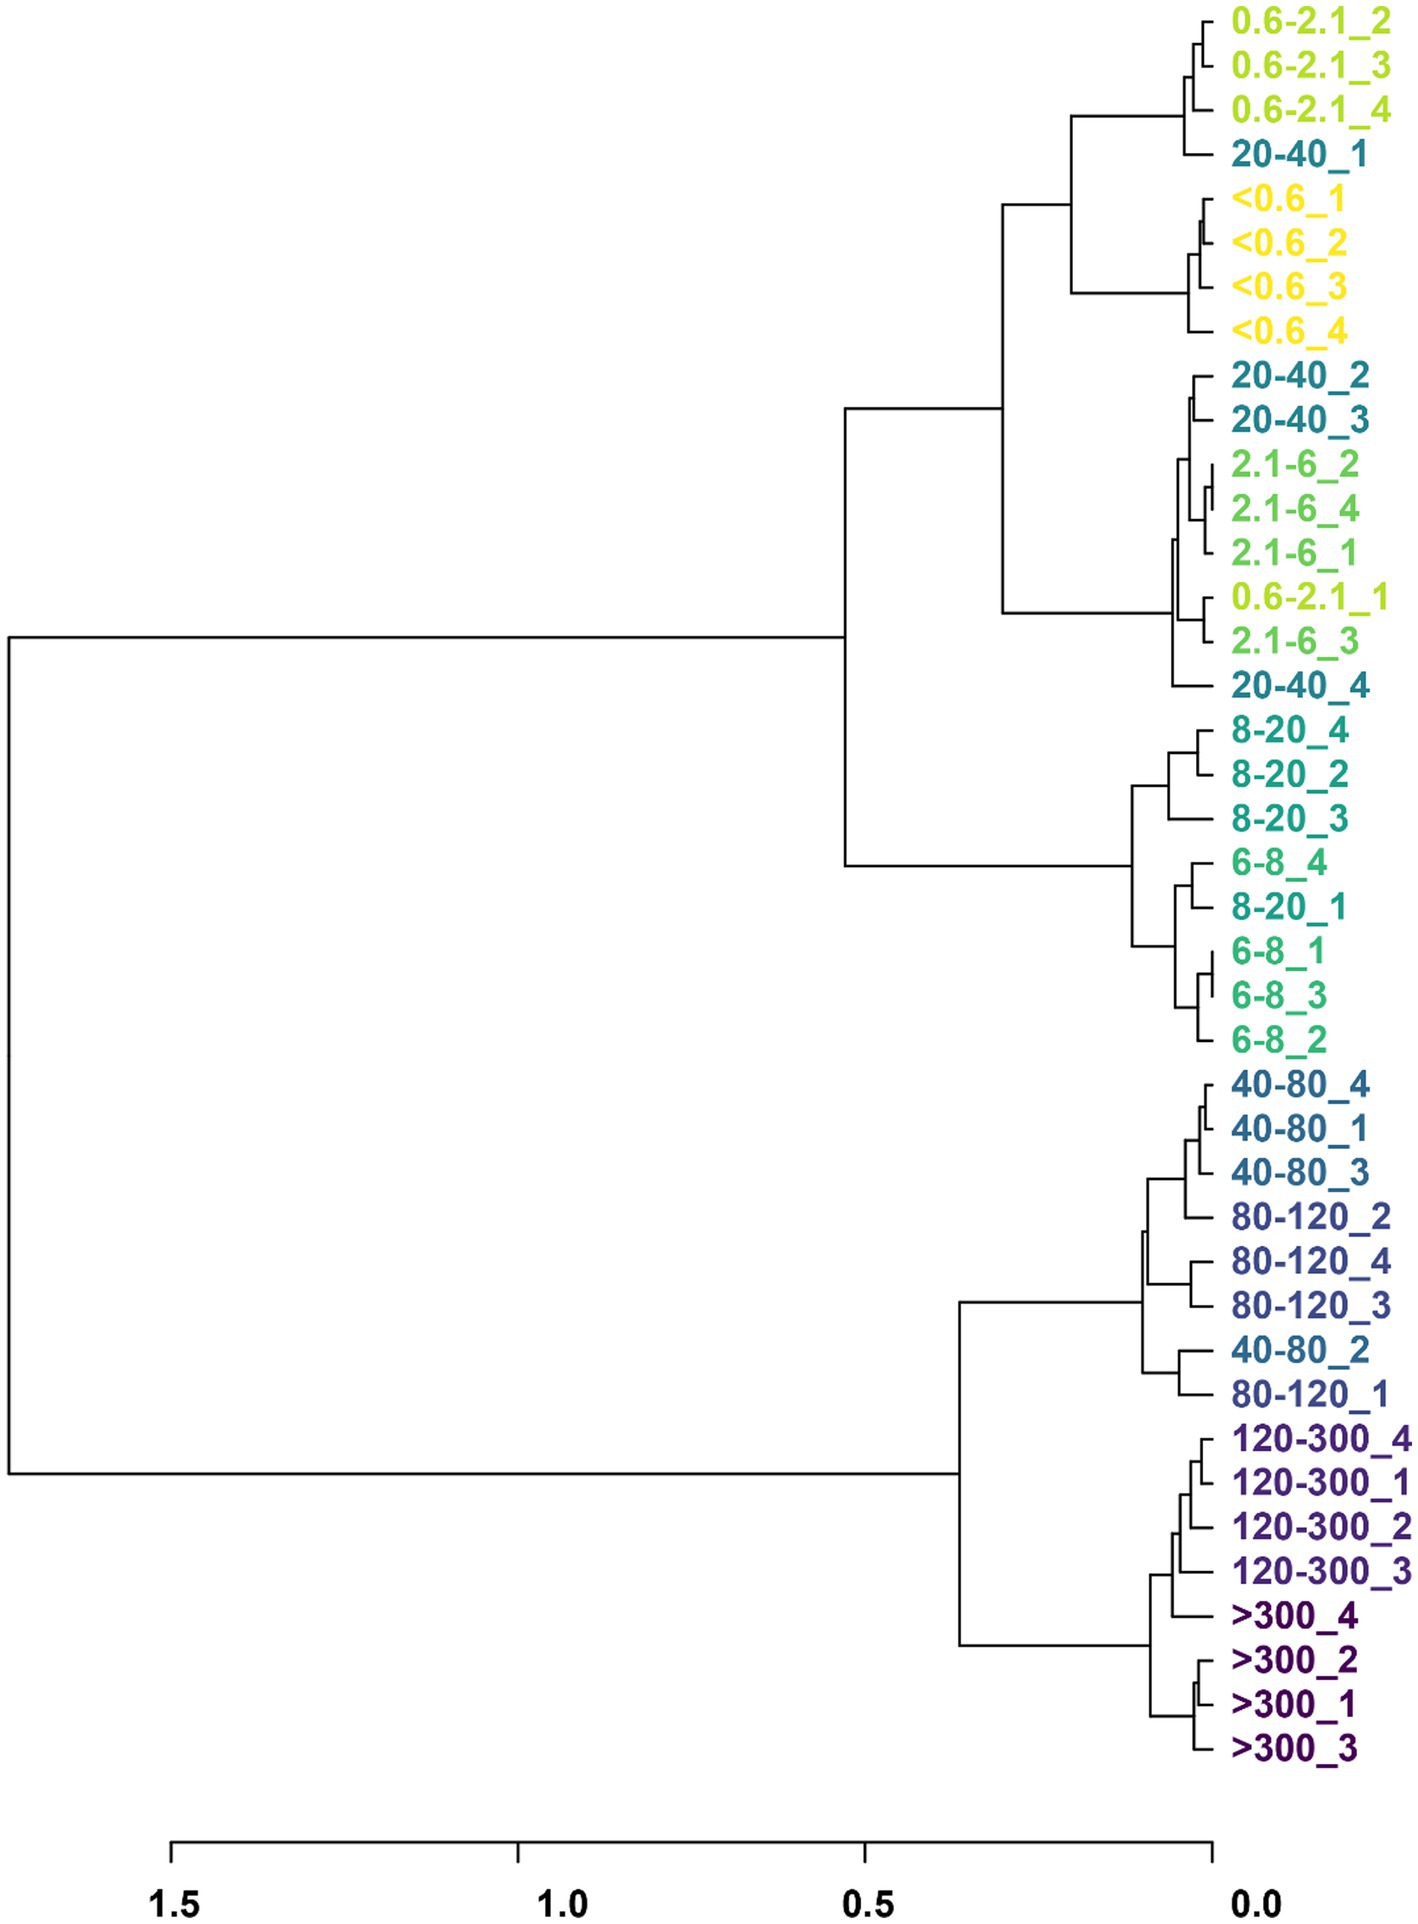
Figure 2. Phylogeny trees based on the bacterial classification and abundance of the cell size. Different colors represent different pore sizes, and the numbers following indicate the number of sample repetitions.
The heatmap shows that the filtration method had effects on enriching specific groups of bacteria. The community of relative abundance >1% in the >40 μm fraction was unclassified Bacteria, unclassified Bacteroidetes, unclassified Firmicutes, unclassified Prevotellaceae, unclassified Anaeroplasma, unclassified RF16, unclassified Erysipelotrichaceae, unclassified Mitsuokella, unclassified Butyrivibrio, unclassified Mollicutes, unclassified Oscillospira, unclassified Mogibacteriaceae, unclassified S24_7, D168 Desulfovibrio, unclassified Christensenellaceae, unclassified Moryella, unclassified TM7, and unclassified Ruminococcus (Figure 3A). The 6–20 μm fraction was unclassified TM7, unclassified Ruminococcus, unclassified Coprococcus, unclassified Roseburia, unclassified SR1, unclassified Schwartzia, unclassified Elusimicrobiaceae, unclassified Veillonellaceae, unclassified Gammaproteobacteria, unclassified Prevotella, unclassified Selenomonas, unclassified Oribacterium, unclassified Sutterella, Lachnospira pectinoschiza, unclassified Pseudobutyrivibrio, unclassified Campylobacter, unclassified Shuttleworthia, unclassified Succinivibrio, and unclassified Anaerovibrio (Figure 3A). The <0.6 μm fraction was unclassified Bacteria, unclassified Firmicutes, unclassified Bacteroidetes, unclassified Prevotellaceae, unclassified RF16, unclassified Erysipelotrichaceae, unclassified Mitsuokella, Fibrobacter succinogenes, unclassified Treponema, unclassified Schwartzia, unclassified Elusimicrobiaceae, unclassified Veillonellaceae, unclassified Gammaproteobacteria, unclassified Prevotella, unclassified Selenomona, unclassified Oribacterium, unclassified Sutterella, Lachnospira pectinoschiza, unclassified Pseudobutyrivibrio, unclassified Campylobacter, unclassified Shuttleworthia, unclassified Succinivibrio, and unclassified Anaerovibrio (Figure 3A). The 2.1–6 μm fraction was unclassified Prevotella, Fibrobacter succinogenes, and unclassified Treponema (Figure 3A).
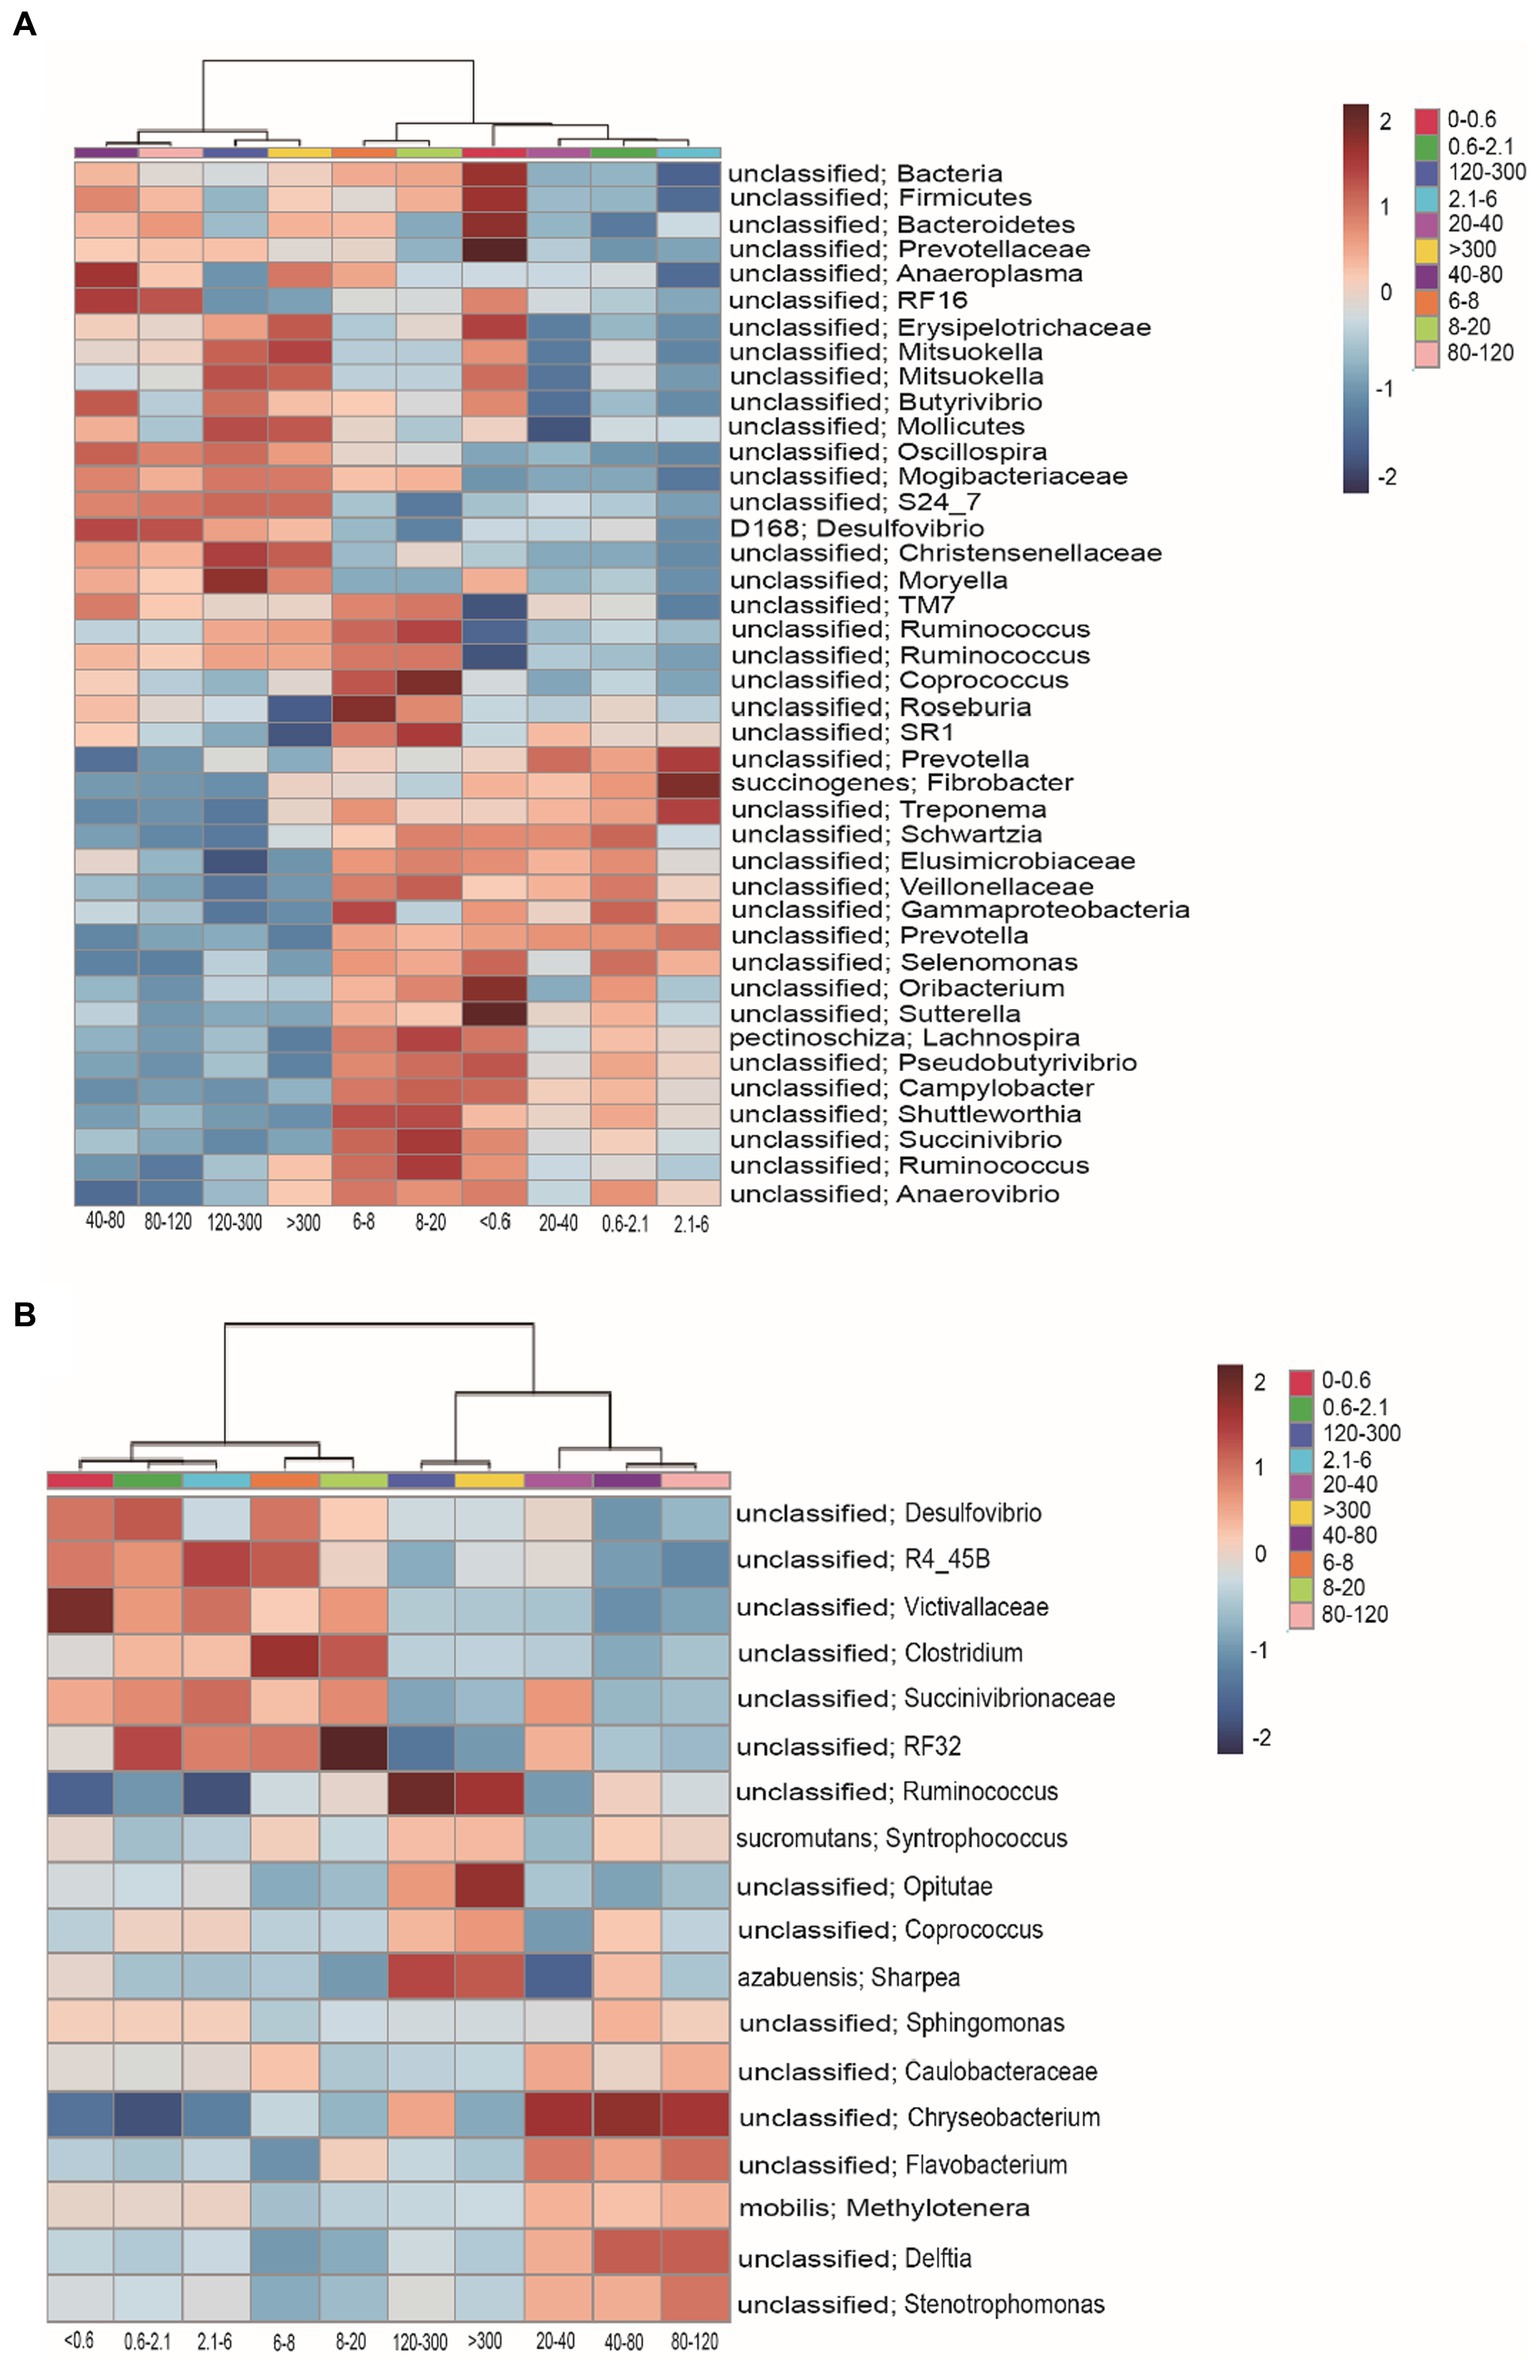
Figure 3. Heatmap shows the relative abundance of bacteria in the rumen of cell size. (A) The relative abundance of bacteria was >0.1% and (B) the relative abundance of bacteria was <0.1%.
The community of relative abundance <1% in the <20 μm fraction was unclassified Desulfovibrio, unclassified R4_45B, unclassified Victivallaceae, unclassified Clostridium, unclassified Succinivibrionaceae, and unclassified RF32 (Figure 3B). The 20–120 μm fraction was unclassified Sphingomonas, unclassified Caulobacteraceae, unclassified Chryseobacterium, unclassified Flavobacterium, Methylotenera mobilis, unclassified Delftia, and unclassified Stenotrophomonas (Figure 3B). The >120 μm fraction was unclassified Ruminococcus, Syntrophococcus sucromutans, unclassified Opitutae, unclassified Coprococcus, and Sharpea azabuensis (Figure 3B).
The species of unclassified Flavobacterium were enriched in the >6 μm fraction, with significantly higher abundance observed in the 20–120 μm fraction (Figure 4A). The species of unclassified Chryseobacterium were enriched in the 6–300 μm fraction, with significantly higher abundance observed in the 20–40 μm and 80–120 μm fractions (Figure 4B). The species of unclassified Delftia were enriched in the >6 μm fraction, with significantly higher abundance observed in the 20–120 μm fraction (Figure 4C). The species of Methylotenera mobilis were enriched in the 20–300 μm fraction, with significantly higher abundance observed in the 20–120 μm fraction (Figure 4D). The species of unclassified Caulobacteraceae were not enriched in the 2.1–6 μm fraction, with significantly higher abundance observed in the 20–40 μm and 80–120 μm fractions (Figure 4E). The species of unclassified Oligella were not enriched in the 2.1–6 μm fraction, with higher abundance observed in the >300 μm fraction (Figure 4F). The species of unclassified Sphingomonas were not enriched in the <0.6 μm, 2.1–6 μm, and 20–40 μm fractions, with significantly higher abundance observed in the 40–120 μm fraction (Figure 4G).
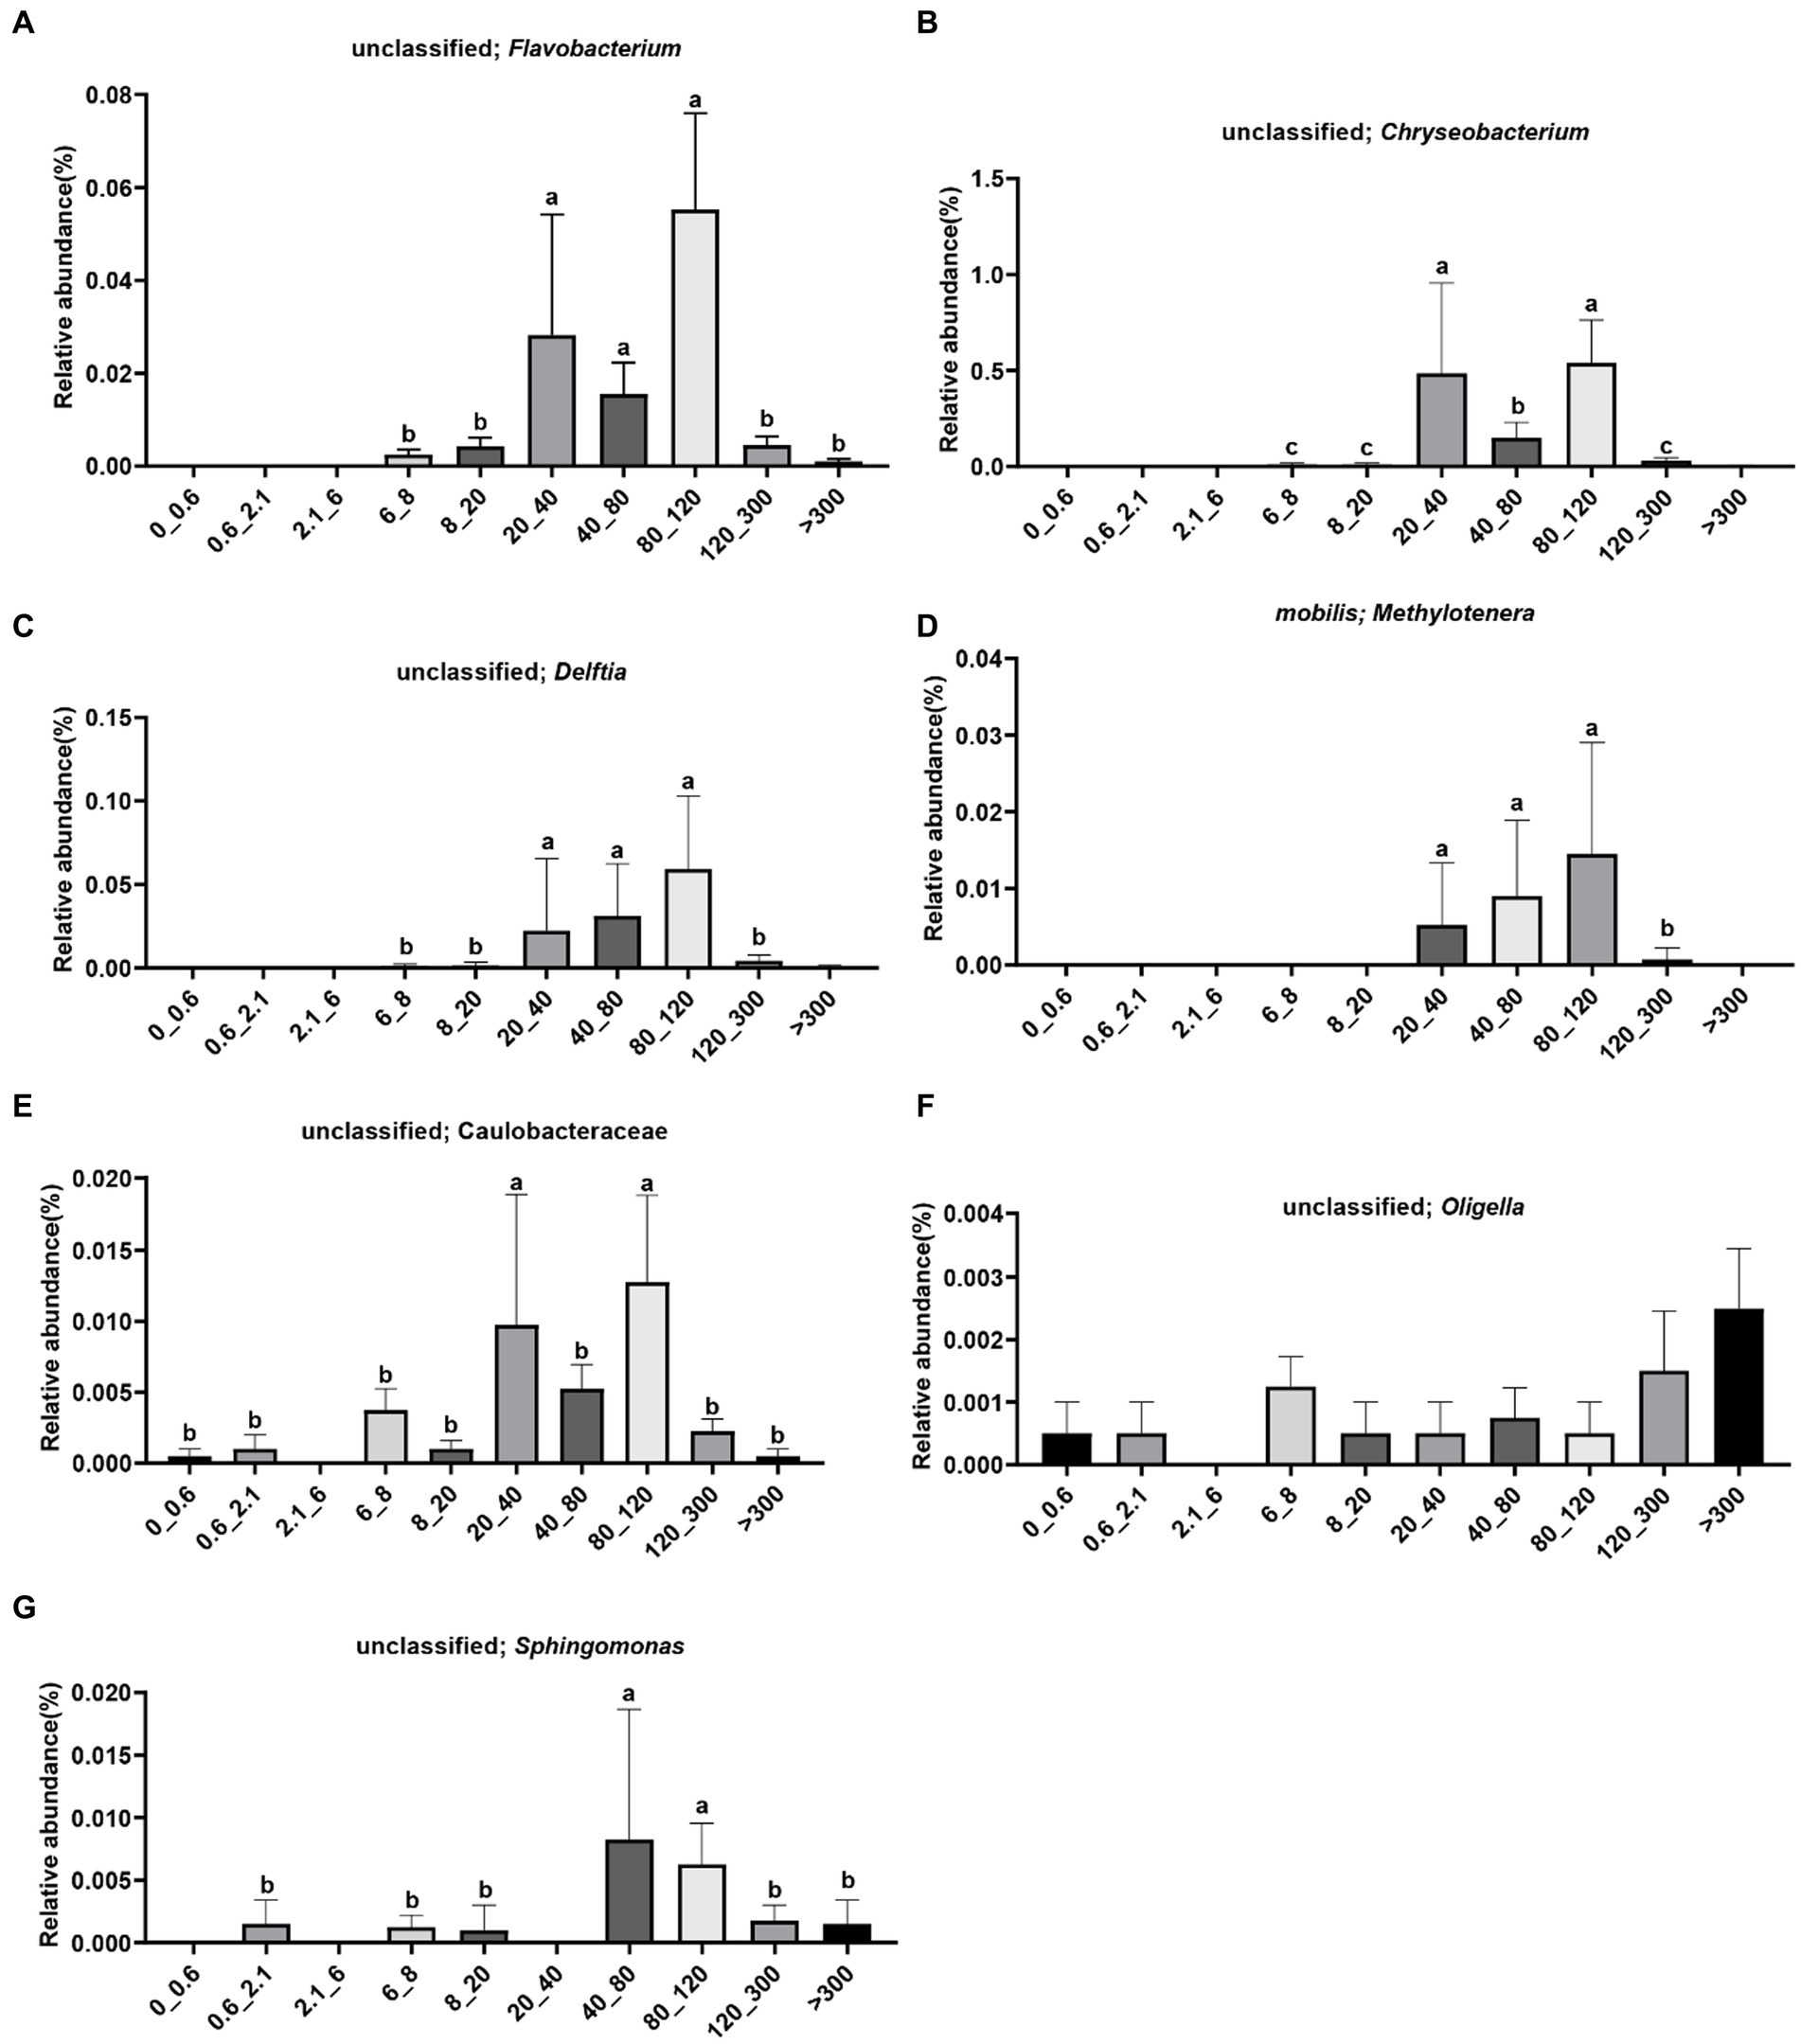
Figure 4. Distribution of bacteria in different pore sizes. (A) Unclassified; Flavobacterium, (B) unclassified; Chryseobacterium, (C) unclassified; Delftia, (D) mobilis; Methylotenera, (E) unclassified; Caulobacteraceae, (F) unclassified; Oligella, (G) unclassified; Sphingomonas. The letters on the pillars indicate a significant difference.
The abundance of unclassified Stenotrophomonas was significantly higher in the 80–120 μm fraction (Figure 5A). The abundance of unclassified Shuttleworthia was significantly higher in the 6–20 μm fraction (Figure 5B). The abundance of unclassified Sutterella was significantly higher in the <0.6 μm fraction (Figure 5C). The abundance of unclassified Alphaproteobacteria was significantly higher in the 8–20 μm fraction (Figure 5D). The abundance of unclassified SR1 was significantly higher in the 8–20 μm fraction (Figure 5E).
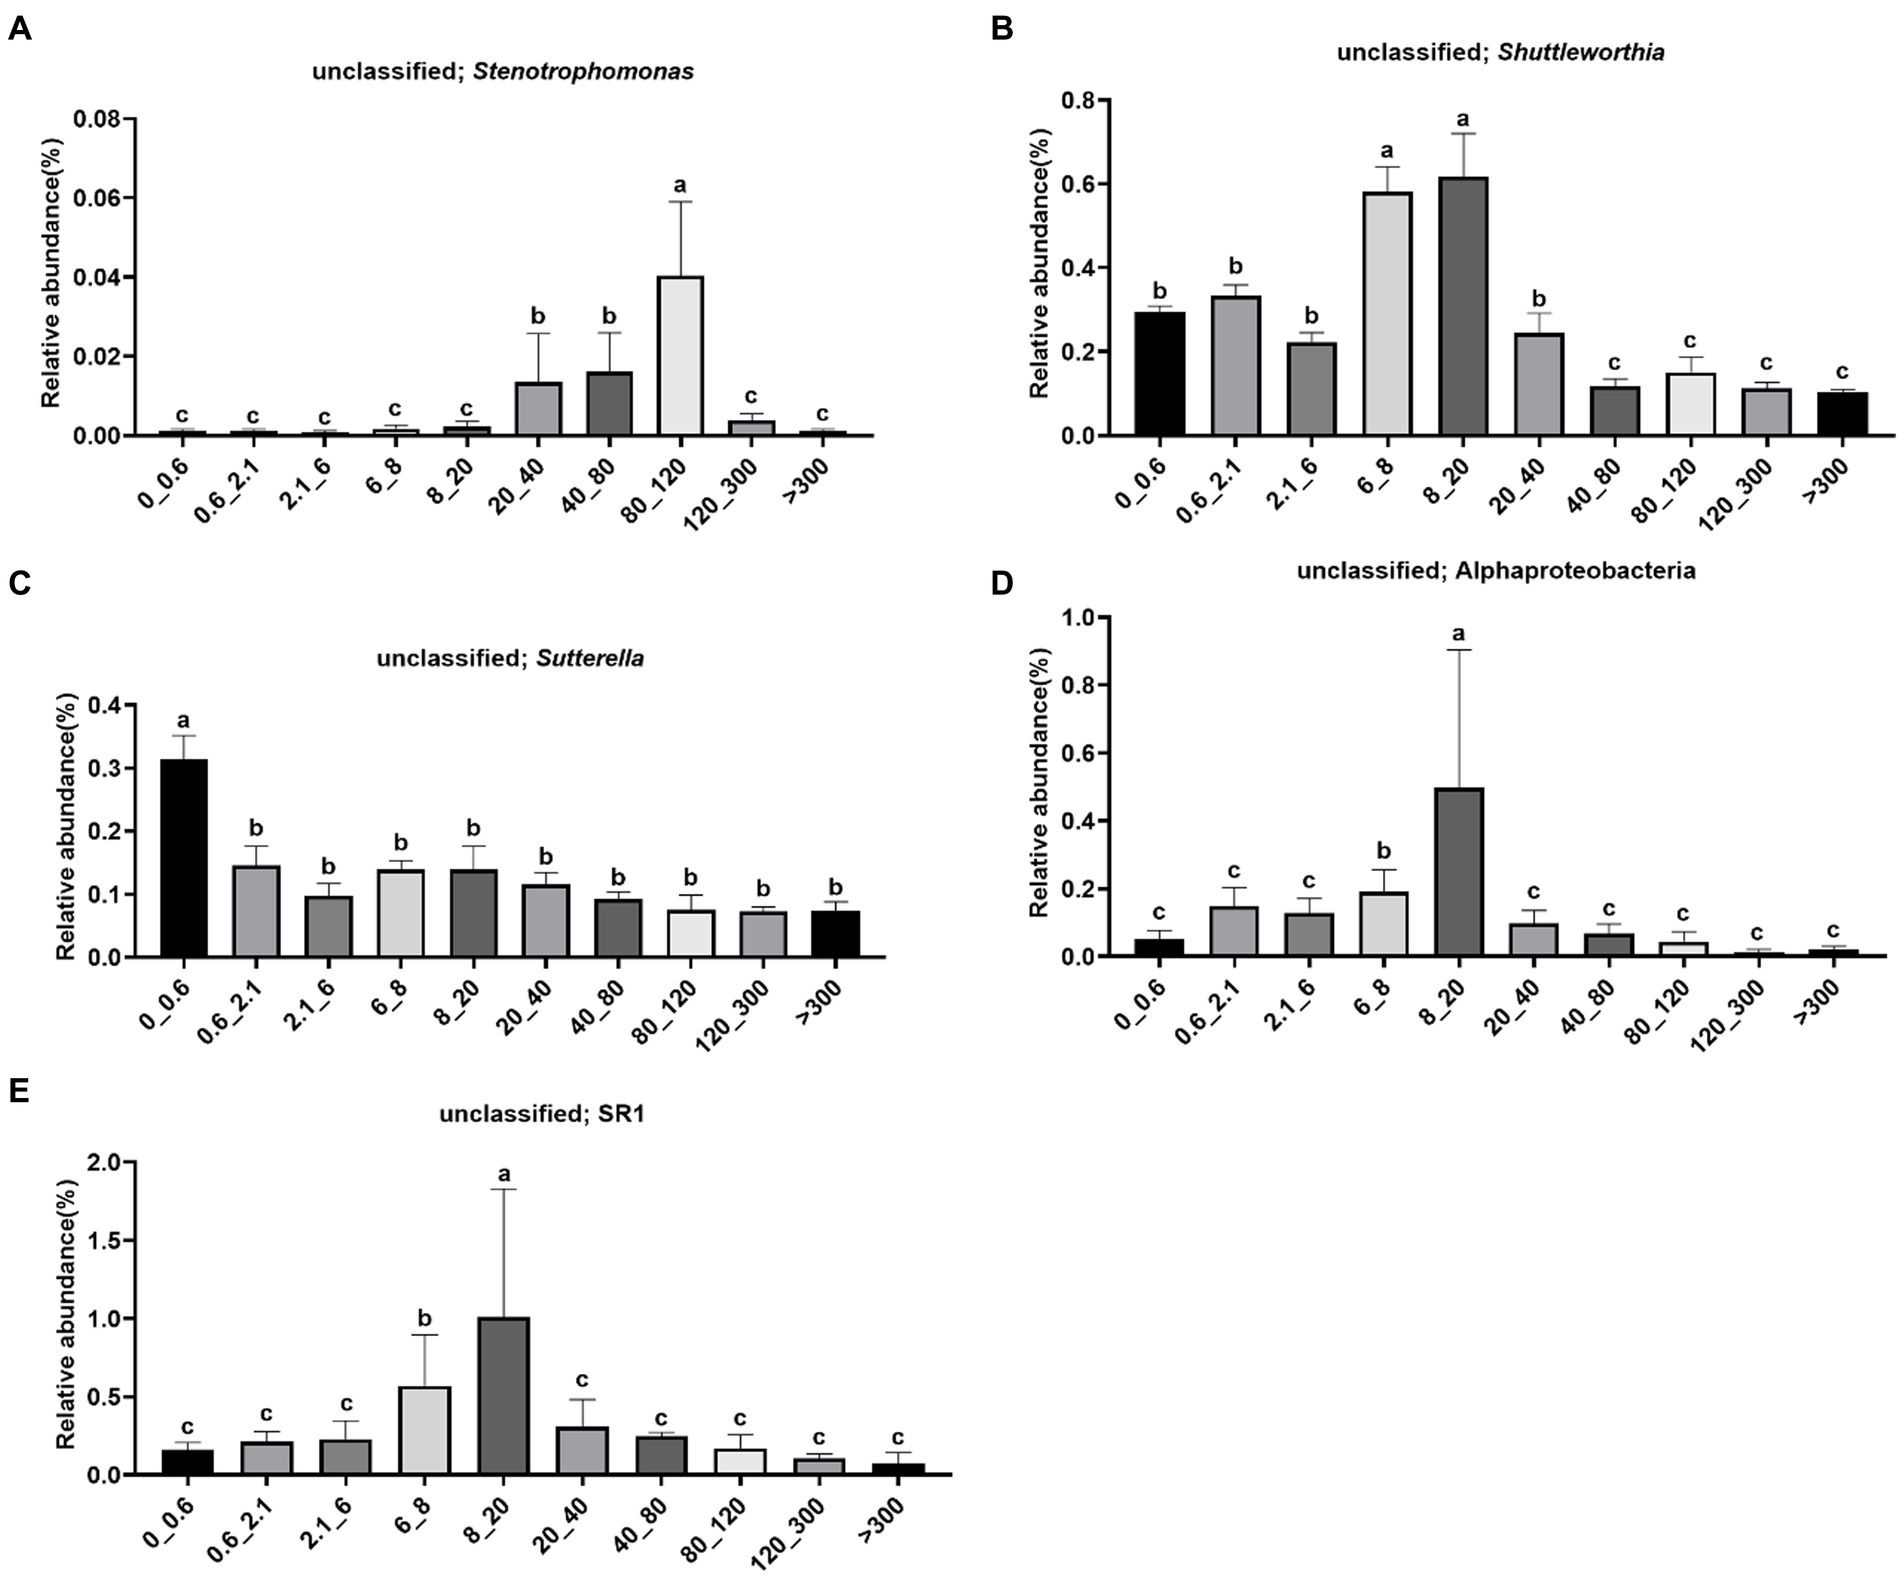
Figure 5. Relative abundance of bacteria in different pore sizes. (A) Unclassified; Stenotrophomonas, (B) unclassified; Shuttleworthia, (C) unclassified; Sutterella, (D) unclassified; Alphaproteobacteria, (E) unclassified; SR1. The letters on the pillars indicate a significant difference.
Ruminal bacterial communities are vast and complex, with only a subset of the species participating in specific functions (Xue et al., 2020; Sun et al., 2021). Therefore, the primary question is to determine which members of the ruminal bacteria community are responsible for specific functions of interest, with the goal of isolating and studying them to regulate their metabolism and improve ruminal production efficiency (Pope et al., 2011). However, effective methods for enriching and isolating rumen microorganisms are currently lacking. In this study, we successfully revealed the relationship between the size and classification of rumen bacteria. The application of this method to enrich interested bacterial groups may provide an opportunity to capture key species in specific metabolic pathways.
Different approaches have been used to decrease the bacterial diversity in complex communities prior to cultivation, including techniques such as filtration, density-gradient centrifugation or elutriation, and serial dilution-to-extinction (Bernard et al., 2000; Vartoukian et al., 2010). Filtration has been widely utilized in numerous studies, establishing itself as a prevalent technique with proven efficacy (Sorokin et al., 2017; Hu et al., 2021). In this study, we used a sequential filtration method that utilized different pore sizes to achieve the separation of different size fractions within the complex ruminal community. Through this method, rumen bacteria were divided into four clusters corresponding to different cell sizes, and the diversity was reduced, which indicates filtration is more suitable for further enrichment before bacteria isolation and cultivation.
Some studies revealed that Prevotella, Butyrivibrio, and Ruminococcus were the dominant bacterial groups in the rumen using sequencing technology (Henderson et al., 2015; Matthews et al., 2019). As the largest number of bacteria in the rumen, they have great genetic differences among species, which is closely related to healthy rumen metabolism (La Reau et al., 2016; Palevich et al., 2019; Dao et al., 2021; Betancur-Murillo et al., 2022). However, these dominant groups cannot be effectively separated from each other by cell size. One potential explanation is that cell aggregates may form either autonomously or through alternative mechanisms of adhesion to diverse cellular entities (Kubo et al., 2012; Garrison and Bochdansky, 2015). Only some rare and unclassified species can be efficiently enriched or separated by cell size. Most of the groups we identified were unclassified, potentially due to limitations in accurately assigning taxonomy using commonly targeted 16S sub-regions compared to sequencing the full 16S gene or metagenome (Johnson et al., 2019). With the continuous development of sequencing technology and the reduction in costs, the use of metagenomic sequencing or third-generation sequencing technology in the future may be able to address this issue.
Taken together, our results illustrate that although the most interesting bacteria cannot be targeted based on cell size in the rumen, we can enrich the targeted group through filtration. Additionally, when combined with a specific method, such as Raman-activated cell sorting (Lee et al., 2019) and live-FISH (Batani et al., 2019), or a high-throughput method, for example, culturomics (Mailhe et al., 2018) and iChip (Nichols et al., 2010), we can effectively isolate bacteria from complex communities and environments.
In this study, we investigated the relationship between the size and classification of rumen bacteria. The results showed that the dominant bacterial groups could not be effectively separated from each other based on cell size alone. A small proportion of rare unclassified bacterial groups could be efficiently enriched or separated by cell size, which may enhance our ability to isolate, culture, and characterize specific microorganisms from the rumen in future studies.
The datasets presented in this study can be found in online repositories. The names of the repository/repositories and accession number(s) can be found at: https://nmdc.cn/resource/genomics/project/detail/NMDC10018589, NMDC10018589.
SL: Data curation, Formal analysis, Investigation, Methodology, Writing – original draft. NZ: Resources, Writing – review & editing. JW: Funding acquisition, Supervision, Writing – review & editing. SZ: Investigation, Methodology, Resources, Writing – review & editing.
The author(s) declare financial support was received for the research, authorship, and/or publication of this article. This work was supported by the National Key R&D Program of China (2022YFD1301000), the Agricultural Science and Technology Innovation Program (CAAS-ZDRW202308), and the State Key Laboratory of Animal Nutrition and Feeding (2004DA125184G2108).
We thank the dairy farm of IAS for collecting rumen fluid of lactating dairy cows.
The authors declare that the research was conducted in the absence of any commercial or financial relationships that could be construed as a potential conflict of interest.
All claims expressed in this article are solely those of the authors and do not necessarily represent those of their affiliated organizations, or those of the publisher, the editors and the reviewers. Any product that may be evaluated in this article, or claim that may be made by its manufacturer, is not guaranteed or endorsed by the publisher.
Batani, G., Bayer, K., Boge, J., Hentschel, U., and Thomas, T. (2019). Fluorescence in situ hybridization (FISH) and cell sorting of living bacteria. Sci. Rep. 9:18618. doi: 10.1038/s41598-019-55049-2
Bernard, L., Courties, C., Servais, P., Troussellier, M., Petit, M., and Lebaron, P. (2000). Relationships among bacterial cell size, productivity, and genetic diversity in aquatic environments using cell sorting and flow cytometry. Microb. Ecol. 40, 148–158. doi: 10.1007/s002480000046
Betancur-Murillo, C. L., Aguilar-Marín, S. B., and Jovel, J. (2022). Prevotella: a key player in ruminal metabolism. Microorganisms 11:1. doi: 10.3390/microorganisms11010001
Bolger, A. M., Lohse, M., and Usadel, B. (2014). Trimmomatic: a flexible trimmer for Illumina sequence data. Bioinformatics 30, 2114–2120. doi: 10.1093/bioinformatics/btu170
Caporaso, J. G., Kuczynski, J., Stombaugh, J., Bittinger, K., Bushman, F. D., Costello, E. K., et al. (2010). QIIME allows analysis of high-throughput community sequencing data. Nat. Methods 7, 335–336. doi: 10.1038/nmeth.f.303
da Cunha, L. L., Monteiro, H. F., Figueiredo, C. C., Canisso, I. F., Bicalho, R. C., Cardoso, F. C., et al. (2023). Characterization of rumen microbiome and metabolome from oro-esophageal tubing and rumen cannula in Holstein dairy cows. Sci. Rep. 13:5854. doi: 10.1038/s41598-023-33067-5
Dao, T.-K., Do, T.-H., Le, N.-G., Nguyen, H.-D., Nguyen, T.-Q., Le, T.-T.-H., et al. (2021). Understanding the role of Prevotella genus in the digestion of lignocellulose and other substrates in Vietnamese native goats’ rumen by metagenomic deep sequencing. Animals 11:3257. doi: 10.3390/ani11113257
Edgar, R. C. (2010). Search and clustering orders of magnitude faster than BLAST. Bioinformatics 26, 2460–2461. doi: 10.1093/bioinformatics/btq461
Galvez, E. J. C., Iljazovic, A., Amend, L., Lesker, T. R., Renault, T., Thiemann, S., et al. (2020). Distinct polysaccharide utilization determines interspecies competition between intestinal Prevotella spp. Cell Host Microbe 28, 838–852.e6. doi: 10.1016/j.chom.2020.09.012
Garrison, C. E., and Bochdansky, A. B. (2015). A simple separation method for downstream biochemical analysis of aquatic microbes. J. Microbiol. Methods 111, 78–86. doi: 10.1016/j.mimet.2015.01.025
Henderson, G., Cox, F., Ganesh, S., Jonker, A., Young, W., and Janssen, P. H. (2015). Rumen microbial community composition varies with diet and host, but a core microbiome is found across a wide geographical range. Sci. Rep. 5:14567. doi: 10.1038/srep14567
Hu, H., Natarajan, V. P., and Wang, F. (2021). Towards enriching and isolation of uncultivated archaea from marine sediments using a refined combination of conventional microbial cultivation methods. Mar. Life Sci. Technol. 3, 231–242. doi: 10.1007/s42995-021-00092-0
Johnson, J. S., Spakowicz, D. J., Hong, B. Y., Petersen, L. M., Demkowicz, P., Chen, L., et al. (2019). Evaluation of 16S rRNA gene sequencing for species and strain-level microbiome analysis. Nat. Commun. 10:5029. doi: 10.1038/s41467-019-13036-1
Kubo, K., Lloyd, K. G., F Biddle, J., Amann, R., Teske, A., and Knittel, K. (2012). Archaea of the miscellaneous Crenarchaeotal group are abundant, diverse and widespread in marine sediments. ISME J. 6, 1949–1965. doi: 10.1038/ismej.2012.37
Kysela, D. T., Randich, A. M., Caccamo, P. D., and Brun, Y. V. (2016). Diversity takes shape: understanding the mechanistic and adaptive basis of bacterial morphology. PLoS Biol. 14:e1002565. doi: 10.1371/journal.pbio.1002565
La Reau, A. J., Meier-Kolthoff, J. P., and Suen, G. (2016). Sequence-based analysis of the genus Ruminococcus resolves its phylogeny and reveals strong host association. Microb. Genom. 2:e000099. doi: 10.1099/mgen.0.000099
Lee, K. S., Palatinszky, M., Pereira, F. C., Nguyen, J., Fernandez, V. I., Mueller, A. J., et al. (2019). An automated Raman-based platform for the sorting of live cells by functional properties. Nat. Microbiol. 4, 1035–1048. doi: 10.1038/s41564-019-0394-9
Lewis, W. H., Tahon, G., Geesink, P., Sousa, D. Z., and Ettema, T. J. G. (2020). Innovations to culturing the uncultured microbial majority. Nat. Rev. Microbiol. 19, 225–240. doi: 10.1038/s41579-020-00458-8
Li, F., Hitch, T. C. A., Chen, Y., Creevey, C. J., and Guan, L. L. (2019). Comparative metagenomic and metatranscriptomic analyses reveal the breed effect on the rumen microbiome and its associations with feed efficiency in beef cattle. Microbiome 7:6. doi: 10.1186/s40168-019-0618-5
Liu, S., Yu, Z., Zhong, H., Zheng, N., Huws, S., Wang, J., et al. (2023). Functional gene-guided enrichment plus in situ microsphere cultivation enables isolation of new crucial ureolytic bacteria from the rumen of cattle. Microbiome 11:76. doi: 10.1186/s40168-023-01510-4
Liu, S., Zhang, Z., Hailemariam, S., Zheng, N., Wang, M., Zhao, S., et al. (2020). Biochanin a inhibits ruminal nitrogen-metabolizing Bacteria and alleviates the decomposition of amino acids and urea in vitro. Animals 10:368. doi: 10.3390/ani10030368
Lu, Y., Zhou, G., Ewald, J., Pang, Z., Shiri, T., and Xia, J. (2023). MicrobiomeAnalyst 2.0: comprehensive statistical, functional and integrative analysis of microbiome data. Nucleic Acids Res. 51, W310–w318. doi: 10.1093/nar/gkad407
Magoč, T., and Salzberg, S. L. (2011). FLASH: fast length adjustment of short reads to improve genome assemblies. Bioinformatics 27, 2957–2963. doi: 10.1093/bioinformatics/btr507
Mailhe, M., Ricaboni, D., Vitton, V., Gonzalez, J. M., Bachar, D., Dubourg, G., et al. (2018). Repertoire of the gut microbiota from stomach to colon using culturomics and next-generation sequencing. BMC Microbiol. 18:157. doi: 10.1186/s12866-018-1304-7
Matthews, C., Crispie, F., Lewis, E., Reid, M., O'Toole, P. W., and Cotter, P. D. (2019). The rumen microbiome: a crucial consideration when optimising milk and meat production and nitrogen utilisation efficiency. Gut Microbes 10, 115–132. doi: 10.1080/19490976.2018.1505176
Nichols, D., Cahoon, N., Trakhtenberg, E. M., Pham, L., Mehta, A., Belanger, A., et al. (2010). Use of Ichip for high-throughput in situ cultivation of "uncultivable" microbial species. Appl. Environ. Microbiol. 76, 2445–2450. doi: 10.1128/AEM.01754-09
Palevich, N., Kelly, W. J., Leahy, S. C., Denman, S., Altermann, E., Rakonjac, J., et al. (2019). Comparative genomics of rumen Butyrivibrio spp. uncovers a continuum of polysaccharide-degrading capabilities. Appl. Environ. Microbiol. 86:e01993-19. doi: 10.1128/AEM.01993-19
Pope, P. B., Smith, W., Denman, S. E., Tringe, S. G., Barry, K., Hugenholtz, P., et al. (2011). Isolation of Succinivibrionaceae implicated in low methane emissions from Tammar wallabies. Science 333, 646–648. doi: 10.1126/science.1205760
Seshadri, R., Leahy, S. C., Attwood, G. T., Teh, K. H., Lambie, S. C., Cookson, A. L., et al. (2018). Cultivation and sequencing of rumen microbiome members from the Hungate 1000 collection. Nat. Biotechnol. 36, 359–367. doi: 10.1038/nbt.4110
Sorbara, M. T., Littmann, E. R., Fontana, E., Moody, T. U., Kohout, C. E., Gjonbalaj, M., et al. (2020). Functional and genomic variation between human-derived isolates of Lachnospiraceae reveals inter-and intra-species diversity. Cell Host Microbe 28, 134–146.e4. doi: 10.1016/j.chom.2020.05.005
Sorokin, D. Y., Makarova, K. S., Abbas, B., Ferrer, M., Golyshin, P. N., Galinski, E. A., et al. (2017). Discovery of extremely halophilic, methyl-reducing euryarchaea provides insights into the evolutionary origin of methanogenesis. Nat. Microbiol. 2:17081. doi: 10.1038/nmicrobiol.2017.81
Stewart, R. D., Auffret, M. D., Warr, A., Walker, A. W., Roehe, R., and Watson, M. (2019). Compendium of 4,941 rumen metagenome-assembled genomes for rumen microbiome biology and enzyme discovery. Nat. Biotechnol. 37, 953–961. doi: 10.1038/s41587-019-0202-3
Sun, H. Z., Peng, K. L., Xue, M. Y., and Liu, J. X. (2021). Metagenomics analysis revealed the distinctive ruminal microbiome and resistive profiles in dairy buffaloes. Anim. Microbiome 3:44. doi: 10.1186/s42523-021-00103-6
Tian, D., Wang, C., Liu, Y., Zhang, Y., Caliari, A., Lu, H., et al. (2023). Cell sorting-directed selection of bacterial cells in bigger sizes analyzed by imaging flow cytometry during experimental evolution. Int. J. Mol. Sci. 24:3243. doi: 10.3390/ijms24043243
van Teeseling, M. C. F., de Pedro, M. A., and Cava, F. (2017). Determinants of bacterial morphology: from fundamentals to possibilities for antimicrobial targeting. Front. Microbiol. 8:1264. doi: 10.3389/fmicb.2017.01264
Vartoukian, S. R., Palmer, R. M., and Wade, W. G. (2010). Strategies for culture of “unculturable” bacteria. FEMS Microbiol. Lett. 309, 1–7. doi: 10.1111/j.1574-6968.2010.02000.x
Wang, Q., Garrity, G. M., Tiedje, J. M., and Cole, J. R. (2007). Naïve Bayesian classifier for rapid assignment of rRNA sequences into the new bacterial taxonomy. Appl. Environ. Microbiol. 73, 5261–5267. doi: 10.1128/AEM.00062-07
Keywords: rumen, bacteria, cell size, diversity, taxonomy
Citation: Liu S, Zheng N, Wang J and Zhao S (2024) Relationships among bacterial cell size, diversity, and taxonomy in rumen. Front. Microbiol. 15:1376994. doi: 10.3389/fmicb.2024.1376994
Edited by:
Caihong Hu, Zhejiang University, ChinaReviewed by:
Yangchun Cao, Northwest A&F University, ChinaCopyright © 2024 Liu, Zheng, Wang and Zhao. This is an open-access article distributed under the terms of the Creative Commons Attribution License (CC BY). The use, distribution or reproduction in other forums is permitted, provided the original author(s) and the copyright owner(s) are credited and that the original publication in this journal is cited, in accordance with accepted academic practice. No use, distribution or reproduction is permitted which does not comply with these terms.
*Correspondence: Jiaqi Wang, amlhcWl3YW5nQHZpcC4xNjMuY29t; Shengguo Zhao, emhhb3NoZW5nZ3VvMTk4NEAxNjMuY29t
Disclaimer: All claims expressed in this article are solely those of the authors and do not necessarily represent those of their affiliated organizations, or those of the publisher, the editors and the reviewers. Any product that may be evaluated in this article or claim that may be made by its manufacturer is not guaranteed or endorsed by the publisher.
Research integrity at Frontiers
Learn more about the work of our research integrity team to safeguard the quality of each article we publish.