
94% of researchers rate our articles as excellent or good
Learn more about the work of our research integrity team to safeguard the quality of each article we publish.
Find out more
ORIGINAL RESEARCH article
Front. Microbiol., 20 March 2024
Sec. Microbiological Chemistry and Geomicrobiology
Volume 15 - 2024 | https://doi.org/10.3389/fmicb.2024.1367062
This article is part of the Research TopicMicrobial Involvement in Biogeochemical Cycling and Contaminant Transformations at Land-Water EcotonesView all 11 articles
 Wen-Dong Xian1†
 Jinhui Chen1†Zheng Zheng1†Junjie Ding1Yinli Xi1Yiying Zhang1
 Wu Qu1
 Chunyu Tang1
 Changlin Li1Xuezhu Liu1
 Wei Li2
 Jianxin Wang1*
The Yangtze River estuary (YRE) are strongly influenced by the Kuroshio and terrigenous input from rivers, leading to the formation of distinct water masses, however, there remains a limited understanding of the full extent of this influence. Here the variation of water masses and bacterial communities of 58 seawater samples from the YRE and its adjacent waters were investigated. Our findings suggested that there were 5 water masses in the studied area: Black stream (BS), coastal water in the East China Sea (CW), nearshore mixed water (NM), mixed water in the middle and deep layers of the East China Sea (MM), and deep water blocks in the middle of the East China Sea (DM). The CW mass harbors the highest alpha diversity across all layers, whereas the NM mass exhibits higher diversity in the surface layer but lower in the middle layers. Proteobacteria was the most abundant taxa in all water masses, apart from that, in the surface layer masses, Cyanobacterium, Bacteroidota, and Actinobacteriota were the highest proportion in CW, while Bacteroidota and Actinobacteriota were the highest proportion in NM and BS; in the middle layer, Bacteroidota and Actinobacteriota were dominant phylum in CW and BS masses, but Cyanobacterium was main phylum in NM mass; in the bottom layer, Bacteroidota and Actinobacteriota were the dominant phylum in CW, while Marininimicrobia was the dominated phylum in DM and MM masses. Network analysis suggests water masses have obvious influence on community topological characteristics, moreover, community assembly across masses also differ greatly. Taken together, these results emphasized the significant impact of water masses on the bacterial composition, topological characteristics and assembly process, which may provide a theoretical foundation for predicting alterations in microbial communities within estuarine ecosystems under the influence of water masses.
Microorganisms play a crucial role on biochemical cycling and serve as indicators of environmental conditions in marine ecosystems. Microorganisms can survive by gaining energies and nutrients from the geological materials and media (Dong et al., 2022), which including nutrient levels (Arrigo, 2005), oxygenation (Gómez-Plaza and Cano-López, 2011), temperature (Chwastowski et al., 2023), pollution (Rosenberg, 2012), carbon (Soong et al., 2020), nitrogen, carbon, sulfur, iron, and arsenic cycling (Chen et al., 2024). Their abundance and diversity provide valuable insights into nutrient concentrations, oxygen levels, and temperature variations across different oceanic regions (Bianchi et al., 2018). In addition, some microorganisms are particularly sensitive to pollutants, making them useful indicators of ecosystem health (Parmar et al., 2016), some microorganisms may be affected by changes in seawater pH and acidity, making them potential indicators of ocean acidification (Turley and Findlay, 2009a,b). They exhibit substantial abundance, extensive variety, remarkable susceptibility to environmental factors, and always interact with other organisms (Petsch et al., 2001; Torsvik et al., 2002). Additionally, they contribute to regulating marine climate change (Jiao and Azam, 2011) and essential for pollutes converting, nutrient and material circulation of the marine ecosystem, maintaining ecosystem health and alleviating environmental pressure (Zhang W.-C. et al., 2018).
In recent years, there has been a growing scientific interest in understanding the influence of ocean currents in shaping bacterial communities (Skarðhamar et al., 2007; Hsiao et al., 2011). Study by Baltar et al. suggests that hydrological characteristics play an important role in controlling microbial community structure (Baltar and Aristegui, 2017). The hydrological characteristics and distribution of water masses strongly support the idea that the East China Sea (ECS) is a hotspot for marine microbial life, as recently suggested by studies on bacterial, phytoplankton, and zooplankton community compositions (Hsieh et al., 2004; Zhou et al., 2021). The coastal current systems in the Yangtze River estuary (YRE) and its adjacent waters are primarily including the Yangtze River diluted water characterized by low salinity and rich nutrients, as well as the Taiwan warm current (a branch of the Kuroshio) with high salinity but low nutrient content (Li et al., 2014). The Kuroshio also plays a significant role in most hydrodynamic processes in the YRE and its adjacent waters, exerting an important impact on the regional ecological environment, local climate, hydrological conditions, and circulation structure (Guo et al., 2018). According to the conventional perspective (Qi, 2014), The ECS is primarily categorized into three major water systems: the coastal water system, the Kuroshio Water System, and the continental shelf mixed water system., owing to its unique geographical location and complex water systems, the YRE acts as a vital ecological barrier that purifies its flow towards the open sea (Jiang et al., 2017; Yang et al., 2022). The fluctuation process of the water masses in the ECS, the seasonal variation of Taiwan’s warm water, the variability of the Kuroshio flow in the ECS, and the water exchange process on the continental shelf of the ECS influence marine environmental conditions, material transport dynamics, and energy transfer mechanisms within this region. Different water masses would create distinct physical and chemical environments, resulting in differences in microbial communities (Bardgett et al., 2008), however, research on the influence of water masses on the distribution patterns of estuarine microorganisms is limited. Since these ecosystems are typically affected by freshwater outflows and seawater intrusion, it can be hypothesized that the characteristics of the water mass have influences on the diversity of bacteria, species composition, network topology properties, keystone taxa composition, and community aggregation processes in the YRE.
To address the aforementioned hypothesis, we conducted investigations on distribution of water massed and variations of bacterial community based on 58 seawater samples collected from the YRE. 13 environmental factors, Illumina sequencing of bacterial 16S rRNA genes and network analysis were utilized to examine changes in bacterial community following 9 water masses across surface, middle and bottom layers.
Sampling of this study was conducted in August 2021 by the scientific research vessel “Zheyuke 2.” A total of 58 seawater samples from the surface (depth of 1–2 m), middle (depth of 10–35 m), and bottom (within 5 m above the sediment) water columns were collected from 23 sampling stations along the YRE (Figure 1), Only stations with water depths exceeding 20 m were sampled for middle-layer water in this study. All samples were collected using Go-Flo® bottles equipped with conductivity-temperature-depth (CTD) sensors (Sea-Bird Electronics SBE 32). The in situ environmental parameters, including temperature, salinity, pH value, and dissolved oxygen (DO), were directly measured using the CTD sensors. The physical and chemical properties including nitrate (NO3−), nitrite (NO2−), chemical oxygen demand (COD), silicate (SiO42−), phosphate (PO43−), total alkalinity (Alk) concentration and chlorophyll a (Chl-a) were determined following the marine monitoring standards of China (Center, N.M.E.M, 2007), Ammonia nitrogen (NH4+) were analyzed using SmartChem automatic nutrition analyzer (Smartchem 200, Alliance, France). In detail, NO3− concentration was measured using copper cadmium column reduction method, the concentration of NO2− was measured using diazo coupling method, the potassium permanganate titration method was used to determine the COD concentration, the concentration of SiO42− was measured using the silicon molybdenum blue method, the concentration of PO43− was measured using the phosphorus molybdenum blue method, the total Alk concentration was measured using the pH potential drop method, the concentration of Chl a was determined using fluorescence spectrophotometry.
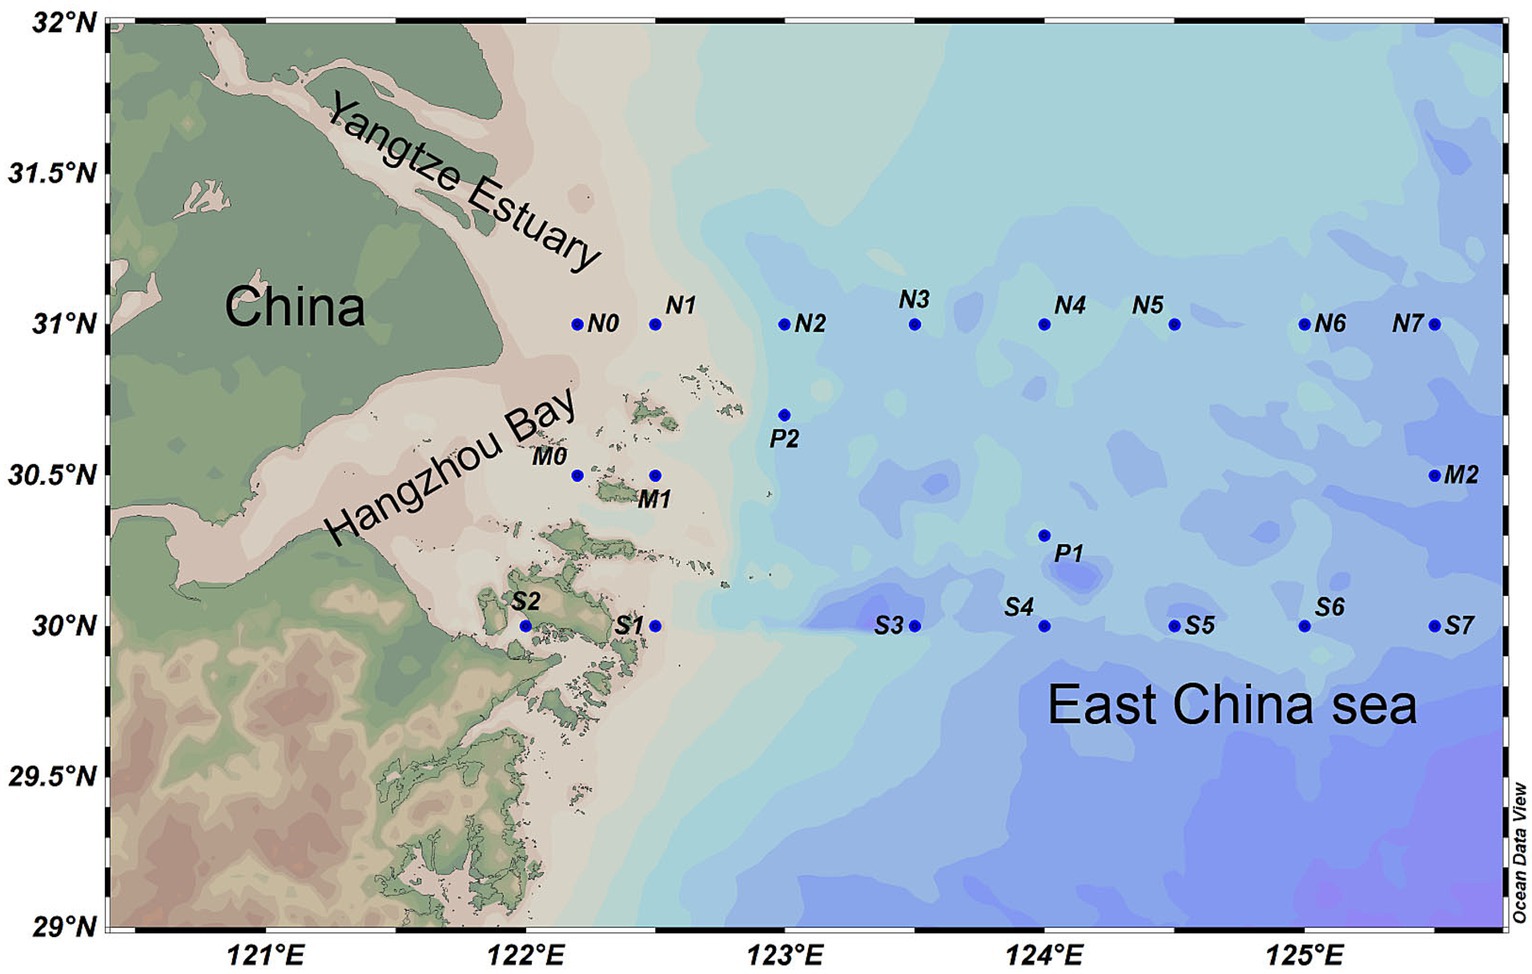
Figure 1. An overview of sampling sites. A total of 58 seawater samples were collected from 23 sampling stations along the YRE. The map was generated with the Ocean Data View (http://odv.awi.de).
Total DNA of each sample was extracted by the PowerSoil DNA isolation Kit (Mo bio, San Diego, CA, United States) according to the instructions. The quality of DNA was evaluated by 1% agarose gel electrophoresis and nanodrop 2000 (Thermo, Waltham, Ma, United States). The v4–v5 regions of the 16S rRNA gene were amplified using the primers 515F (5′-GTGCCAGCMGCGG-3′) and 907R (5′-CCGTCAATTCMTTRAGTTT-3′) (PCR instrument: abigeneamp® Model 9,700). The PCR products were purified with AxyPrepDNA gel recovery kit (Aisijin Biotechnology Co., Ltd.) for library construction, sequencing libraries were generated using Illumina HiSeq Platform, the library quality was assessed on NCBI database, high-throughput sequencing was performed by Majorbio Pharm Technology Co., Ltd. (Shanghai, China) on the Illumina miseq platform.
FLASH (fast length adjustment of short reads) was used to merge the original two terminal sequences (Chen et al., 2018). The original sequences of the paired-end sequencing were processed using the QIIME2 platform (Hall and Beiko, 2018). Primer excision and quality control were performed using vsearch (Rognes et al., 2016). Sequence analyses were performed by QIIME2 with open reference_otus.py, sequences with 97% similarity were assigned to the same ASVs (Caporaso et al., 2010). The SILVA database (v138) (Quast et al., 2012) was used to taxonomic annotation of each ASV based on the RDP classifier (Lan et al., 2012). The ASVs table was generated by mapping the primer removed reads to the representative sequences of ASVs.
The water masses in the continental shelf region usually tend to gather according to variations in both water temperature and salinity (Qiao et al., 2006; Li et al., 2018). Therefore, the “fpc” package in R was utilized to cluster the 58 samples into different groups based on their temperature and salinity (Li et al., 2018). Several packages in R software (Zhang et al., 2019) have been adopted to perform statistical analyses in this study. The “vegan” package (Edgar, 2010) was used for resampling, the “ggplot2” package (Oksanen et al., 2013) was used to generate all figures. “corrplot R” (Wei et al., 2017) package for calculating coefficients and the “picant” package (Wang et al., 2021) for estimation of diversity indices. The Wilcoxon test was used to check community variations between different groups in each water layer. The Bray Curtis distances were calculated using the package “vegan” (Edgar, 2010) with the relative counts of ASVs, and visualized using non metric multidimensional scale analysis (NMDS). Linear multivariate redundancy analysis (RDA) was used to analyze the correlation between bacterial community structure and environmental factors at the ASV level. Community composition maps were visualized using the package of “statnet” (Abdi and Williams, 2010) and “circlize” (Gu et al., 2014). To construct the ecological network of microbial community, we utilized the Conet algorithm in Cytoscape software (v3.9.1). Furthermore, we employed the “rnetcarto” (Doulcier and Stouffer, 2015) package to evaluate the intra-module connectivity (Zi) and inter-module connectivity (Pi) of microbial species, thus enabling the identification of keystone taxa within each community. Neutral models explore microbial taxa abundance through stochastic dispersal, random species formation, and ecological drift (Chen et al., 2019). R2 indicates overall goodness of fit, while m-values represent community-level mobility. Nm-values result from multiplying metacommunity size (N) by m-values. They are used to analyze changes in community composition patterns visually (Zhou et al., 2010a,b).
Samples of surface (20 water samples), middle (20 water samples) and bottom (18 water samples) seawater layers were divided into three categories, respectively (Figure 2). Then, to identify these categories of water sample, the water characteristics was compared with a previous study (Table 1) (Pan et al., 2016). The results showed that the study area can be divided into Black Stream (BS) water mass, coastal water in the East China Sea (CW) water mass, nearshore mixed water (NM) water mass, middle deep mixed water in the East China Sea (MM) water mass, deep-water mass in the middle of East China Sea (DM). Finally, in the surface layer, M0, M1, N0, N1, and N2 were identified as CW mass (T: 26.80°C–29.60°C, S: 7.68–24.93 psu). M2, N4, N5, N6, N7, P1, P2, S3, S4, S5, S6, and S7 were identified as BS mass (T: 27.42°C–28.23°C, S: 32.63–33.53 psu). N3, S1, and S2 were identified as NM mass (T: 26.59°C–27.99°C, S: 25.61–32.48 psu). In the middle layer, N1 were identified as CW mass (T: 26.11°C, S: 24.96 psu). M2, N3, N6, N7, P2, S3, S4, S5, S6, and S7 were identified as NM mass (T: 25.31°C–28.01°C, S: 31.17–33.61 psu). M1, N2, N4, N5, P1, S1, and S2 were identified as BS mass (T: 25.25–28.01°C, S: 27.84–33.61 psu). In the bottom layer, N0, M0, N1, and M1 were identified as CW mass (T: 24.91°C–27.78°C, S: 13.62–32.52 psu). M2, N2, N3, P1, S3, S4, S5, S6, and S7 also were identified as CW mass (T: 20.85°C–26.08°C, S: 20.85°C–36.08°C, S: 20.62–32.52 psu). N2, N3, P1, S3, S4, S5, S6, and S7 were identified as DM mass (T: 20.85°C–26.08°C, S: 33.81–34.30 psu). N5, N6, N7, P2, S1, S2, and N4 were identified as MM mass (T: 20.03°C–26.20°C, S: 29.95–34.24 psu).
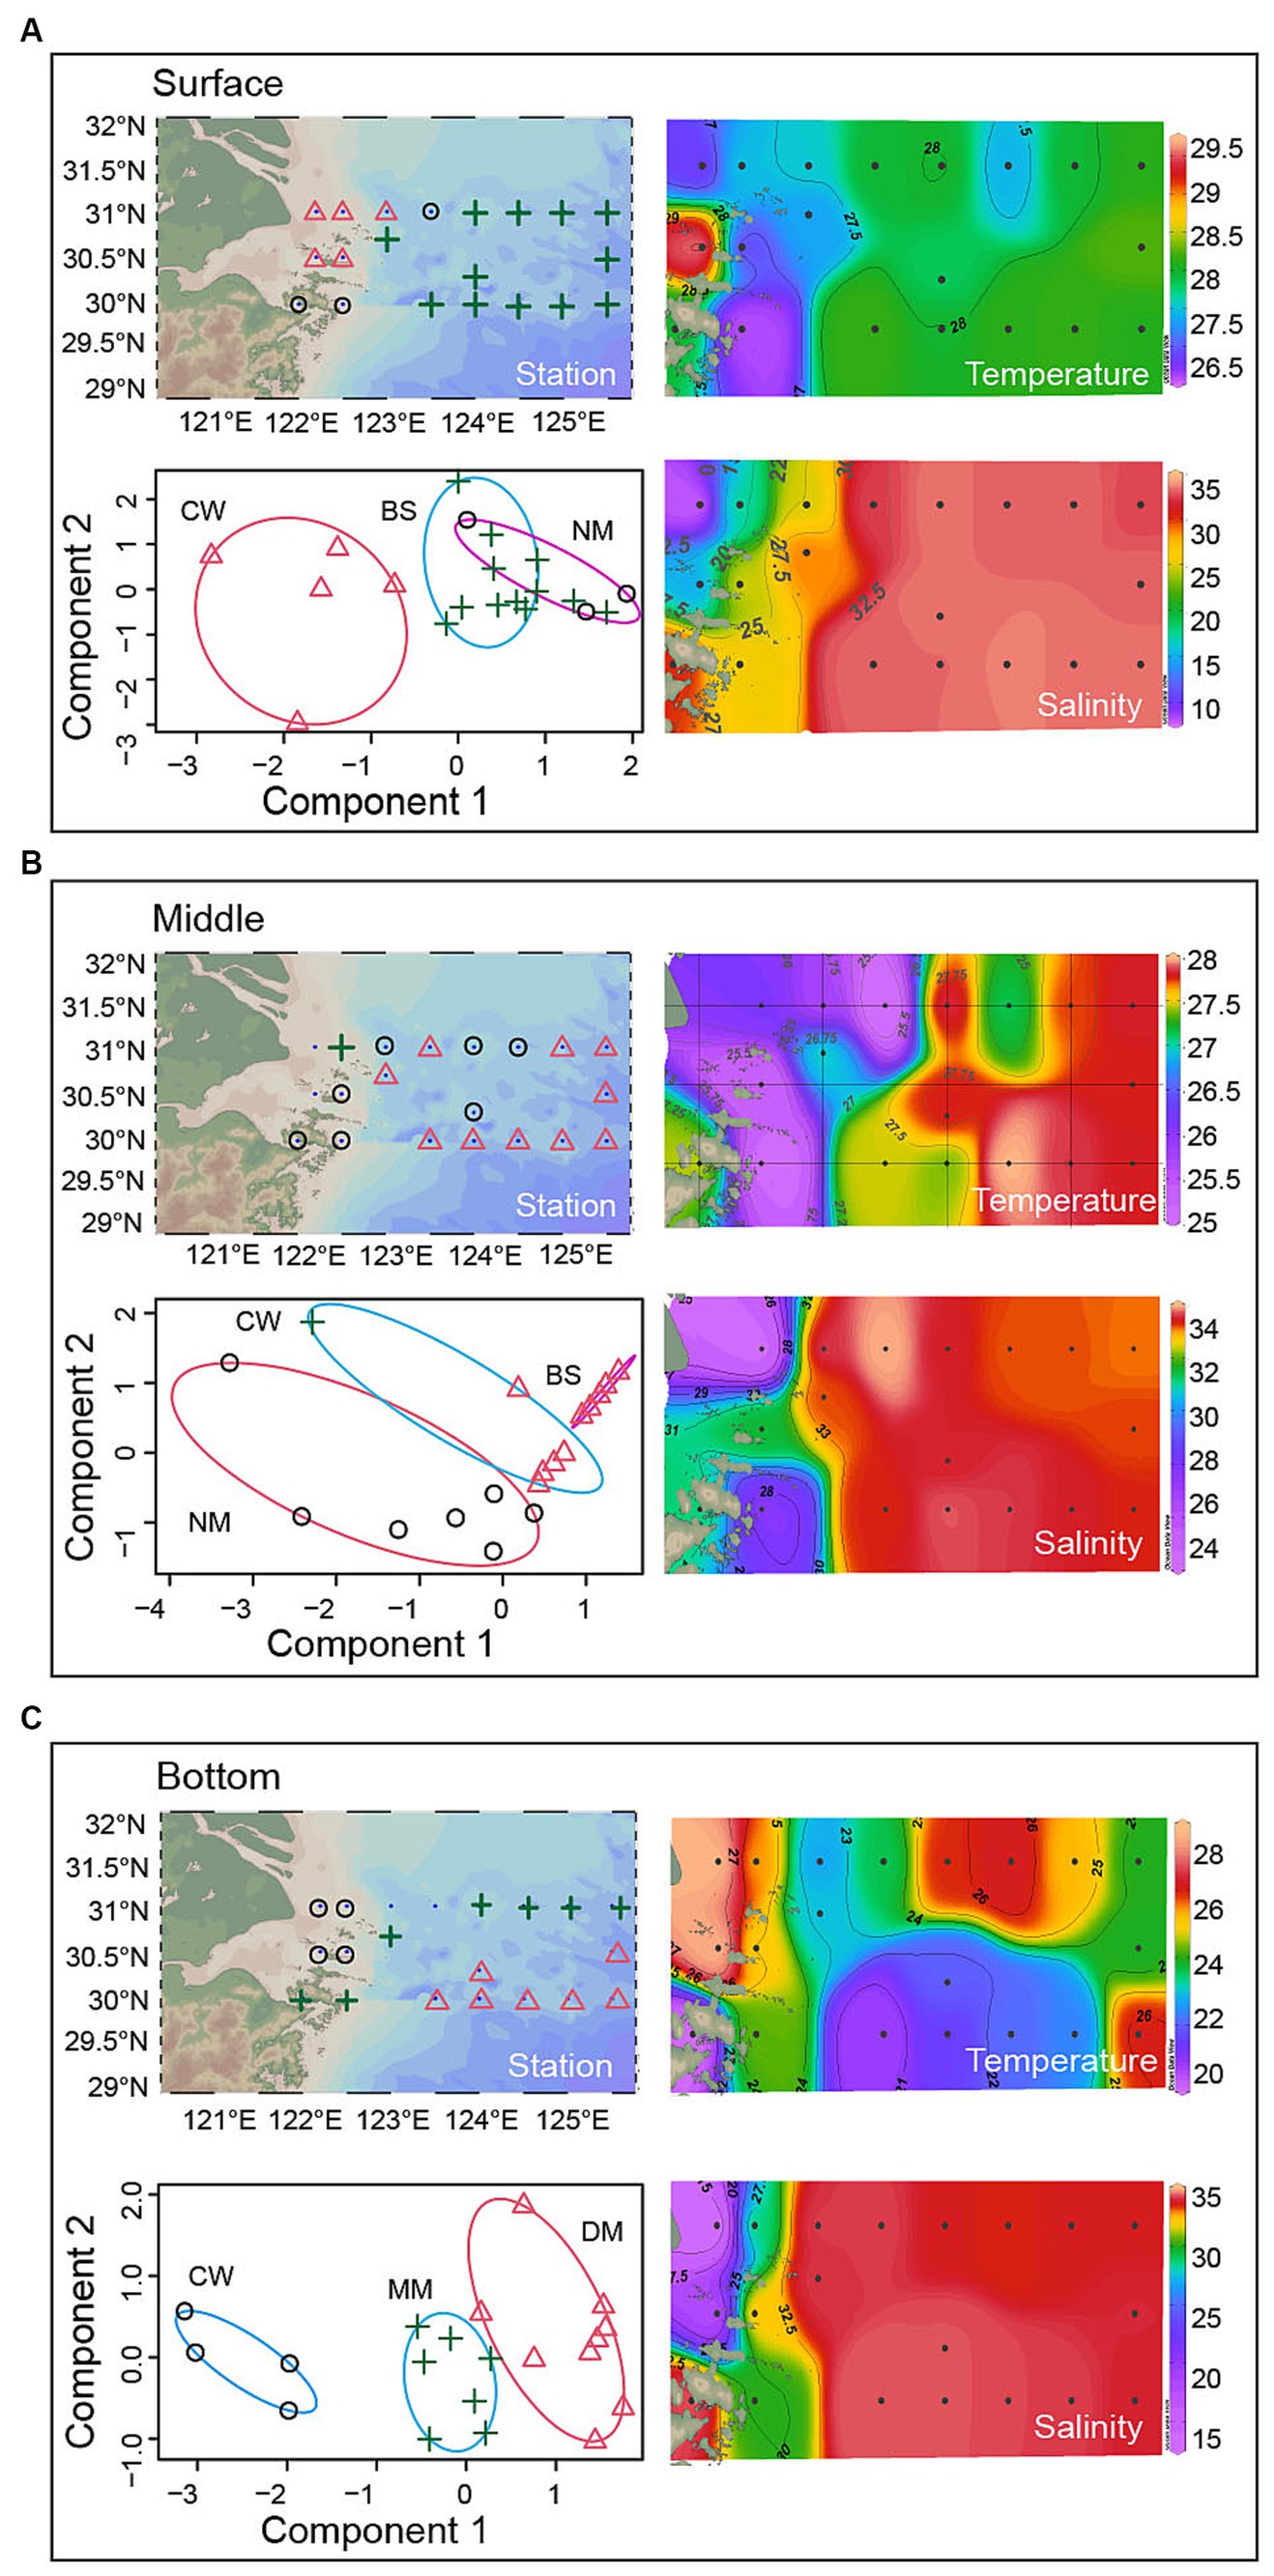
Figure 2. The distribution of water masses across the surface, middle and bottom layers.
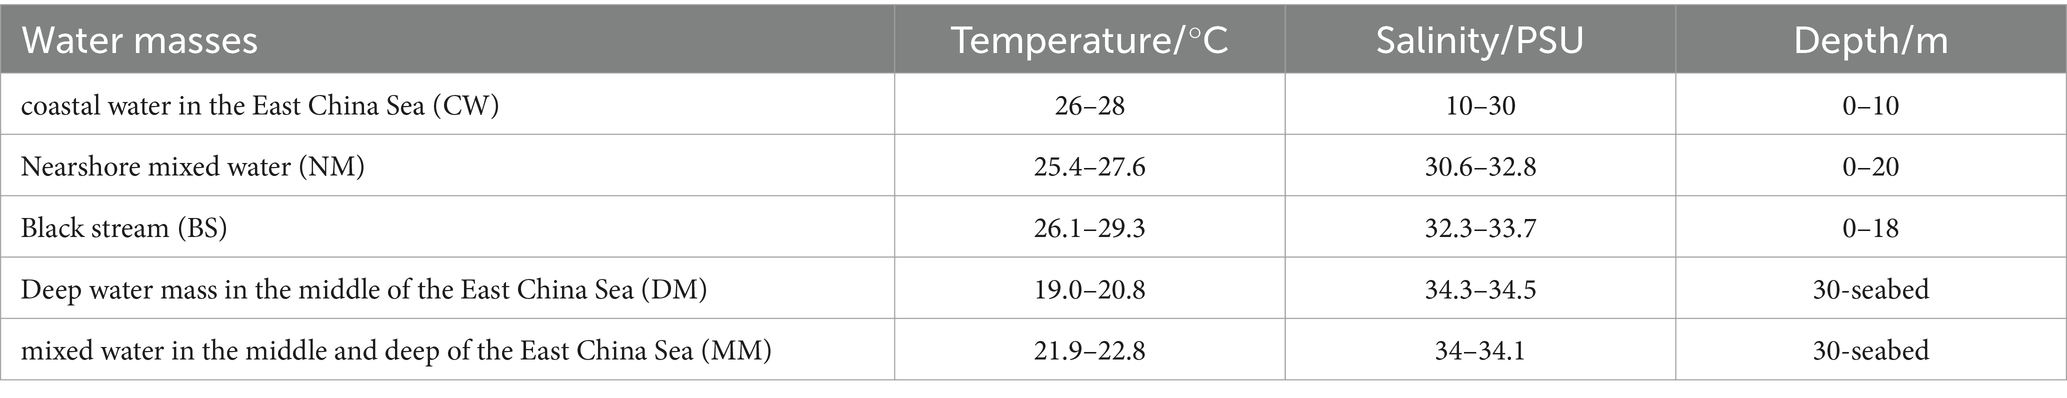
Table 1. Characteristic values of water masses in the YRE and its adjacent waters (Pan et al., 2016).
The alpha diversity indices, including Chao1, Shannon index and ASVs Richness, were calculated among water masses (Figures 3A–I). The results indicate that, all three indices of CW mass community were highest across three layers. Additionally, significant differences (p < 0.01) in the Chao1, Shannon, and Richness index were observed between CW and BS mass in the surface seawater (Figures 3A–C). In the middle layer, differences (p < 0.05) were also observed among the Chao1, Shannon and Richness index between CW and BS mass (Figures 3D–F), moreover, the Shannon index and Richness index exhibit differences (p < 0.05) between BS and NM. In the bottom layer, significant differences (p < 0.05) of Chao1 and Richness index were observed across all water masses, the significant difference (p < 0.05) of Shannon was also observed between CW and DM mass community (Figures 3G–I).
Figure 3. Left panel: alpha diversity indexes of different water layers (B, M, S). The group differences of Chao1 index (A), richness index (B), and Shannon index (C) of different water masses in surface (A–C), meddle (D–F), and bottom (G–I) seawater layers. Asterisks indicate the significance of the difference between the two groups (“***” indicates that the p-value is less than 0.001; “**” indicates that the p-value range is 0.001–0.01; “*” indicates that the p-value range is 0.01–0.05, “ns” indicates that the p-value is greater than 0.05). Right panel: principal coordinate analysis (PCoA) of bacterial communities based on Mountfort distance.
To measure the differences in bacterial composition among samples, the beta diversity index was analyzed. The PCoA analysis based on the Mountford distance indicates a significant difference (R2 = 0.43–0.45; p < 0.05) between bacterial communities among water masses within the same water layer (Figures 3J–L). In detail, the ANOSIM analysis revealed significant differences (R2 = 0.43, p = 0.005) among CW, NM and BS masses in the surface layer (S-CW, S-NM, S-BS). Similarly, significant differences (R2 = 0.44, p < 0.005) were observed among BS, CW, and NM masses in the middle layer (M-S, M-FE, M-M). Additionally, there were significant differences (R2 = 0.45, p < 0.001) among MM, DM and CW masses in the bottom layer (M-MM, M-DM, M-CW).
We conducted redundancy analysis (RDA) to understand the relationship between microbial communities and environmental factors (Figure 4). The RDA results explained 67.2%, 53.7% and 64.1% of the variation in the surface, middle and bottom bacterial communities, respectively. The Mantel test revealed significant correlations between microbial communities in different layers and water masses with 13 environmental variables (Supplementary Table S2). The results indicated that COD, Chl a and NO2− were primary environmental factors significantly affecting community structure (p < 0.05). In the surface layer (Supplementary Table S2). In the middle layer, salinity, DO and temperature were identified as important environmental factors affecting community structure as well (p < 0.05) (Supplementary Table S2). In the bottom layer, COD, DO, Chl a, PO43−, temperature, salinity, DIC were the main environmental factors affecting community structure (p < 0.01) (Supplementary Table S2).
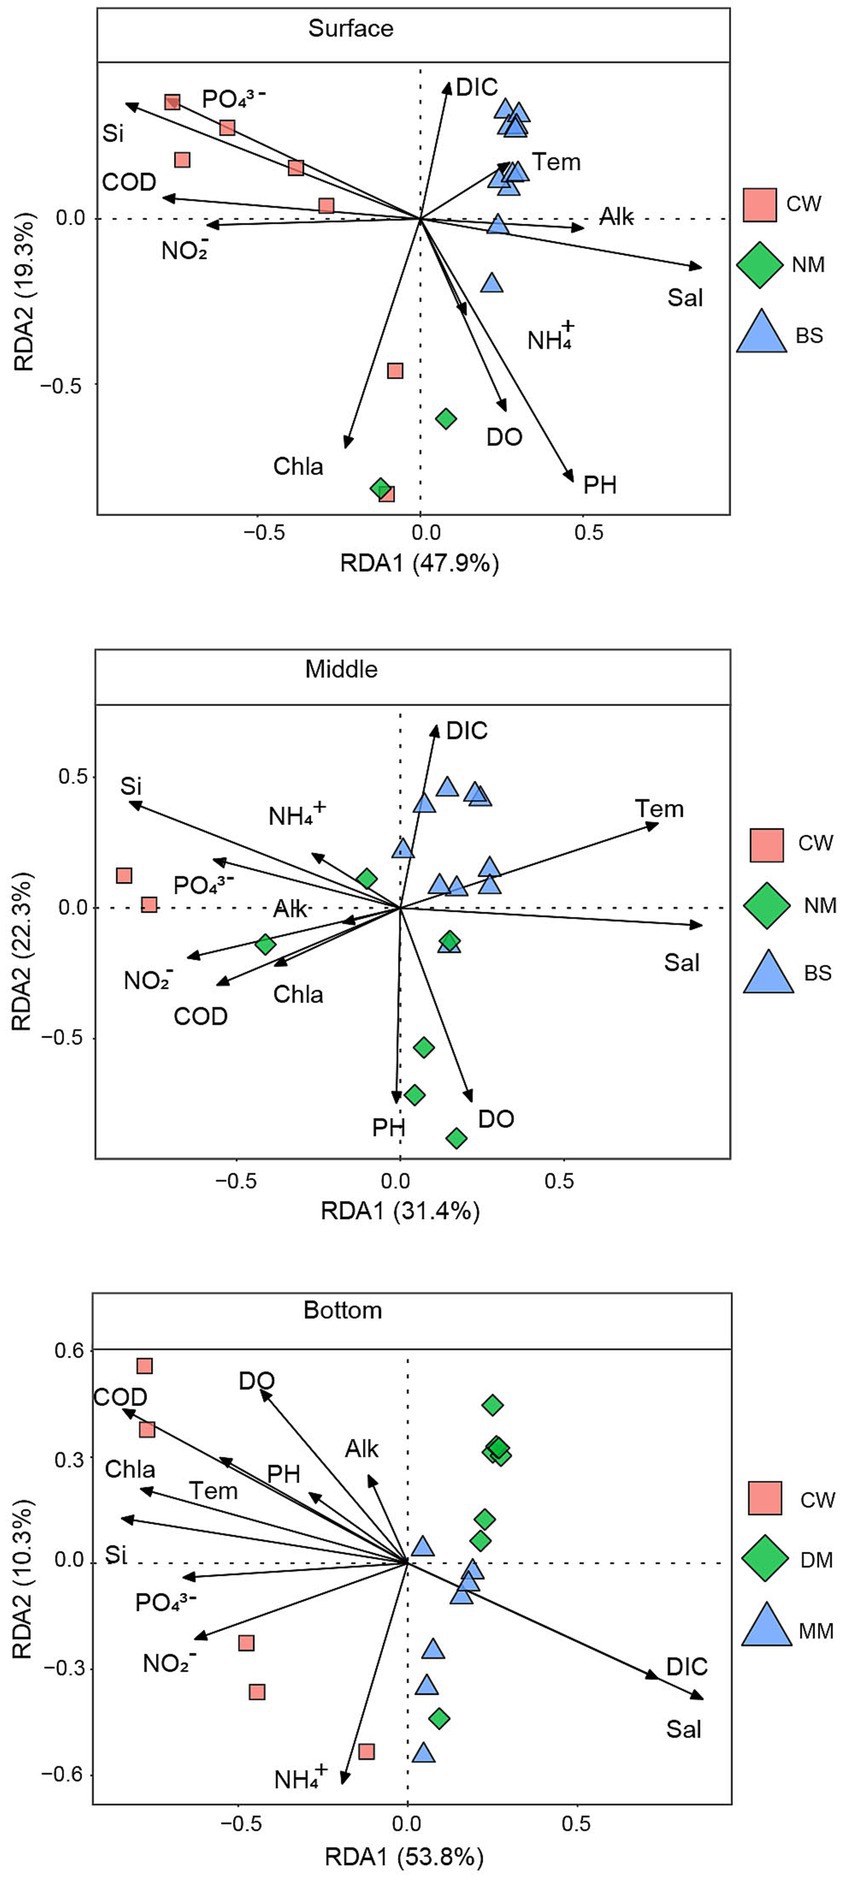
Figure 4. The relationship between environmental factors and the bacterial community.
The distribution of bacterial phyla of different water masses at the surface, middle, and bottom layers were analyzed (Figure 5). Proteobacteria was detected as the dominant bacterial phylum across all nine water masses. In the surface seawater, Cyanobacteria exhibits the highest proportion in BS (25.73%), followed by NM (18.4%) and CW (10.44%), alongside Bacteroidota showing the highest proportion (34.05%) in NM, followed by CW (13.16%) and BS (8.69%). Notably, Actinobacteriota demonstrates varying proportions across 3 water masses, with BS having the highest proportion (12.56%). In contrast, CW displays higher proportions (15.05%) of other bacterial phyla compared to BS (7%) and NM (4.49%) (Figure 5A). In the middle layer, Actinobacteriota emerges as the second most abundant phylum, Actinobacteriota was found in all 3 water masses, with NM having the highest proportion (12.78%), followed by BS (9.81%) and CW (9.59%). The proportion of Cyanobacteria varies across CW, with CW showing a lower proportion (2%) compared to the NM (17.23%) and BS (4.41%), while the proportion of Planctomycota in CW (4.44%) was higher than NM (2.12%) and BS (3.5%), (Figure 5B). In the bottom seawater, the bacterial phyla with high abundance were Bacteroidota, Actinobacteriota, and Marininimicrobia (SAR406_clade). In CW, however, the proportion (1.41%) of Marininimicrobia (SAR406_clade) was lower compared to NM (3.2%) and BS (7.27%) (Figure 5C).
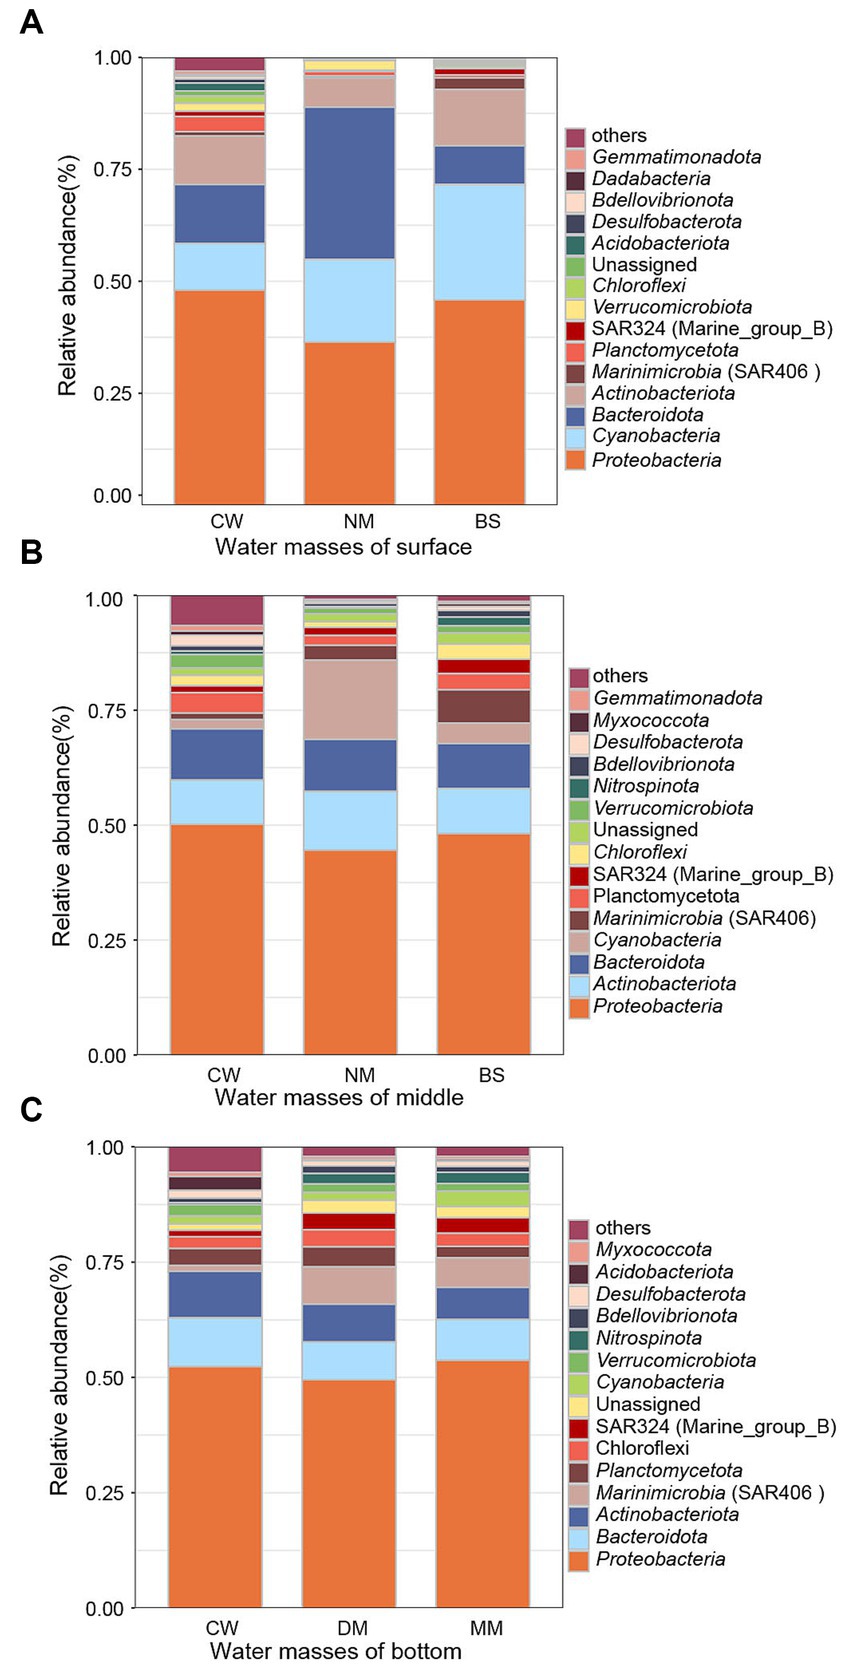
Figure 5. Bacterial community composition. The relative abundances of dominant bacterial phyla in surface (A), middle (B), and bottom (C) seawater community bacteria samples. Others indicate the other phyla except the top 15 in relative abundance in the total samples. BS (Black stream) water mass, CW (coastal water of the East China Sea) water mass, NM (nearshore mixed water) water mass, MM (middle deep mixed water in the East China Sea) water mass, DM (deep-water mass in the middle of the East China Sea) water mass.
To compare the topological characteristics of microbial communities across different water masses, the ecological network was calculated (Table 2). The results of the topological properties were plotted in a columnar stacked graph (Figure 6). The nodes (1121), edges (102948), average degree (183.67), and density (0.16) of network in the S-CW were higher compared to those in other water masses. Moreover, the average path length is lower than that of other water masses. These findings indicate that the network size of this water mass is larger than other masses, with lower separation and higher connectivity. Apart from S-CW, the nodes and edges in the B-MM exhibit highest values compared to other water masses, indicating a larger network size in the B-MM. The average clustering coefficient and average path length in the M-BS were also higher than those of other water masses, suggesting lower separation and greater connectivity. Furthermore, the correlations between nodes across different water masses were predominantly characterized by positive correlations (76.66–96.1%).
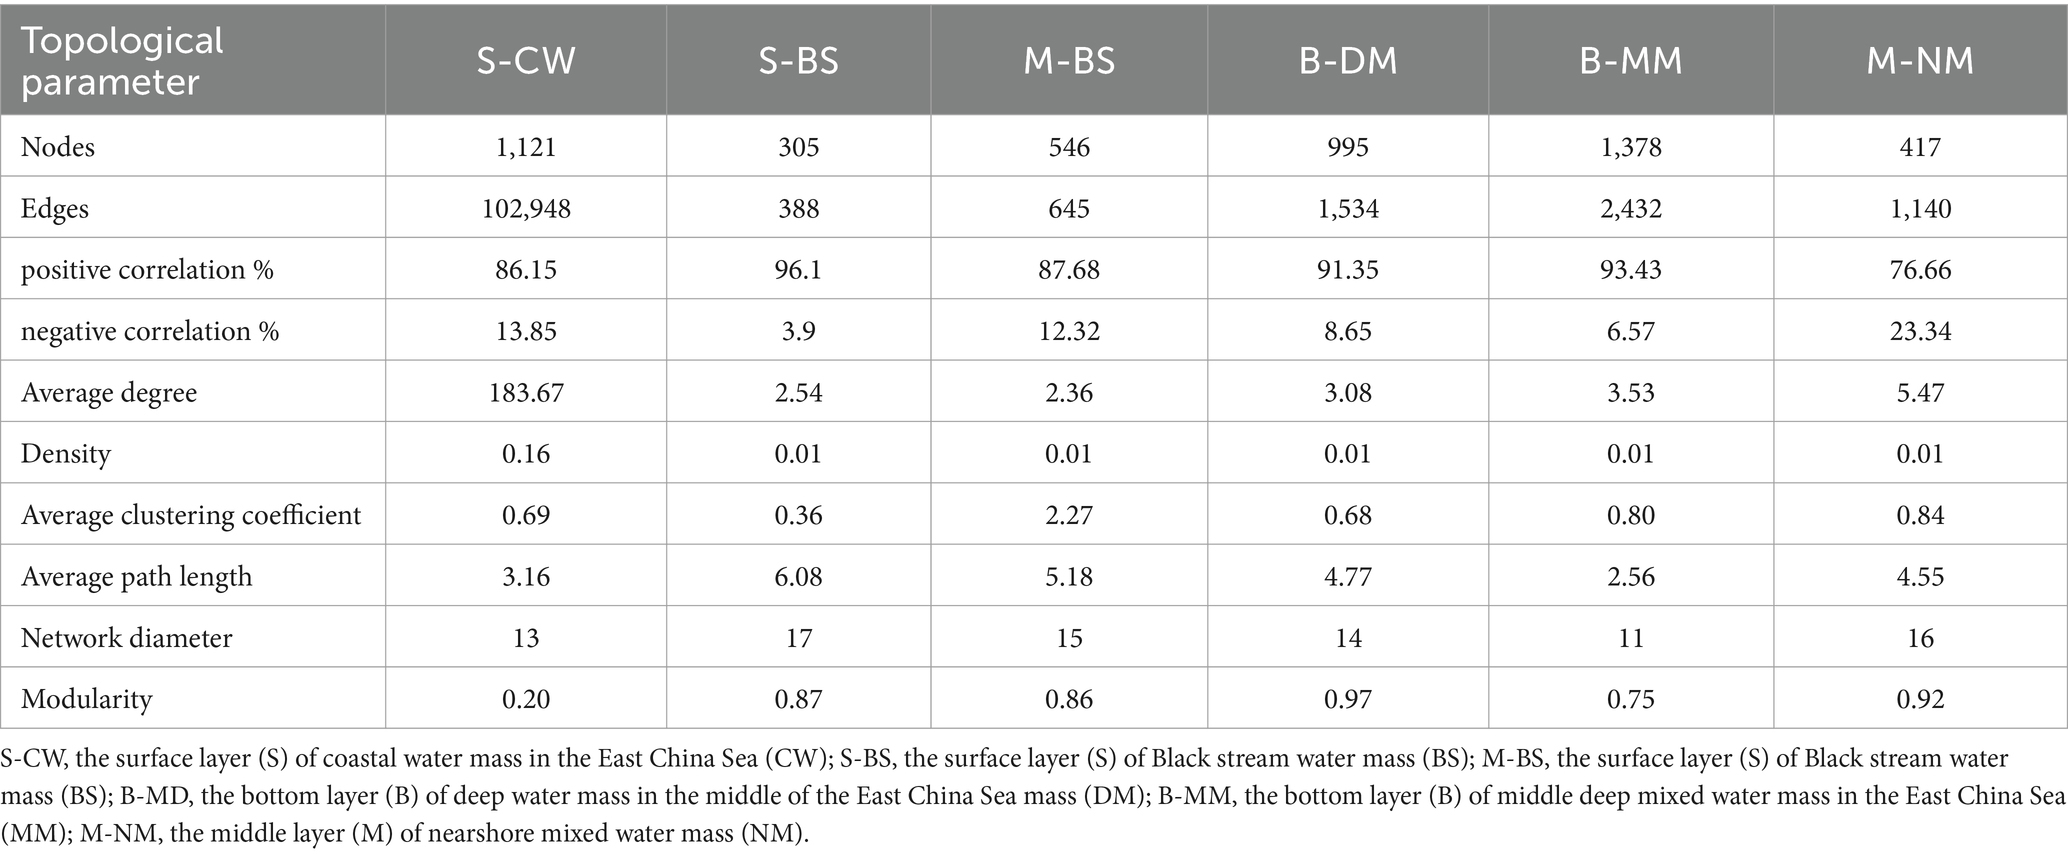
Table 2. Coexistence network indicators of different water masses in the YRE and its adjacent waters.
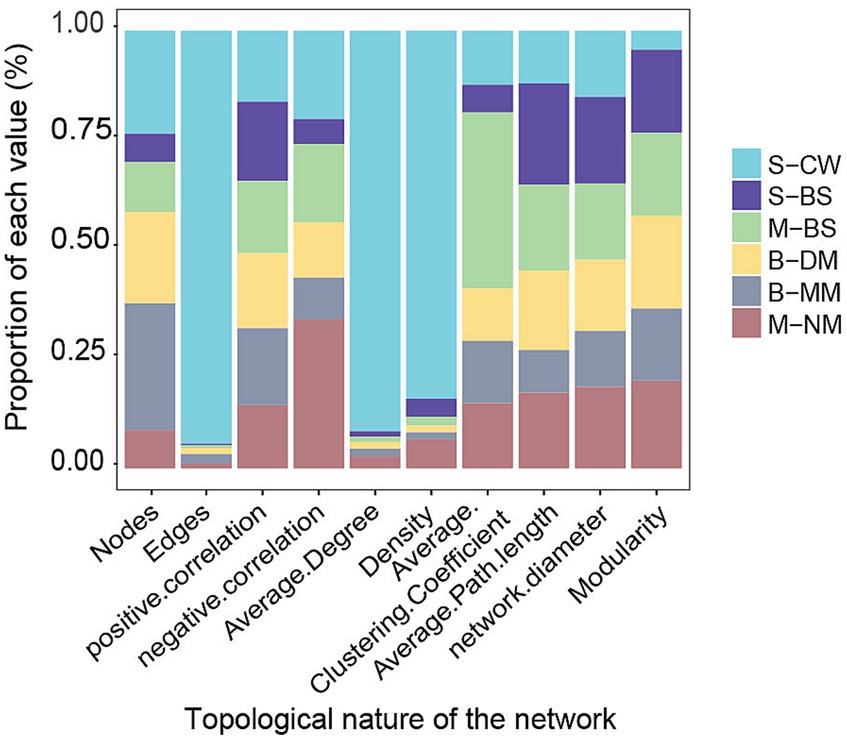
Figure 6. Coexistence network indicators of different water masses in the YRE and its adjacent waters.
In co-occurrence networks, different nodes represent various microbial species, and key species of the community can be identified based on the topological characteristics of the nodes. Node attribute types are typically classified into four categories: peripheral nodes (Zi < 2.5, Pi < 0.62), connector nodes (Zi < 2.5, Pi ≥ 0.62), module hub nodes (Zi ≥ 2.5, Pi < 0.62), and network hub nodes (Zi ≥ 2.5, Pi ≥ 0.62). According to previous research (Cox et al., 2016), nodes with Zi ≥ 2.5 or Pi ≥ 0.62 are defined as key species, based on their intra-module connectivity (Zi) and inter-module connectivity (Pi) in the network. Generally, all three types of nodes, except for peripherals, are classified as key nodes (Deng et al., 2012). As depicted in Supplementary Figure S1, it was evident that S-CW exhibits the highest number of connectors, indicating a closer interaction between network modules in this water mass. Furthermore, there is only one modular hub in S-BS, M-BS, B-MM, and B-DM, whereas no modular hub was observed in S-CW and S-NM. This suggests a high degree of interconnections between species within each water mass. Figure 7 illustrates the composition of key species in bacterial communities at the phylum level across six water masses. The species composition of key species in S-CW was relatively complex, with the majority belonging to Actinobacteriota and Bacteroidota phyla. The key species in M-BS predominantly belong to Nitrospinota, while those in M-NM were mainly represented by Planctomycota. In B-DM, the majority of key species belong to Marininimicrobia (SAR406_clade), whereas most of the key species in B-MM belong to Bacteroidota.
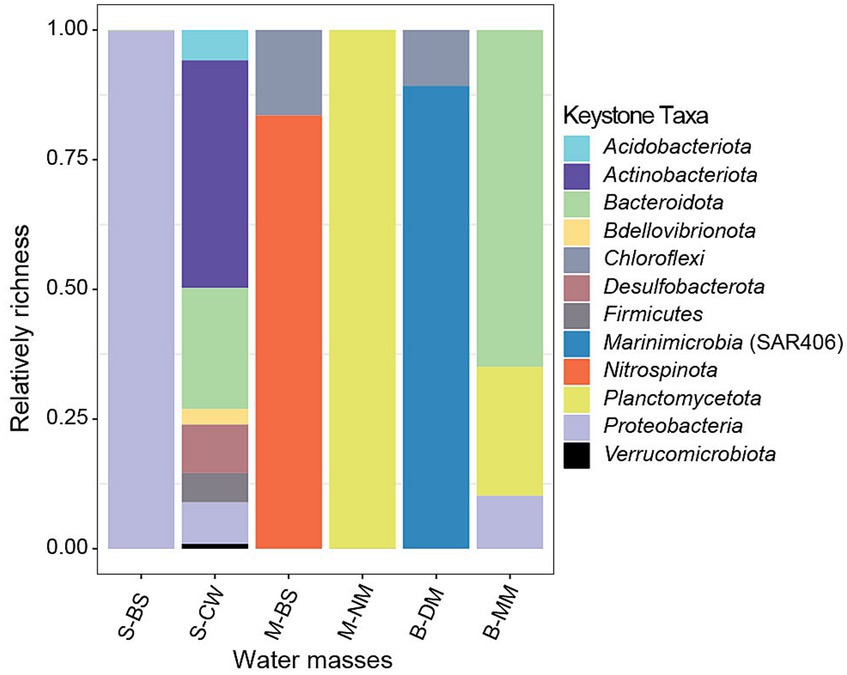
Figure 7. Keystone taxa composition of bacterial community.
The NCM analysis successfully captured a significant portion of the relationship between the occurrence frequency of ASVs and their mean relative abundances (Supplementary Figure S2; Figure 8). The results indicate that, compared to other water masses, the impact of stochastic processes has a greater influence on B-MM, M-CW, and S-NM, while M-NM and S-CW and S-BS were more influenced by deterministic processes. Additionally, species diffusion within communities in B-CW and M-BS was more restricted compared to other water masses, whereas species in B-DM experience less constraint on diffusion.
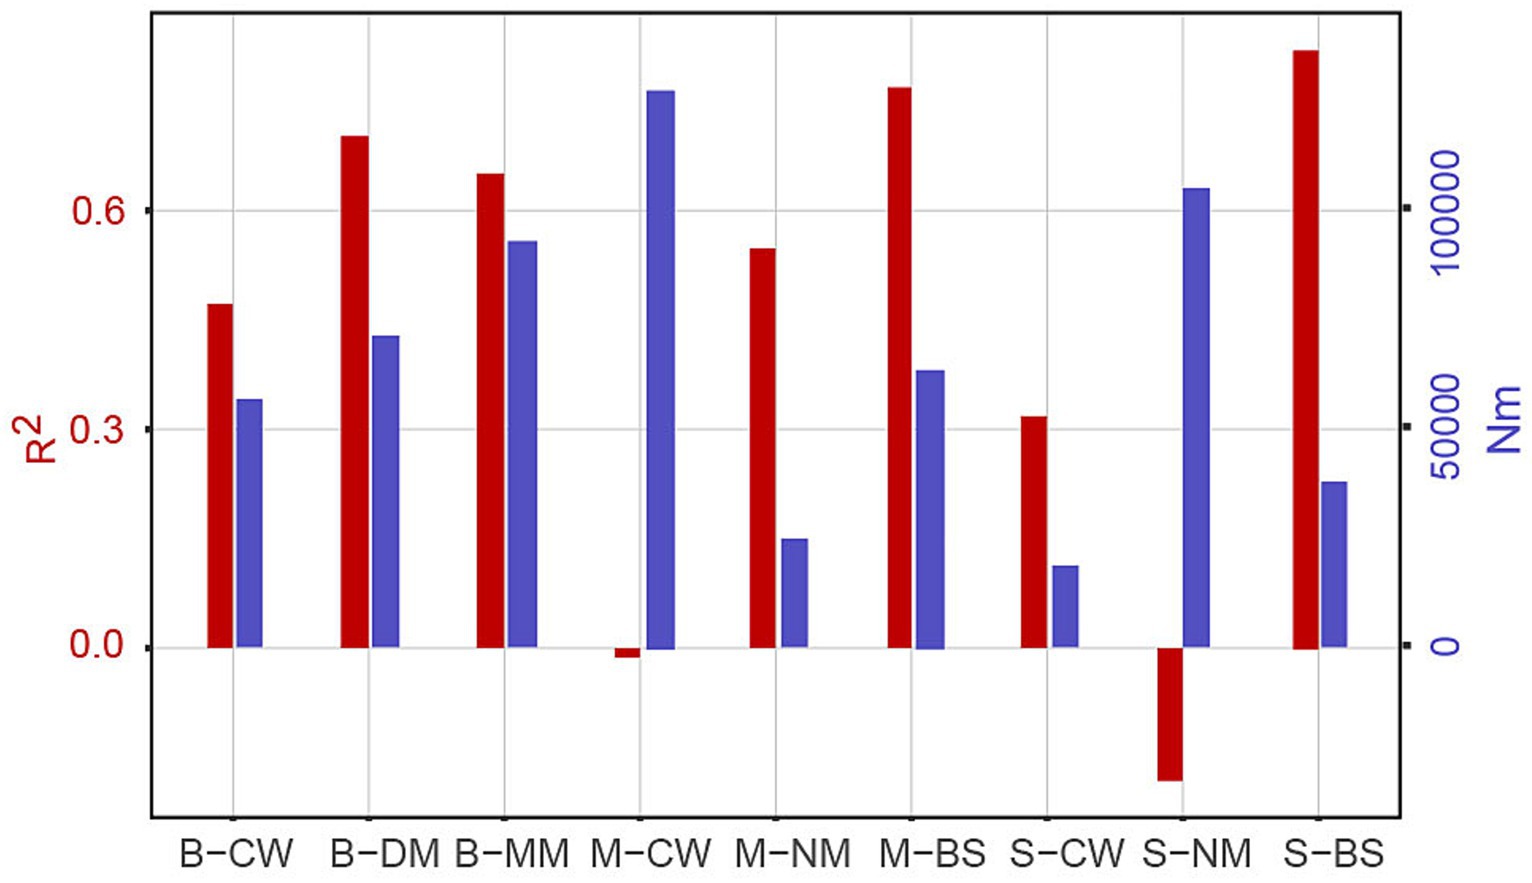
Figure 8. The neutral community model. Rsqr represents overall goodness of fit, m-value quantifies community level migration rate, and Nm value is the product of metacommunity size (N) and m-value. “Rsqr” commonly refers to R-squared, which is a statistical measure used to assess the goodness-of-fit of a regression equation to the observed data. n community ecology, “Nm” typically refers to the migration rate or population dispersal rate within a neutral model.
Water masses are commonly occurring in the estuarine environment, yet little is known about the influences on microbial community across the YRE ecosystems. In this study, we analyzed the bacterial diversity in various water masses occurred in the YRE and its adjacent waters. Across the studied area, five distinct water masses were identified. Significant differences of bacterial communities were observed when considering water masses on layers at different depths (Figures 3J–L), the great influence of dramatic changes in environmental gradients in a same water mass resulted in no apparent differences across all masses (Supplementary Figure S3), as a result, the communities in a mass were analyzed in surface, middle and bottom water layers.
The coastal current system in the YRE is primarily composed of Kuroshio, coastal, and continental shelf mixed water masses (Song, 2011). The Taiwan warm water mass, a branch of the Kuroshio, flows northward through the Taiwan Strait to the ECS, leading to an increase in both temperature and salinity within the sea water (Jan et al., 2002). The significant higher microbial diversity in CW water mass (Figure 3) may be attributed to warm temperature from Taiwan warm water mass and richer nutrients from coastal seawaters (Margesin et al., 2017). Proteobacteria was the dominant phylum in water masses at all layers, which consistent with previous results obtained from pure cultures in the YRE (He et al., 2013). In the surface seawater, except for Proteobacteria and Cyanobacteria in BS mass, Bacteroidota occupies the highest proportion compared to the other two water masses, followed by CW and NM. Freshwater from the Yangtze River influences the salinity and temperature (Ferrenberg et al., 2013), which may lead to a relatively low proportion of Cyanobacteria in the surface seawater masses. In comparison, the distribution of Actinobacteriota varied across water masses, with CW exhibiting the highest proportion. This observation is consistent with previous research (Yang et al., 2023), which indicates a negative correlation between salinity levels and the abundance of Actinobacteriota. In the middle seawater, there was a significant difference in the proportion of Cyanobacteria among the various water masses. Specifically, the proportion of Cyanobacteria in CW was lower than that in the other two water masses, this finding contradicts previous research results, which claimed that Cyanobacteria were more likely to thrive in water with lower salinity (Śliwińska-Wilczewska et al., 2019). In the bottom seawater, Bacteroidota, Actinobacteriota and Marinimicrobia (SAR406_clade) account for a relatively high abundance, the proportion of Marinimicrobia (SAR406_clade) in CW was lower than that in the other two water masses, which is consistent with the previous study of the Pearl River estuary (Sang et al., 2022).
Temperature and salinity as crucial factors impacting the aggregation of bacterial communities in oceanic environments (Gilbert et al., 2009). Our findings with the RDA and Mantel analyses further revealed that salinity, temperature, COD, Chl a, and NO2− significantly influence the bacterial communities in the seawater masses. These findings suggests NO2− is another important environmental factor influencing bacterial diversities among water masses in the YRE.
Network topological characteristics play the crucial role in evaluating the health of ecosystems and identifying potential targets for biotechnological interventions (Bull et al., 2000). In this study, the S-NM, M-CW, B-CW were omitted due to the limited samples. The correlations among microbes in different water masses were primarily characterized by positive relationship (Figure 8). However, the negative correlation ratio of M-NM and S-BS was slightly higher compared to other water masses in different layers, this suggests that the competition between species within these two water masses was greater than in other water masses. The S-CW and B-MM exhibit higher network connectivity, which indicates communities in these water mass possesses more complex inter-species interactions in comparison to other water masses. The bacterial networks within S-CW (Density = 0.164) and M-NM (Density = 0.013) were denser than other water masses, which suggest the more complex interactions, greater stability, and stronger stress resistance microbial community harbors in these water mass.
Among the different water masses, S-CW and B-MM exhibit relatively high network average and average clustering coefficients, as well as shorter average paths. These findings suggest that microbial communities residing within these two water masses possess enhanced connectivity and participate in more complex species interactions (Zhang B. et al., 2018; Yang et al., 2019). Therefore, the microbial communities in the S-CW and B-MM closely interact with each other and respond rapidly to external disturbances, but the community exhibits less stability. Conversely, the microbial communities in the middle and bottom seawater masses demonstrate a buffering effect on external disturbances, resulting in strong community stability. Furthermore, the bacterial community network in the S-CW and B-MM was more complex, indicating a closer association between the microbes (Yang et al., 2019). Additionally, the modularity parameters of the network diagrams in all water masses (except for CW) in this study were found to be greater than 0.4, This indicates that the overall topology of network in S-BS, M-BS, B-DM, B-MM, and M-NM exhibits a high level of modularity (Qin et al., 2021). Similar to other complex environments, such as networks constructed with soil (Williams et al., 2014), wetland sediments (Huang et al., 2019).
Keystone taxa are nodes that exhibit a high degree of connectivity within a network (Xian et al., 2020), these particular species hold a unique position within a microbial community, the absence of them impacts both the structure and function of microbial community (Modlmeier et al., 2014). In this study, keystone taxa mainly distributed in Marinimicrobia, Planctomycetota, Bacteroidota, Nitrospinota, and Proteobacteria. Planctomycetota, Bacteroidetes, the anaerobic planktonic bacteria within aquatic environments, serves as the main member responsible for the degradation of organic matter in the water column (Sun et al., 2021). Interestingly, Proteobacteria was the dominant phylum of in all water masses, but not the primary keystone taxa at phylum across water masses, and only identified as keystone taxa at phylum in three masses (S-BS, S-CW, and B-MM). The possible explanation was that the keystone taxa always not the dominant group (Cupit et al., 2019).
The neutral community model is commonly employed to assess the impacts of random diffusion and ecological drift on bacterial community assembly. In this model, R2 represents the overall goodness of fit, m-value quantifies the community-level migration rate, and Nm value is the product of metacommunity size (N) and m-value. The m-value reflects the migration rate at the community level. A higher m-value indicates less restrictions on species diffusion within the entire community, while a lower m-value suggests higher constraint on species dispersal (Su et al., 2022). A higher R2 value indicates a closer fit to the neutral model, suggesting that community assembly is predominantly influenced by stochastic processes rather than deterministic processes (Sloan et al., 2006). Using the neutral community model, we evaluated the differences in bacterial community assembly processes across various water masses within the YRE and adjacent environments.
The previous study conducted in the YRE claimed that stochastic processes dominate the assembly of bacterial communities (Shi et al., 2023). Despite the similar conclusion of B-MM and M-CW, the Nm value of M-NM, S-CW, and S-BS were less than 5,000 (the highest value in B-MM was 92,918) (Supplementary Figure S2), suggesting bacterial assembly process was not directly controlled by geographical niches in this zone. Instead, water mass dynamics strongly affect the assembly process of microorganisms in the same area. The YRE is eutrophic, and the availability of nutrients for planktonic microbes makes it compatible with nutrient-rich substrates, Besides the temperature and salt, differences of dissolved organic matter (Guo et al., 2018) and nutrient substrates (Catão et al., 2021) among masses may also influences the assembly process. Moreover, there exist unmeasured variables or factors that could potentially impact these dynamics, necessitating further investigation to elucidate their influence (Jiao and Lu, 2020).
This study investigated the effects of water masses on the variation of bacterial community in the YRE. The surveyed sea area was divided into five distinct water masses: Black Stream (BS) water mass, coastal water in the East China Sea (CW) water mass, nearshore mixed water (NM) water mass, middle deep mixed water in the East China Sea (MM) water mass, deep-water mass in the middle of the East China Sea (DM). In the surface layer, Cyanobacteria and Bacteroidota were the dominant phylum in BS water mass, while Actinobacteriota has the highest proportion in CW. In the middle seawater, the proportion of Cyanobacteria in CW was lower than that of the other two water masses, whereas the proportion of Planctomycota was higher. Additionally, the proportion of Marininimicrobia (SAR406_clade) in CW was lower than in the other two water masses. In the bottom seawater layer, the bacterial phyla with high abundance were Bacteroidota, Actinobacteriota, and Marininimicrobia. In CW, however, the proportion (1.41%) of Marininimicrobia (SAR406_clade) was lower compared to NM (3.2%) and BS (7.27%). The network analysis results suggested the interaction among bacterial communities in distinct water masses were primarily characterized by positive correlation. Both stochastic and deterministic processes influenced bacterial assembly processes among the diverse water masses.
The datasets presented in this study can be found in online repositories. The names of the repository/repositories and accession number(s) can be found at: https://www.ncbi.nlm.nih.gov/sra/?term=PRJNA1000040.
This article does not contain any studies involving to human participants or animals. Sample collection is following local regulations and is approved by management.
W-DX: Supervision, Validation, Writing – original draft, Writing – review & editing. JC: Investigation, Software, Writing – original draft. ZZ: Data curation, Investigation, Writing – review & editing. JD: Investigation, Software, Writing – review & editing. YX: Investigation, Writing – review & editing. YZ: Investigation, Methodology, Writing – review & editing. WQ: Methodology, Software, Writing – review & editing. CT: Methodology, Software, Writing – review & editing. CL: Writing – review & editing. XL: Data curation, Writing – review & editing. WL: Writing – review & editing. JW: Funding acquisition, Writing – review & editing, Conceptualization.
The author(s) declare that financial support was received for the research, authorship, and/or publication of this article. This work was funded by the Key R&D projects in Zhejiang Province (Grant Numbers: 2021C02047, 2022C02040, and 2023C03120), the Fundamental Research Fund for the Provincial Universities of Zhejiang (Grant Number: 2021JD003), the National Natural Science Foundation of China (Grant Number: Q20C060004), the Science and Technology Program of Zhoushan (Grant Number: 2019C21011), the Research Project of Ecological Environment Protection and Restoration of Yangtze River in Zhoushan (Grant Number: 2019C21011), the Natural Science Foundation of Zhejiang Province (Grant Number: SZGXZS2020068), and the College Students’ Innovative Entrepreneurial Training Plan Program (202110340009). The study was also supported by the Sophisticated Ocean Front and Fisheries Investigation (SOPHI) of Zhejiang Ocean University.
The authors declare that the research was conducted in the absence of any commercial or financial relationships that could be construed as a potential conflict of interest.
All claims expressed in this article are solely those of the authors and do not necessarily represent those of their affiliated organizations, or those of the publisher, the editors and the reviewers. Any product that may be evaluated in this article, or claim that may be made by its manufacturer, is not guaranteed or endorsed by the publisher.
The Supplementary material for this article can be found online at: https://www.frontiersin.org/articles/10.3389/fmicb.2024.1367062/full#supplementary-material
Abdi, H., and Williams, L. (2010). Principal component analysis. WIRES 2, 433–459. doi: 10.1002/wics.101
Arrigo, K. R. (2005). Marine microorganisms and global nutrient cycles. Nature 437, 349–355. doi: 10.1038/nature04159
Baltar, F., and Aristegui, J. (2017). Fronts at the surface ocean can shape distinct regions of microbial activity and community assemblages down to the bathypelagic zone: the Azores front as a case study. Front. Mar. Sci. 4:e252. doi: 10.3389/fmars.2017.00252
Bardgett, R. D., Freeman, C., and Ostle, N. J. (2008). Microbial contributions to climate change through carbon cycle feedbacks. ISME J. 2, 805–814. doi: 10.1038/ismej.2008.58
Bianchi, T. S., Cui, X., Blair, N. E., Burdige, D. J., Eglinton, T. I., and Galy, V. (2018). Centers of organic carbon burial and oxidation at the land-ocean interface. Org. Geochem. 115, 138–155. doi: 10.1016/j.orggeochem.2017.09.008
Bull, A. T., Ward, A. C., and Goodfellow, M. (2000). Search and discovery strategies for biotechnology: the paradigm shift. Microbiol. Mol. Biol. Rev. 64, 573–606. doi: 10.1128/MMBR.64.3.573-606.2000
Caporaso, J. G., Kuczynski, J., Stombaugh, J., Bittinger, K., Bushman, F. D., Costello, E. K., et al. (2010). QIIME allows analysis of high-throughput community sequencing data. Nat. Methods 7, 335–336. doi: 10.1038/nmeth.f.303
Catão, C. P. E., Pollet, T., Garnier, C., Barry-Martinet, R., Rehel, K., Linossier, I., et al. (2021). Temperate and tropical coastal waters share relatively similar microbial biofilm communities while free-living or particle-attached communities are distinct. Mol. Ecol. 30, 2891–2904. doi: 10.1111/mec.15929
Center, N.M.E.M. (2007). The specification for marine monitoring. Part 4:seawater analysis(in Chinese). General Administration of Quality Supervision, inspection and quarantine of the People’s republic of China
Chen, W., Ren, K., Isabwe, A., Chen, H., Liu, M., and Yang, J. (2019). Stochastic processes shape microeukaryotic community assembly in a subtropical river across wet and dry seasons. Microbiome 7, 1–16. doi: 10.1186/s40168-019-0749-8
Chen, X., Sheng, Y., Wang, G., Zhou, P., Liao, F., Mao, H., et al. (2024). Spatiotemporal successions of N, S, C, Fe, and as cycling genes in groundwater of a wetland ecosystem: enhanced heterogeneity in wet season. Water Res. 251:121105. doi: 10.1016/j.watres.2024.121105
Chen, S., Zhou, Y., Chen, Y., and Gu, J. (2018). Fastp: an ultra-fast all-in-one FASTQ preprocessor. Bioinformatics 34, i884–i890. doi: 10.1093/bioinformatics/bty560
Chwastowski, J., Wójcik, K., Kołoczek, H., Oszczęda, Z., Khachatryan, K., and Tomasik, P. (2023). Effect of water treatment with low-temperature and low-pressure glow plasma of low frequency on the growth of selected microorganisms. Int. J. Food Prop. 26, 502–510. doi: 10.1080/10942912.2023.2169708
Cox, F., Newsham, K. K., Bol, R., Dungait, J. A., and Robinson, C. H. (2016). Not poles apart: Antarctic soil fungal communities show similarities to those of the distant Arctic. Ecol. Lett. 19, 528–536. doi: 10.1111/ele.12587
Cupit, C., Lomstein, B. A., and Kjeldsen, K. U. (2019). Contrasting community composition of endospores and vegetative Firmicutes in a marine sediment suggests both endogenous and exogenous sources of endospore accumulation. Environ. Microbiol. Rep. 11, 352–360. doi: 10.1111/1758-2229.12679
Deng, Y., Jiang, Y.-H., Yang, Y., He, Z., Luo, F., and Zhou, J. (2012). Molecular ecological network analyses. BMC Bioinformatics 13, 1–20. doi: 10.1186/1471-2105-13-113
Dong, H., Huang, L., Zhao, L., Zeng, Q., Liu, X., Sheng, Y., et al. (2022). A critical review of mineral–microbe interaction and co-evolution: mechanisms and applications. Natl. Sci. Rev. 9:nwac128. doi: 10.1093/nsr/nwac128
Doulcier, G., and Stouffer, D. (2015). Rnetcarto: fast network modularity and roles computation by simulated annealing. R package version 0.2 4
Edgar, R. C. (2010). Search and clustering orders of magnitude faster than BLAST. Bioinformatics 26, 2460–2461. doi: 10.1093/bioinformatics/btq461
Ferrenberg, S., O’neill, S. P., Knelman, J. E., Todd, B., Duggan, S., Bradley, D., et al. (2013). Changes in assembly processes in soil bacterial communities following a wildfire disturbance. ISME J. 7, 1102–1111. doi: 10.1038/ismej.2013.11
Gilbert, J. A., Field, D., Swift, P., Newbold, L., Oliver, A., Smyth, T., et al. (2009). The seasonal structure of microbial communities in the Western English Channel. Environ. Microbiol. 11, 3132–3139. doi: 10.1111/j.1462-2920.2009.02017.x
Gómez-Plaza, E., and Cano-López, M. (2011). A review on micro-oxygenation of red wines: claims, benefits and the underlying chemistry. Food Chem. 125, 1131–1140. doi: 10.1016/j.foodchem.2010.10.034
Gu, Z., Gu, L., Eils, R., Schlesner, M., and Brors, B. (2014). Circlize implements and enhances circular visualization in R. Bioinformatics 30, 2811–2812. doi: 10.1093/bioinformatics/btu393
Guo, J.-Q., Liang, S.-K., Li, X.-J., Li, W., Wang, Y.-F., and Su, R.-G. (2018). Composition and bioavailability of dissolved organic matter in different water masses of the East China Sea. Estuar. Coast. Shelf Sci. 212, 189–202. doi: 10.1016/j.ecss.2018.07.009
Hall, M., and Beiko, R. G. (2018). 16S rRNA gene analysis with QIIME2. Microbiome Anal. Methods Protocols 1849, 113–129. doi: 10.1007/978-1-4939-8728-3_8
He, J., Liu, X., Zhao, R., Wu, F., and Wang, J. (2013). Diversity of cultured and uncultured bacteria in surface layer sediment from the East China Sea (in Chinese). Biodivers. Sci. 21, 28–37. doi: 10.3724/SP.J.1003.2013.10097
Hsiao, S.-H., Kâ, S., Fang, T.-H., and Hwang, J.-S. (2011). Zooplankton assemblages as indicators of seasonal changes in water masses in the boundary waters between the East China Sea and the Taiwan Strait. Hydrobiologia 666, 317–330. doi: 10.1007/s10750-011-0628-1
Hsieh, C.-H. H., Chiu, T.-S., and Shih, C.-T. (2004). Copepod diversity and composition as indicators of intrusion of the Kuroshio branch current into the northern Taiwan Strait in spring 2000. Zool. Stud. 43, 393–403.
Huang, W., Chen, X., Wang, K., Chen, J., Zheng, B., and Jiang, X. (2019). Comparison among the microbial communities in the lake, lake wetland, and estuary sediments of a plain river network. Microbiology 8:e00644. doi: 10.1002/mbo3.644
Jan, S., Wang, J., Chern, C.-S., and Chao, S.-Y. (2002). Seasonal variation of the circulation in the Taiwan Strait. J. Mar. Syst. 35, 249–268. doi: 10.1016/s0924-7963(02)00130-6
Jiang, X., Yao, L., Guo, L., Liu, G., and Liu, W. (2017). Multi-scale factors affecting composition, diversity, and abundance of sediment denitrifying microorganisms in Yangtze lakes. Appl. Microbiol. Biotechnol. 101, 8015–8027. doi: 10.1007/s00253-017-8537-5
Jiao, N., and Azam, F. (2011). Microbial carbon pump and its significance for carbon sequestration in the ocean. Microb. Carbon Pump Ocean 10, 43–45. doi: 10.1126/science.opms.sb0001
Jiao, S., and Lu, Y. (2020). Soil pH and temperature regulate assembly processes of abundant and rare bacterial communities in agricultural ecosystems. Environ. Microbiol. 22, 1052–1065. doi: 10.1111/1462-2920.14815
Lan, Y., Wang, Q., Cole, J. R., and Rosen, G. L. (2012). Using the RDP classifier to predict taxonomic novelty and reduce the search space for finding novel organisms. PLoS One 7:e32491. doi: 10.1371/journal.pone.0032491
Li, L., Ren, J.-L., Yan, Z., Liu, S.-M., Wu, Y., Zhou, F., et al. (2014). Behavior of arsenic in the coastal area of the Changjiang (Yangtze River) estuary: influences of water mass mixing, the spring bloom and hypoxia. Cont. Shelf Res. 80, 67–78. doi: 10.1016/j.csr.2014.02.021
Li, W., Wang, M., Pan, H., Burgaud, G., Liang, S., Guo, J., et al. (2018). Highlighting patterns of fungal diversity and composition shaped by ocean currents using the East China Sea as a model. Mol. Ecol. 27, 564–576. doi: 10.1111/mec.14440
Margesin, R., Siles, J. A., Cajthaml, T., Öhlinger, B., and Kistler, E. (2017). Microbiology meets archaeology: soil microbial communities reveal different human activities at archaic Monte Iato (sixth century BC). Microb. Ecol. 73, 925–938. doi: 10.1007/s00248-016-0904-8
Modlmeier, A. P., Keiser, C. N., Watters, J. V., Sih, A., and Pruitt, J. N. (2014). The keystone individual concept: an ecological and evolutionary overview. Anim. Behav. 89, 53–62. doi: 10.1016/j.anbehav.2013.12.020
Oksanen, J., Blanchet, F., Kindt, R., Legendre, P., Minchin, P., O’hara, R., et al. (2013). Package ‘vegan’. Community ecology package, version 2. Compreh. R Network (CRAN). 8:9882. doi: 10.1038/s41598-018-27322-3
Pan, C., Gao, F., Li, Z., Li, J., and Chen, F. (2016). Water mass and temperature/salinity dailyvariation in east shallow-water area of Zhoushan (in Chinese). J. Army Eng. Univ. PLA 17, 296–302. doi: 10.12018/j.issn.1009-3443.20150710003
Parmar, T. K., Rawtani, D., and Agrawal, Y. K. (2016). Bioindicators: the natural indicator of environmental pollution. Front. Life Sci. 9, 110–118. doi: 10.1080/21553769.2016.1162753
Petsch, S., Eglinton, T., and Edwards, K. (2001). 14C-dead living biomass: evidence for microbial assimilation of ancient organic carbon during shale weathering. Science 292, 1127–1131. doi: 10.1126/science.1058332
Qi, J. (2014). An estimation of water exchange between The East ChinaSea and Kuroshio (in Chinese). Doct of Physical Ocaenology The University of Chinese Academy of Sciences.
Qiao, F., Yang, Y., Lü, X., Xia, C., Chen, X., Wang, B., et al. (2006). Coastal upwelling in the East China Sea in winter. J. Geophys. Res.: Oceans 54, 3988–3995. doi: 10.1029/2005jc003264
Qin, Y., Tang, Q., Lu, L., Wang, Y., Izaguirre, I., and Li, Z. (2021). Changes in planktonic and sediment bacterial communities under the highly regulated dam in the mid-part of the three gorges reservoir. Appl. Microbiol. Biotechnol. 105, 839–852. doi: 10.1007/s00253-020-11047-3
Quast, C., Pruesse, E., Yilmaz, P., Gerken, J., Schweer, T., Yarza, P., et al. (2012). The SILVA ribosomal RNA gene database project: improved data processing and web-based tools. Nucleic Acids Res. 41, D590–D596. doi: 10.1093/nar/gks1219
Rognes, T., Flouri, T., Nichols, B., Quince, C., and Mahé, F. (2016). VSEARCH: a versatile open source tool for metagenomics. PeerJ 4:e2584. doi: 10.7717/peerj.2584
Rosenberg, E. (2012). Microorganisms to combat pollution. Berlin: Springer Science & Business Media.
Sang, S., Huang, B., Wang, Y., Liu, H., Xu, L., and Zhang, J. (2022). Diversity and structure of prokaryotic microbial Community in Seawater Intrusion Aquifers and its Significance (in Chinese). Res. Environ. Sci. 35, 1458–1466. doi: 10.13198/j.issn.1001-6929.2022.03.28
Shi, J., Zuo, Y.-Q., Cao, P.-L., Fan, Y.-P., Wu, Q., and Wang, J.-X. (2023). The assembling of free-living and particle-attached archaea communities in the Changjiang river estuary in summer (in Chinese). Oceanol. Limnologia Sinica 54, 773–785. doi: 10.11693/hyhz20220800216
Skarðhamar, J., Slagstad, D., and Edvardsen, A. (2007). Plankton distributions related to hydrography and circulation dynamics on a narrow continental shelf off northern Norway. Estuar. Coast. Shelf Sci. 75, 381–392. doi: 10.1016/j.ecss.2007.05.044
Śliwińska-Wilczewska, S., Cieszyńska, A., Konik, M., Maculewicz, J., and Latała, A. (2019). Environmental drivers of bloom-forming cyanobacteria in the Baltic Sea: effects of salinity, temperature, and irradiance. Estuar. Coast. Shelf Sci. 219, 139–150. doi: 10.1016/j.ecss.2019.01.016
Sloan, W. T., Lunn, M., Woodcock, S., Head, I. M., Nee, S., and Curtis, T. P. (2006). Quantifying the roles of immigration and chance in shaping prokaryote community structure. Environ. Microbiol. 8, 732–740. doi: 10.1111/j.1462-2920.2005.00956.x
Song, J. (2011). Biogeochemical processes of biogenic elements in China marginal seas Springer Science & Business Media.
Soong, J. L., Fuchslueger, L., Marañon-Jimenez, S., Torn, M. S., Janssens, I. A., Penuelas, J., et al. (2020). Microbial carbon limitation: the need for integrating microorganisms into our understanding of ecosystem carbon cycling. Glob. Chang. Biol. 26, 1953–1961. doi: 10.1111/gcb.14962
Su, X., Yang, L., Yang, K., Tang, Y., Wen, T., Wang, Y., et al. (2022). Estuarine plastisphere as an overlooked source of N2O production. Nat. Commun. 13:e3884. doi: 10.1038/s41467-022-31584-x
Sun, C., Zeng, X., Li, G., Du, Y., Wang, Z., and Shao, Z. (2021). Diversity of anaerobic degrading bacteria for natural organic polymers in mangrove sediments and isolation of novel groups of bacteria (in Chinese). Acta Microbiol Sin. 61, 987–1001. doi: 10.13343/j.cnki.wsxb.20200715
Torsvik, V., Øvreås, L., and Thingstad, T. F. (2002). Prokaryotic diversity – magnitude, dynamics, and controlling factors. Science 296, 1064–1066. doi: 10.1126/science.1071698
Turley, C., and Findlay, H.S. (2009a). Chapter 21 – ocean acidification as an Indicator for climate change, Climate change, (Ed.) T.M. Letcher. Amsterdam: Elsevier, 367–390
Turley, C., and Findlay, H.S. (2009b). Ocean acidification as an indicator for climate change, Climate change. Elsevier, 367–390
Wang, Y., Dong, L., Zhang, M., Bai, X., Zhang, J., and Yu, X. (2021). Dynamic microbial network structure and assembly process in rhizosphere and bulk soils along a coniferous plantation chronosequence. Research Square (Version 1) 11:PPR426421. doi: 10.21203/rs.3.rs-1101835/v1
Wei, T., Simko, V., Levy, M., Xie, Y., Jin, Y., and Zemla, J. (2017). Package ‘corrplot’. Statistician 56:e24
Williams, R. J., Howe, A., and Hofmockel, K. S. (2014). Demonstrating microbial co-occurrence pattern analyses within and between ecosystems. Front. Microbiol. 5:e358. doi: 10.3389/fmicb.2014.00358
Xian, W.-D., Salam, N., Li, M.-M., Zhou, E.-M., Yin, Y.-R., Liu, Z.-T., et al. (2020). Network-directed efficient isolation of previously uncultivated Chloroflexi and related bacteria in hot spring microbial mats. NPJ Biofilms Microb 6:e20. doi: 10.1038/s41522-020-0131-4
Yang, J., Chen, L., Yang, Y., Zhou, J., Shi, Y., Gao, Q., et al. (2022). Spatial-temporal niche of dominant zooplankton species in the Yangtze River estuary and adjacent waters in spring and summer (in Chinese). J. Fishery Sci. China 29, 1625–1635. doi: 10.12264/JFSC2022-0180
Yang, X., Dai, Z., Yuan, R., Guo, Z., Xi, H., He, Z., et al. (2023). Effects of salinity on assembly characteristics and function of microbial communities in the Phyllosphere and rhizosphere of salt-tolerant Avicennia marina mangrove species. Microbiol. Spectrum 11, e03000–e03022. doi: 10.1128/spectrum.03000-22
Yang, Y., Gao, Y., Huang, X., Ni, P., Wu, Y., Deng, Y., et al. (2019). Adaptive shifts of bacterioplankton communities in response to nitrogen enrichment in a highly polluted river. Environ. Pollut. 245, 290–299. doi: 10.1016/j.envpol.2018.11.002
Zhang, J., Liu, Y.-X., Zhang, N., Hu, B., Jin, T., Xu, H., et al. (2019). NRT1. 1B is associated with root microbiota composition and nitrogen use in field-grown rice. Nat. Biotechnol. 37, 676–684. doi: 10.1038/s41587-019-0104-4
Zhang, B., Zhang, J., Liu, Y., Shi, P., and Wei, G. (2018). Co-occurrence patterns of soybean rhizosphere microbiome at a continental scale. Soil Biol. Biochem. 118, 178–186. doi: 10.1016/j.soilbio.2017.12.011
Zhang, W.-C., Zhao, Y., Dong, Y., Zhao, L., Li, H.-B., and Xiao, T. (2018). Effects of temperature on the biological metabolism of microbial food web (in Chinese). Mar. Sci. 42, 137–145. doi: 10.11759/hykx20180723001
Zhou, J., Deng, Y., Luo, F., He, Z., Tu, Q., and Zhi, X. (2010a). Functional molecular ecological networks. MBio 1:e110. doi: 10.1128/mbio.00169-00110
Zhou, J., Deng, Y., Luo, F., He, Z., Tu, Q., and Zhi, X. (2010b). Functional molecular ecological networks. MBio 1:e10. doi: 10.1128/mBio.00169-10
Keywords: Yangtze river estuary, water masses, bacterial diversity, network topology, community assembly
Citation: Xian W-D, Chen J, Zheng Z, Ding J, Xi Y, Zhang Y, Qu W, Tang C, Li C, Liu X, Li W and Wang J (2024) Water masses influence the variation of microbial communities in the Yangtze River Estuary and its adjacent waters. Front. Microbiol. 15:1367062. doi: 10.3389/fmicb.2024.1367062
Edited by:
Yizhi Sheng, China University of Geosciences, ChinaReviewed by:
Yuquan Wei, China Agricultural University, ChinaCopyright © 2024 Xian, Chen, Zheng, Ding, Xi, Zhang, Qu, Tang, Li, Liu, Li and Wang. This is an open-access article distributed under the terms of the Creative Commons Attribution License (CC BY). The use, distribution or reproduction in other forums is permitted, provided the original author(s) and the copyright owner(s) are credited and that the original publication in this journal is cited, in accordance with accepted academic practice. No use, distribution or reproduction is permitted which does not comply with these terms.
*Correspondence: Jianxin Wang, anh3YW5nQHpqb3UuZWR1LmNu
†These authors have contributed equally to this work and share first authorship
Disclaimer: All claims expressed in this article are solely those of the authors and do not necessarily represent those of their affiliated organizations, or those of the publisher, the editors and the reviewers. Any product that may be evaluated in this article or claim that may be made by its manufacturer is not guaranteed or endorsed by the publisher.
Research integrity at Frontiers
Learn more about the work of our research integrity team to safeguard the quality of each article we publish.