 Louison Dufour
 Laurence Garczarek
 Bastian Gouriou
 Morgane Ratin
 Frédéric Partensky
- Sorbonne Université, CNRS, UMR 7144 Adaptation and Diversity in the Marine Environment (AD2M), Station Biologique de Roscoff (SBR), Roscoff, France
Synechococcus, the second most abundant marine phytoplanktonic organism, displays the widest variety of pigment content of all marine oxyphototrophs, explaining its ability to colonize all spectral niches occurring in the upper lit layer of oceans. Seven Synechococcus pigment types (PTs) have been described so far based on the phycobiliprotein composition and chromophorylation of their light-harvesting complexes, called phycobilisomes. The most elaborate and abundant PT (3d) in the open ocean consists of cells capable of type IV chromatic acclimation (CA4), i.e., to reversibly modify the ratio of the blue light-absorbing phycourobilin (PUB) to the green light-absorbing phycoerythrobilin (PEB) in phycobilisome rods to match the ambient light color. Two genetically distinct types of chromatic acclimaters, so-called PTs 3dA and 3dB, occur at similar global abundance in the ocean, but the precise physiological differences between these two types and the reasons for their complementary niche partitioning in the field remain obscure. Here, photoacclimation experiments in different mixes of blue and green light of representatives of these two PTs demonstrated that they differ by the ratio of blue-to-green light required to trigger the CA4 process. Furthermore, shift experiments between 100% blue and 100% green light, and vice-versa, revealed significant discrepancies between the acclimation pace of the two types of chromatic acclimaters. This study provides novel insights into the finely tuned adaptation mechanisms used by Synechococcus cells to colonize the whole underwater light field.
Introduction
Phytoplanktonic cells have an obligate requirement for light to perform photosynthesis. Yet in the marine environment, this energy source is highly variable quantitatively and qualitatively with depth but also along coast-offshore gradients, leaving aside daily oscillations (Kirk, 1994; Holtrop et al., 2021). This variability has triggered an extensive structural and pigment diversification of phytoplankton light-harvesting antennae, which enable cells to considerably enhance the wavelength range they can collect and therefore the number of photons reaching photosystems. Despite their apparent simplicity compared to algae and higher plants, cyanobacteria possess the most elaborated form of antennae known in oxyphototrophs, called phycobilisomes (PBS). PBS are huge water-soluble complexes composed of six to eight rods radiating around a central core. Both core and rods are constituted of phycobiliproteins that bind open-chain tetrapyrroles, called phycobilins (Sidler, 1994). While the PBS core is always made of allophycocyanin and is highly conserved, PBS rods display a very large structural flexibility since they can be made of phycocyanin (PC) only, or of PC and one or two phycoerythrin (PE) types, PE-I and PE-II (Ong and Glazer, 1991; Six et al., 2007). Additionally, each phycobiliprotein can bind up to three different kinds of phycobilins. The ultimate degree of sophistication is the capacity for some cyanobacterial cells to modify the composition of their PBS in response to changes in the ambient light color. This process called “chromatic acclimation” (CA)—the initial term was actually “chromatic adaptation,” but was recently replaced in order to best describe this physiological process (Shukla et al., 2012)—was first observed in the early 20th century in freshwater cyanobacteria shifted from red to green light (Engelmann, 1902; Gaidukov, 1903). CA was later on attributed to changes in the phycobiliprotein composition of PBS rods: in red light, rods are entirely composed of PC and cells look green, whereas in green light PC is restricted to the base of the rods and the distal part is made of PE, causing cells to exhibit a bright red color (Boresch, 1922). This type of complementary chromatic acclimation (CCA, also called type 3 chromatic acclimation or CA3) is one among the seven different types of CA known so far in cyanobacteria (Tandeau de Marsac, 1977; Hirose et al., 2019; Sanfilippo et al., 2019a). While CA2—a simple type of CA where PE production is induced in green light, generating longer PBS rods, and repressed in red light—and CA3 occur mainly in freshwater and brackish cyanobacteria, CA4 is the main type occurring in the open ocean and is specific to marine Synechococcus cyanobacteria (Palenik, 2001; Everroad et al., 2006; Humily et al., 2013). Contrary to CA2 and CA3, CA4 does not involve changes in the phycobiliprotein composition of PBS rods, but in their phycobilin composition. In response to shifts between green light (GL) and blue light (BL), chromatic acclimaters can indeed modify the relative amount of the two phycobilins bound to PE-I and PE-II in order to match the predominant ambient light color. More specifically, they exhibit in BL a high ratio of the BL-absorbing phycourobilin (PUB, λmax ≈ 495 nm) to the GL-absorbing phycoerythrobilin (PEB, λmax ≈ 545 nm), and vice-versa in GL (Everroad et al., 2006; Shukla et al., 2012). Variations in PUB and PEB cell content are generally assessed by measuring the relative ratio of whole cell fluorescence excitation at 495 and 545 nm (Exc495:545) with emission set at 580 nm, which in chromatic acclimaters changes from 0.6–0.7 in GL to 1.6–1.7 in BL (Palenik, 2001; Everroad et al., 2006). In the nomenclature of Synechococcus pigment types (PTs) established by Six et al. (2007) and later modified by Humily et al. (2013), chromatic acclimaters are classified as “PT 3d” cells, meaning that they possess PBS rods made of PC, PE-I and PE-II, a feature shared by all PT 3 representatives, and can modify their Exc495:545 ratio. In contrast, PTs 3a, 3b, and 3c display a constitutively low, medium and high Exc495:545 ratio, respectively. For this reason, PT 3a strains are often referred to as “green light specialists” and PT 3c as “blue light specialists” (Grébert et al., 2018, 2022).
Two genetically different types of chromatic acclimaters have been described so far: PTs 3dA and 3dB (Humily et al., 2013). Both possess a small genomic island involved in the CA4 process, yet the CA4-A and CA4-B islands differ genetically and structurally (Humily et al., 2013; Sanfilippo et al., 2019b; Grébert et al., 2021). Although long overlooked, CA4 appears to be an ecologically important process since chromatic acclimaters were shown to account for more than 40% of the whole marine Synechococcus population along the Tara oceans expedition transect (Grébert et al., 2018). Moreover, PTs 3dA and 3dB were found to be equally abundant (22.6% and 18.9%, respectively) but distributed in complementary ecological niches in the field. The former was indeed predominant in cold, nutrient-rich and highly productive waters at high latitude, as well as in other vertically mixed environments, while the latter was mostly found in nitrogen and phosphorus-poor oceanic areas and appeared to be more abundant at depth. The emergence and maintenance of two CA4 types over the course of evolution, as well as the differential distribution of PTs 3dA and 3dB in the environment (Grébert et al., 2018), strongly suggest that they may not be as phenotypically equivalent as previously thought (Humily et al., 2013). To check this hypothesis, we acclimated three representatives of each PT 3dA and 3dB in batch culture under two conditions of temperature, two light irradiances and five light colors in order to compare their growth rates and PBS properties. Furthermore, we performed shifts from BL to GL (and vice-versa) at two irradiances to compare the CA4 kinetics between five strains of each PT. These experiments demonstrated that PT 3dA and 3dB strains actually differ in the blue-to-green light ratio necessary to trigger the CA4 process, and revealed some significant discrepancies in their acclimation pace.
Materials and methods
Biological material and culture conditions
Ten Synechococcus strains, of which five PT 3dA and five PT 3dB representatives (Table 1), were retrieved from the Roscoff Culture Collection.1 These strains were isolated from diverse environments and selected based on their genome availability (Doré et al., 2020) and clade affiliation, in order to include the CA4-A model strain RS9916 (Shukla et al., 2012; Sanfilippo et al., 2016, 2019b) as well as representatives from all five major clades (I to IV and CRD1) in the global ocean (Farrant et al., 2016).
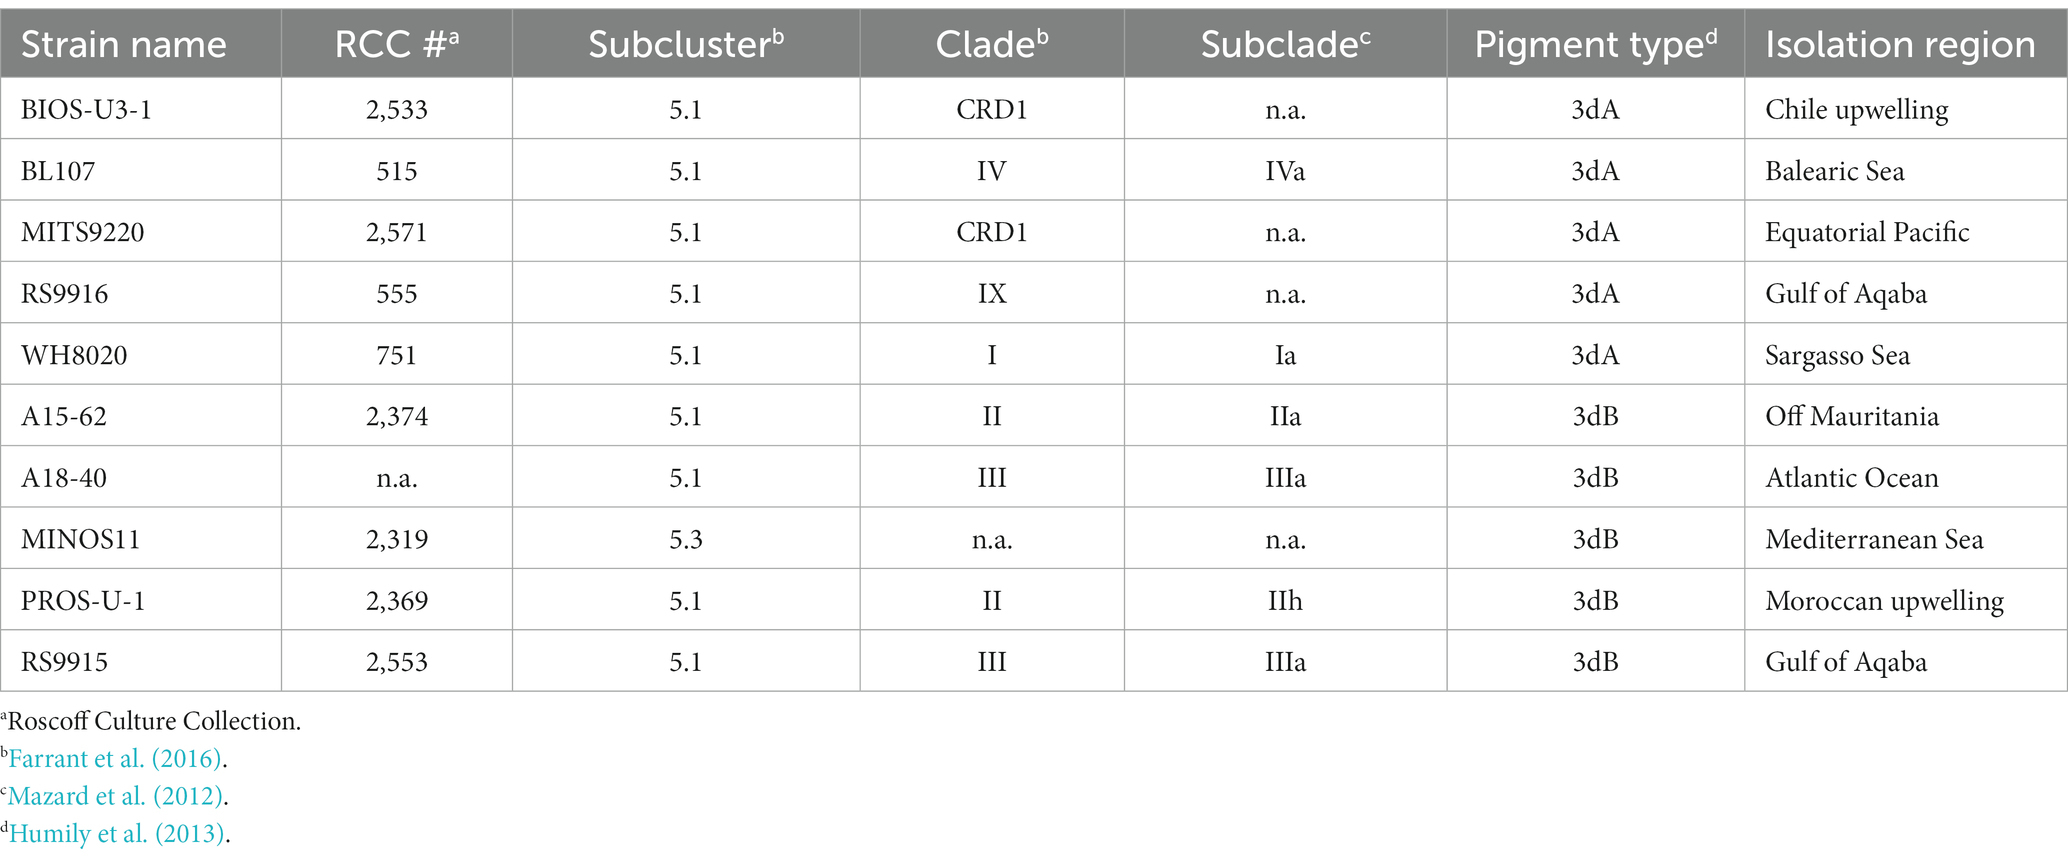
Table 1. Characteristics of the different Synechococcus strains used in this study.
Cells were grown in 50 mL polystyrene flasks (Sarstedt, Germany) in PCR-S11 medium (Rippka et al., 2000) supplemented with 1 mM sodium nitrate. All were pre-acclimated prior to measurements for at least 3 weeks in continuous light provided by blue and/or green LEDs (Alpheus, France) in temperature-controlled chambers.
Acclimation experiments
A selection of six out of the 10 abovementioned strains (BL107, RS9916 and WH8020 for PT 3dA and A15-62, PROS-U-1 and RS9915 for PT 3dB; Table 1) were grown in the following conditions: (i) two temperatures: 18°C and 25°C; (ii) two irradiances: low light (LL, 15 μmol photons m−2 s−1) and high light (HL, 75 μmol photons m−2 s−1); (iii) five light qualities: blue light (100% BL), green light (100% GL), as well as three mixes of blue-green light: 25% BL–75% GL, 50% BL–50% GL and 75% BL–25% GL. Both temperatures were selected based on Ferrieux et al. (2022), which recently demonstrated that 18 and 25°C were the lowest and highest temperatures at which a selection of Synechococcus strains belonging to the five major clades in the environment were capable of growing. The two irradiances were chosen as being similar to those used in a previous study by Humily et al. (2013), for easier comparison of results between the two studies.
The light intensity and visible spectra of LEDs were measured using a PG200N Spectral PAR Meter (UPRtek, Taiwan; Supplementary Figure S1). Each strain was grown in triplicate and inoculated at an initial cell density of 3 × 10⁶ cells mL−1. Samples were harvested every day to measure cell concentration and fluorescence parameters by flow cytometry, and once during the exponential phase to measure phycobilin and phycobiliprotein contents by spectrofluorimetry (see below).
Shift experiments
Shift experiments between 100% low BL (LBL) and 100% low GL (LGL) and vice-versa, and between 100% high BL (HBL) and 100% high GL (HGL) and vice-versa, were performed on all 10 Synechococcus strains mentioned in Table 1, but only at 25°C. Each strain was diluted with fresh medium before the beginning of the experiments and regularly transferred in order to avoid limitation by nutrients. Aliquots were collected two to three times a day, depending on light intensity, to measure phycobilin content by spectrofluorimetry (see below).
Flow cytometry
Culture aliquots were sampled twice a day, fixed with 0.25% (v/v) glutaraldehyde (grade II, Sigma Aldrich, United States) and stored at −80°C until analysis (Marie et al., 1999). Cell density was determined using a Guava easyCyte flow cytometer equipped with a 488 nm laser and the Guavasoft software (Luminex Corporation, Texas). Average orange (583 nm) and red (695 nm) fluorescence signals were used as proxies of the phycoerythrin (PE) and chlorophyll a (Chl a) contents per cell, respectively. Both signals were normalized to that of standard fluorescent 0.95 μm silica beads.
Spectrofluorimetry
In vivo fluorescence spectra were recorded at 240 nm min−1 with slits fixed at 10 nm once during the exponential phase using a spectrofluorimeter FL6500 (Perkin-Elmer, United-States). Excitation spectra were acquired between 450 and 560 nm with emission set at 580 nm, corresponding to the PE emission maximum. Emission spectra were recorded between 550 and 750 nm with excitation set at 530 nm, close to the PEB excitation maximum. Spectra were monitored and analyzed with the Fluorescence software (Perkin-Elmer). The Exc495:545 fluorescence excitation ratio was used as a proxy for the PUB:PEB ratio. The Em560:650 and Em650:680 fluorescence emission ratios were used as proxies of the PE to PC and PC to PBS terminal acceptor (TA) ratios, respectively. The first parameter provided information about the electron transfer efficiency within the PBS and/or the length of PBS rods, and the second one about the coupling of PBS to PSII reaction center chlorophylls.
Statistical analyses
All statistical analyses were conducted using the R software (version 4.2.3; R Core Team, 2021) in order to test for significant differences between PTs 3dA and 3dB. The potential influence of growing conditions (temperature, light quality and quantity) was also investigated.
For acclimation experiments, a linear mixed model (nlme package version 3.1-164; Pinheiro et al., 2023) was fit to each variable (growth rate, flow cytometry fluorescence signals, fluorescence excitation and emission ratios), by considering the temperature, light intensity, light color and pigment type as fixed factors, and the strain as a random factor.
For shift experiments, the slopes of the linear parts of Exc495:545 vs. time curves were compared between PTs 3dA and 3dB representatives using t-tests. As the number of strains used for shift experiments was reduced (n = 3 for PT 3dA and n = 5 for PT 3dB), the significance level was raised to 0.1 in order to confer more power to statistical analyses.
Results
Acclimation experiments
A first set of experiments was performed to investigate the effect of temperature, light intensity and color on various physiological characteristics including growth rate, flow cytometric red and orange fluorescence signals, as well as phycobilin and phycobiliprotein content, of six Synechococcus strains (BL107, RS9916 and WH8020 for PT 3dA and A15-62, PROS-U-1 and RS9915 for PT 3dB; Table 1) pre-acclimated for at least 3 weeks to the different tested conditions.
Growth rate
The growth rate (μ) of the six Synechococcus strains was lower at 18°C than at 25°C (p-value <0.05; Figure 1; Supplementary Table S1). Maximal μ values were reached at 25°C in HL, with all strains except WH8020 achieving more than one cell division per day (μ > 0.69 day−1; Supplementary Figure S2). While a clear increase in growth rates of both PTs was seen between LL and HL at 25°C, a less marked difference was noted at 18°C, suggesting that temperature and light intensity had a synergistic effect on μ. This was confirmed by the mixed model, which highlighted an interaction effect between the two factors (p-value <0.05; Supplementary Table S1). While for any given strain, the growth rate varied little between the different light colors (Supplementary Figure S2), PT 3dA representatives globally grew faster than their PT 3dB counterparts (p-value <0.05; Figure 1; Supplementary Table S1).
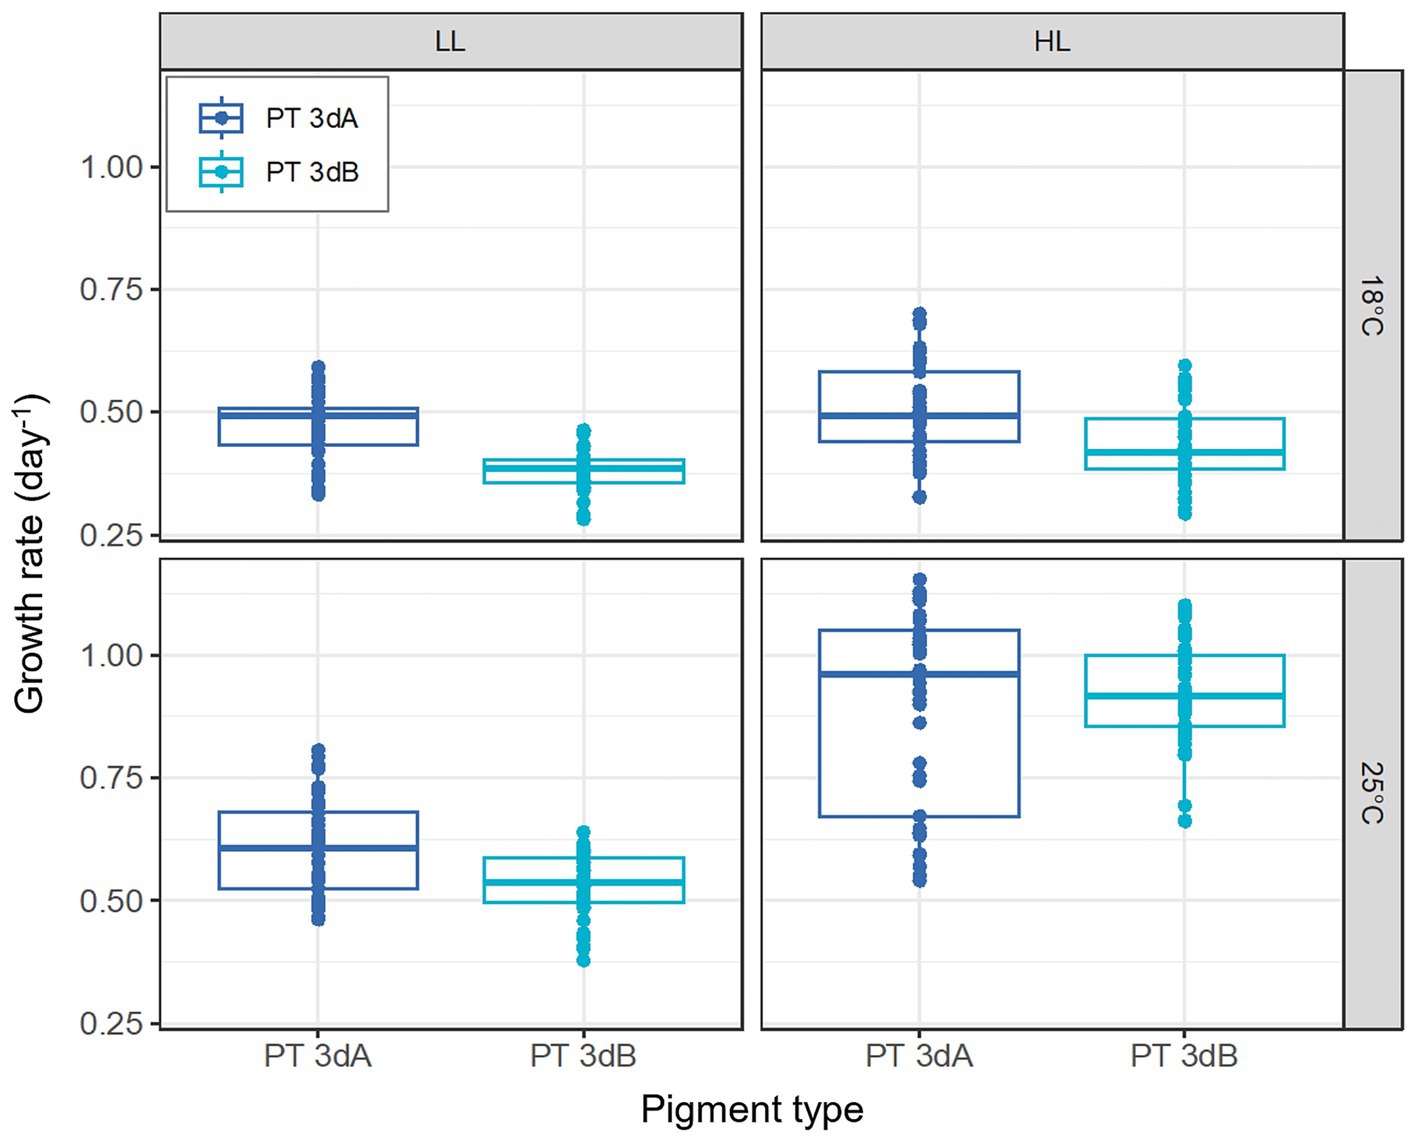
Figure 1. Growth rates of six PT 3dA and 3dB representatives acclimated to the different conditions of temperature and light intensity used for acclimation experiments. Each boxplot represents the measurements performed for all representatives of each pigment type in the five light colors tested in this study (n = 45). The light quality factor is not shown, as it had no significant effect on growth rate (p-value >0.05). LL, 15 μmol photons m−2 s−1; HL, 75 μmol photons m−2 s−1; PT, pigment type.
Chlorophyll a and phycoerythrin fluorescence
A significant downward trend in both flow cytometric red (Chl a) and orange (PE) fluorescence signals was observed from 100% BL to 100% GL for both PTs in all conditions (p-value <0.05; Figures 2, 3; Supplementary Figures S3, S4; Supplementary Table S1). Besides light quality, temperature and light intensity strongly impacted Chl a and PE fluorescence signals (p-value <0.05; Supplementary Table S1). Both variables were indeed higher in LL than HL, but also at 25°C compared to 18°C (Figures 2, 3). Due to the synergistic effect of temperature and irradiance (p-value <0.05; Supplementary Table S1), maximum values were measured at 25°C in LL, and conversely minima were associated with the 18°C and HL condition.
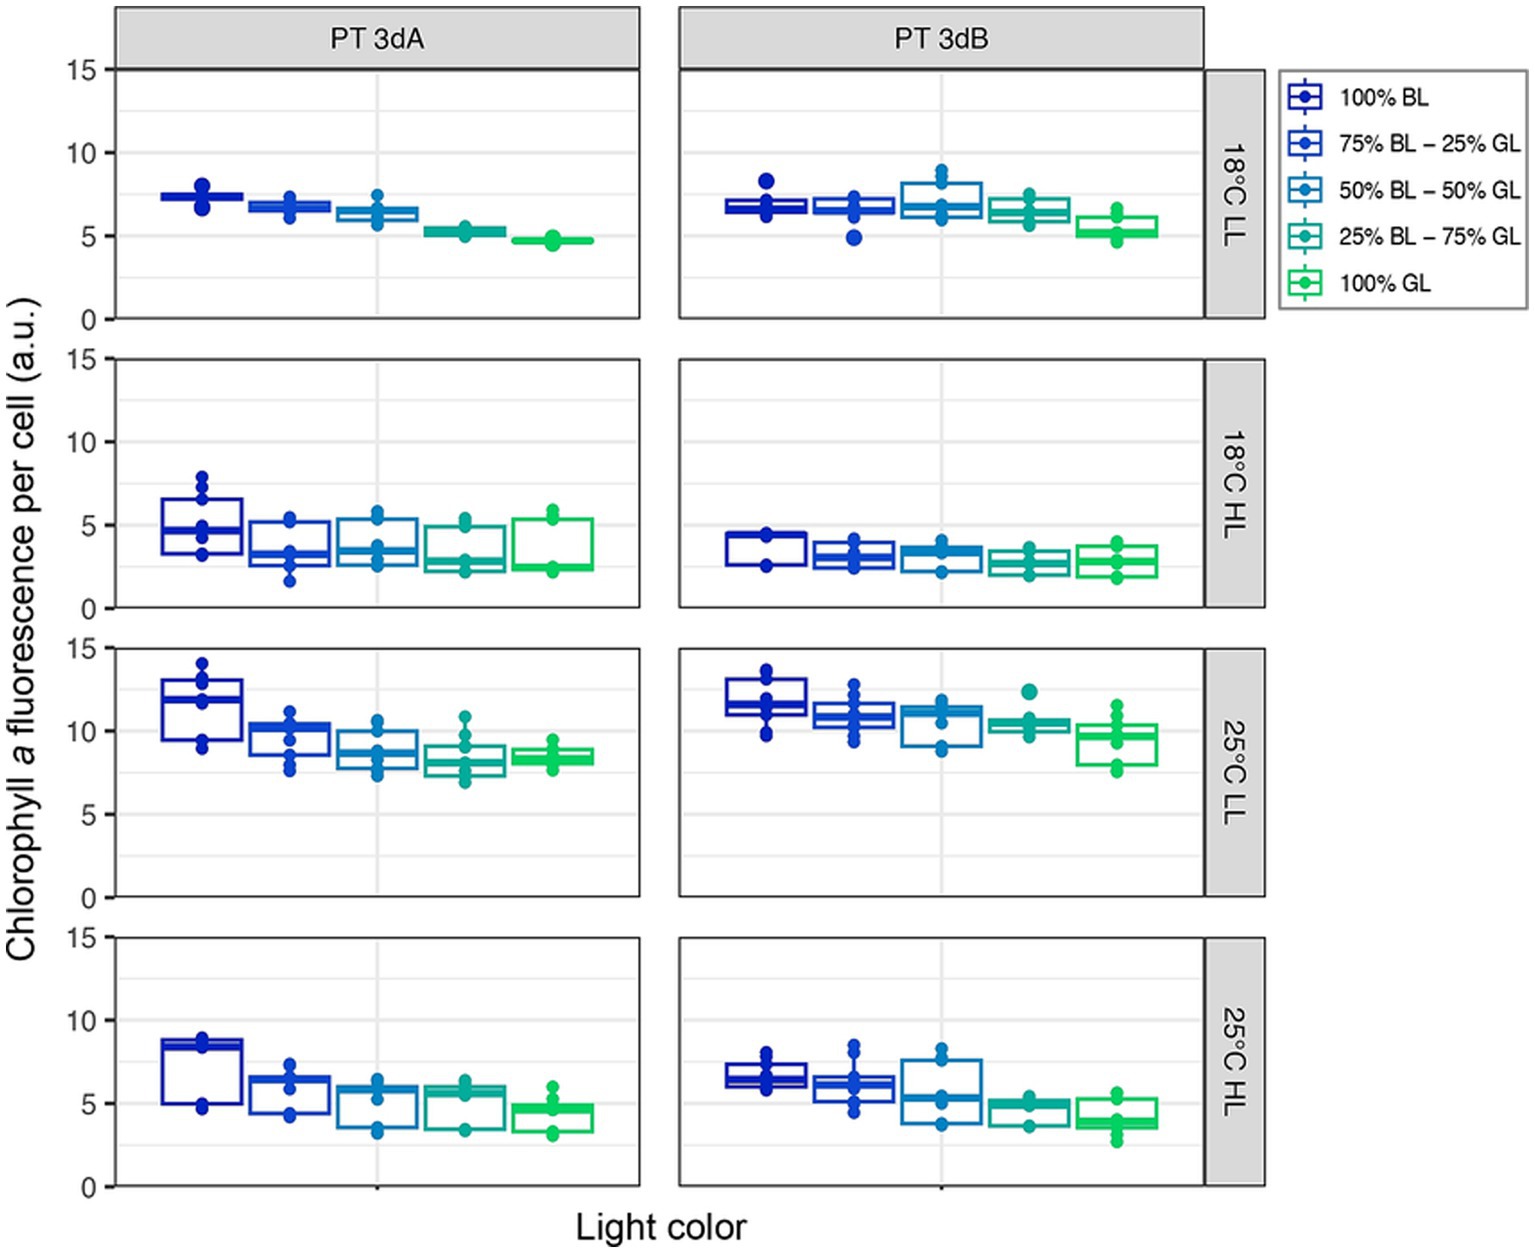
Figure 2. Flow cytometric chlorophyll a fluorescence per cell of six PT 3dA and 3dB representatives acclimated to the different conditions of temperature, light intensity and quality used for acclimation experiments. Each boxplot represents the measurements performed for all representatives of each pigment type in one light color condition (n = 9). LL, 15 μmol photons m−2 s−1; HL, 75 μmol photons m−2 s−1; PT, pigment type; BL, blue light; GL, green light.
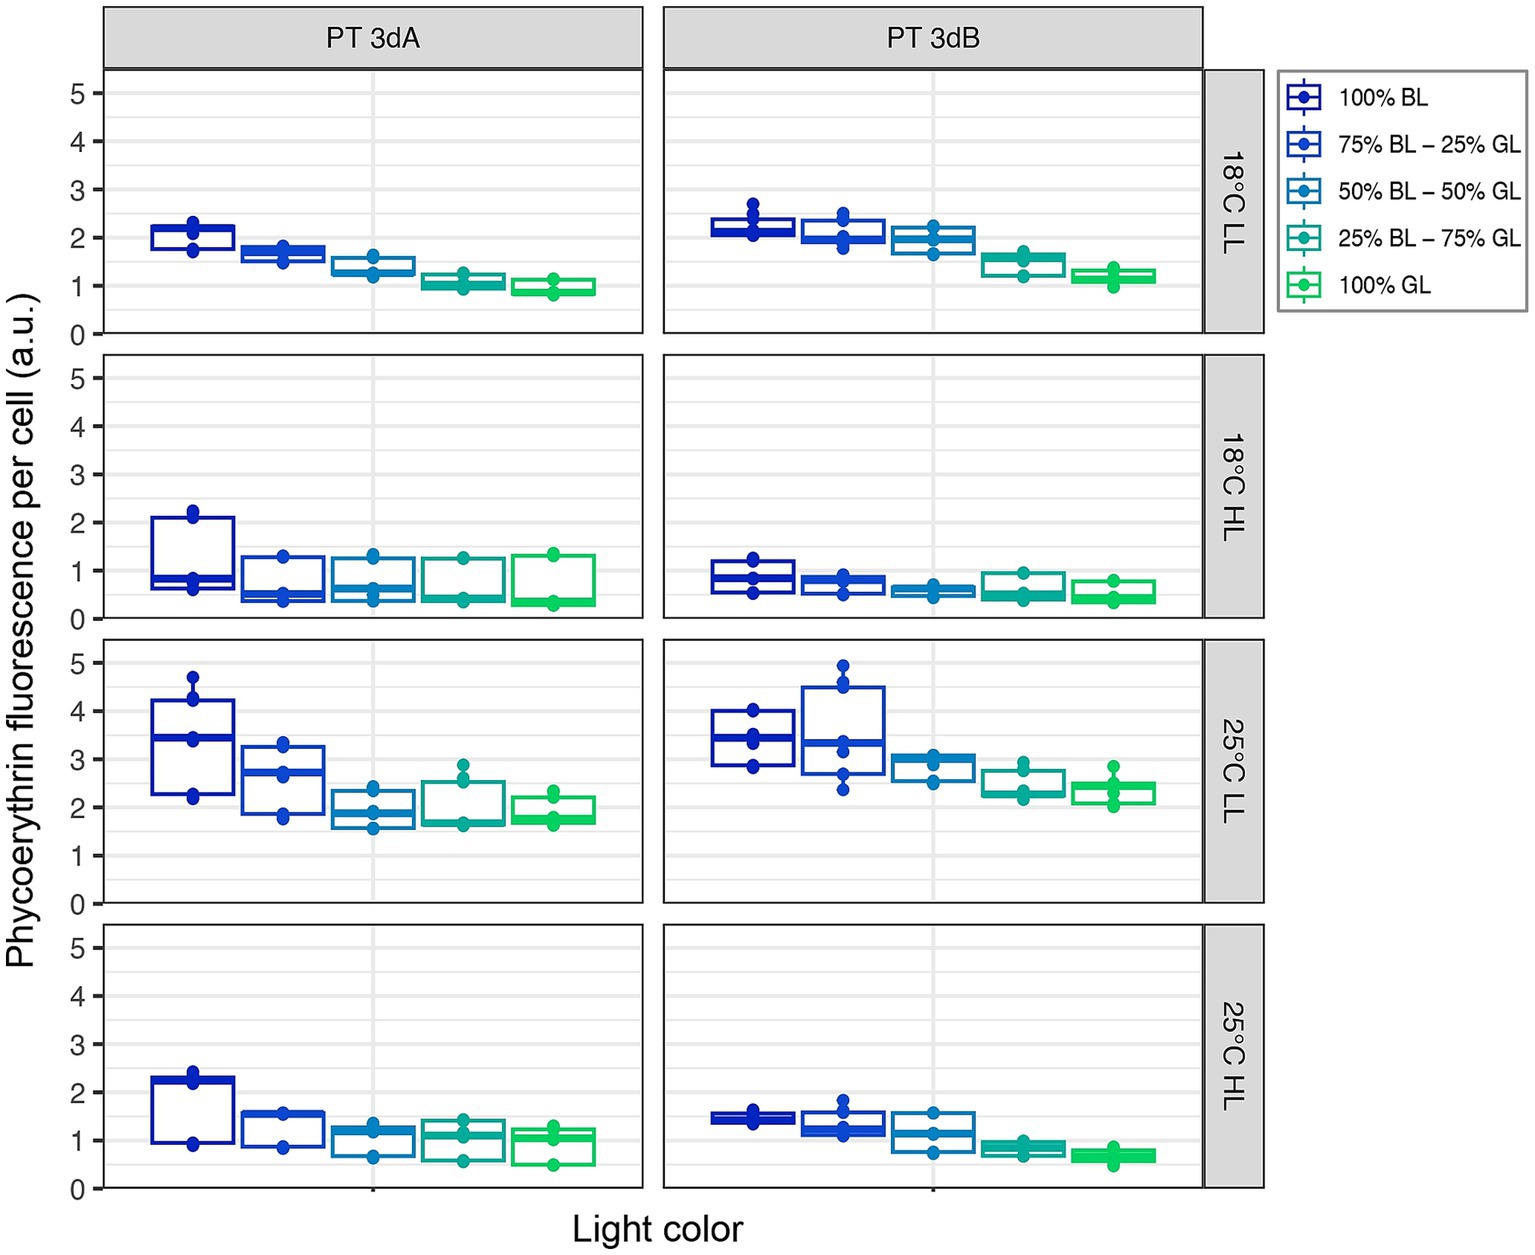
Figure 3. Same as Figure 2 but for the flow cytometric phycoerythrin fluorescence per cell.
Phycobilin content
All strains globally displayed Exc495:545 fluorescence excitation ratio, a proxy of the whole cell PUB:PEB ratio, typical of chromatic acclimaters when grown in 100% GL (Exc495:545 ≈ 0.6–0.7) or 100% BL (Exc495:545 ≈ 1.6–1.7; Humily et al., 2013; Supplementary Figure S5). It is important to note that the LEDs used to get the 100% GL condition actually peaked at 515 nm, which is at the blue edge of the green wavelength range (Supplementary Figure S1). Yet, the fact that all tested strains exhibited the lowest possible Exc495:545 ratio for chromatic acclimaters shows that they did sense this light quality as being full GL.
The light quality had the strongest impact on the Exc495:545 fluorescence excitation ratio (p-value <0.05; Supplementary Table S1), the latter expectedly decreasing from 100% BL to 100% GL. Interestingly, the two PTs did not respond in the same way to the light color (p-value <0.05; Supplementary Table S1). PT 3dB representatives indeed exhibited higher Exc495:545 ratios than their PT 3dA counterparts in most intermediate blue-green conditions (Figure 4), due to a more progressive decrease of their ratio from the BL- to the GL-acclimated state. This trend was more pronounced in LL than HL conditions, as confirmed by the significant interaction effect between PT and light quantity (p-value <0.05; Supplementary Table S1).
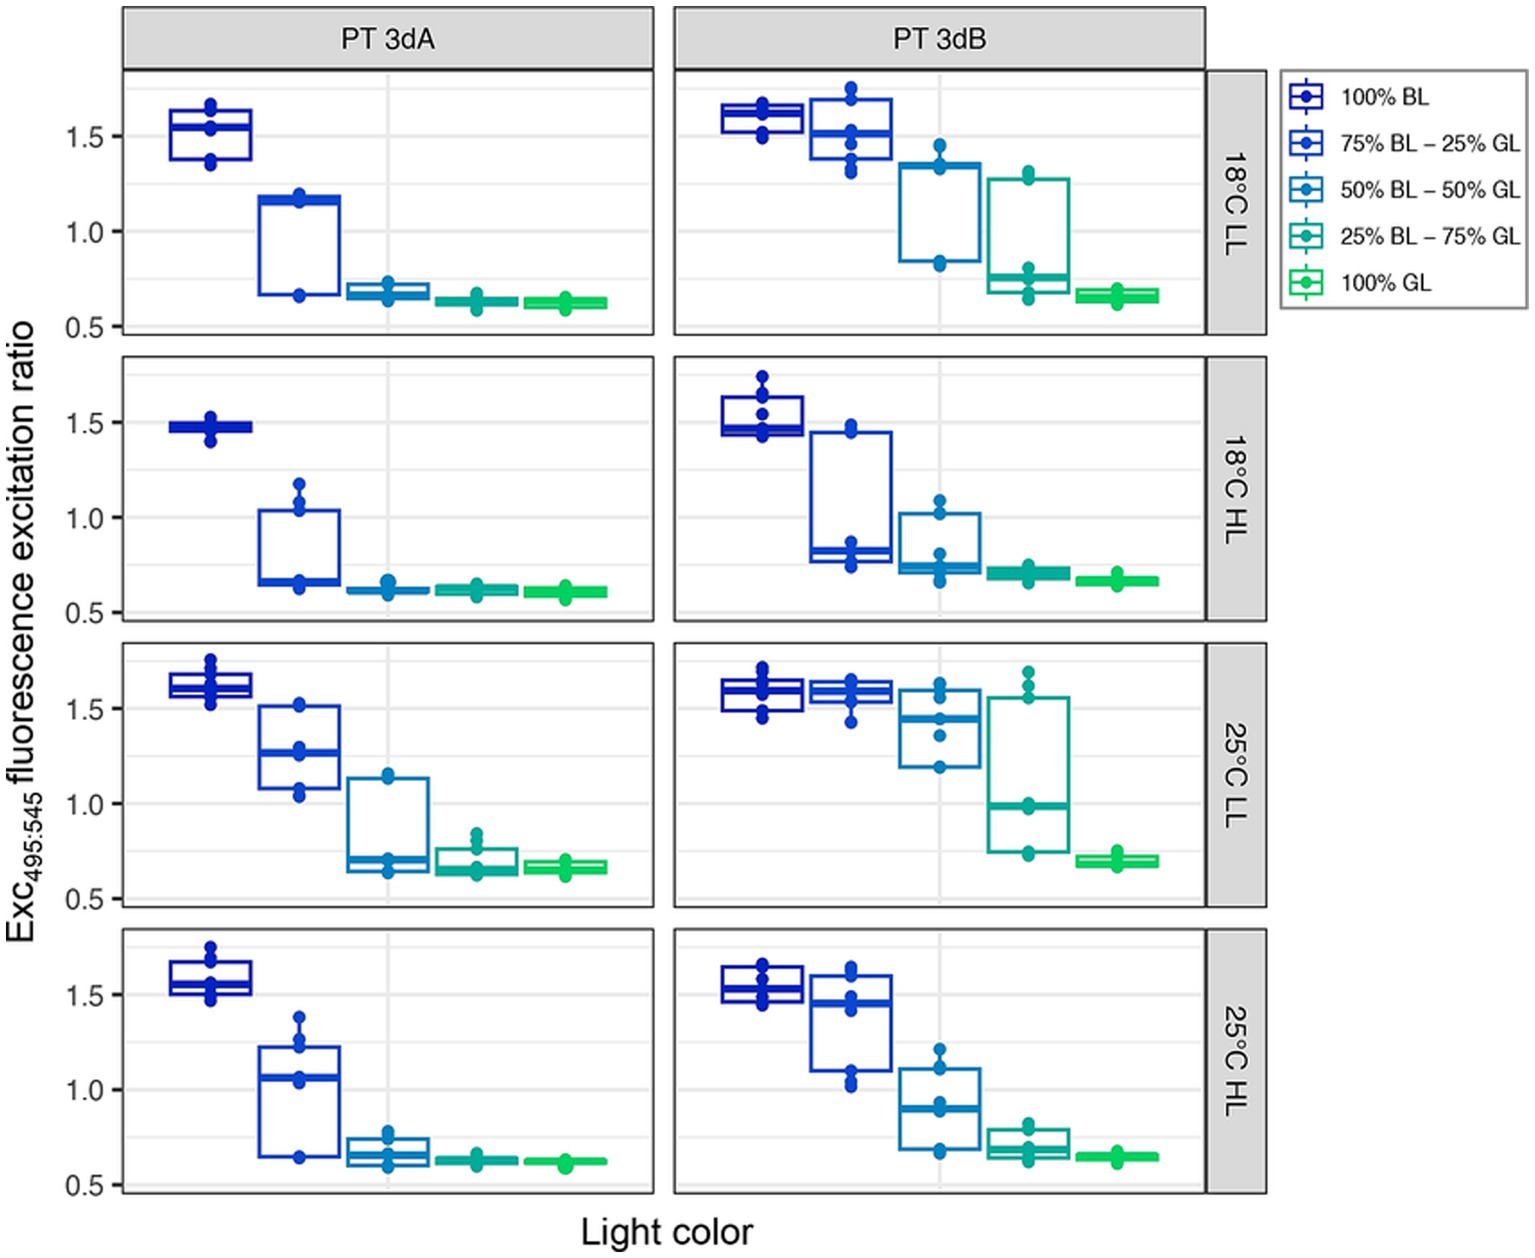
Figure 4. Same as Figure 2 but for the Exc495:545 fluorescence excitation ratio, a proxy of the whole cell PUB:PEB ratio.
Phycobiliprotein content
PT 3dA and 3dB representatives exhibited different patterns of variation with light color of the Em560:650 fluorescence emission ratio, a proxy of the whole cell PE:PC ratio (p-value <0.05; Figure 5; Supplementary Figure S6; Supplementary Table S1). The Em560:650 ratio was indeed generally higher in PT 3dA than PT 3dB strains and often decreased from 100% BL to 100% GL in the former, while it remained fairly stable whatever the light quality in the latter. Although less obvious, the mixed model demonstrated that the Em560:650 fluorescence emission ratio was also significantly influenced by the temperature and light intensity (p-value <0.05; Supplementary Table S1).
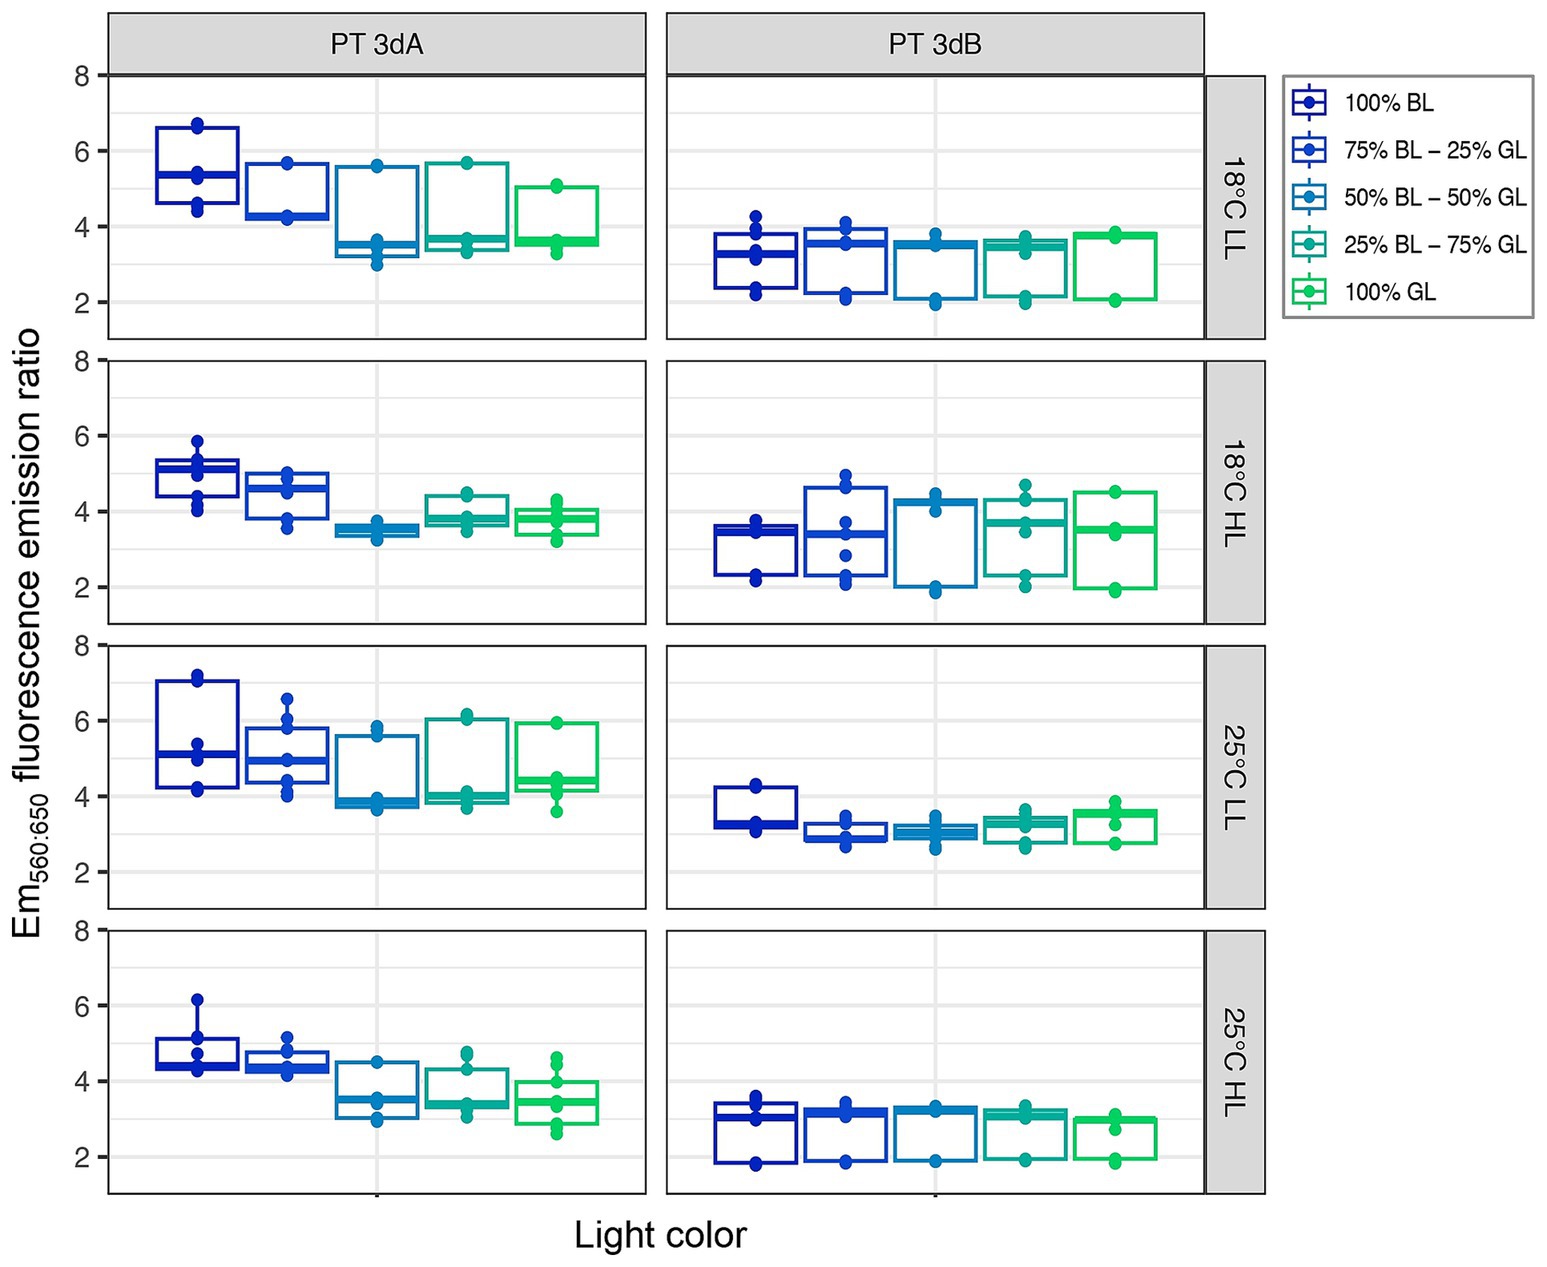
Figure 5. Same as Figure 2 but for the Em560:650 fluorescence emission ratio, a proxy of the whole cell PE:PC ratio.
The Em650:680 fluorescence emission ratio, a proxy of the whole cell PC:TA ratio, was only impacted by the temperature factor, which was found to interact with the PT (p-value <0.05; Supplementary Table S1). PT 3dA representatives were indeed able to achieve higher values than PT 3dB strains in all conditions, but the difference was even greater at 25°C (Figure 6; Supplementary Figure S7). Moreover, the PTs were not similarly affected by the light quantity (p-value <0.05; Supplementary Table S1) as increasing irradiance seemed to induce an increase in the Em650:680 ratio in PT 3dA strains and a decrease in PT 3dB cells.
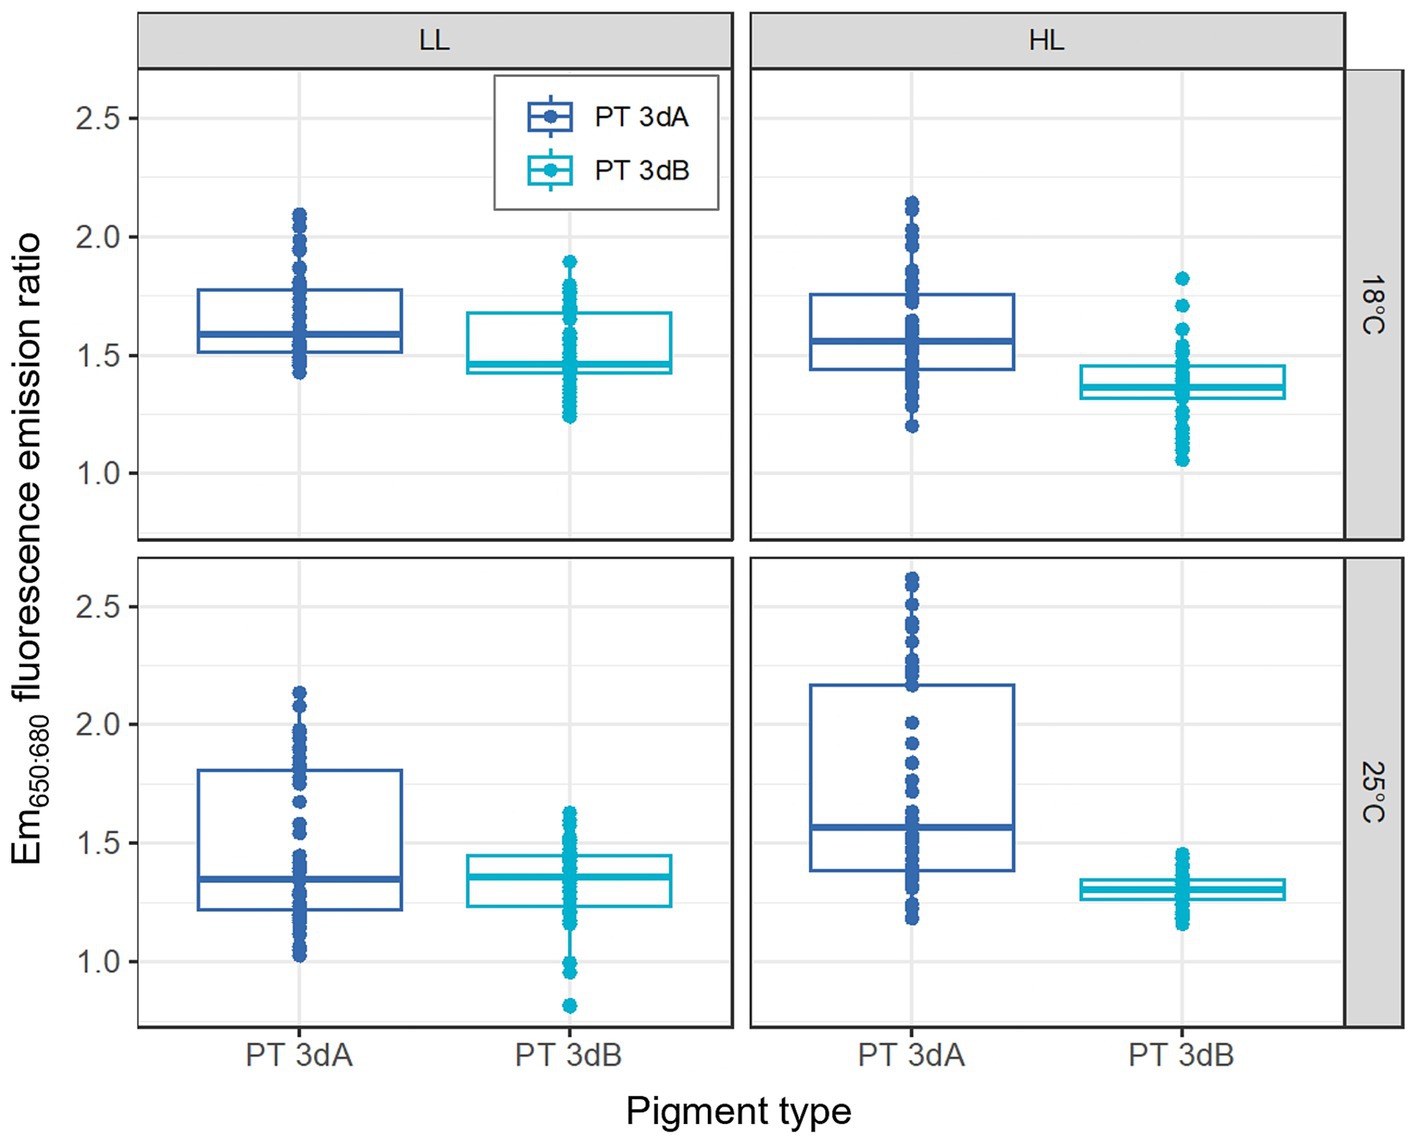
Figure 6. Same as Figure 1 but for the Em650:680 fluorescence emission ratio, a proxy of the whole cell PC:TA ratio.
Shift experiments
A second set of experiments consisted in studying the CA4 kinetics following shifts from BL to GL, and vice-versa, for 10 Synechococcus strains (BIOS-U3-1, BL107, MITS9220, RS9916 and WH8020 for PT 3dA and A15-62, A18-40, MINOS11, PROS-U-1 and RS9915 for PT 3dB; Table 1) pre-acclimated for at least 3 weeks to either LL or HL at 25°C. As expected, all strains exhibited slower chromatic acclimation kinetics in LL than HL, regardless of the initial light color, since the CA4 process took about 7 days in the former condition and 4 days in the latter.
Consistent with a previous study (Humily et al., 2013), the BIOS-U3-1 strain could not fully acclimate to HBL, never exceeding an Exc495:545 ratio of about 1.2, and the same observation was made for the other representative of the CRD1 clade, MITS9220. We therefore excluded these two strains before comparing the kinetics of Exc495:545 variations between PTs. To do so, we compared the slopes of linear regressions computed from the linear parts of the kinetics between the shift time (T0) and the time needed for the cells to reach a plateau (Figure 7; 50 h for HGL to HBL, 75 h for HBL to HGL, 125 h for both LL shifts). These slopes (Supplementary Figures S8A–D), which reflected the rate of Exc495:545 variation over time, were then compared between PTs (Supplementary Figures S9A,B). This comparison demonstrated that the rate of Exc495:545 variation was significantly higher for PT 3dB than PT 3dA cells from HBL to HGL (p-value <0.1; Supplementary Figure S9A). Conversely, PT 3dA strains displayed a significantly faster acclimation pace than their PT 3dB counterparts after the shifts from LGL to LBL and HGL to HBL (p-value <0.1; Supplementary Figure S9B).
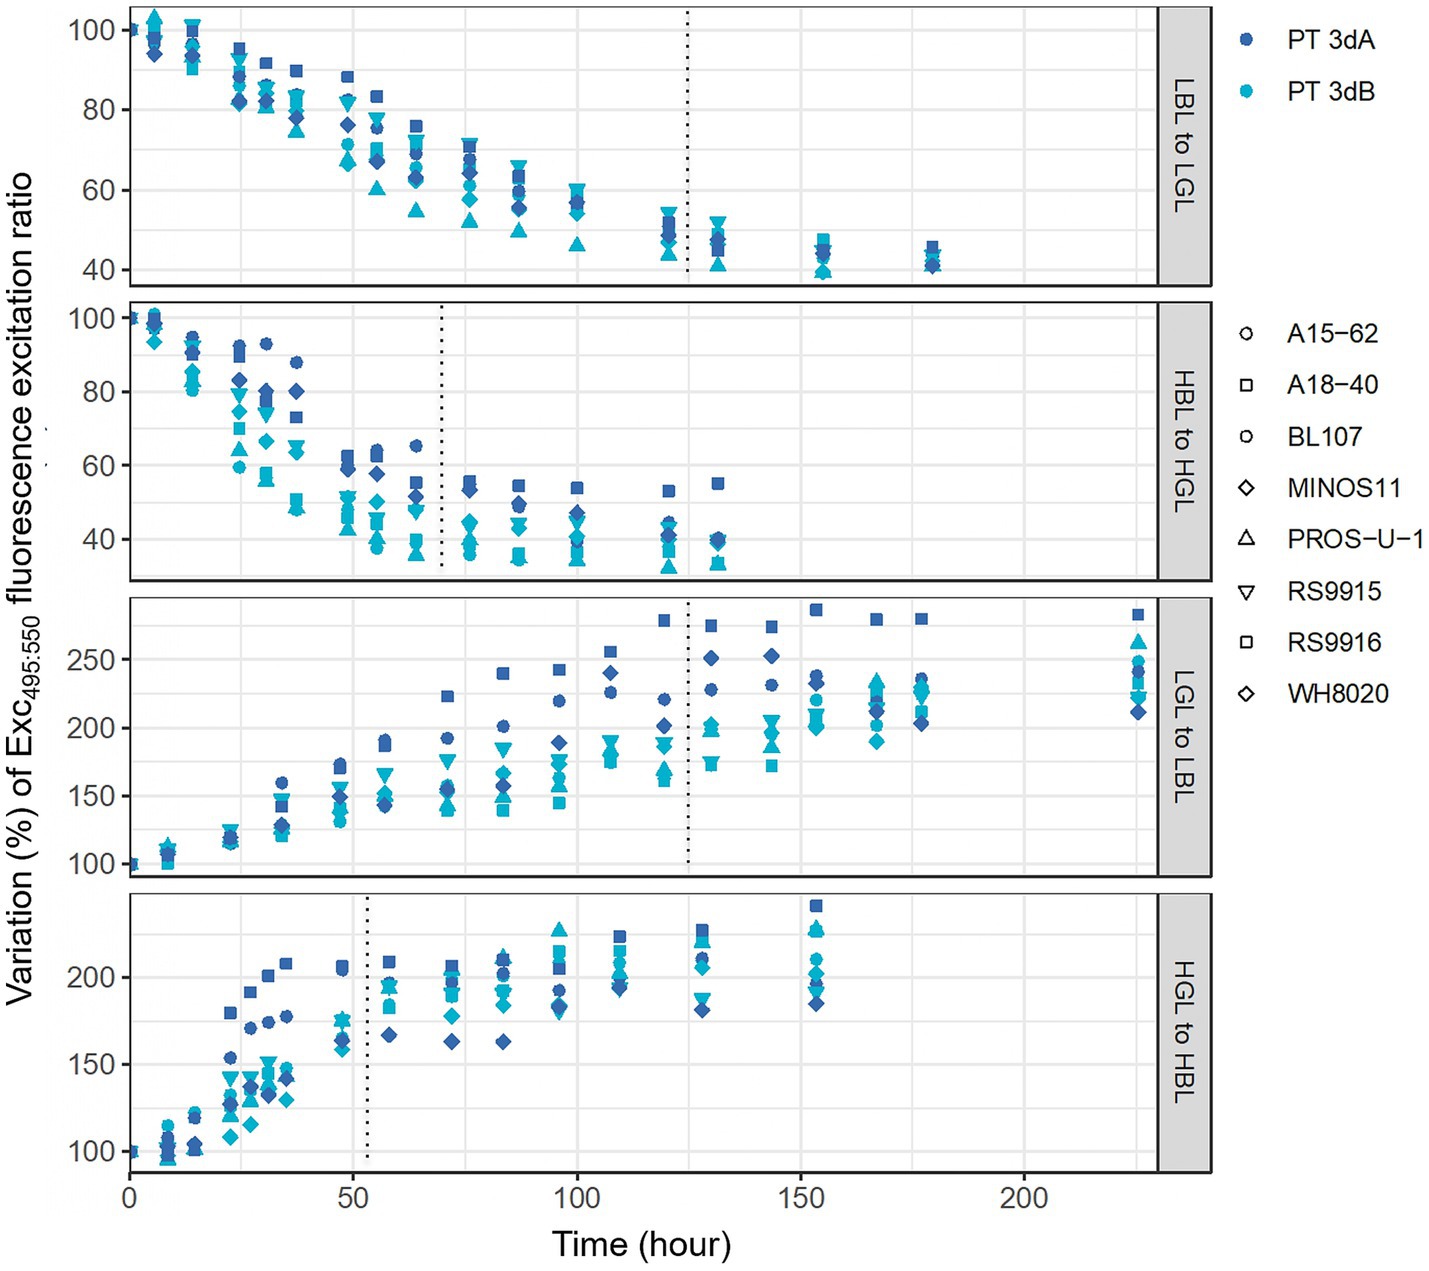
Figure 7. Time course variations of the Exc495:545 fluorescence excitation ratio, a proxy of the whole cell PUB:PEB ratio, of eight PT 3dA and 3dB representatives after an abrupt shift of light quality from 100% blue to 100% green light, and vice-versa, in low and high light. Data are normalized to the initial value at time zero. Each point represents one measurement performed for one strain. LL, 15 μmol photons m−2 s−1; HL, 75 μmol photons m−2 s−1; PT, pigment type; BL, blue light; GL, green light.
Discussion
The marine environment was recently shown to shelter five distinct spectral niches, based on the absorption properties of water molecules as well as the variable concentrations of colored dissolved organic matter and non-algal particles (Holtrop et al., 2021). Thanks to their specific antenna complexes binding divinyl derivatives of Chl a and b (Goericke and Repeta, 1992), cells of the tiny cyanobacterium Prochlorococcus appear to be well adapted to the violet niche (401–449 nm), which encompasses the central oceanic gyres. In contrast, Synechococcus BL specialists (PT 3c), i.e., cells possessing a high content in PUB (λmax ≈ 495 nm), are best suited for the blue niche (449–514 nm) that comprises most other open ocean zones. As concerns Synechococcus GL specialists (PT 3a), i.e., cells possessing a high content in PEB (λmax ≈ 545 nm), they preferentially thrive in the green niche (514–605 nm) that is essentially found in coastal and upwelling areas (Holtrop et al., 2021). In this context, Synechococcus cells capable of CA4, i.e., to match their Exc495:545 ratio to the ambient light color in order to optimize photon collection, expectedly colonize both blue and green niches, where they can constitute a large part of the whole Synechococcus population, especially at high latitude (Xia et al., 2017; Grébert et al., 2018). The occurrence of two genetically distinct types of chromatic acclimaters colonizing different habitats in the field (Humily et al., 2013; Grébert et al., 2018, 2021, 2022) however made us wonder whether they displayed phenotypic differences that may partly explain their different spatial distributions.
Here, we looked at the interplay between light quality, light quantity and temperature, and we managed to unveil subtle but significant differences between PTs 3dA and 3dB. Comparisons of cultures acclimated to various light colors ranging from 100% BL to 100% GL at two temperatures and two irradiance levels revealed that, in intermediate blue-green light conditions, PT 3dB strains displayed significantly higher Exc495:545 ratios than their PT 3dA counterparts (Figure 4). The observed differences are notably due to a more progressive decrease of the Exc495:545 ratio for PT 3dB than PT 3dA representatives from BL to GL. The latter were indeed more frequently found in the GL-acclimated state with some of them, such as RS9916 in most conditions, even shifting their Exc495:545 ratio to the BL-acclimated state only in 100% BL (Supplementary Figure S5). In contrast, PT 3dB cells tended to remain longer in the BL-acclimated state, even when the proportion of GL in the incident light was important, an extreme case being A15-62 at 25°C and LL that shifted to the GL-acclimated state only in 100% GL. Based on the phenotypes of knock-out mutants of genes involved in the CA4 process, it has been previously hypothesized that the PT 3dA genotype may have derived from a former GL specialist having acquired the CA4 capacity by integrating a CA4-A island, while the PT 3dB genotype may have been derived from a former BL specialist having integrated a CA4-B island (Sanfilippo et al., 2019b; Grébert et al., 2021). Interestingly, our results are in good agreement with this hypothesis since they suggest that PT 3dA strains need a large proportion of blue photons to induce the CA4-A response, while on the contrary PT 3dB cells require a larger proportion of green photons to induce the CA4-B response. In other words, the two PTs seemingly differ in the blue-to-green ratio necessary to trigger the CA4 process, even though there is some strain-to-strain variability.
The molecular basis of the difference in Exc495:545 ratio between chromatic acclimaters fully acclimated to either 100% BL or 100% GL has been well documented, and was found to be the same in the PT 3dA model strain RS9916 (Shukla et al., 2012; Sanfilippo et al., 2016, 2019b) and the PT 3dB model strain A15-62 (Grébert et al., 2021). Both CA4-A and -B processes indeed consist in an exchange of one out of the five phycobilins bound to the α-PE-I subunit (Cys-139) and two out of the six phycobilins bound to the α-PE-II subunit (Cys-83 and Cys-140), with PUB molecules being bound to these three positions in BL, and PEB in GL. However, the observation of intermediate Exc495:545 ratios in blue-green light mixes (Figure 4; see also Sanfilippo et al., 2019b) remains difficult to interpret as it may translate different, but not mutually exclusive, sources of variability. More precisely, this observation may be explained by: (i) heterogeneous populations of Synechococcus cells with PBS either fully acclimated to BL (PUB-rich) or to GL (PEB-rich); (ii) homogeneous populations of Synechococcus cells all having different phycobilins at the three swing sites in a given light color; (iii) individual cells containing PBS with different chromophorylation states; and/or (iv) heterogeneity in phycobiliprotein chromophorylation within single PBS, i.e., PBS having rods with different chromophorylation states. Unfortunately, there is currently no simple experimental way to demonstrate which of these hypotheses is most likely.
In contrast to Exc495:545 ratios, light quality had no significant effect on growth rates, while the latter varied with PT, temperature and light quantity. In HL, the growth rates of all six chromatic acclimaters used for acclimation experiments were significantly higher at 25°C than 18°C, the former being an optimal growth temperature for most marine Synechococcus strains tested so far (Figure 1; Mackey et al., 2013; Pittera et al., 2014; Breton et al., 2020; Doré et al., 2022; Ferrieux et al., 2022). The impact of increasing temperature on growth rate was however much less important at LL, confirming that temperature and irradiance have a synergistic effect on growth, as previously observed in the model strain WH7803 (Guyet et al., 2020). Of note, whatever the temperature, all cells were also able of typical photoacclimation, i.e., to adjust the surface of their photosynthetic membranes to reduce the incoming photon flux (Kana and Glibert, 1987; Moore et al., 1995; Six et al., 2004), as shown by the decrease of both Chl a and PE fluorescence signals between LL and HL (Figures 2, 3). Interestingly, both parameters also slightly decreased in all representatives in response to progressive changes in light quality from 100% BL to 100% GL (Figures 2, 3; Supplementary Figures S3, S4), suggesting that chromatic acclimaters used GL more efficiently than BL, at least in our experimental setup. Consequently, all strains needed to slightly adjust their thylakoid surface (and thus the number of both photosystems and PBS) in BL in order to maximize the collection of available photons and maintain similar growth rate (Supplementary Figure S2).
Another parameter that differentiated PTs 3dA from 3dB in the present study is the Em560:650 fluorescence emission ratio, which is often interpreted as a proxy of the PE:PC ratio. This ratio exhibited higher values and tended to decrease from 100% BL to 100% GL in PT 3dA strains, while it was more stable in PT 3dB representatives (Figure 5). Since PE fluorescence per cell decreased in PT 3dA from BL to GL (Figure 3) and the PC:TA ratio was somewhat constant (Supplementary Figure S7), this may indicate a lower within-rod photon energy transfer efficiency in PT 3dA cells in GL compared to BL. Another possibility is that PBS rod length decreased by disconnection of the distal PUB-rich PE-II hexamers, as previously observed in Synechococcus sp. WH8102 as a result of photoacclimation (Six et al., 2004). In PT 3dB representatives, the PE:PC ratio stability, associated with decreasing PE fluorescence, rather suggests that other kinds of structural changes occurred, such as a reduction of the PBS number per cell or of the thylakoidal surface area.
Shift experiments in both LL and HL conditions from 100% BL to 100% GL, and vice-versa, confirmed previous observations by Humily et al. (2013) that PT 3dA cells generally exhibit a more variable acclimation kinetics than PT 3dB cells. Two PT 3dA strains belonging to the CRD1 clade (BIOS-U3-1 and MITS9220) were indeed stuck at an Exc495:545 ratio of around 1.2 in HBL (corresponding to “phenotypic group 2” in Humily et al., 2013). Moreover, MITS9220 and another PT 3dA strain (BL107) showed a delay in the initiation of CA4 from LBL to LGL, but not in the reverse condition, as previously reported by these authors for BL107, a behavior they designed as “phenotypic group 3.” Some PT 3dA representatives common to both studies (RS9916 and WH8020) exhibited different behaviors. Both strains indeed reached a significantly lower Exc495:545 ratio in HBL than LBL in the previous study but not in the present one, strengthening the idea that PT 3dA cells display a more variable acclimation phenotype than PT 3dB cells, at least in some conditions. In contrast, most PT 3dB representatives exhibited a “typical” CA4 dynamics in both studies, designed by Humily et al. (2013) as “phenotypic group 1.” The only exceptions are strains such as WH8103 that have a typical CA4-B region but, for a yet unknown reason, have completely lost their CA4 ability and thus display a fixed Exc495:545 ratio. Interestingly in this context, the WH8109 strain that was reported to display this fixed phenotype in Humily et al. (2013) was found to have recovered its CA4 ability in a more recent study (Lovindeer et al., 2021). The wider phenotypic variability observed in PT 3dA representatives might be attributed to the erratic genomic localization of the CA4-A island, which can be found virtually anywhere in the genome of PT 3dA strains, including the 5′-end of the PBS region, while the CA4-B island is systematically located in the middle of the PBS rod region in PT 3dB cells (Humily et al., 2013; Grébert et al., 2022).
The most striking outcome of our shift experiments was certainly the discrepancy in acclimation paces between the two types of chromatic acclimaters in three out of the four tested conditions. Indeed, after the LGL to LBL and HGL to HBL shifts, the PT 3dA representatives acclimated faster than their PT 3dB counterparts, while the opposite pattern was observed after the HBL to HGL shift (Figure 7; Supplementary Figures S8, S9). Altogether, our results showed that while PT 3dA and PT 3dB cells preferentially remain in their respective basal state (i.e., low and high Exc495:545 ratio, respectively) when grown in a blue-green light mix (Figure 4), they can reach the acclimation state opposite to their basal state faster than the other PT once the CA4 process has been triggered (Figure 7; Supplementary Figures S8, S9). These distinct acclimation paces might be due to differences in the organization and gene content of the CA4-A and CA4-B islands. While both share two genes in tandem encoding the regulatory proteins FciA and FciB (Sanfilippo et al., 2016), as well as a gene encoding a protein of unknown function (Unk10), they also contain specific genes. A third putative regulatory gene, fciC, is indeed only found in PT 3dA representatives, possibly explaining why the two CA4 processes are opposite, CA4-A being activated in BL and CA4-B in GL (Shukla et al., 2012; Humily et al., 2013; Sanfilippo et al 2019b; Grébert et al., 2021). Additionally, the CA4-A and CA4-B islands encode distinct enzymes, the PEB lyase-isomerase MpeZ and the PEB lyase MpeW, respectively. Both compete with another enzyme, encoded in the main PBS genomic region, for binding either a PUB in BL or a PEB in GL at Cys-83 of the α-PE-II subunit (Sanfilippo et al., 2019b; Grébert et al., 2021). Functional studies are needed to determine whether these mechanistic discrepancies are responsible for the phenotypic differences between PT 3dA and 3dB strains reported in the present study.
In conclusion, PTs 3dA and 3dB cells exhibit subtle but significant phenotypic differences that may explain why, in a spectral niche encompassing both blue and green light, they can coexist not only with BL and/or GL specialists, but also with their CA4-able counterpart (Huisman et al., 2002; Stomp et al., 2004; Grébert et al., 2018; Luimstra et al., 2020; Holtrop et al., 2021). Future studies should allow one to confirm this hypothesis, either using co-cultures of different PTs grown in various light colors, or by correlation analyses of the variations of the relative abundance of the different PTs with changes in the underwater light field.
Data availability statement
The original contributions presented in the study are included in the article/Supplementary material, further inquiries can be directed to the corresponding author.
Author contributions
LD: Conceptualization, Data curation, Formal analysis, Investigation, Methodology, Resources, Validation, Writing – original draft, Writing – review & editing, Software, Visualization. LG: Conceptualization, Data curation, Formal analysis, Investigation, Methodology, Resources, Validation, Writing – review & editing, Funding acquisition, Project administration, Supervision. BG: Investigation, Methodology, Writing – review & editing. JC: Investigation, Methodology, Writing – review & editing. MR: Investigation, Methodology, Resources, Writing – review & editing. FP: Conceptualization, Data curation, Formal analysis, Investigation, Methodology, Resources, Supervision, Validation, Writing – review & editing, Funding acquisition, Project administration, Visualization.
Funding
The author(s) declare financial support was received for the research, authorship, and/or publication of this article. This work was supported by the French “Agence Nationale de la Recherche” Program EFFICACY (ANR-19-CE02-0019).
Acknowledgments
The authors would like to thank Priscillia Gourvil, Martin Gachenot, and Michele Grego from the Roscoff Culture Collection (http://roscoff-culture-collection.org/) for maintaining the Synechococcus strains used in this study, and Maela Kloareg (Kuzulia) for performing statistical analyses.
Conflict of interest
The authors declare that the research was conducted in the absence of any commercial or financial relationships that could be construed as a potential conflict of interest.
Publisher’s note
All claims expressed in this article are solely those of the authors and do not necessarily represent those of their affiliated organizations, or those of the publisher, the editors and the reviewers. Any product that may be evaluated in this article, or claim that may be made by its manufacturer, is not guaranteed or endorsed by the publisher.
Supplementary material
The Supplementary material for this article can be found online at: https://www.frontiersin.org/articles/10.3389/fmicb.2024.1349322/full#supplementary-material
Footnotes
References
Boresch, K. (1922). Photokatalysen in Pflanzen. Naturwissenschaften 10, 505–512. doi: 10.1007/BF01565117
Breton, S., Jouhet, J., Guyet, U., Gros, V., Pittera, J., Demory, D., et al. (2020). Unveiling membrane thermoregulation strategies in marine picocyanobacteria. New Phytol. 225, 2396–2410. doi: 10.1111/nph.16239
Doré, H., Farrant, G. K., Guyet, U., Haguait, J., Humily, F., Ratin, M., et al. (2020). Evolutionary mechanisms of long-term genome diversification associated with niche partitioning in marine picocyanobacteria. Front. Microbiol. 11:567431. doi: 10.3389/fmicb.2020.567431
Doré, H., Leconte, J., Guyet, U., Breton, S., Farrant, G. K., Demory, D., et al. (2022). Global phylogeography of marine Synechococcus in coastal areas reveals strong community shifts. mSystems 7, e00656–e00622. doi: 10.1128/msystems.00656-22
Engelmann, T. W. (1902). Über experimentelle Erzeugung zweckmässiger Änderungen der Färbung pflanzlicher Chromophylle durch farbiges Licht. Bericht über Versuche von N. Gaidukow. Arch. Anat. Physiol, 333–335.
Everroad, C., Six, C., Partensky, F., Thomas, J.-C., Holtzendorff, J., and Wood, A. M. (2006). Biochemical bases of type IV chromatic adaptation in marine Synechococcus spp. J. Bacteriol. 188, 3345–3356. doi: 10.1128/JB.188.9.3345-3356.2006
Farrant, G. K., Doré, H., Cornejo-Castillo, F. M., Partensky, F., Ratin, M., Ostrowski, M., et al. (2016). Delineating ecologically significant taxonomic units from global patterns of marine picocyanobacteria. Proc. Natl. Acad. Sci. USA 113, E3365–E3374. doi: 10.1073/pnas.1524865113
Ferrieux, M., Dufour, L., Doré, H., Ratin, M., Guéneuguès, A., Chasselin, L., et al. (2022). Comparative thermophysiology of marine Synechococcus CRD1 strains isolated from different thermal niches in iron-depleted areas. Front. Microbiol. 13:893413. doi: 10.3389/fmicb.2022.893413
Gaidukov, N. (1903). Weitere Untersuchungen über den Einfluss farbigen Lichtes auf die Färbung der Oscillarien. Ber. Dtsch. Bot. Ges. 21, 484–492. doi: 10.1111/j.1438-8677.1903.tb05185.x
Goericke, R., and Repeta, D. J. (1992). The pigments of Prochlorococcus marinus: the presence of divinyl-chlorophyll a and b in a marine procaryote. Limnol. Oceanogr. 37, 425–433. doi: 10.4319/lo.1992.37.2.0425
Grébert, T., Doré, H., Partensky, F., Farrant, G. K., Boss, E. S., Picheral, M., et al. (2018). Light color acclimation is a key process in the global ocean distribution of Synechococcus cyanobacteria. Proc. Natl. Acad. Sci. USA 115, E2010–E2019. doi: 10.1073/pnas.1717069115
Grébert, T., Garczarek, L., Daubin, V., Humily, F., Marie, D., Ratin, M., et al. (2022). Diversity and evolution of pigment types in marine Synechococcus cyanobacteria. Genome Biol. Evol. 14:evac035. doi: 10.1093/gbe/evac035
Grébert, T., Nguyen, A. A., Pokhrel, S., Joseph, K. L., Ratin, M., Dufour, L., et al. (2021). Molecular bases of an alternative dual-enzyme system for light color acclimation of marine Synechococcus cyanobacteria. Proc. Natl. Acad. Sci. USA 118:e2019715118. doi: 10.1073/pnas.2019715118
Guyet, U., Nguyen, N. A., Doré, H., Haguait, J., Pittera, J., Conan, M., et al. (2020). Synergic effects of temperature and irradiance on the physiology of the marine Synechococcus strain WH7803. Front. Microbiol. 11:1707. doi: 10.3389/fmicb.2020.01707
Hirose, Y., Chihong, S., Watanabe, M., Yonekawa, C., Murata, K., Ikeuchi, M., et al. (2019). Diverse chromatic acclimation processes regulating phycoerythrocyanin and rod-shaped phycobilisome in cyanobacteria. Mol. Plant 12, 715–725. doi: 10.1016/j.molp.2019.02.010
Holtrop, T., Huisman, J., Stomp, M., Biersteker, L., Aerts, J., Grébert, T., et al. (2021). Vibrational modes of water predict spectral niches for photosynthesis in lakes and oceans. Ecol. Evol. 5, 55–66. doi: 10.1038/s41559-020-01330-x
Huisman, J., Matthijs, H. C. P., Visser, P. M., Balke, H., Sigon, C. A. M., Passarge, J., et al. (2002). Principles of the light-limited chemostat: theory and ecological applications. Antonie Van Leeuwenhoek 81, 117–133. doi: 10.1023/A:1020537928216
Humily, F., Partensky, F., Six, C., Farrant, G. K., Ratin, M., Marie, D., et al. (2013). A gene island with two possible configurations is involved in chromatic acclimation in marine Synechococcus. PLoS One 8:e84459. doi: 10.1371/journal.pone.0084459
Kana, T. M., and Glibert, P. M. (1987). Effect of irradiances up to 2000 μE m−2 s−1 on marine Synechococcus WH7803—I. Growth, pigmentation, and cell composition. Deep Sea Res.A 34, 479–495. doi: 10.1016/0198-0149(87)90001-X
Kirk, J. T. (1994). Light and photosynthesis in aquatic ecosystems. 2 Cambridge University Press. Cambridge
Lovindeer, R., Abbott, L., Medina, H., and Mackey, K. R. M. (2021). Costs and limitations of marine Synechococcus blue-green chromatic acclimation. Front. Mar. Sci. 8:689998. doi: 10.3389/fmars.2021.689998
Luimstra, V. M., Verspagen, J. M. H., Xu, T., Schuurmans, J. M., and Huisman, J. (2020). Changes in water color shift competition between phytoplankton species with contrasting light-harvesting strategies. Ecology 101:e02951. doi: 10.1002/ecy.2951
Mackey, K. R. M., Paytan, A., Caldeira, K., Grossman, A. R., Moran, D., McIlvin, M., et al. (2013). Effect of temperature on photosynthesis and growth in marine Synechococcus spp. Plant Physiol. 163, 815–829. doi: 10.1104/pp.113.221937
Marie, D., Partensky, F., Vaulot, D., and Brussaard, C. (1999). Enumeration of phytoplankton, bacteria, and viruses in marine samples. Curr. Prot. Cytom. 11:11.11. doi: 10.1002/0471142956.cy1111s10
Moore, L. R., Goericke, R., and Chisholm, S. W. (1995). Comparative physiology of Synechococcus and Prochlorococcus: influence of light and temperature on growth, pigments, fluorescence and absorptive properties. Mar. Ecol. Prog. Ser. 116, 259–275. doi: 10.3354/MEPS116259
Mazard, S., Ostrowski, M., Partensky, F., and Scanlan, D. J. (2012). Multi-locus sequence analysis, taxonomic resolution and biogeography of marine. Synechococcus. Environ. Microbiol. 14, 372–386. doi: 10.1111/j.1462-2920.2011.02514.x
Ong, L. J., and Glazer, A. N. (1991). Phycoerythrins of marine unicellular cyanobacteria. I. Bilin types and locations and energy transfer pathways in Synechococcus spp. phycoerythrins. J. Biol. Chem. 266, 9515–9527. doi: 10.1016/S0021-9258(18)92851-6
Palenik, B. (2001). Chromatic adaptation in marine Synechococcus strains. Appl. Environ. Microbiol. 67, 991–994. doi: 10.1128/AEM.67.2.991-994.2001
Pinheiro, J., Bates, D., DebRoy, S., Sarkar, D., Heisterkamp, S., Van Willigen, B., et al. R Core Team. (2023). nlme: Linear and nonlinear mixed effects models. R package version 3.1-164.Available at: https://CRAN.R-project.org/package=nlme
Pittera, J., Humily, F., Thorel, M., Grulois, D., Garczarek, L., and Six, C. (2014). Connecting thermal physiology and latitudinal niche partitioning in marine Synechococcus. ISME J. 8, 1221–1236. doi: 10.1038/ismej.2013.228
R Core Team (2021). R: A language and environment for statistical computing. R Foundation for Statistical Computing, Vienna, Austria. Available at: https://www.R-project.org/
Rippka, R., Coursin, T., Hess, W., Lichtlé, C., Scanlan, D. J., Palinska, K. A., et al. (2000). Prochlorococcus marinus Chisholm et al. 1992 subsp. pastoris subsp. nov. strain PCC 9511, the first axenic chlorophyll a2/b2-containing cyanobacterium (Oxyphotobacteria). Int. J. Syst. Evol. Microbiol. 50, 1833–1847. doi: 10.1099/00207713-50-5-1833
Sanfilippo, J. E., Garczarek, L., Partensky, F., and Kehoe, D. M. (2019a). Chromatic acclimation in cyanobacteria: a diverse and widespread process for optimizing photosynthesis. Ann. Rev. Microbiol. 73, 407–433. doi: 10.1146/annurev-micro-020518-115738
Sanfilippo, J. E., Nguyen, A. A., Garczarek, L., Karty, J. A., Pokhrel, S., Strnat, J. A., et al. (2019b). Interplay between differentially expressed enzymes contributes to light color acclimation in marine Synechococcus. Proc. Natl. Acad. Sci. USA 116, 6457–6462. doi: 10.1073/pnas.1810491116
Sanfilippo, J. E., Nguyen, A. A., Karty, J. A., Shukla, A., Schluchter, W. M., Garczarek, L., et al. (2016). Self-regulating genomic island encoding tandem regulators confers chromatic acclimation to marine Synechococcus. Proc. Natl. Acad. Sci. USA 113, 6077–6082. doi: 10.1073/pnas.1600625113
Shukla, A., Biswas, A., Blot, N., Partensky, F., Karty, J. A., Hammad, L. A., et al. (2012). Phycoerythrin-specific Bilin lyase–isomerase controls blue-green chromatic acclimation in marine Synechococcus. Proc. Natl. Acad. Sci. USA 109, 20136–20141. doi: 10.1073/pnas.121177710
Sidler, W. A. (1994). “Phycobilisome and phycobiliprotein structures” in The molecular biology of cyanobacteria advances in photosynthesis (Dordrecht: Springer), 139–216.
Six, C., Thomas, J. C., Brahamsha, B., Lemoine, Y., and Partensky, F. (2004). Photophysiology of the marine cyanobacterium Synechococcus sp. WH8102, a new model organism. Aquat. Microb. Ecol. 35, 17–29. doi: 10.3354/ame035017
Six, C., Thomas, J.-C., Garczarek, L., Ostrowski, M., Dufresne, A., Blot, N., et al. (2007). Diversity and evolution of phycobilisomes in marine Synechococcus spp.: a comparative genomics study. Genome Biol. 8:R259. doi: 10.1186/gb-2007-8-12-r259
Stomp, M., Huisman, J., de Jongh, F., Veraart, A. J., Gerla, D., Rijkeboer, M., et al. (2004). Adaptive divergence in pigment composition promotes phytoplankton biodiversity. Nature 432, 104–107. doi: 10.1038/nature03044
Tandeau de Marsac, N. (1977). Occurrence and nature of chromatic adaptation in cyanobacteria. J. Bacteriol. 130, 82–91. doi: 10.1128/jb.130.1.82-91.1977
Keywords: marine picocyanobacteria, Synechococcus, chromatic acclimation, spectral niche, phycobilisome, comparative physiology
Citation: Dufour L, Garczarek L, Gouriou B, Clairet J, Ratin M and Partensky F (2024) Differential acclimation kinetics of the two forms of type IV chromatic acclimaters occurring in marine Synechococcus cyanobacteria. Front. Microbiol. 15:1349322. doi: 10.3389/fmicb.2024.1349322
Edited by:
Beatriz Roncero Ramos, Sevilla University, SpainReviewed by:
Yuu Hirose, Toyohashi University of Technology, JapanLisa Wiltbank, Weber State University, United States
Copyright © 2024 Dufour, Garczarek, Gouriou, Clairet, Ratin and Partensky. This is an open-access article distributed under the terms of the Creative Commons Attribution License (CC BY). The use, distribution or reproduction in other forums is permitted, provided the original author(s) and the copyright owner(s) are credited and that the original publication in this journal is cited, in accordance with accepted academic practice. No use, distribution or reproduction is permitted which does not comply with these terms.
*Correspondence: Frédéric Partensky, ZnJlZGVyaWMucGFydGVuc2t5QHNiLXJvc2NvZmYuZnI=