 Xuejuan Liang
 Jing Liu2
 Nenqun Xiao
95% of researchers rate our articles as excellent or good
Learn more about the work of our research integrity team to safeguard the quality of each article we publish.
Find out more
ORIGINAL RESEARCH article
Front. Microbiol. , 16 February 2024
Sec. Microorganisms in Vertebrate Digestive Systems
Volume 15 - 2024 | https://doi.org/10.3389/fmicb.2024.1336777
This article is part of the Research Topic Rodent model organisms: Therapeutic treatments and drugs interaction with the gut microbiome View all 41 articles
Background: With the development of healthcare services, drug efficacy, and safety have become the focus of drug use, and processing alters drug toxicity and efficacy, exploring the effects of processing on Evodiae fructus (EF) can guide the clinical use of drugs.
Methods: Fifty male Kunming mice were randomly divided into the control group (CCN), raw small-flowered EF group (CRSEF), raw medium-flowered EF group (CRMEF), processing small-flowered EF group (CPSEF), and processing medium-flowered EF group (CPMEF). The CRSEF, CRMEF, CPSEF, and CPMEF groups were gavaged with aqueous extracts of raw small-flowered EF dry paste (RSEF), medium-flowered EF dry paste (RMEF), processing small-flowered EF dry paste (PSEF) and processing medium-flowered EF dry paste (PMEF), respectively, for 21 days at 5 times the pharmacopeial dosage. Upon concluding the experiment, histopathological sections of liver and kidney tissues were examined. Additionally, levels of aspartate aminotransferase (AST), alanine aminotransferase (ALT), serum creatinine (SCr), and blood urea nitrogen (BUN) were determined. DNA from the intestinal contents of the mice was extracted, and 16S rRNA full-length high-throughput sequencing was performed.
Results: After fed EF 21 days, mice exhibited a decreasing trend in body weight. Comparative analysis with the CCN group revealed an upward trend in SCr, BUN, AST, and ALT levels in both CRSEF and CRMEF groups. The CRMEF group displayed notably elevated BUN and AST levels, with an observed increasing trend in Scr and ALT. Kidney sections unveiled cellular edema and considerable inflammatory cell infiltrates, whereas significant liver damage was not evident. Compared with CRSEF, Bun levels were significantly lower while AST levels were significantly higher in the CPMEF group. Additionally, the intestinal microbiota diversity and the relative abundance of Psychrobacter decreased significantly, and the relative abundance of Staphylococcus, Jeotgalicoccus, and Salinicoccus increased significantly in the CPMEF group. AST, ALT, and SCr were positively correlated with Staphylococcus, Jeotgalicoccus, and Salinicoccus.
Conclusion: In conclusion, PMEF significantly increased harmful bacteria (Staphylococcus, Jeotgalicoccus, and Salinicoccu) and decreased beneficial bacteria. SEF with 5 times the clinical dose showed nephrotoxicity and SEF nephrotoxicity decreased after processing, but EF hepatotoxicity was not significant, which may be due to insufficient dose concentration and time.
Traditional Chinese Medicine (TCM) is widely used because of its low side effects and good curative effect. In recent years, with the development and application of TCM, the safety issues of its medication have become increasingly prominent. As herbal medicine involves the use of natural compounds, its active ingredients are complex and have different degrees of side effects, there have been extensive literature reports that improper use of Chinese herbal medicine can lead to liver and kidney damage (Yang B. et al., 2018; Wu et al., 2019). Evodiae fructus (EF) is the dried, nearly ripe fruit of Euodia rutaecarpa (Juss), which is generally classified according to fruit size as small-flowered EF (SEF), and medium-flowered EF (MEF), and is a herb with the effects of dispersing cold and relieving pain, relieving nausea, and reinforcing Yang to prevent diarrhea (National Pharmacopoeia Commission, 2020). The main chemical composition is alkaloids, terpenoids, flavonoids, phenolic acids, steroids, and phenylpropanoids (Li and Wang, 2020). EF alkaloids contain a variety of chemical components particularly evodiamine (EVO), rutaecarpine, and dehydroevodiamine (Chen et al., 2023). EVO is a natural quinolone alkaloid, which has been widely studied for its extensive pharmacological activities such as anti-tumor, anti-Alzheimer’s disease, anti-pulmonary hypertension, anti-fungal and anti-inflammatory (Li D. et al., 2022). According to the 2020 edition of Chinese Pharmacopoeia (National Pharmacopoeia Commission, 2020), EF mainly enters the liver, spleen, and kidney meridians. Modern studies have proved that EF was mainly used for the treatment and prevention of gastrointestinal diseases (Tan and Zhang, 2016), and can treat diarrhea of kidney-yang deficiency syndrome. The kidney structure, energy metabolism, and intestinal mucosal microbiota diversity and structure were improved (Zhu et al., 2023).
Some studies have shown significant hepatotoxicity and nephrotoxicity of EF. Compounds of EF can increase the activity of aspartate aminotransferase (AST), alanine aminotransferase (ALT), lactate dehydrogenase (LDH), and alkaline phosphatase (ALP) with potential liver damaging effects (Li et al., 2019). EF hepatotoxicity is mainly associated with oxidative stress, mitochondrial damage and dysfunction, endoplasmic reticulum stress, hepatic metabolic disorders, and apoptosis (Yan et al., 2023). In terms of nephrotoxicity, the LDH release, renal cell morphology changes, and autophagy-related protein expression of cells treated with EVO at different concentrations increased, suggesting that EVO renal cytotoxicity may be associated with cellular autophagy-related pathways (Yan et al., 2017). The Chinese Pharmacopoeia (National Pharmacopoeia Commission, 2020) recorded that EF has a small toxicity. Therefore, improper use of EF not only fails to achieve therapeutic effect but will cause body damage.
The composition of the intestinal microbiota is susceptible to dietary and pharmacological influences and can have both beneficial and detrimental effects on the host organism (Li C. et al., 2022). It has been found that EF has a good modulating effect on intestinal microbiota, and changes in intestinal microbiota can respond to changes in intestinal function. Studies have found that adhesion and biofilm formation are key factors in the persistence of Campylobacter jejuni under adverse environmental conditions and that EF can weaken adhesion and inhibit the growth of harmful bacteria (Bezek et al., 2016). EVO can balance the levels of Escherichia coli and Lactobacillus levels to reduce intestinal inflammation (Shen et al., 2019). EVO also promotes enrichment, reduces intestinal inflammation, promotes the enrichment of Short-chain fatty acids (SCFAs) producing bacteria, reduces pro-inflammatory bacteria, regulates intestinal microbiota metabolites, and inhibits the development of intestinal inflammation (Wang et al., 2021). Therefore, appropriate intake of EF can change the intestinal microbiota and thus affect the health of the organism. However, the effects of raw EF and processing EF on the intestinal microecological mechanisms are unclear, and there are few studies on the effects of processed factors on the regulation of EF on the intestinal microbiota. A large number of studies have found that disorders of the intestinal microbiota are closely related to the development of disease. The microbiota regulates the immune and hormone levels of the liver or kidneys by sending signals to distant organs and tissues in the body. The interaction between the intestinal and the kidney and the liver is called the “liver-gut axis” and the “kidney-gut axis” (Schroeder and Bäckhed, 2016; Yang T. et al., 2018). Based on the above, we hypothesize that EF may regulate the metabolism of the liver, kidney, and intestinal microbiota through the “liver-gut axis” and “kidney-gut axis.”
A summary of relevant literature found that EF exhibited significant time-and dose-dependent hepatotoxicity (Li and Sun, 2015). We hypothesized that EF toxicity is mainly related to the concentration and time of administration, and processing can reduce the toxicity of the drug and change its properties of the drug. At present, the study of EF is limited to the extraction of the active ingredient, but the study of toxic concentration and processing methods to reduce toxicity is not clear.
Raw small-flowered EF and raw medium-flowered EF: purifying processing. 1.8 kg of liquorice is boiled to produce 12.6 kg of liquorice juice, which is then combined with 30 kg of raw EF. After thorough mixing and absorption of the liquorice juice, the mixture is gently stir-heated until dry, resulting in the creation of processed small-flowered EF and processed medium-flowered EF (Zhang et al., 2018). One kg samples of the above four EF variants are individually weighed, combined with 12 times their respective water content, and subjected to three reflux extractions, each lasting 40 min. The two filtrates were combined and concentrated to an infusion with a relative density of 1.23 (tested at 60°C) and dried under vacuum at 55°C to form an aqueous extract of raw small-flowered EF dry paste (RSEF), aqueous extract of raw medium-flowered EF dry paste (RMEF), aqueous extract of processing small-flowered EF dry paste (PSEF), and aqueous extract of processing medium-flowered EF dry paste (PMEF). Table 1 provides details on the yield of the four aqueous EF dry paste extracts, along with the content of Limonin and EVO in each.
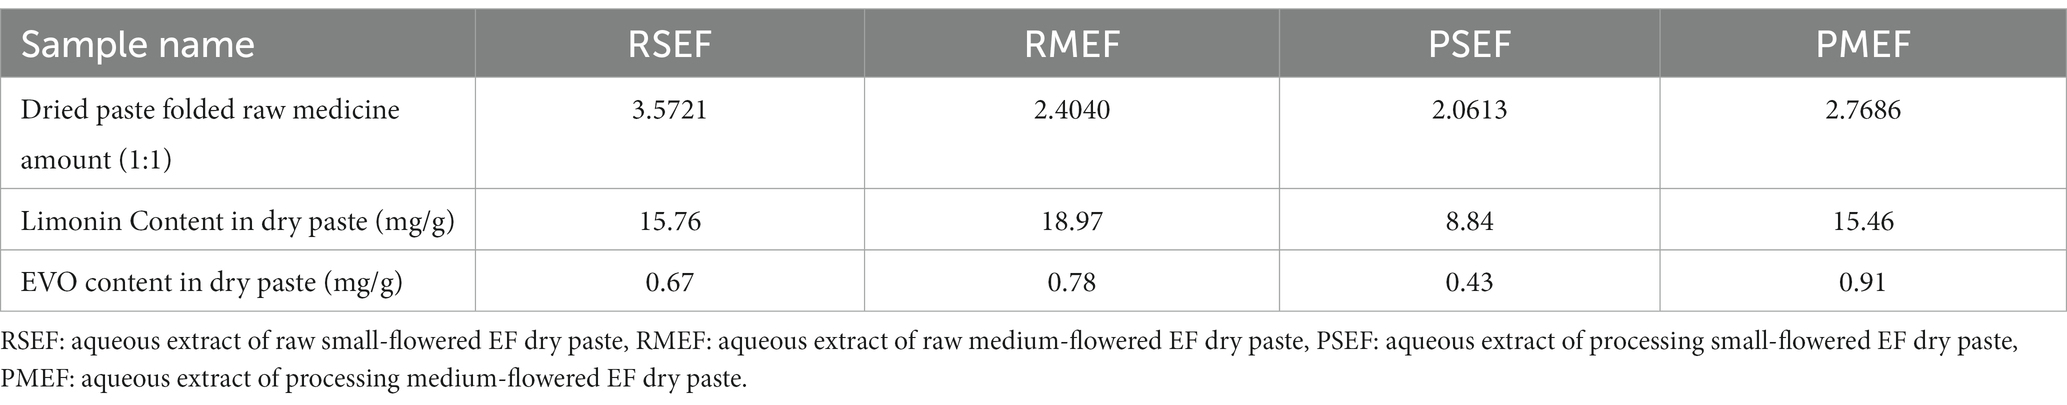
Table 1. The yield rate and the contents of Limonin and EVO in aqueous extracts of different EF.
The experimental animal common feed, comprising crude protein, crude fiber, crude fat, crude ash, calcium, phosphorus, lysine, methionine, cysteine, and so on, was sourced from the Experimental Animal Center of Hunan University of Chinese Medicine and manufactured by Jiangsu Medison Biomedical Co., Ltd.
In this study, to exclude the effect of sex on gut microbiota (Wu et al., 2022), 50 SPF-grade Kunming male mice (20 ± 2 g) were used. The animals were provided by Hunan Slaughter Jingda Laboratory Animal Co., Ltd. (license number: SCXK2019-0004), and fed at the Animal Experiment Center of Hunan University of Chinese Medicine. All animal operations were performed by the Guide for the Care and Use of Laboratory Animals of the Hunan University of Chinese Medicine and were approved by the Animal Experimentation Ethics Committee of the Hunan University of Chinese Medicine (ethics number: LL2022112302).
It was found that the toxicity of EF gradually increased with the increase of drug concentration and time, and hepatotoxicity appeared when the dose was five times the clinical equivalent dose (Zhang et al., 2018). Based on the Chinese Pharmacopoeia (National Pharmacopoeia Commission, 2020) at the usual clinical dosage of EF (5 g/d for 70 kg adults) and reference (Zhang et al., 2018), the toxicological effect of EF was studied at 5 times the pharmacopeial dosage (25 g/d). The daily doses of EF aqueous extracts were converted to mice based on the yield of different EF aqueous extracts and the body surface area of mice, and the converted doses were 0.91 g/(kg.d) RSEF, 1.35 g/(kg.d) RMEF, 1.58 g/(kg.d) PSEF, and 1.17 g/(kg.d) PMEF for mice. An appropriate amount of water extract of EF dry paste with distilled water was prepared into different concentrations of EF solution.
After adaptive feeding, 50 SPF-grade KM male mice were randomly divided into control group (CCN), raw small-flowered EF group (CRSEF), raw medium-flowered EF group (CRMEF), processing small-flowered EF group (CPSEF), and processing medium-flowered EF group (CPMEF). The CRSEF, CRMEF, CPSEF and CPMEF groups were gavaged with 0.91 g/(kg.d) raw small-flowered EF (RSEF), 1.35 g/(kg.d) raw medium-flowered EF (RMEF), 1.58 g/(kg.d) processing small-flowered EF (PSEF) and 1.17 g/(kg.d) processing medium-flowered EF (PMEF), 0.35 mL at a time, twice a day for 21 days. The CCN group was given sterile water gavage in equal frequency during the period. During the experiment, the mental state, activity level, hair color changes and diet of the mice were mainly observed, and the weight of the mice was recorded, as shown in Figure 1.
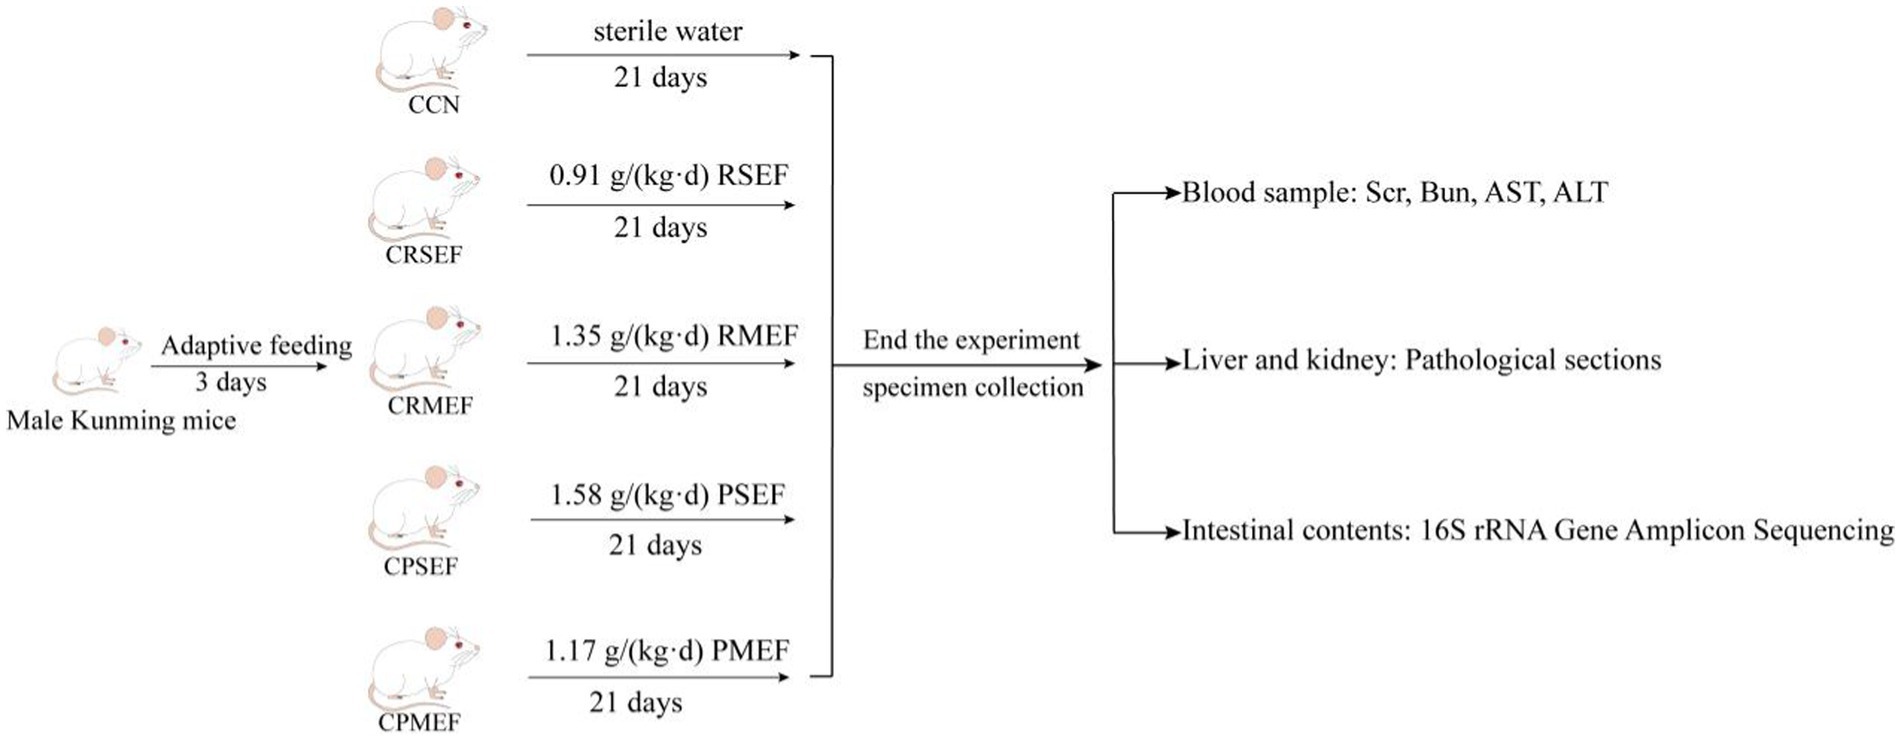
Figure 1. Experimental flow chart. CCN: control group, CRSEF: raw small-flowered EF group, CRMEF: raw medium-flowered EF group, CPSEF: processing small-flowered EF group, CPMEF: processing medium-flowered EF group. RSEF: aqueous extract of raw small-flowered EF dry paste, RMEF: aqueous extract of raw medium-flowered EF dry paste, PSEF: aqueous extract of processing small-flowered EF dry paste, PMEF: aqueous extract of processing medium-flowered EF dry paste.
After 12 h of fasting after the last dose, whole blood was collected from the eye. The blood stood at room temperature for 2 h, centrifuged at 3,000 r/min for 10 min, and serum was taken for use. According to the instructions of the ELISA test kit, add samples, add antibodies, incubate, wash plates, develop colors, and terminate the reaction in turn. Finally, use the Rayto RT-6100 enzyme-labeled analyzer to detect the OD values of AST and ALT in serum samples at 450 nm. The determination of Bun and SCr is divided into control tube, standard tube, and sample tube according to the instructions of biochemical kit. After adding distilled water, standard substance, and sample to be detected respectively, SCr adds enzyme solution A and incubates at 37°C for 5 min, then determines the absorbance value, and then adds enzyme solution B and incubates at 37°C for 5 min. Bun is mixed with buffered enzyme solution, and the absorbance is measured after water bath at 37°C for 10 min. Then phenol chromogenic agent and alkaline sodium hypochlorite are added and mixed thoroughly, and the absorbance of each tube is measured after water bath at 37°C for 10 min. According to the formula, the contents of SCr and Bun in serum were calculated, and the standard curve equation was drawn to calculate the contents of AST and ALT in each sample.
Under aseptic conditions, the livers and kidneys were dissected and removed, and the impurities on the surface of the organs were washed with saline and cut into 1–2 cm tissue clumps with scalpel, fixed in 4% paraformaldehyde solution and stored at room temperature. According to gradient dehydration, xylene was transparent and paraffin was embedded. After dressing the wax blocks, the wax blocks were cooled on a −20°C frozen table and sliced in a paraffin slicer (thickness 4 μm). The slices were floated in warm water at 40°C in a sheet spreading machine to flatten the tissues, and the tissues were picked up by slides, roasted in an oven at 60°C, and stored at room temperature for later use. The paraffin section samples were soaked in xylene at one time and then transferred to anhydrous ethanol for dewaxing. After dewaxing, the sections were dyed in HE dye solution in dyeing tank, and then added to concentration gradient ethanol and xylene successively for dehydration, and finally sealed with neutral gum (Liu et al., 2023).
After 21 days, the mice were cervically dislocated and executed, and the small intestine was immediately removed by opening the abdominal cavity on an ultra-clean bench. Under aseptic conditions, the intestinal tissue from the pylorus to the ileocecal region was incised longitudinally with sterile scissors and the intestinal contents were removed with sterile forceps and collected from each mouse in an EP tube and stored at −80°C (Li X. et al., 2022).
Total microbial genomic DNA was extracted from each sample tube according to the OMEGA Soil DNA Kit instructions. The quantity and quality of extracted DNA were measured by using a NanoDrop NC2000 spectrophotometer and agarose gel electrophoresis, respectively. PCR amplification of the bacterial 16S rRNA genes V3–V4 region was performed using the forward primer 338F (5′-ACTCCTACGGGAGGCAGCA-3′) and the reverse primer 806R (5′-GGACTACHVGGGTWTCTAAT-3′). Thermal cycling consisted of initial denaturation at 98°C for 5 min, followed by 25 cycles consisting of denaturation at 98°C for 30 s, annealing at 53°C for 30 s, and extension at 72°C for 45 s, with a final extension of 5 min at 72°C. PCR amplicons were purified with Vazyme VAHTSTM DNA Clean Beads and quantified using the Quant-iT PicoGreen dsDNA Assay Kit. After the individual quantification step, amplicons were pooled in equal amounts, and pair-end 2,250 bp sequencing was performed using the Illlumina NovaSeq platform with NovaSeq 6000 SP Reagent Kit at Shanghai Personal Biotechnology Co., Ltd. (Shanghai, China) (Li X. et al., 2022; Qiao et al., 2023).
The original sequence data is decoded by the demux plug-in, the primer is excised by cutadapt plug-in, and then the sequence is processed by DADA2 plug-ins, such as quality filtering, denoising, splicing, and chimera removal. Merge the above-mentioned sequences according to 100% sequence similarity, and generate characteristic sequence ASVs and abundance data table. ASV-level alpha diversity indices were calculated using the amplicon sequence variant (ASV) table in QIIME2 and visualized as box plots. ASV-level ranked abundance curves were generated to compare the richness and evenness of ASVs among samples. Beta diversity analysis was performed to investigate the structural variation of microbial communities across samples using Bray-Curtis metrics and visualized via principal coordinate analysis (PCoA) and nonmetric multidimensional scaling (NMDS). A Venn diagram was generated to visualize the shared and unique ASVs among samples or groups using the R package “VennDiagram,” based on the occurrence of ASVs across samples/groups regardless of their relative abundance. Linear discriminant analysis effect size (LEfSe) was performed to detect differentially abundant taxa across groups using the default parameters. The metabolic function of microbial microbiota was analyzed by PICRUSt2 to obtain functional units and then predicted on the KEGG1 database to obtain the abundance value of metabolic pathways (Kanehisa and Goto, 2000; Li L. et al., 2022).
Pearson’s correlation coefficient was used when the data satisfied normality, and Spearman’s correlation coefficient was used when it did not satisfy normality. SPSS 21.0 statistical software was used to calculate Spearman correlation coefficients and heat maps were plotted in the cloud platform.2 The correlation between two variables is expressed by using the correlation coefficient, and the closer the correlation coefficient is to 1 or −1, the greater the correlation between the two elements, and the closer the correlation coefficient is to 0, the more independent the two elements are.
The experimental data were expressed as mean ± standard deviation. The SPSS 21.0 statistical package was used for the statistical analysis of all data. Comparisons between multiple groups, satisfying normality and homoscedasticity, were performed by one-way ANOVA, and comparisons between multiple groups were performed by LSD test. The rank sum test was used if normality and homoscedasticity were not satisfied, and Tamhane’s T2 (M) test was used for comparison between multiple groups. p < 0.05 indicates a significant difference.
Compared with the CCN group, the weight of mice increased slowly after EF intervention (Figure 2A; p > 0.05). The main detectors of nephrotoxicity were SCr and BUN. The changes in SCr content were not significant in all groups after EF feeding (Figure 2B; p > 0.05). Compared with the CCN group, BUN was significantly higher in the CRMEF group (p < 0.05). Compared with the CRMEF group, BUN was significantly lower in the CPMEF group (Figure 2C; p < 0.05). The main tests of liver function are AST and ALT. Compared to the CCN group, ALT increased after EF intervention (Figure 2D; p > 0.05), and AST in both the CRMEF group and CPMEF group increased significantly (Figure 2E; p < 0.05). Compared with CRSEF, AST was significantly higher in the both CRMEF and CPMEF groups (Figure 2E; p < 0.05).
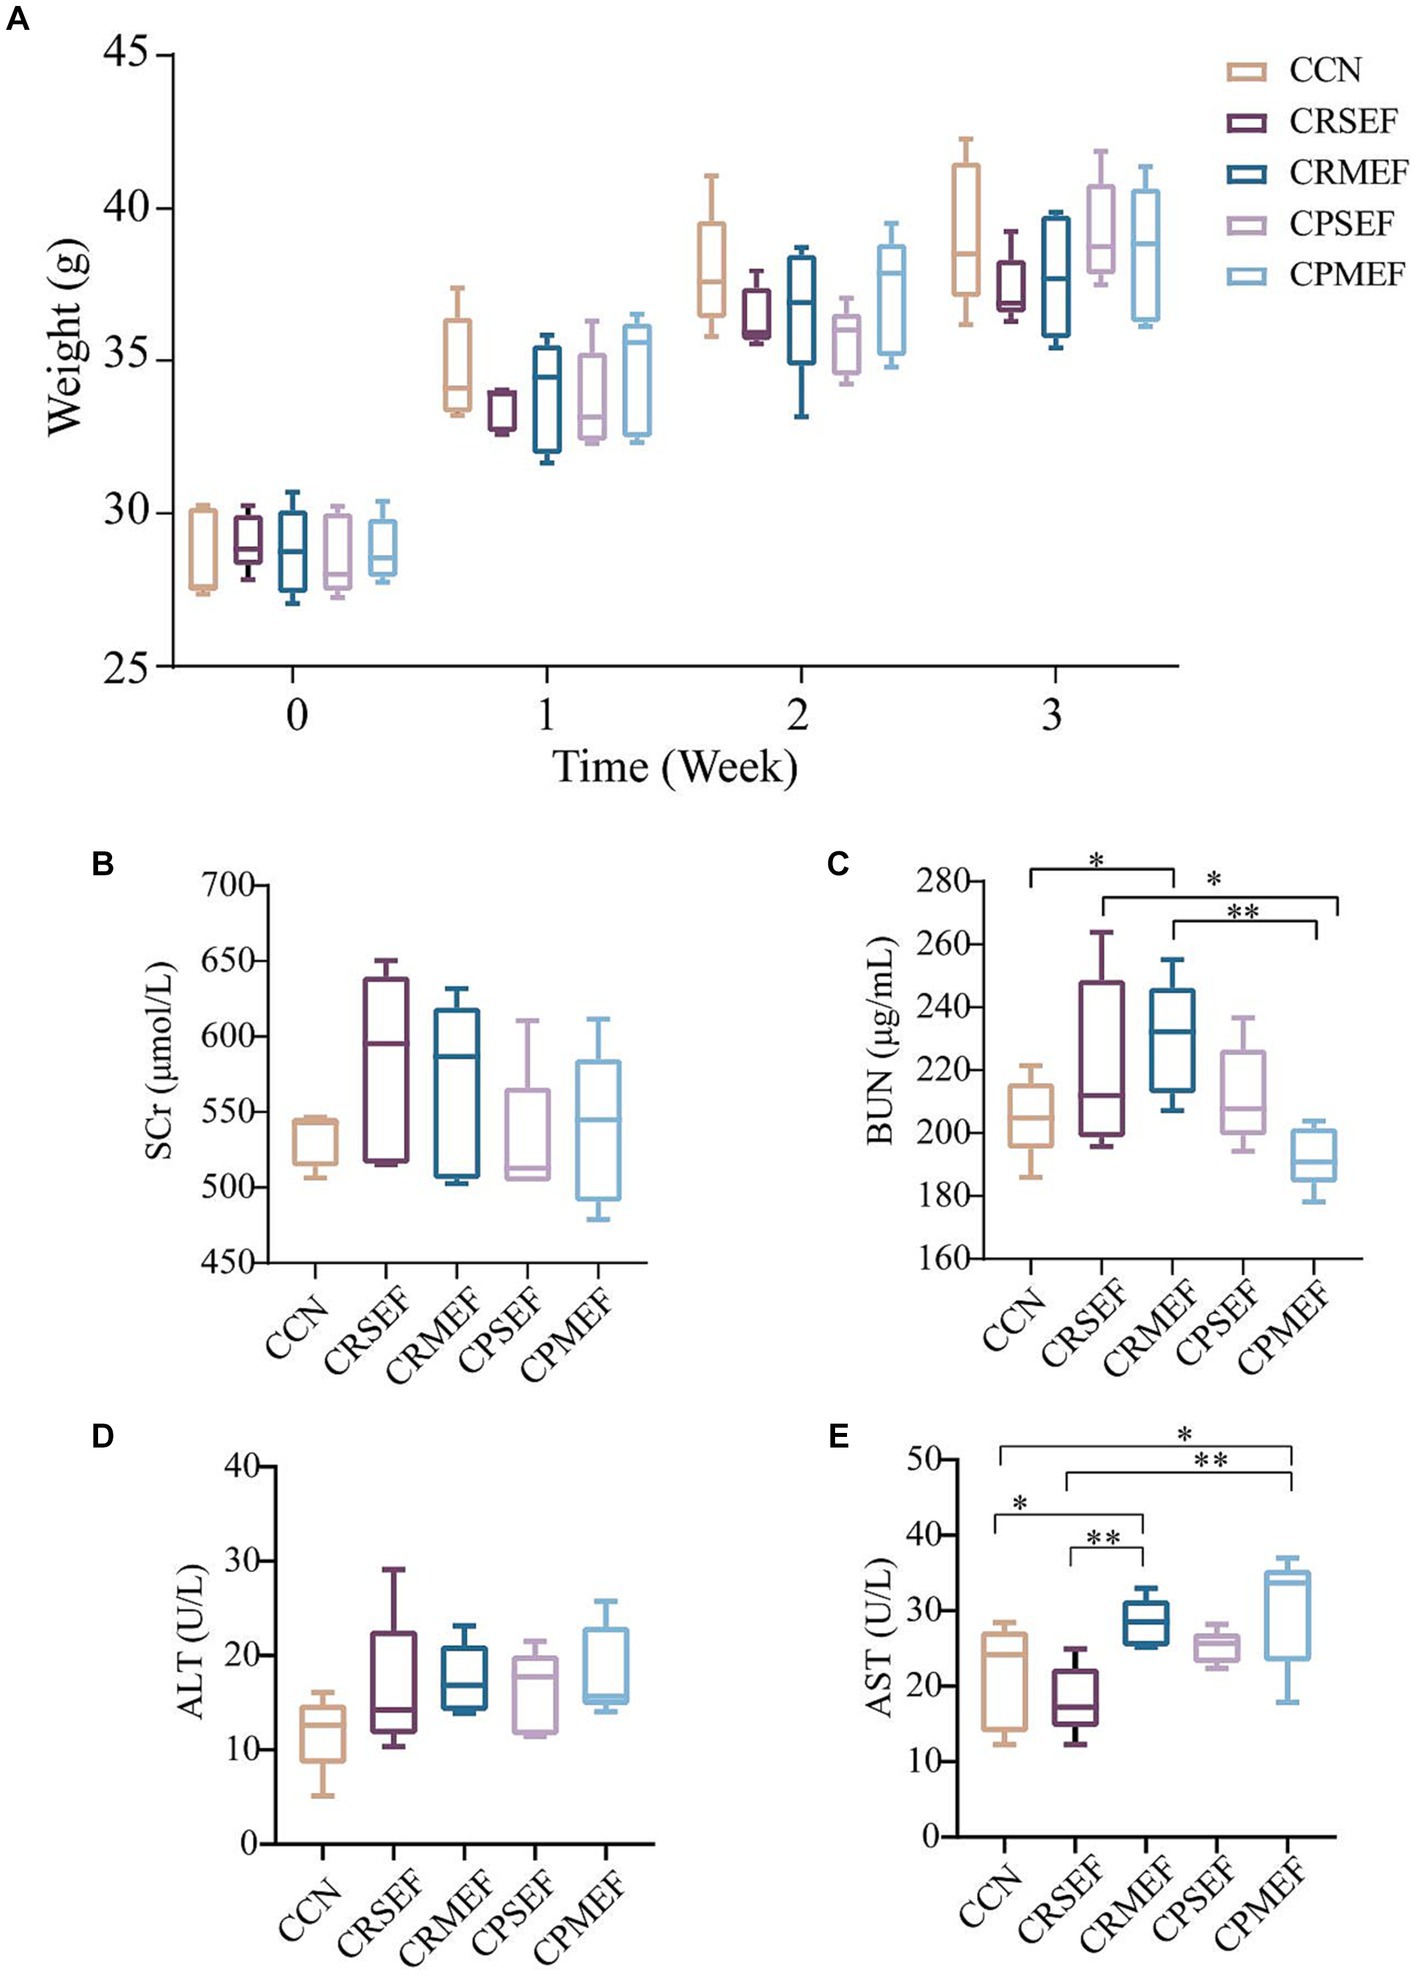
Figure 2. (A) Changes in body weight of mice in different groups after 21 days of different EF interventions. (B) Serum levels of SCr. (C) Serum levels of BUN. (D) Serum levels of ALT. (E) Serum levels of AST. CCN: control group, CRSEF: raw small-flowered EF group, CRMEF: raw medium-flowered EF group, CPSEF: processing small-flowered EF group, CPMEF: processing medium-flowered EF group. *p < 0.05, **p < 0.01.
We further evaluated the toxic effects of EF by observing tissue inflammation and injury in combination with histopathological sections of the liver and kidney. The results of light microscopic observation of kidney pathological sections in each group of mice: The kidney tissues of mice in the CCN group had intact peritoneum, clear cortical and medullary demarcation, intact glomerular, tubular, interstitial structures, and uniform distribution (Figure 3A). The renal tubular lumen was heterogeneous with tubular cell edema in both CRSEF and CRMEF groups. A large number of inflammatory cells were infiltrated in the CRMEF group (Figures 3B,C). Glomeruli, tubules, and interstitial structures were intact in both CPSEF and CPMEF groups, with scattered hemorrhages (considering nonspecific injury due to sampling), and partial glomeruli atrophic sclerosis in the CPSEF group (Figures 3D,E).
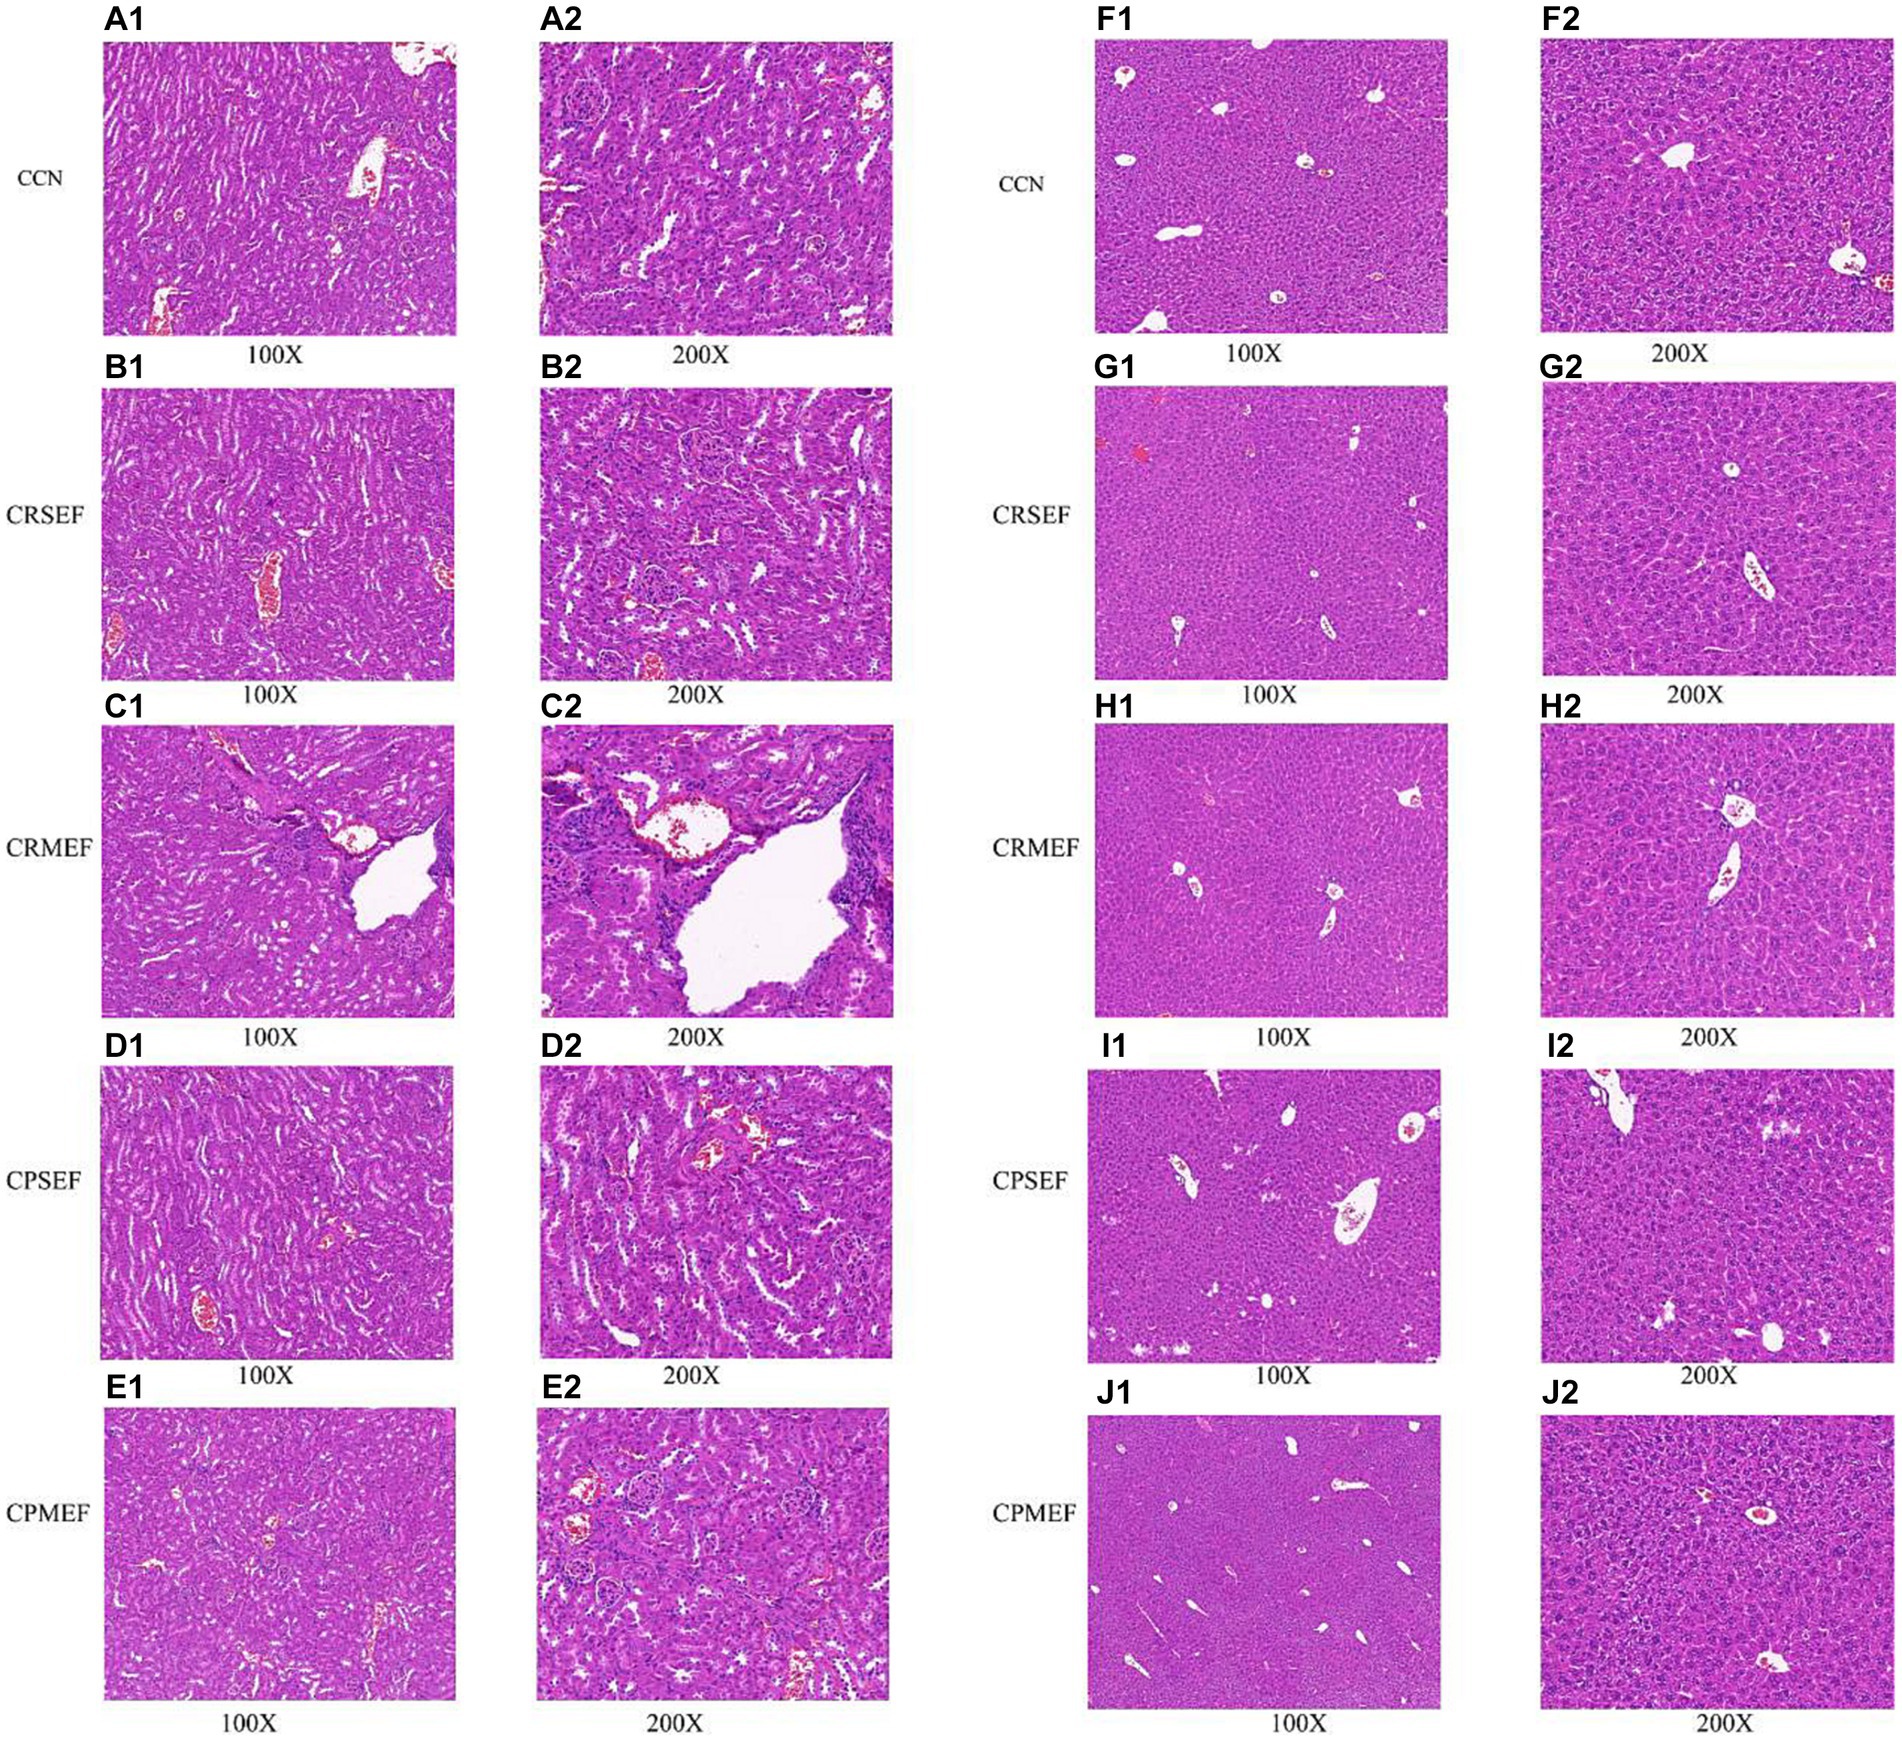
Figure 3. (A) Kidney tissue section of CCN group. (B) Kidney tissue section of CRSEF group. (C) Kidney tissue section of CRMEF group. (D) Kidney tissue section of CPSEF group. (E) Kidney tissue section of CPMEF group. (F) Liver tissue section of CCN group. (G) Liver tissue section of CRSEF group. (H) Liver tissue section of CRMEF group. (I) Liver tissue section of CPSEF group. (J) Liver tissue section of CPMEF group. CCN: control group, CRSEF: raw small-flowered EF group, CRMEF: raw medium-flowered EF group, CPSEF: processing small-flowered EF group, CPMEF: processing medium-flowered EF group.
The results of light microscopic observation of liver pathological sections of mice in each group: In the liver lobules of mice in the CCN group, the hepatocytes were arranged compactly and neatly, with polygonal hepatocytes, pink-stained cytoplasm and rounded nuclei of different sizes, radiating from the central vein (Figure 3F). Scattered blebs were seen in both CRSEF and CRMEF groups (considering nonspecific injury due to sampling), and petechial hemorrhage was present within the CRSEF group (Figures 3G,H). In the CPSEF and CPMEF groups, hepatic lobules with normal hepatocyte morphology and no obvious pathological damage were seen (Figures 3I,J).
As the number of sequencing increased, the growth rate of ASV number decreased, and the Shannon dilution curve gradually flattened, indicating that the sequencing data in this experiment was sufficient (Figure 4A). The species accumulation curve gradually increased with increasing sample size, and the sequencing depth of the experiment was sufficient to reflect the microbial diversity contained in the community samples (Figure 4B). It was found that compared with the CCN group, Chao1 index and Observed species index in the CPMEF group were significantly decreased (p < 0.05, Figures 4C,D), and the Simpson and Shannon indices have no significant difference (p > 0.05, Figures 4E,F). Compared with the CPMEF group, Chao1 index and Observed species index in the CRSEF and CRMEF groups were significantly increased (p < 0.05, Figures 4C,D). Our study further evaluated beta diversity based on the Bray-Curtis distance algorithm. Distance matrix PCoA and NMDS analysis shows that the CRSEF and CRMEF groups and the CPSEF and CPMEF groups showed better separation at PCo1 = 30.7%, PCo2 = 15.7%, and Stress = 0.181 (Figures 4G,H).
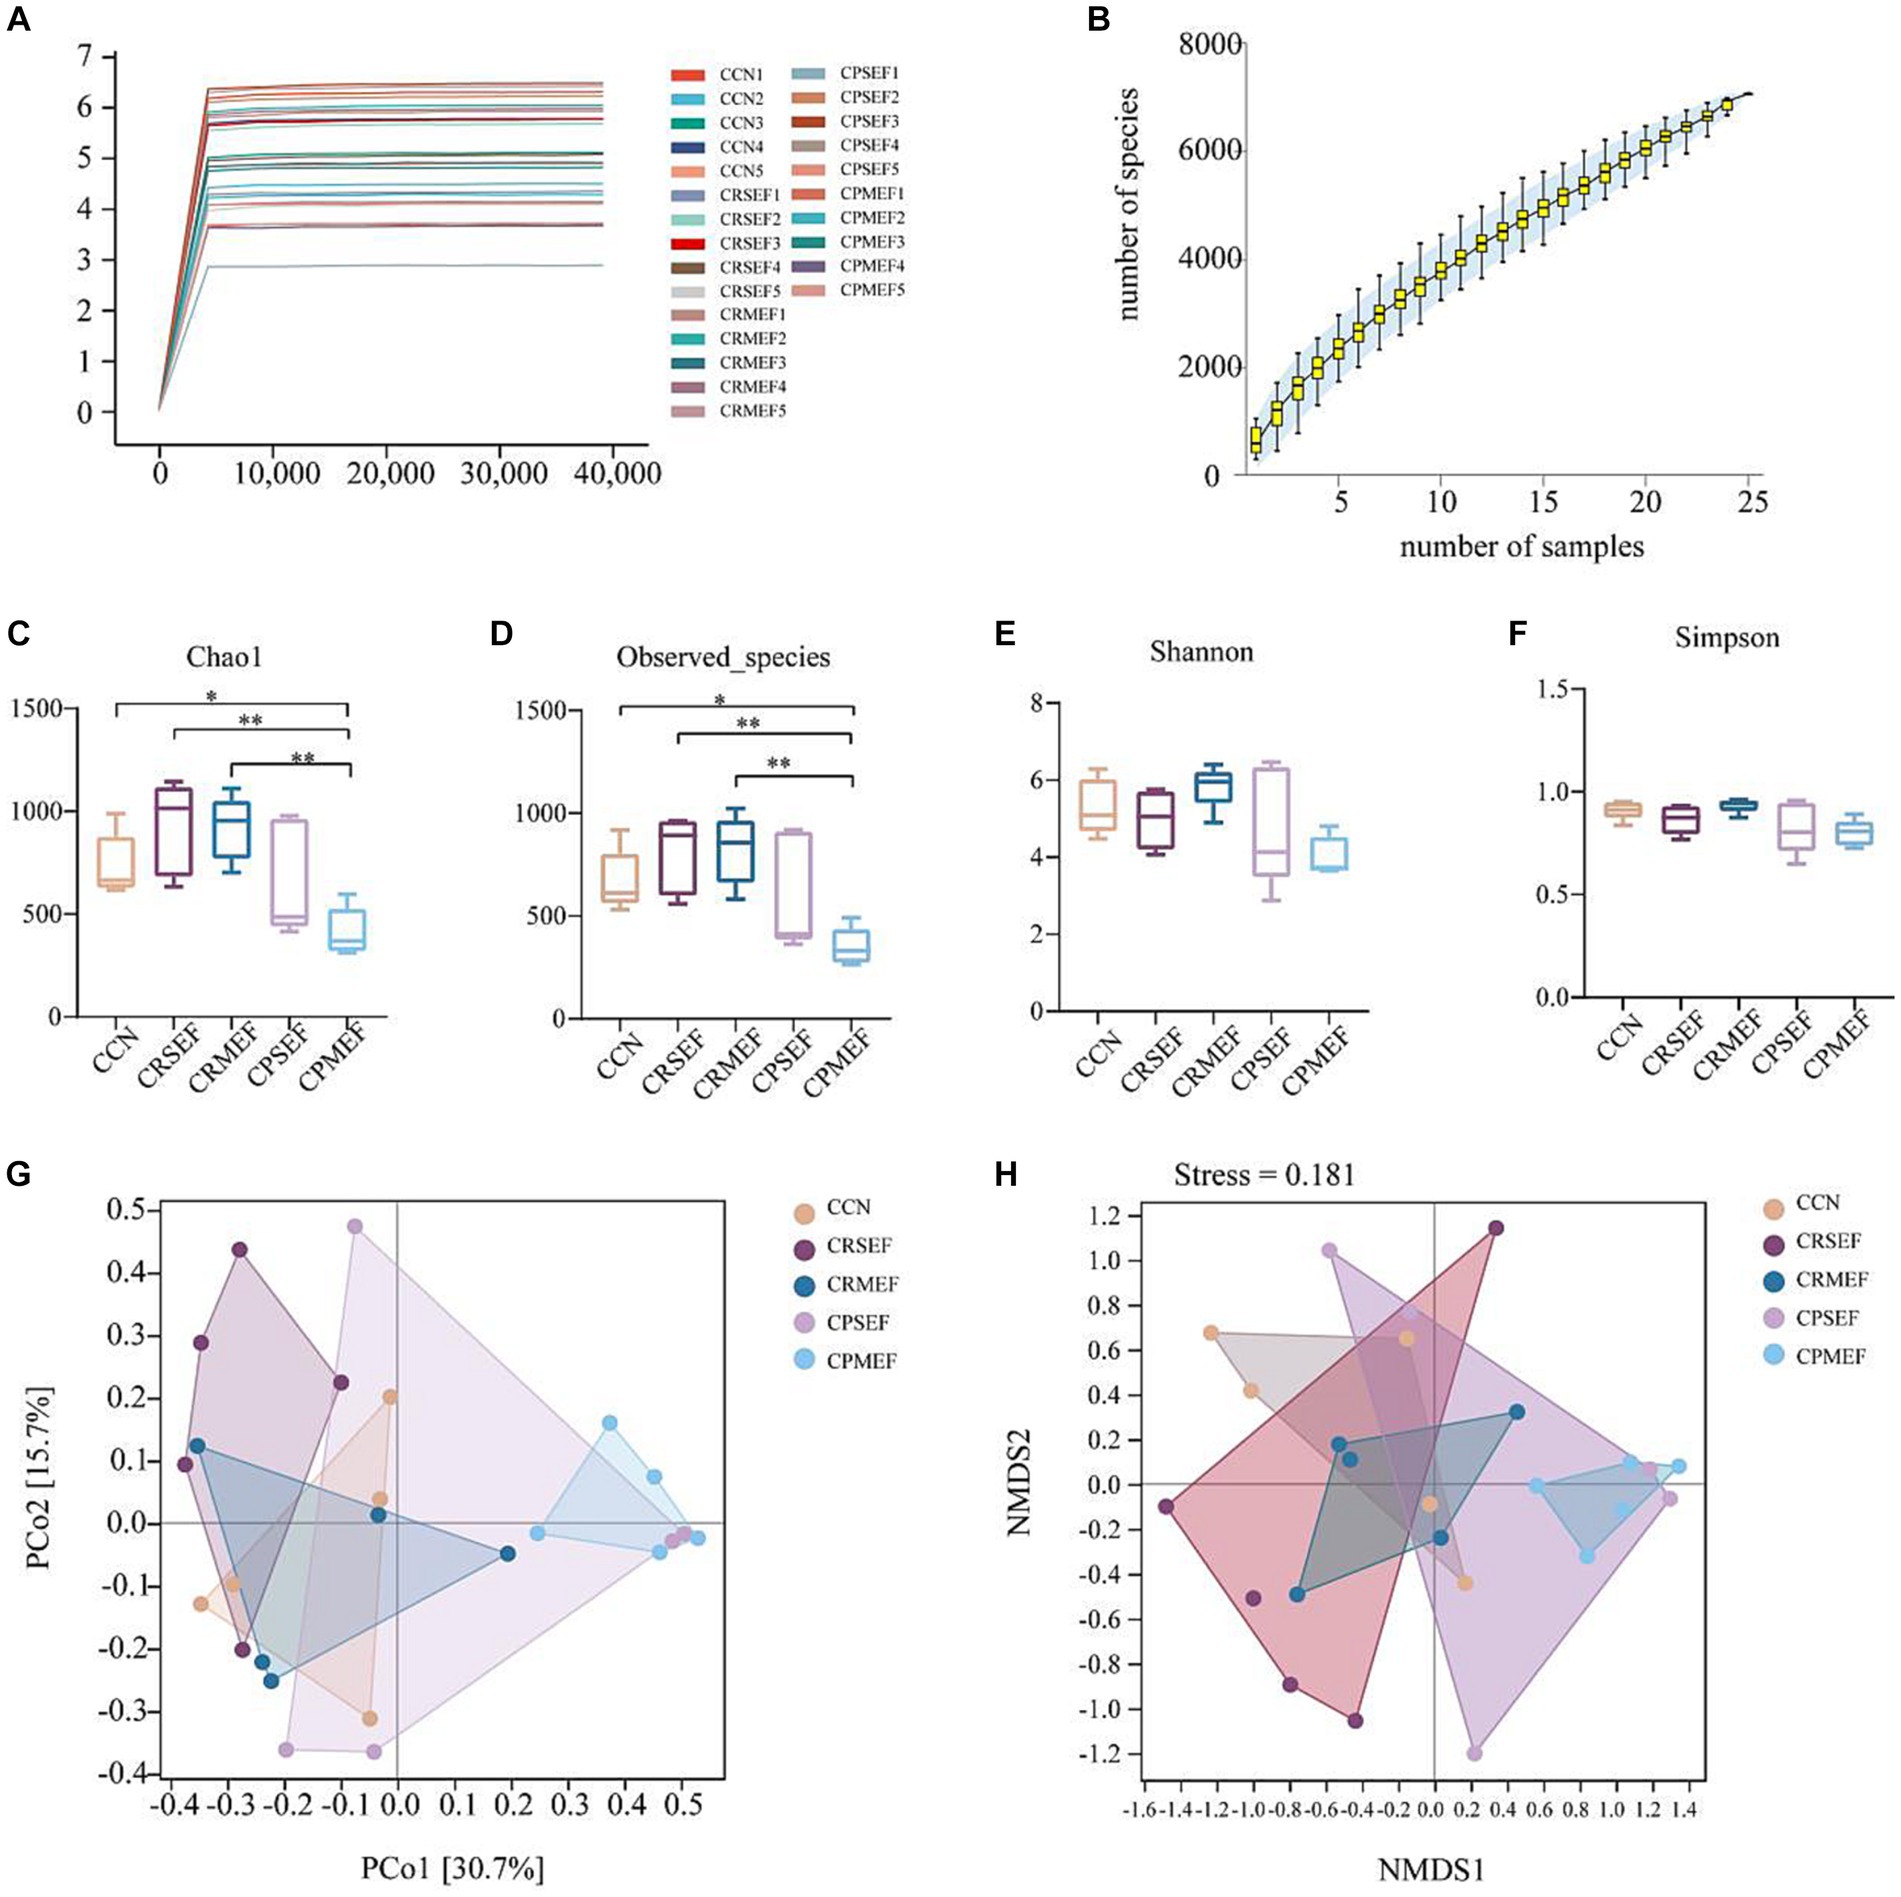
Figure 4. (A) Shannon dilution curve for each group of mice. (B) Species accumulation curves for each group of mice. Alpha diversity index: (C) Chao1 Index. (D) Observed species Index. (E) Shannon Index. (F) Simpson Index. Beta diversity based on Bray-Curtis distance algorithm: (G) Distance matrix PCoA analysis. (H) Distance matrix NMDS analysis. CCN: control group, CRSEF: raw small-flowered EF group, CRMEF: raw medium-flowered EF group, CPSEF: processing small-flowered EF group, CPMEF: processing medium-flowered EF group. *p < 0.05, **p < 0.01.
The CCN, CRSEF, CRMEF, CPSEF, and CPMEF groups had 1,011, 1,364, 1,028, 1,144, and 657 unique ASVs, respectively, with a total of 190 identical ASVs in the five experimental groups (Figure 5A). The analysis of intestinal microbiota composition within the group showed that the intestinal content microbiota of the six classification levels changed after the EF intervention (Figure 5B). We further analyzed the composition of the intestinal content microbiota at different taxonomic levels between groups. At the phylum level, the intestinal contents microbiota was dominated by Firmicutes, Proteobacteria, Bacteroidetes, TM7, and Actinobacteria, with Firmicutes accounting for the largest proportion (Figure 5C). Compared with the CCN, CRSEF, and CRMEF groups, the relative abundance of Bacteroidetes was significantly decreased in the CPMEF group, while the relative abundance of Firmicutes was significantly increased (p < 0.05, Figures 5D,E). Compared with the CRSEF group, the relative abundance of Firmicutes was significantly increased in the CPSEF group (p < 0.05, Figure 5E).
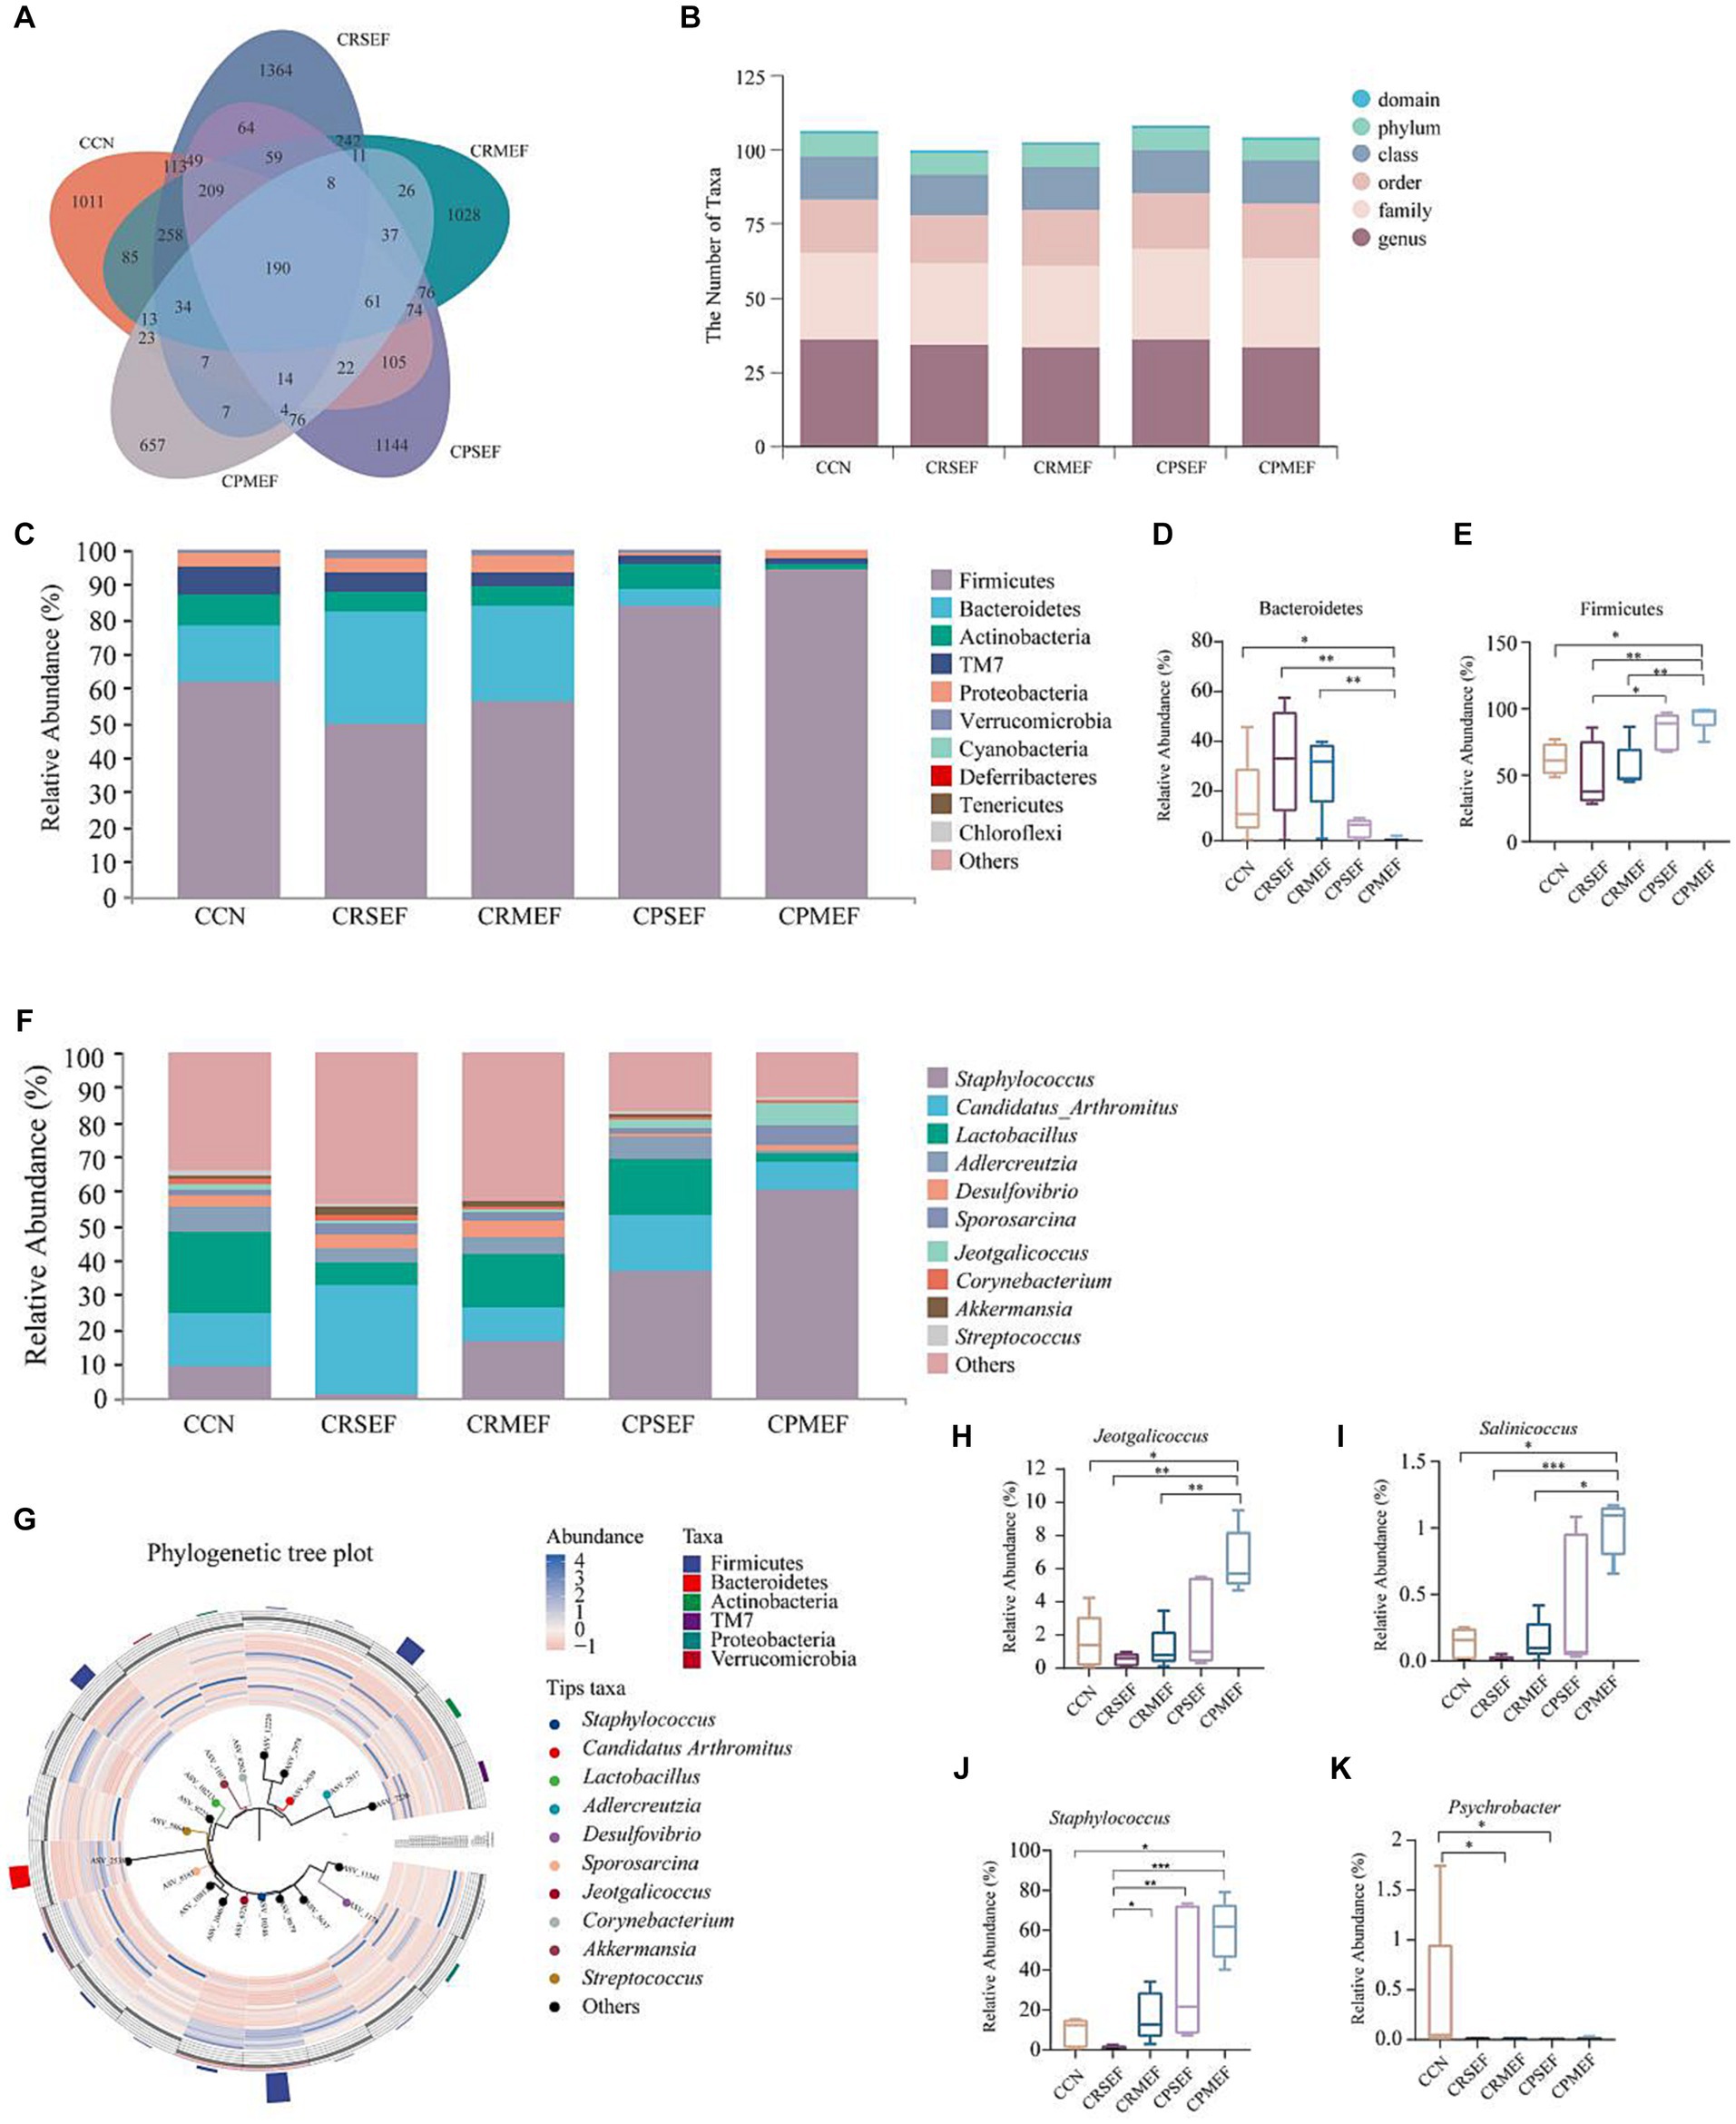
Figure 5. (A) ASVs Venn diagram. (B) Number of classification units in each group. (C) Composition of the intestinal contents microbiota at the phylum level. (D) Relative abundance of groups of Bacteroidetes. (E) Relative abundance of groups of Firmicutes. (F) Composition of the intestinal contents microbiota at the genus level. (G) Phylogenetic tree plot. (H) Relative abundance of groups of Jeotgalicoccus. (I) Relative abundance of groups of Salinicoccus. (J) Relative abundance of groups of Staphylococcus. (K) Relative abundance of groups of Psychrobacter. CCN: control group, CRSEF: raw small-flowered EF group, CRMEF: raw medium-flowered EF group, CPSEF: processing small-flowered EF group, CPMEF: processing medium-flowered EF group. *p < 0.05, **p < 0.01, ***p < 0.001.
At the genus level, Staphylococcus, Candidatus Arthromitus, Lactobacillus, Adlercreutzia, Desulfovibrio, etc., were predominant, with Staphylococcus accounting for the largest proportion (Figure 5F). According to the Phylogenetic tree plot, we found that Staphylococcus and Jeotgalicoccus belonged to Firmicutes (Figure 5G). Compared with the CCN group, the relative abundance of Jeotgalicoccus, Salinicoccus, and Staphylococcus was significantly increased in the CPMEF group (p < 0.05, Figures 5H–J). Compared with the CPMEF group, the relative abundance of Jeotgalicoccus and Salinicoccus, was significantly lower in both CRSEF and CRMEF groups (p < 0.05, Figures 5H–J). The relative abundance of Psychrobacter was significantly lower in the CRMEF and CPSEF groups compared to the CCN group (p < 0.05, Figure 5K).
Based on LEfSe analysis, we identified the characteristic bacteria with different changes in each group. When the LDA score was greater than 3, there were differences in the microbiota abundance of CCN, CPSEF, CPMEF, and CRSEF groups, among which 13 bacteria were identified as key discriminators. At the genus level, Enterococcus is characteristic of the CCN group, Staphylococcus is characteristic of the CPSEF group, and Jeotgalicoccus, Salinicoccus is characteristic of the CPMEF group (Figures 6A,B). Based on the KEGG database (Kanehisa and Goto, 2000; Kanehisa, 2019; Kanehisa et al., 2023), we predicted the metabolic pathways related to intestinal contents microbiota by PICRUSt2 analysis and further determined the effect of EF feeding on the potential metabolic function of intestinal contents microbiota in mice. We screened the top 20 metabolic pathways in relative abundance, mainly Cellular Processes, Environmental Information Processing, Genetic Information Processing, and Human Diseases, with the highest abundance of the Metabolism pathway (Figure 6C).
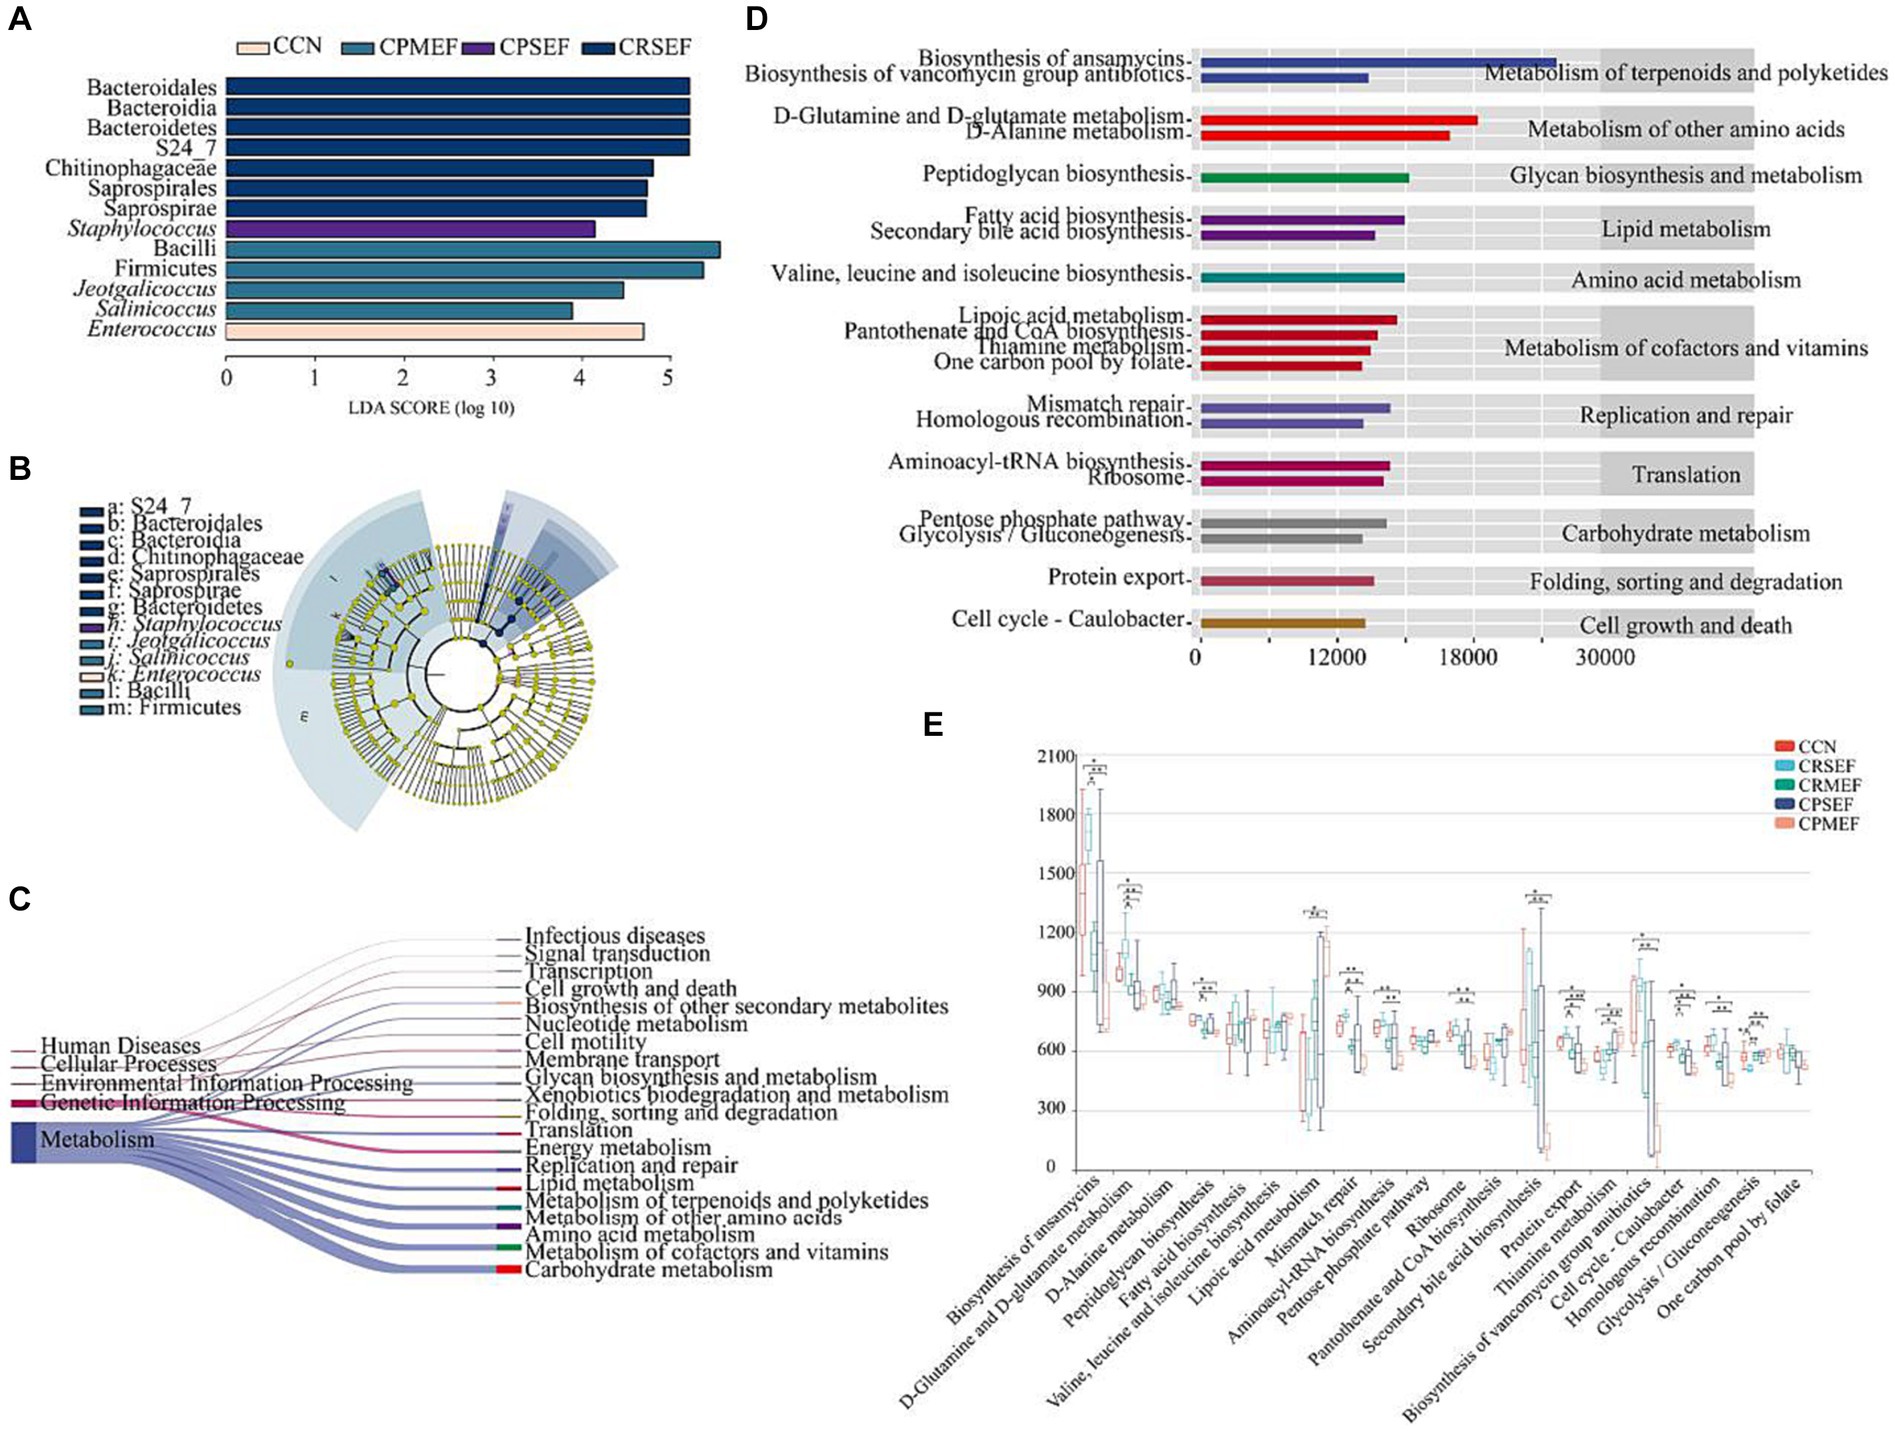
Figure 6. (A) Histogram of LDA to identify bacterial species with different levels. (B) The cladogram generated from the LEfSe analysis indicates the phylogenetic distribution from phylum to species of the intestinal contents microbiota. (C) Prediction of metabolic function of intestinal contents microbiota based on PICRUSt2. The left side is the primary KEGG metabolic pathway, and the right side is the secondary KEGG metabolic pathway. The line thickness represents the relative abundance of the KEGG metabolic pathway. (D) Prediction of metabolic function of intestinal contents microbiota based on PICRUSt2. The ordinate shows the classification of KEGG functional pathways: the second-order KEGG metabolic pathway on the left, the third-order KEGG metabolic pathway on the right, and the abscissa shows the abundance of KEGG functional pathways. (E) The difference box diagram of the third-order KEGG metabolic pathway in each group’s top 20 relative abundances. CCN: control group, CRSEF: raw small-flowered EF group, CRMEF: raw medium-flowered EF group, CPSEF: processing small-flowered EF group, CPMEF: processing medium-flowered EF group. *p < 0.05, **p < 0.01, ***p < 0.001.
We further analyzed the top 20 level 3 metabolic pathways in terms of relative abundance. The results showed that the potential metabolic functions of the mouse intestinal contents microbiota were dominated by the Biosynthesis of ansamycins, D-Glutamine and D-glutamate metabolism, D-Alanine metabolism, Peptidoglycan biosynthesis Fatty acid biosynthesis was predominant (Figure 6D). Compared to the CCN group, the relative abundance of Biosynthesis of ansamycins, D-Glutamine and D-glutamate metabolism, Peptidoglycan biosynthesis, Mismatch repair, Aminoacyl-tRNA biosynthesis, Ribosome, Secondary bile acid biosynthesis, Protein export, Biosynthesis of vancomycin group antibiotics, Cell cycle - Caulobacter and Homologous recombination were significantly decreased in the CRMEF group. The relative abundance of Thiamine metabolism was significantly increased (p < 0.05, Figure 6E).
Based on the above analysis, we found that EF affects liver and kidney function and can regulate intestinal microbiota dysbiosis. We further used correlation analysis to explore the correlation between altered intestinal microbiota, liver and kidney function, and potentially functional genes. AST was significantly negatively correlated with Enterococcus and positively correlated with Staphylococcus. AST, ALT, and SCr were positively correlated with Staphylococcus, Jeotgalicoccus, and Salinicoccus, but negatively correlated with Enterococcus (Figure 7A). Staphylococcus, Jeotgalicoccus, and Salinicoccus were significantly positively correlated with lipoic acid metabolism, and thiamine metabolism, and negatively correlated with Biosynthesis of ansamycins, D-Glutamine and D-glutamate metabolism, Peptidoglycan biosynthesis, Mismatch repair, Aminoacyl-tRNA biosynthesis, Ribosome, Secondary bile acid biosynthesis, Protein export, Biosynthesis of vancomycin group antibiotics, Cell cycle - Caulobacter, Homologous recombination. Enterococcus, on the other hand, was the opposite (Figure 7B).
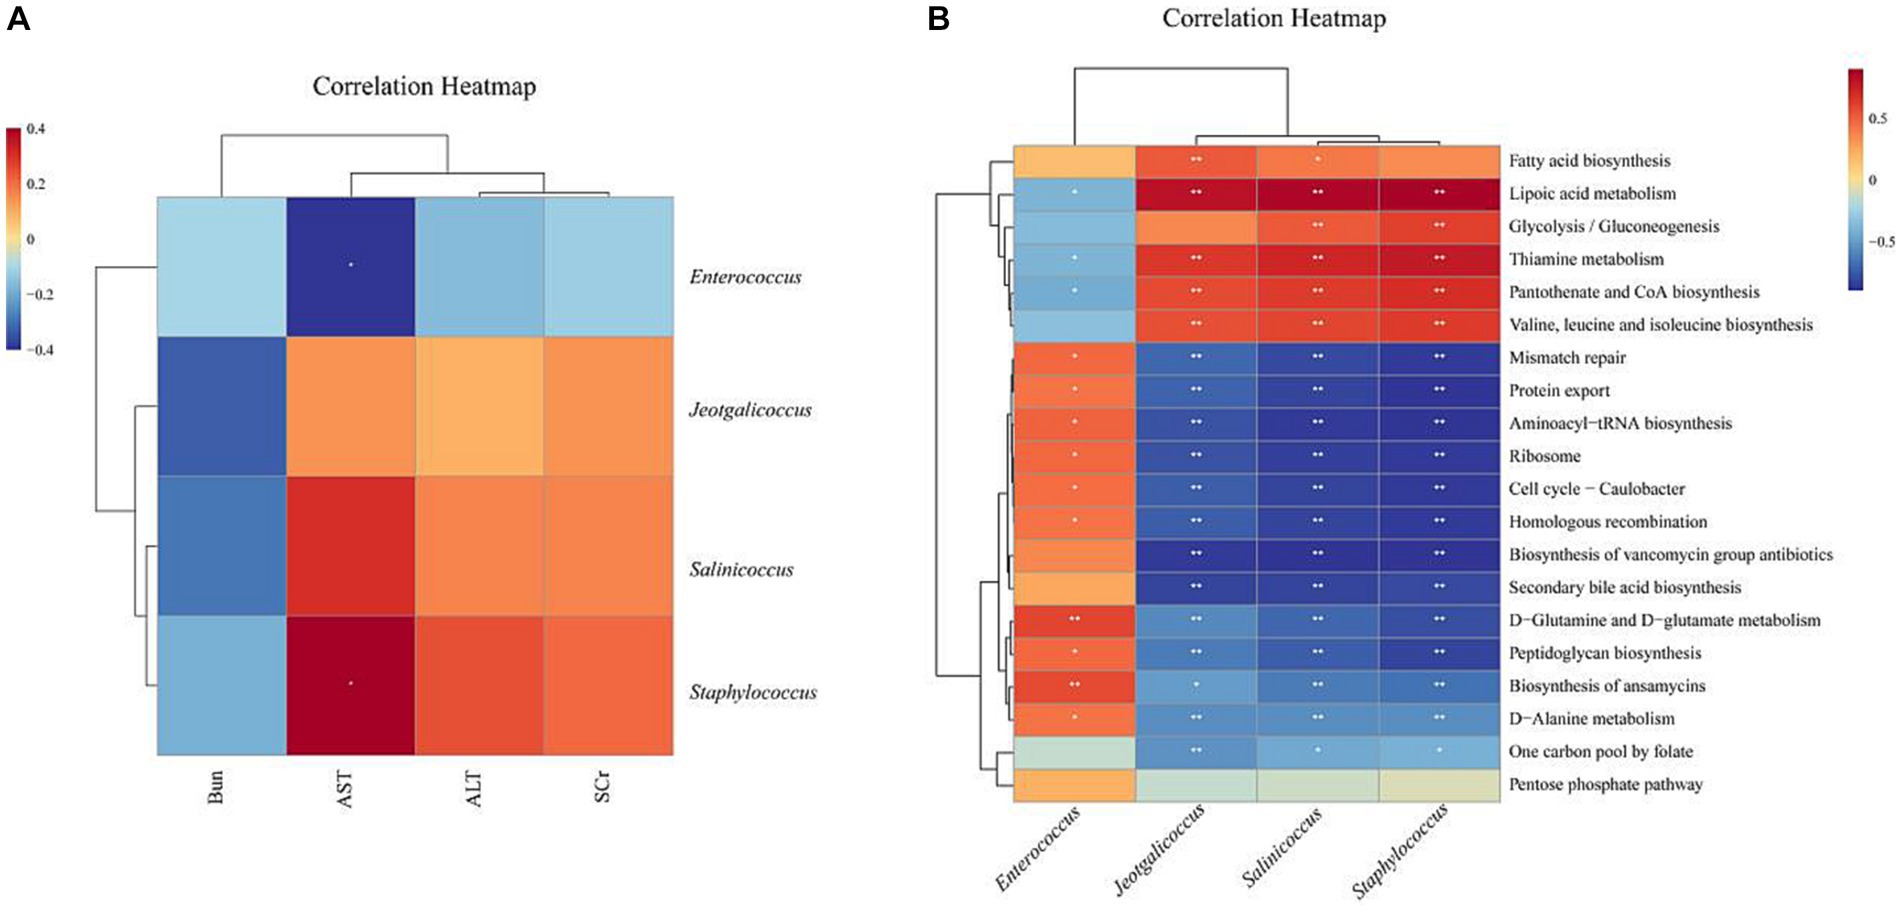
Figure 7. Heat map of correlation analysis: Blue represents a negative correlation, red represents a positive correlation, the closer the color is to blue, the stronger the negative correlation between the two parameters, the closer the color is to red, the stronger the positive correlation between the two parameters. (A) Heat map of correlation between characteristic microbiota of intestinal contents microbiota and liver and kidney function (B) Heat map of correlation between characteristic microbiota of intestinal contents microbiota and potential functional genes. *p < 0.05, **p < 0.01, ***p < 0.001.
Drug-related liver and kidney injury is mainly due to the potential toxicity of drugs excreted by the liver and kidneys and their metabolites, which directly or indirectly cause damage to the organs, resulting in liver and kidney function and/or structural disorders. Drugs and their metabolites are mostly excreted from the urine through glomerular filtration and renal tubule secretion, so the kidneys are particularly vulnerable to the toxic effects of drugs (European Association for the Study of the Liver, 2019; Dobrek, 2023). Aristolochic acid and alkaloid compounds in some of these herbs are known to cause nephrotoxicity (Yang B. et al., 2018). The chemical composition of EF varies from size to size and from processing to processing, which may have an impact on the toxicity of EF. In this study, the content of limonin decreased significantly after processing of EF, EVO in PSEF decreased significantly and EVO in PMEF increased significantly. Studies have confirmed that EVO and its derivatives enhance thermogenesis and lipid oxidation and play a role in weight management and therapy (Gavaraskar et al., 2015). Limonin can reduce the weight of mice fed with high fat (Wang S. W. et al., 2022). In this study, it was found that the weight of mice after different EF feeding showed a decreasing trend, but the difference among groups was not significant, which may be related to the different contents of EVO and limonin.
Scr and Bun are metabolites in the body, mainly produced by muscle metabolism and cleared by the kidneys, and increased concentrations of Scr and Bun reflect decreased renal function, so the measurement of Scr and Bun can determine changes in renal function (Zhao et al., 2022; Hong et al., 2023). This study showed that Scr showed an increasing trend after feeding by different EF, Bun significantly increased in RMEF groups, and Bun significantly decreased in the PMEF group. However, due to the high metabolic capacity of the kidney, the Scr concentration generally does not increase in the early stage of kidney injury and only increases significantly when the glomerular filtration function is seriously reduced (Hong et al., 2023). Considering the metabolic characteristics of Scr, combined with histopathological sections, RMEF may have certain nephrotoxicity, and licorice processing can reduce nephrotoxicity. However, in this study, the kidney injury was not obvious, which may be due to insufficient feeding time or too low concentration. In the early stage of kidney injury, the glomeruli were not involved. In this study, AST significantly increased in the RMEF and PMEF groups. Although EVO is hepatocyte toxic, the mechanisms of its toxicity may involve lipid peroxidation damage, apoptosis, and cholestasis (Li et al., 2019; Gao et al., 2021). However, ALT mainly exists in hepatocytes and is the most sensitive detection index of liver function damage. AST usually exists in the mitochondria of cardiomyocytes and hepatocytes, with the highest content in myocardium, followed by the liver. AST will increase only when liver tissue is seriously damaged (Kalas et al., 2021; Lala et al., 2023). In combination with tissue sections, liver tissue sections in the PMEF group showed no obvious damage and ALT changes were not significant. Thus, elevated AST here may be a non-hepatic injury (hemolysis, myopathy, thyroid disease, exercise) rather than an EVO induced liver injury.
Intestinal microbiota directly or indirectly affects the metabolism and efficacy of many drugs, leading to drug activation, drug inactivation, or toxicity (Abdelsalam et al., 2020). The large microbial community in the intestine plays an important and complex role in drug absorption and health status of the liver. Most natural herbs, including EF, are administered orally, and intestinal microbiota first contacts the drug ingredients after entering the intestine (Džidić-Krivić et al., 2023). Intestinal ecological imbalance can indirectly or directly regulate the progress of renal diseases, among which the changes in the abundance and proportion of intestinal Bacteroidetes and Firmicutes can reflect renal diseases. Herbal alleviates renal diseases by regulating intestinal microbiota, which can reduce Bacteroidetes and increase Firmicutes, showing a direct correlation with renal function parameters (Chen et al., 2021; Saranya and Viswanathan, 2023). This study showed that after the processing of EF feeding, the diversity of Bacteroidetes in the intestinal contents of mice decreased, and Firmicutes increased significantly, while renal toxicity decreased significantly. Therefore, we hypothesize that the attenuated PEF nephrotoxicity may be associated with a significant decrease in Bacteroidetes and a significant increase in Firmicutes.
Staphylococcaceae covers a large group of Gram-positive bacteria, including Jeotgalicoccus, Macrococci, Nosocomicocus, Salinicoccus, and Staphylococcus, which are considered the pathogens of several serious diseases (Tang et al., 2015). Staphylococcus is a common pathogenic bacterium, the most common of which is Staphylococcus aureus, that promotes inflammation leading to infectious threats to global public health and is a major pathogen causing a range of diseases (Chand et al., 2023; Subramanian and Natarajan, 2023) Psychrobacter is a kind of bacteria resistant to low temperature, dryness, and starvation pressure, and it grows in low temperature by down-regulating energy metabolism (Kim et al., 2012). This study found that Staphylococcus was the characteristic bacteria of PSEF, and Jeotgalicoccus, and Salinicoccus were the characteristic bacteria of PMEF. In this study, CPMEF significantly decreased the diversity of intestinal microbiota and increased Staphylococcus, Jeotgalicoccus, and Salinicoccus. Compared with the CPMEF group, CRMEF significantly increased the diversity of intestinal microbiota and significantly decreased the relative abundance of Staphylococcus, Jeotgalicoccus, and Salinicoccus. Studies have found that limonin can significantly increase the richness of colon microbiota, significantly inhibit bacterial toxins and Staphylococcus aureus infection markers, improve intestinal injury and ulcers, and have a protective effect on the intestine (Gu et al., 2019; Jia et al., 2023). Some studies have found that adenine induced damage extends beyond the kidneys to affect the intestine as well, and the intestinal microbiota is a key mediator of the chemical’s toxicological effects. The correlation between chemical toxicity, intestinal microbiota, and organ-specific damage reveals the complex interaction between chemical toxicity and intestinal microbiota (Li et al., 2023). On the one hand, we speculate that EF components may have toxic effects on specific microbiota, leading to the reduction or proliferation of microbiota, for example, the RMEF group has a higher limonin content, and compared with the PMEF group, the intestinal harmful bacteria are reduced and their diversity is increased. Therefore, REF increased microbial diversity and decreased harmful bacteria, which may be related to higher limonin content. On the other hand, changes in intestinal microbiota may affect the metabolism and absorption of EF in the intestine, thereby regulating its toxicity. For example, the increase of harmful bacteria in the PMEF group may affect intestinal mucosal permeability, and thus the physiological and metabolic processes of EF.
The liver plays a key role in the homeostasis of most amino acids and determines whether specific amino acids are absorbed by the liver or circulated throughout the body, whereas hepatic amino acids are metabolic substrates for a variety of essential compounds (Paulusma et al., 2022). Disturbances in amino acid metabolism are associated with the progression of hepatotoxicity. The amino acid metabolic pathways, metabolic pathways of energy, glutathione, and porphyrin are downregulated after liver injury, and Staphylococcus abundance increases and is associated with liver injury (Wang C. et al., 2022). SCFAs, bile acids, and fatty acids are common metabolites of the microbiome that regulate intestinal permeability, glucose and lipid metabolism, the immune system, and inflammatory responses (Xiao et al., 2021; Min et al., 2022). Glutamate is a key hepatic amino acid metabolite produced through transamination during the catabolism of several amino acids (Pfennig et al., 2013).
This study showed that after RMEF feeding, D-Glutamine and D-glutamate metabolism, Peptidoglycan biosynthesis, Aminoacyl-tRNA biosynthesis, Secondary bile acid biosynthesis, Protein export, Biosynthesis of antibiotics were significantly reduced. It is negatively correlated with Staphylococcus, Jeotgalicoccus, and Salinicoccus, while Lipoic acid metabolism and Thiamine metabolism, AST, ALT, and Scr were positively correlated with Staphylococcus, Jeotgalicoccus, and Salinicoccus. The results indicated that the changes in intestinal microbiota after EF feeding may affect the amino acid metabolism of hepatocytes and regulate the changes of related liver amino acid metabolism pathway, among which the abundance of Staphylococcus, Jeotgalicoccus, and Salinicoccu are closely related to liver function. Liver injury was not obvious in this study, but the results of bacterial microbiota showed that the increase of harmful bacteria was correlated with the decrease in liver metabolic function. Therefore, EF may have some liver damage too, but the toxicity concentration was not determined in this study for the time being because the concentration gradient and time gradient were not set up in this study, which is a shortcoming of the study.
In conclusion, PMEF significantly increased harmful bacteria (Staphylococcus, Jeotgalicoccus, and Salinicoccu) and decreased beneficial bacteria. SEF with 5 times the clinical dose showed nephrotoxicity, and SEF nephrotoxicity decreased after processing, but EF hepatotoxicity was not significant, which may be due to insufficient dose concentration and time.
The datasets presented in this study can be found in online repositories. The names of the repository/repositories and accession number(s) can be found at: NCBI - PRJNA976505.
The animal studies were approved by Animal Experimentation Ethics Committee of the Hunan University of Chinese Medicine. The studies were conducted in accordance with the local legislation and institutional requirements. Written informed consent was obtained from the owners for the participation of their animals in this study.
XL: Conceptualization, Investigation, Writing – original draft, Funding acquisition. JL: Writing – original draft, Conceptualization, Data curation, Formal analysis, Investigation. JD: Conceptualization, Methodology, Project administration, Validation, Writing – original draft. NX: Methodology, Software, Conceptualization, Formal analysis, Writing – original draft. YP: Conceptualization, Funding acquisition, Formal analysis, Writing – original draft. QT: Conceptualization, Funding acquisition, Writing – review & editing, Project administration. LC: Conceptualization, Funding acquisition, Visualization, Methodology, Writing – original draft.
The author(s) declare financial support was received for the research, authorship, and/or publication of this article. This research was financially supported by Scientific research items of Hunan University of Chinese Medicine (202111) and the Natural Science Foundation of Hunan Province (No. 2023JJ60117). Hunan Province Traditional Chinese Medicine Research Project (A2024020).
We thank the editors and the reviewers of this paper for their construction.
The authors declare that the research was conducted in the absence of any commercial or financial relationships that could be construed as a potential conflict of interest.
All claims expressed in this article are solely those of the authors and do not necessarily represent those of their affiliated organizations, or those of the publisher, the editors and the reviewers. Any product that may be evaluated in this article, or claim that may be made by its manufacturer, is not guaranteed or endorsed by the publisher.
Abdelsalam, N. A., Ramadan, A. T., ElRakaiby, M. T., and Aziz, R. K. (2020). Toxicomicrobiomics: the human microbiome vs. pharmaceutical, dietary, and environmental xenobiotics. Front. Pharmacol. 11:390. doi: 10.3389/fphar.2020.00390
Bezek, K., Kurinčič, M., Knauder, E., Klančnik, A., Raspor, P., Bucar, F., et al. (2016). Attenuation of adhesion, biofilm formation and quorum sensing of Campylobacter jejuni by Euodia ruticarpa. Phytother. Res. 30, 1527–1532. doi: 10.1002/ptr.5658
Chand, U., Priyambada, P., and Kushawaha, P. K. (2023). Staphylococcus aureus vaccine strategy: promise and challenges. Microbiol. Res. 271:127362. doi: 10.1016/j.micres.2023.127362
Chen, L., Hu, Y., Ye, Z., Li, L., Qian, H., Wu, M., et al. (2023). Major indole alkaloids in Evodia Rutaecarpa: the latest insights and review of their impact on gastrointestinal diseases. Biomed. Pharmacother. 167:115495. doi: 10.1016/j.biopha.2023.115495
Chen, Q., Ren, D., Wu, J., Yu, H., Chen, X., Wang, J., et al. (2021). Shenyan Kangfu tablet alleviates diabetic kidney disease through attenuating inflammation and modulating the gut microbiota. J. Nat. Med. 75, 84–98. doi: 10.1007/s11418-020-01452-3
Dobrek, L. (2023). A synopsis of current theories on drug-induced nephrotoxicity. Life (Basel) 13:325. doi: 10.3390/life13020325
Džidić-Krivić, A., Kusturica, J., Sher, E. K., Selak, N., Osmančević, N., Karahmet Farhat, E., et al. (2023). Effects of intestinal flora on pharmacokinetics and pharmacodynamics of drugs. Drug Metab. Rev. 55, 126–139. doi: 10.1080/03602532.2023.2186313
European Association for the Study of the Liver (2019). EASL clinical practice guidelines: drug-induced liver injury. J. Hepatol. 70, 1222–1261. doi: 10.1016/j.jhep.2019.02.014
Gao, Y. D., Zhu, A., Li, L. D., Zhang, T., Wang, S., Shan, D. P., et al. (2021). Cytotoxicity and underlying mechanism of evodiamine in HepG2 cells. Beijing Da Xue Xue Bao 53, 1107–1114. doi: 10.19723/j.issn.1671-167X.2021.06.017
Gavaraskar, K., Dhulap, S., and Hirwani, R. R. (2015). Therapeutic and cosmetic applications of Evodiamine and its derivatives--a patent review. Fitoterapia 106, 22–35. doi: 10.1016/j.fitote.2015.07.019
Gu, M., Sun, J., Qi, C., Cai, X., Goulette, T., Song, M., et al. (2019). The gastrointestinal fate of limonin and its effect on gut microbiota in mice. Food Funct. 10, 5521–5530. doi: 10.1039/c9fo01274e
Hong, D., Ren, Q., Zhang, J., Dong, F., Chen, S., Dong, W., et al. (2023). A new criteria for acute on preexisting kidney dysfunction in critically ill patients. Ren. Fail. 45:2173498. doi: 10.1080/0886022X.2023.2173498
Jia, B., Zhao, L., Liu, P., Li, M., and Tian, Z. (2023). Limonin ameliorates indomethacin-induced intestinal damage and ulcers through Nrf2/ARE pathway. Immun. Inflamm. Dis. 11:e787. doi: 10.1002/iid3.787
Kalas, M. A., Chavez, L., Leon, M., Taweesedt, P. T., and Surani, S. (2021). Abnormal liver enzymes: a review for clinicians. World J. Hepatol. 13, 1688–1698. doi: 10.4254/wjh.v13.i11.1688
Kanehisa, M. (2019). Toward understanding the origin and evolution of cellular organisms. Protein Sci. 28, 1947–1951. doi: 10.1002/pro.3715
Kanehisa, M., Furumichi, M., Sato, Y., Kawashima, M., and Ishiguro-Watanabe, M. (2023). KEGG for taxonomy-based analysis of pathways and genomes. Nucleic Acids Res. 51, D587–D592. doi: 10.1093/nar/gkac963
Kanehisa, M., and Goto, S. (2000). KEGG: Kyoto encyclopedia of genes and genomes. Nucleic Acids Res. 28, 27–30. doi: 10.1093/nar/28.1.27
Kim, S. J., Shin, S. C., Hong, S. G., Lee, Y. M., Choi, I. G., and Park, H. (2012). Genome sequence of a novel member of the genus Psychrobacter isolated from Antarctic soil. J. Bacteriol. 194:2403. doi: 10.1128/JB.00234-12
Lala, V., Zubair, M., and Minter, D. (2023). Liver function tests. Treasure Island: StatPearls, 151–176.
Li, L., Chen, L., Yang, Y., Wang, J., Guo, L., An, J., et al. (2022). Characteristics of gut microbiome and its metabolites, short-chain fatty acids, in children with idiopathic short stature. Front. Endocrinol. (Lausanne) 13:890200. doi: 10.3389/fendo.2022.890200
Li, X., Deng, N., Zheng, T., Qiao, B., Peng, M., Xiao, N., et al. (2022). Importance of Dendrobium officinale in improving the adverse effects of high-fat diet on mice associated with intestinal contents microbiota. Front. Nutr. 9:957334. doi: 10.3389/fnut.2022.957
Li, F., Dong, Y. Z., Zhang, D., Zhang, X. M., Lin, Z. J., and Zhang, B. (2019). Molecular mechanisms involved in drug-induced liver injury caused by urate-lowering Chinese herbs: a network pharmacology study and biology experiments. PLoS One 14:e0216948. doi: 10.1371/journal.pone.02169487
Li, D., Li, Y., Jiang, X., Liu, W., and Zhao, Q. (2022). Evodiamine: a privileged structure with broad-ranging biological activities. Mini Rev. Med. Chem. 22, 2680–2701. doi: 10.2174/1389557522666220404090835
Li, X., Qiao, B., Wu, Y., Deng, N., and Tan, Z. (2023). Evaluation of toxicological effects of chemical substances by gut microbiota: the example of adenine damage to the kidney and gut. Heliyon 9:e23010. doi: 10.1016/j.heliyon.2023.e23010
Li, X., and Sun, R. (2015). Study on efficacy and accompanying toxic and side effects of volatile oil of Evodia Fructus based on stomach cold syndrome model. Zhongguo Zhong Yao Za Zhi 40, 3838–3844. doi: 10.4268/cjcmm20151925
Li, M., and Wang, C. (2020). Traditional uses, phytochemistry, pharmacology, pharmacokinetics and toxicology of the fruit of Tetradium ruticarpum: a review. J. Ethnopharmacol. 263:113231. doi: 10.1016/j.jep.2020.113231
Li, C., Zhou, K., Xiao, N., Peng, M., and Tan, Z. (2022). The effect of Qiweibaizhu powder crude polysaccharide on antibiotic-associated diarrhea mice is associated with restoring intestinal mucosal Bacteria. Front. Nutr. 9:952647. doi: 10.3389/fnut.2022.952647
Liu, J., Qiao, B., Deng, N., Wu, Y., Li, D., and Tan, Z. (2023). The diarrheal mechanism of mice with a high-fat diet in a fatigued state is associated with intestinal mucosa microbiota. 3 Biotech 13:77. doi: 10.1007/s13205-023-03491-5
Min, Y. W., Rezaie, A., and Pimentel, M. (2022). Bile acid and gut microbiota in irritable bowel syndrome. J. Neurogastroenterol. Motil. 28, 549–561. doi: 10.5056/jnm22129
National Pharmacopoeia Commission (2020). Chinese pharmacopoeia. Beijing: China Medical Science Press, 178–179.
Paulusma, C. C., Lamers, W. H., Broer, S., and van de Graaf, S. F. J. (2022). Amino acid metabolism, transport and signalling in the liver revisited. Biochem. Pharmacol. 201:115074. doi: 10.1016/j.bcp.2022.115074
Pfennig, T., Herrmann, B., Bauer, T., Schömig, E., and Gründemann, D. (2013). Benzoic acid and specific 2-oxo acids activate hepatic efflux of glutamate at OAT2. Biochim. Biophys. Acta 1828, 491–498. doi: 10.1016/j.bbamem.2012.08.026
Qiao, B., Liu, J., Deng, N., Cai, Y., Bian, Y., Wu, Y., et al. (2023). Gut content microbiota dysbiosis and dysregulated lipid metabolism in diarrhea caused by high-fat diet in a fatigued state. Food Funct. 14, 3880–3892. doi: 10.1039/d3fo00378g
Saranya, G. R., and Viswanathan, P. (2023). Gut microbiota dysbiosis in AKI to CKD transition. Biomed. Pharmacother. 161:114447. doi: 10.1016/j.biopha.2023.114447
Schroeder, B., and Bäckhed, F. (2016). Signals from the gut microbiota to distant organs in physiology and disease. Nat. Med. 22, 1079–1089. doi: 10.1038/nm.4185
Shen, P., Zhang, Z., Zhu, K., Cao, H., Liu, J., Lu, X., et al. (2019). Evodiamine prevents dextran sulfate sodium-induced murine experimental colitis via the regulation of NF-κB and NLRP3 inflammasome. Biomed. Pharmacother. 110, 786–795. doi: 10.1016/j.biopha.2018
Subramanian, D., and Natarajan, J. (2023). Leveraging big data bioinformatics approaches to extract knowledge from Staphylococcus aureus public omics data. Crit. Rev. Microbiol. 49, 391–413. doi: 10.1080/1040841X.2022.2065905
Tan, Q., and Zhang, J. (2016). Evodiamine and its role in chronic diseases. Adv. Exp. Med. Biol. 929, 315–328. doi: 10.1007/978-3-319-41342-6_14
Tang, Y., Sussman, M., Liu, D., and Poxton, S. (2015). Molecular medical microbiology, 2nd edn. Boston: Academic Press, 175–184.
Wang, S. W., Lan, T., Chen, H. F., Sheng, H., Xu, C. Y., Xu, L. F., et al. (2022). Limonin, an AMPK activator, inhibits hepatic lipid accumulation in high fat diet fed mice. Front. Pharmacol. 13:833705. doi: 10.3389/fphar.2022.833705
Wang, C., Zhao, S., Xu, Y., Sun, W., Feng, Y., Liang, D., et al. (2022). Integrated microbiome and metabolome analysis reveals correlations between gut microbiota components and metabolic profiles in mice with methotrexate-induced Hepatoxicity. Drug Des. Devel. Ther. 16, 3877–3891. doi: 10.2147/DDDT.S381667
Wang, M., Zhou, B., Cong, W., Zhang, M., Li, Z., Li, Y., et al. (2021). Amelioration of AOM/DSS-induced murine colitis-associated Cancer by Evodiamine intervention is primarily associated with gut microbiota-metabolism-inflammatory signaling Axis. Front. Pharmacol. 12:797605. doi: 10.3389/fphar.2021.797605
Wu, Q., Cai, C., Guo, P., Chen, M., Wu, X., Zhou, J., et al. (2019). In silico identification and mechanism exploration of hepatotoxic ingredients in traditional Chinese medicine. Front. Pharmacol. 10:458. doi: 10.3389/fphar.2019.00458
Wu, Y., Peng, X., Li, X., Li, D., Tan, Z., and Yu, R. (2022). Sex hormones influence the intestinal microbiota composition in mice. Front. Microbiol. 13:964847. doi: 10.3389/fmicb.2022.964847
Xiao, L., Liu, Q., Luo, M., and Xiong, L. (2021). Gut microbiota-derived metabolites in irritable bowel syndrome. Front. Cell. Infect. Microbiol. 11:729346. doi: 10.3389/fcimb.2021.729346
Yan, C., Peng, T., Zhang, T., Wang, Y., Li, N., Wang, K., et al. (2023). Molecular mechanisms of hepatotoxicity induced by compounds occurring in Evodiae Fructus. Drug Metab. Rev. 55, 75–93. doi: 10.1080/03602532.2023.2180027
Yan, X. J., Yu, X., Wang, X. P., Jiang, J. F., Yuan, Z. Y., Lu, X., et al. (2017). Mitochondria play an important role in the cell proliferation suppressing activity of berberine. Sci. Rep. 7:41712. doi: 10.1038/srep41712
Yang, T., Richards, E. M., Pepine, C. J., and Raizada, M. K. (2018). The gut microbiota and the brain-gut-kidney axis in hypertension and chronic kidney disease. Nat. Rev. Nephrol. 14, 442–456. doi: 10.1038/s41581-018-0018-2
Yang, B., Xie, Y., Guo, M., Rosner, M. H., Yang, H., and Ronco, C. (2018). Nephrotoxicity and Chinese herbal medicine. Clin. J. Am. Soc. Nephrol. 13, 1605–1611. doi: 10.2215/CJN.11571017
Zhang, S., Liu, S., Zhong, Z., Chen, B., and Wei, H. (2018). The relationship of “dose - time - toxicity”of different processed products of Evodia rutaecarpa (Juss) Benth on hepatotoxicity in mice. Lishizhen Med. Mate Riamedica Res. 29, 881–884. doi: 10.3969/j.issn.1008-0805.2018.04.037
Zhao, X., Lu, Y., Li, S., Guo, F., Xue, H., Jiang, L., et al. (2022). Predicting renal function recovery and short-term reversibility among acute kidney injury patients in the ICU: comparison of machine learning methods and conventional regression. Ren. Fail. 44, 1326–1337. doi: 10.1080/0886022X.2022.2107542
Zhu, J., Li, X., Deng, N., Zhou, K., Qiao, B., Li, D., et al. (2023). Intestinal mucosal flora of the intestine-kidney remediation process of diarrhea with deficiency kidney-yang syndrome in Sishen pill treatment: association with interactions between Lactobacillus johnsonii, Ca2+-Mg2+-ATP-ase, and Na+-K+-ATP-ase. Heliyon 9:e16166. doi: 10.1016/j.heliyon.2023.e16166
Keywords: Evodiae fructus, nephrotoxic, hepatotoxicity, intestinal microbiota, toxicity
Citation: Liang X, Liu J, Di J, Xiao N, Peng Y, Tian Q and Chen L (2024) Toxicity evaluation of processing Evodiae fructus based on intestinal microbiota. Front. Microbiol. 15:1336777. doi: 10.3389/fmicb.2024.1336777
Edited by:
Elisavet Stavropoulou, Centre Hospitalier Universitaire Vaudois (CHUV), SwitzerlandReviewed by:
Sukayna Fadlallah, University of Hasselt, BelgiumCopyright © 2024 Liang, Liu, Di, Xiao, Peng, Tian and Chen. This is an open-access article distributed under the terms of the Creative Commons Attribution License (CC BY). The use, distribution or reproduction in other forums is permitted, provided the original author(s) and the copyright owner(s) are credited and that the original publication in this journal is cited, in accordance with accepted academic practice. No use, distribution or reproduction is permitted which does not comply with these terms.
*Correspondence: Linglong Chen, NTgzNDMzMDMwQHFxLmNvbQ==
Disclaimer: All claims expressed in this article are solely those of the authors and do not necessarily represent those of their affiliated organizations, or those of the publisher, the editors and the reviewers. Any product that may be evaluated in this article or claim that may be made by its manufacturer is not guaranteed or endorsed by the publisher.
Research integrity at Frontiers
Learn more about the work of our research integrity team to safeguard the quality of each article we publish.