 Alfonso Felipe-López
 Nicole Hansmeier
 Michael Hensel
95% of researchers rate our articles as excellent or good
Learn more about the work of our research integrity team to safeguard the quality of each article we publish.
Find out more
ORIGINAL RESEARCH article
Front. Microbiol. , 04 June 2024
Sec. Infectious Agents and Disease
Volume 15 - 2024 | https://doi.org/10.3389/fmicb.2024.1329798
This article is part of the Research Topic Salmonella spp.- Transmission, Pathogenesis, Host-pathogen interaction, Prevention and Treatment View all 20 articles
Salmonella enterica serovar Typhimurium is an invasive, facultative intracellular gastrointestinal pathogen that destroys the brush border of polarized epithelial cells (PEC). The brush border is critical for the functions of PEC because it resorbs nutrients from the intestinal lumen and builds a physical barrier to infecting pathogens. The manipuation of PEC during infection by Salmonella was investigated by live-cell imaging and ultrastructural analysed of the brush border. We demonstrate that the destruction of the brush border by Salmonella significantly reduces the resorption surface of PEC along with the abrogation of endocytosis at the apical side of PEC. Both these changes in the physiology of PEC were associated with the translocation of type III secretion system effector protein SopE. Additionally, the F-actin polymerization rate at the apical side of PEC was highly altered by SopE, indicating that reduced endocytosis observed in infected PEC is related to the manipulation of F-actin polymerization mediated by SopE and, to a lesser extent, by effectors SopE2 or SipA. We further observed that in the absence of SopE, Salmonella effaced microvilli and induced reticular F-actin by bacterial accumulation during prolonged infection periods. In contrast to strains translocating SopE, strains lacking SopE did not alter resorption by PEC. Finally, we observed that after engulfment of Salmonella, ezrin was lost from the apical side of PEC and found later in early endosomes containing Salmonella. Our observations suggest that the destruction of the brush border by Salmonella may contribute to the pathogenesis of diarrhea.
The intestine is the main organ of the digestive tract and is responsible for the digestion and resorption of nutrients from the diet. The intestinal tract has evolved a specialized surface formed predominantly by polarized epithelial cells (PEC) to fulfill its function. Extensions of the intestinal epithelium are designated as villi. At the cellular level, each PEC of the epithelial layer develops at its apical surface actin-based membranous protrusions called microvilli (MV). MV are the functional structures of epithelial cells for nutrient resorption. Two morpho-physiological features contribute to this function: (a) MV augment the functional surface for resorption since cells possess a high number of MV (>1,000 MV), and (b) each microvillus contributes to the secretion of digestive enzymes such as disaccharidases and peptidases (McConnell and Tyska, 2007; McConnell et al., 2009; Revenu et al., 2012). The biochemical activity of MV is dependent on the function of structural proteins specifically localized in each microvillus. Loss of actin-coordinating proteins such as epsin, villin, or fimbrin (plastin I) by gene knockout negatively affects the localization and secretion of digestive enzymes (Revenu et al., 2012). Therefore, the membrane protrusions by MV are only functional if digestive enzymes can be properly secreted to the external milieu (Delacour et al., 2016).
MV also contribute to regulating the microbiota that reside along the intestine. Nevertheless, pathogenic bacteria such as enteropathogenic Escherichia coli (EPEC), enterohaemorrhagic E. coli (EHEC), enterotoxigenic E. coli (ETEC), Helicobacter pylori, or Salmonella enterica can disturb the integrity and function of the intestinal epithelium. After adhesion to host cells, these pathogens efface MV by translocation of virulence proteins that modify (a) actin, (b) increase the adhesion surface, in the case of EPEC and H. pylori, or (c) alter the transporter expression and localization by ribosylating toxins as the labile toxin (LT) of ETEC (Segal et al., 1996; Tan et al., 2009; Wong et al., 2011; Sheikh et al., 2022; Felipe-Lopez et al., 2023).
MV effacement results from the remodeling of actin and leads to the formation of pedestals, a typical feature observed during infection by EPEC or EHEC (Frankel et al., 1998; Wong et al., 2011; Lai et al., 2013). Additionally, brush border destruction is commonly accompanied by the formation of microcolonies at the host cell's apical side (Pedersen et al., 2017). This pathogenic interference leads to a loss of resorption by PEC (Dean et al., 2006) since digestive enzymes and the cotransporter Na+/Glucose SGLT-1 are also relocated to pedestals. Reduction of the resorption ability of enterocytes is also associated with high doses of infection and with the translocation of effector proteins such as Map, Tir, EspF, and the adhesin Intimin. In all these observations, EPEC formed microcolonies at the apical side of PEC. EPEC effector proteins NleH specifically target EPS8, hindering its function in actin bundling for pedestal formation (Dean et al., 2006). Infections by H. pylori alter the uptake of iron by PEC (Tan et al., 2011), as H. pylori does not diminish the uptake but increases the resorption of transferrin. Recruitment of the transferrin receptor to microcolonies at host cell apical side was dependent on effector protein CagA. In contrast to EPEC/EHEC and H. pylori, S. enterica serovar Typhimurium (STM) is an invasive pathogen that destroys the brush border of PEC in vivo and in vitro (Takeuchi, 1967; Finlay et al., 1988; Ginocchio et al., 1992; Felipe-Lopez et al., 2023). The SPI1-encoded type III secretion system (SPI1-T3SS) translocates a cocktail of effector proteins into host cells after intimate contact. Collectively, these effector proteins remodel the actin cytoskeleton of host cells, induce MV effacement, and internalize STM. Translocation of effector proteins also induces proinflammatory responses in intestinal PEC [Galan, 2021; reviewed in Fattinger et al. (2021b)].
The invasion of enterocytes by STM is highly cooperative and allows the invasion of multiple bacteria in the same infection foci (Lorkowski et al., 2014; Felipe-Lopez et al., 2023). The invasion concludes with extensive reorganization of the brush border and the formation of a structure called reticular F-actin (RA) at the apical side of PEC. Previous observations of STM-induced alterations of the apical site of PEC and the F-actin cytoskeleton are compiled in Supplementary Figure 1, demonstrating the ultrastructural features of RA. Fine filaments arose from the invasion foci to the periphery of the apical side of the cells once bacteria were internalized (Felipe-Lopez et al., 2023). In this experimental setup, the formation of RA on PEC was dependent upon the translocation of SopE and observed in MDCK and Caco-2 BBe1 cells but not in non-polarized cells, e.g., epithelioid cell line HeLa. RA remained even after bacterial internalization, coinciding with reduced recovery of MV structures as demonstrated by correlative confocal laser-scanning microscopy (CLSM) and atomic force microscopy (AFM) or scanning electron microscopy (SEM) (Kommnick et al., 2019; Felipe-Lopez et al., 2023). The internalization of STM, formation of RA, and disruption of the brush border might, therefore, alter the physiological apical resorption of PEC. Indeed, a recent study revealed that infection by STM altered the expression of ascorbic acid transporters in mice due to the inflammatory response caused by SPI1-T3SS effector proteins. However, no structural modifications of the brush border or enterocytes were mentioned (Teafatiller et al., 2023).
In this study, we investigate the physiological consequences of the translocation of SPI1-T3SS effector proteins. We focused on SopE and SopE2, which act as guanidine exchange factors for Rac1 and Cdc42 in mammalian host cells (Friebel et al., 2001). We show that RA is induced either by an invasion of STM expressing sopE or by the accumulation of STM devoid of sopE over time. The destruction of brush border architecture also demonstrated that resorption by PEC was disturbed after MV effacement and internalization of STM, which was dependent on SopE. The loss of MV by strains lacking SopE was insufficient to fully abrogate the uptake of fluid tracers by infected cells. We observed that STM invasion was accompanied by delocalization of ezrin from the apical side of host cells. Ezrin links F-actin to the plasma membrane of MV, and the interaction of ezrin with F-actin is controlled by the phosphocycling of ezrin [reviewed in Pelaseyed and Bretscher (2018)]. Therefore, we propose that as a consequence of the delocalization of ezrin and the resulting actin reorganization on the apical side of PEC, endocytosis of PEC is highly altered. The loss of MV and formation of RA during STM invasion thus may contribute to the pathogenesis of diarrhea during Salmonellosis.
Our prior work indicated a key role of SPI1-T3SS effector protein SopE in manipulating the apical side of PEC (Felipe-Lopez et al., 2023). However, the majority of clinical isolates of STM lack SopE, while all strains harbor SopE2 (Mirold et al., 1999). As STM strains lacking SopE also cause self-limited intestinal infections, in this study, we aim to analyze the effects of STM with or without SopE on PEC function and epithelial integrity.
The cell line Madin-Darby Canine Kidney (MDCK) was used as PEC for infection experiments and to quantify invasion of PEC by wild-type (WT) strains SL1344 harboring both sopE and sopE2 (SLWT) and NCTC12023 harboring only sopE2 (NCTCWT). Isogenic sopE/sopE2-deficient or sopE2-deficient mutant strains were performed (Figure 1A). At 10 and 30 min p.i., the invasion by SLΔsopEE2and NCTCΔsopE2 strains was about 100- and 10-fold, respectively, lower than that of corresponding WT strains. Although invasion by STM SLΔsopE, SLΔsopE2, or SLΔsopE sopE2 was lower at earlier time points, these strains reached levels similar to SLWT at 60 min p.i. (Figure 1A). Invasion by SLΔsopE and NCTCWT, which naturally lacks SopE, was slightly but significantly lower than that of SLWT. Using a reductionist approach (Felipe-Lopez et al., 2023) with a strain lacking sipA sopABEE2 (SLΔ5) with similar invasion to an invF mutant strain, we found that STM SLΔ5+[sopE] also showed augmented invasiveness; however, this was still 10-fold less than STM SLWT and was similar to that quantified for STM NCTCΔsopE2.
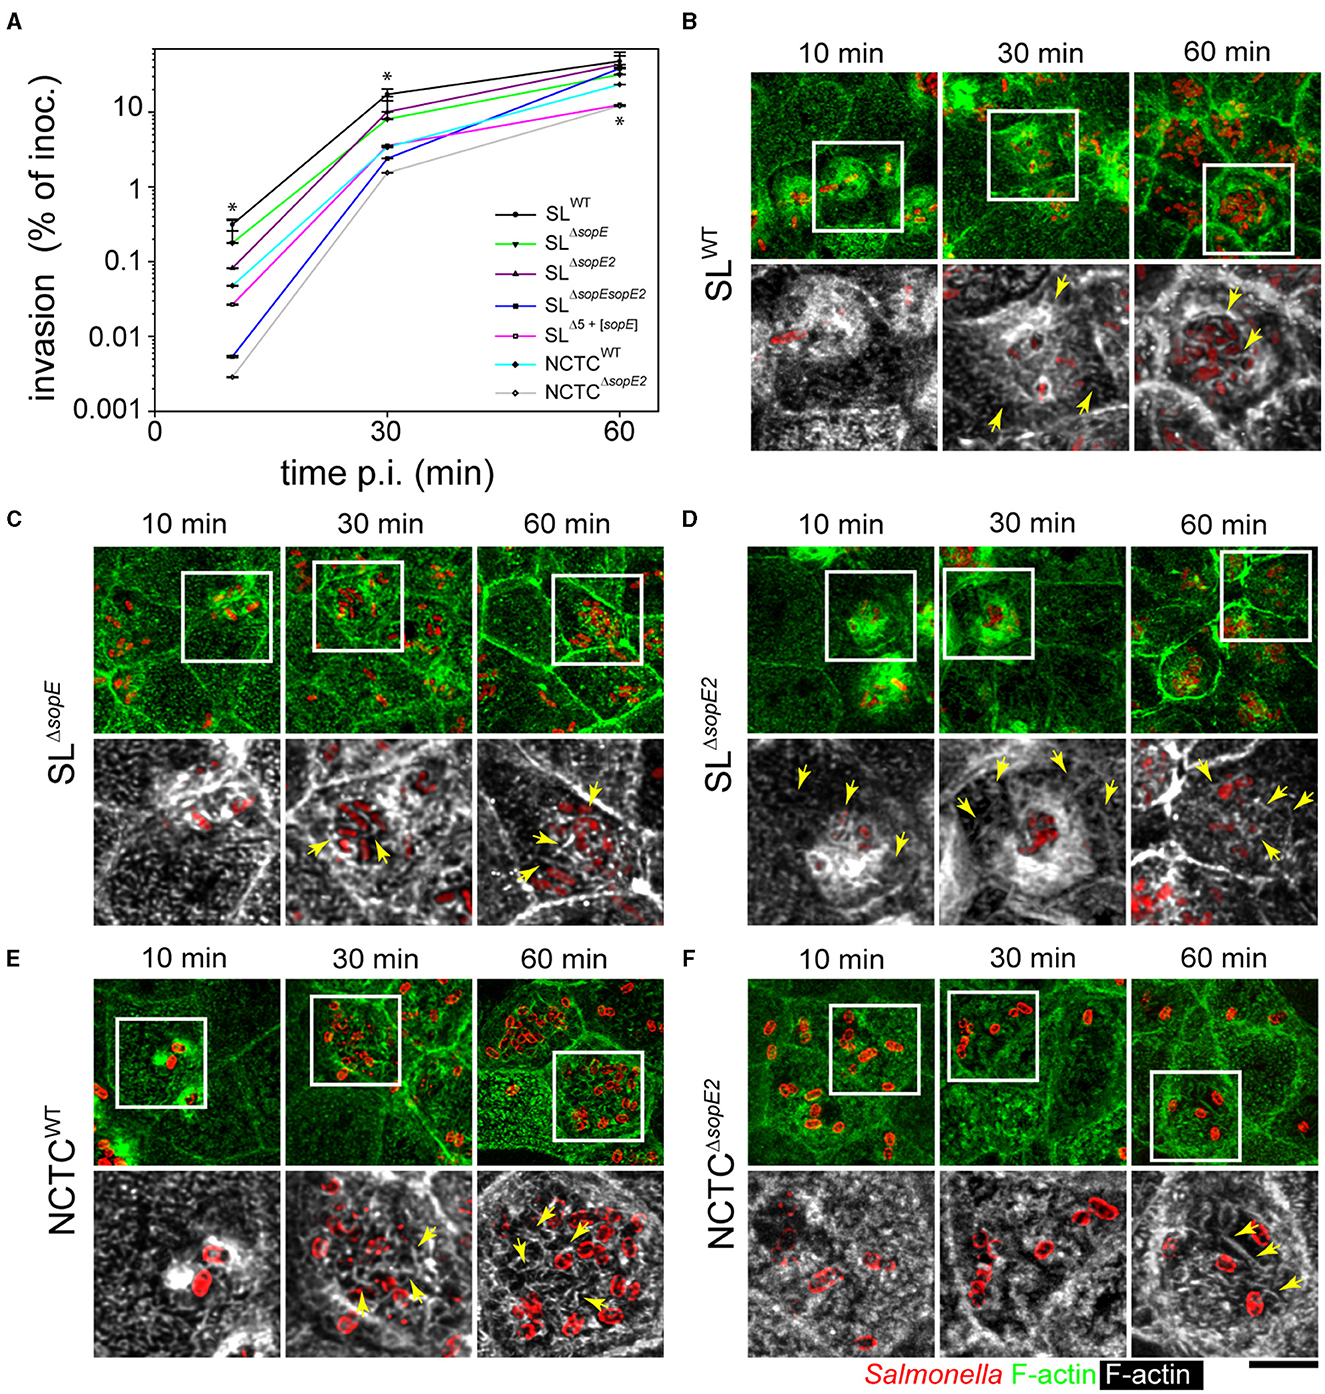
Figure 1. Effector proteins SopE and SopE2 are required for the manipulation of apical F-actin of PEC by STM. (A) Polarized MDCK monolayers were infected with STM WT and various mutant strains lacking sopE or sopE for 10, 30, or 60 min as indicated. After washing, non-internalized bacteria were killed by incubation with a medium containing 100 μg × ml−1 gentamicin for 1 h. Cells were lysed and internalized STM was quantified by plating serial dilutions of lysates for CFU determination. Invasion is expressed as the percentage of internalized bacteria of the inoculum applied. One-way ANOVA was applied for statistical analysis, and the results are indicated as; *p < 0.05. (B–F) STM infection leads to MV effacement and formation of microcolonies at the apical side of PEC. MDCK cells were infected with STM wild-type (WT) or mutant strains expressing mTagRFP (B–D) as fluorescently labeled, or WT and mutant strains immuno-stained with O-antigen of LPS (E, F). Samples were fixed at 10, 30, or 60 min p.i., labeled with Phalloidin-Alexa488 (green in overview, white in details), and analyzed by confocal laser-scanning microscopy (CLSM). STM SL strains harbored pFPV-mCherry (red) for detection in (B–D), while STM NCTC strains were immunolabeled for O-antigen (red) in (E, F). Micrographs show accumulation of STM and alteration of F-actin at various time points p.i. Yellow arrows indicate RA along the apical side of MDCK cells and adjacent to STM cells. Scale bar, 10 μm (overviews), 5 μm (details).
We previously demonstrated that MDCK and Caco-2 Bbe1 (C2BBe1) cells form homogeneous monolayers, and with such a model, epithelia infection of the apical side by STM can be analyzed. MDCK cells were infected by adding STM inoculum to the apical reservoir as described before (Hölzer and Hensel, 2012; Felipe-Lopez et al., 2023), and imaging was performed by CLSM. Micrographs of infected MDCK cells registered at the same time points demonstrated that only SL1344 background strains harboring SopE triggered membrane ruffling and MV effacement at 10 min p.i. (Figures 1B, D). Additionally, while MDCK cells infected for 30 min with STM SLWT or SLΔsopE2showed RA distributed on the apical side of PEC (Figures 1B, D), STM SLΔsopEdid not induce large ruffles and bacteria accumulated at the apical side of the cell in microcolonies (Figure 1C). Cells infected by STM SLΔsopEshowed RA only adjacent to bacteria but not extending further on the apical side (Figure 1B vs. Figure 1C). At 60 min p.i., RA was present only in cells highly infected by any of the strains tested (Figures 1B–D). In contrast to strains with SL1344 background, STM NCTCWT only induced moderate membrane ruffling at 10 min p.i. (Figure 1E). STM NCTCΔsopE2 triggered a low accumulation of actin around the bacterial cells, but it was not accompanied by membrane extensions (Figure 1F). At 30 min p.i., STM NCTCWT accumulated in microcolonies at the apical side of cells, similar to STM SLΔsopE(Figure 1C vs. Figure 1E), and RA surrounded the bacteria, which was not evenly distributed on the cell, compared to SLWT strain (Figure 1B vs. Figure 1E). MDCK cells infected by STM NCTCΔsopE2only showed small changes in the actin cytoskeleton (Figure 1F) associated with four to six bacteria, but no bacterial microcolonies were observed for this strain. At 60 min p.i., the STM NCTCWT strain caused a complete loss of the brush border architecture (Figure 1E). Bacteria were grouped in microcolonies, and RA was tightly associated with bacterial cells. Only slight reorganization of the actin cytoskeleton was appreciable in cells infected by NCTCΔsopE2, but on cells infected by this strain, microcolonies were absent, and only short filaments of actin were observed around invading bacteria (Figure 1F). RA was evenly distributed at the apical side of host cells infected by STM SLWT at early time points (10 min p.i., Figure 1B), whereas in cells infected by STM NCTCWT, RA was tightly associated with invading bacteria and only fully visible at 60 min p.i. (Figure 1E).
We sought to further characterize the effects of SopE on PEC physiology and deployed the human colonic epithelial cell line C2BBe1. Polarization of these cells leads to epithelial layers with high transepithelial electrical resistance (TEER), and pathogenic manipulation of PEC decreases TEER. The TEER of C2BBe1 polarized monolayers was monitored during infection by STM (Figures 2A, B). As previously reported (Felipe-Lopez et al., 2023), deletion of only sopE had no effect on the destruction of the epithelial barrier. On the contrary, deletion of both sopE and sopE2 in SL1344 partially ablated the epithelial damage since at 40 min p.i., the TEER dropped to ca. 70% of the value prior to infection and remained low. Only after 120 min p.i. was a further slight decay observed. Infection by STM SLΔ5+[sopE] caused decay of TEER similar to that observed in infection by STM SLWT (Figure 2A).
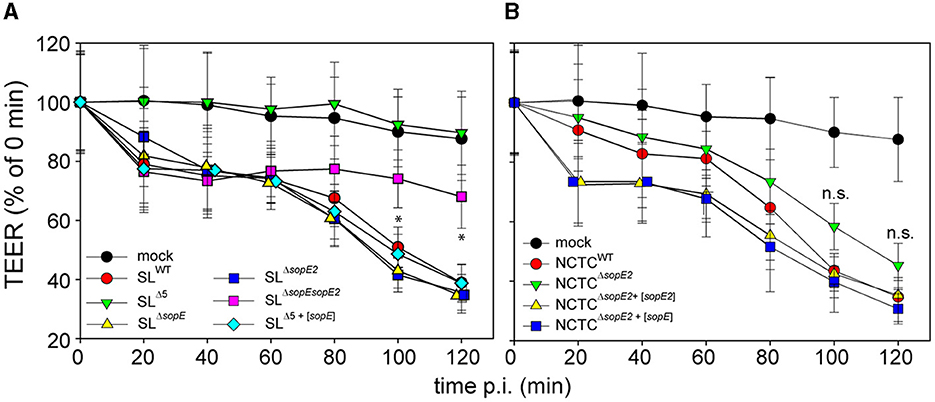
Figure 2. Effector proteins SopE and SopE2 are key factors for the disruption of the epithelial barrier function of PEC by STM. C2BBe1 cells were seeded on transwell inserts with polycarbonate filters of 0.4 μm pore size and cultured for 10–15 d to allow the formation of polarized monolayers. Polarization is indicated by the increase of transepithelial electrical resistance (TEER) to 500–700 Ω per well. Polarized monolayers were infected at MOI 25 with STM WT or various mutant strains lacking sopE, sopE2, or sipA sopA sopB sopE sopE2 (strain Δ5), without or with plasmids harboring sopE or sopE2. Infections were performed with isogenic STM strains in strain background SL1344 (A) or NCTC12023 (B). The TEER was scored over a period of 2 h p.i. The TEER is expressed as the percentage of TEER of respective transwells determined immediately prior to infection. Means and standard deviations are shown for TEER quantifications. All experiments were repeated at least three times with two technical replicates. One-way ANOVA was applied for statistical analysis, and the results are indicated as not significant (n.s.); *p < 0.05.
The TEER of cells infected by NCTCWT dropped slower than that of cells infected by STM SLWT (Figure 2B). At 60 min p.i., STM NCTCWT infection decreased TEER to 85% of TEER prior to infection, while the TEER of SLWT-infected cells decreased to 75% already 20 min p.i. TEER decay of cells infected by STM NCTCΔsopE2 was slower than for cells infected by NCTCWT (Figure 2A vs. Figure 2B) and decayed in a rather linear manner (Figure 2A). Since the effects observed were associated with effector proteins SopE or SopE2, NCTCΔsopE2 was complemented with sopE from SL1344. This strain caused the rapid decay of TEER identical to the phenotype induced by infection with STM SLWT (Figure 2B).
These data indicate that Salmonella's alteration of the epithelial barrier function is primarily dependent on either single translocation of SopE (see SLΔ5+[sopE]) or the translocation of a group of effector proteins controlling F-actin such as SipA, SopE2 and, to a lesser extent, SopB, when SopE is absent.
Our observations from fixed time points suggested that SopE not only enhanced invasiveness but also strongly influenced actin reorganization after the full engulfment of STM and the events after the invasion. The RA already appeared after 10 min in cells infected by STM SLWT but was delayed to 60 min p.i. in infections by STM SLΔsopE or STM NCTCWT. To investigate the formation of RA by apparently distinct mechanisms, the infection of MDCK LifeAct-eGFP cells by various STM strains was followed by live-cell imaging (LCI). The infection of STM SLWT triggered ruffle formation within 8 min after initial apical adhesion (Figure 3; Supplementary Movie 1), as previously reported (Felipe-Lopez et al., 2023). After full engulfment of STM SLWT and ruffle retraction, thin filaments of actin appeared surrounding the invasion locus on the apical side. These filaments gradually increased over the next 10 min from the periphery to the invasion locus, forming a reticular F-actin structure (Figure 3, SLWT, Supplementary Movie 1). In contrast, STM SLΔsopEinduced only small ruffles, and changes in brush border architecture were not detected when a single bacterium invaded (Figure 3, SLΔsopE). However, when the same cell was subsequently invaded by further bacteria, the brush border was lost, and RA appeared between the invading bacteria (yellow arrows). F-actin filaments only emerged close to the invasion foci but not from the periphery, as observed for STM SLWT (Figure 3). Further invasion events increased the formation of RA, which was inter-connected to the previous invasive bacteria. STM SLΔsopE2 showed similar behavior as STM SLWT (data not shown).
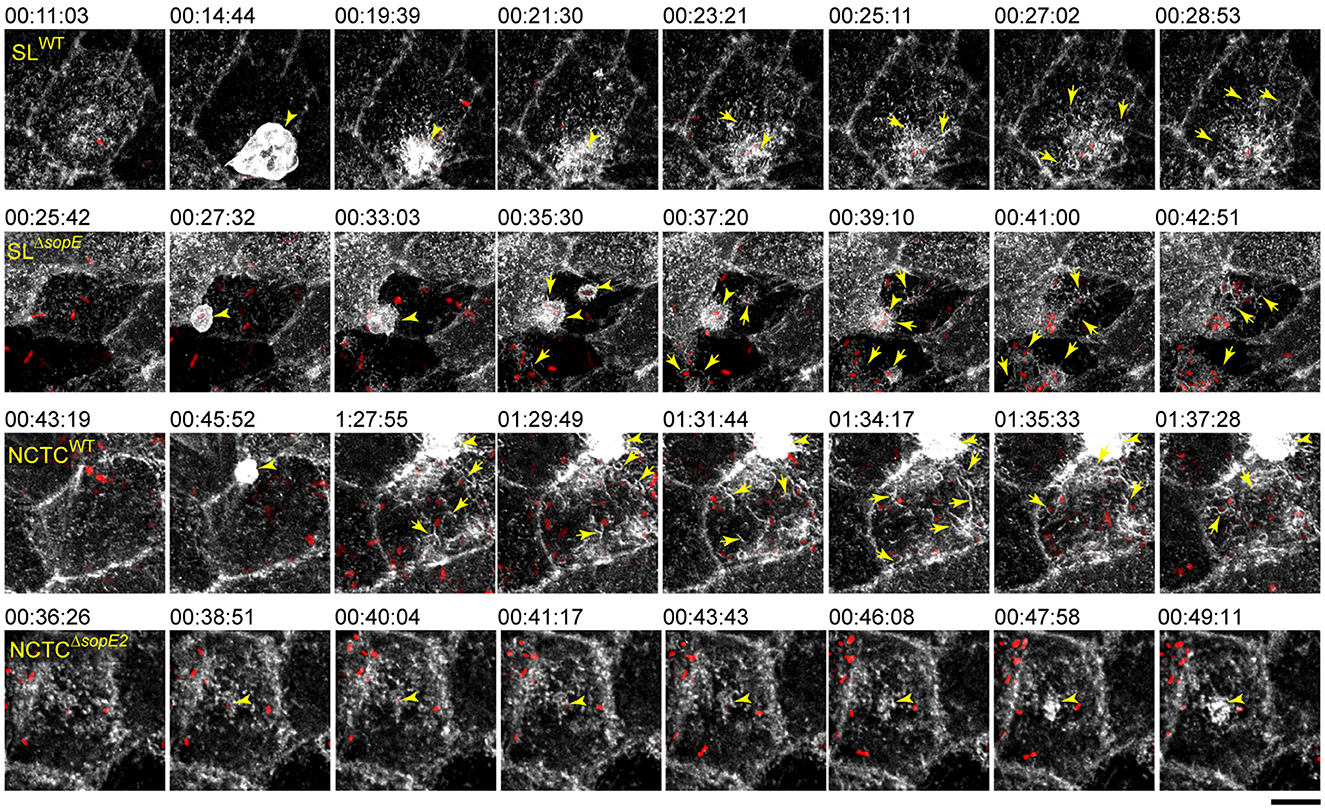
Figure 3. Brush border architecture is destroyed by bacterial cells clustering on the apical side of PEC and substituted with RA. MDCK cells expressing Lifeact-eGFP were grown in fluoro dishes for 5 d. Lifeact-eGFP labels F-actin filaments in living cells, which are shown in white. PEC were infected with various STM strains as indicated, and image acquisition by SD with maximal acquisition speed (2–3 frames per min) was started immediately after infection for 120 min of acquisition. Maximum intensity projection (MIP) images show the dynamics of STM accumulation at the apical side of MDCK cells, MV effacement, and formation of RA. Arrowheads indicate F-actin accumulation in membrane ruffles induced by STM. Arrows indicate the formation of RA. Scale bar, 15 μm. Timestamp, h:min:sec. See Supplementary Movie 1 for the time-lapse series.
STM NCTCWT induced RA similar to STM SLΔsopE (Figure 3, NCTCWT yellow arrows), but this phenotype was delayed. After the first invasion event, other bacteria induced the formation of RA and brush border effacement. These bacteria were surrounded by intense actin signals. Actin filaments were distributed mainly at the periphery and around invading STM. The deletion of sopE2 in STM NCTC altered the ability of Salmonella to induce RA (Figure 3, NCTCΔsopE2). Cells infected by this strain also formed small clusters and showed further brush border destruction; however, there was no induction of RA even after several bacteria had invaded. Only short and very thin F-actin filaments were locally associated with bacteria.
These results demonstrate that while SopE was sufficient to cause MV effacement and formation of RA by one single bacterial cell, for strains lacking SopE infection over long time periods, the accumulation of multiple bacteria at the apical side was necessary to cause similar alterations to the host cell. Strains lacking both sopE and sopE2 were unable to induce the formation of RA, and we conclude that RA is dependent on SopE and/or SopE2.
Our data demonstrate that RA only appeared shortly after the engulfment of sopE-harboring STM or after the accumulation of multiple sopE-deficient STM. Therefore, we tested if invasion only controls the formation of RA and loss of the brush border or if intracellular Salmonella also interferes with the regeneration of the brush border and the disappearance of RA. MDCK cells were infected by various strains lacking SopE or SopE2 in either strain background for 30 min. Infected cells were then washed and treated with gentamicin for 1 h or only rigorously washed and further incubated for 1 h w/o gentamicin addition. Micrographs generated by AFM (Figure 4A) or CLSM (Figure 4B) show that even after gentamicin treatment to kill non-internalized STM, RA was still present in cells infected by STM SLWT and, to a lesser extent, STM NCTCWT. Cells infected by STM NCTCΔsopE2 or STM SLΔsopE showed a slight recovery of brush border after gentamicin treatment (Figures 4A, B). Additionally, F-actin structures were concentrated in clusters of intracellular bacteria (Figure 4B). Cells infected by sopE-deficient strains also showed recovery of MV. Interestingly, cells infected by SLΔsopE without gentamicin treatment still possessed RA, and as observed for STM SLWT, bacteria were surrounded by actin. Altogether, these results show that STM continues to alter the brush border architecture after internalization.
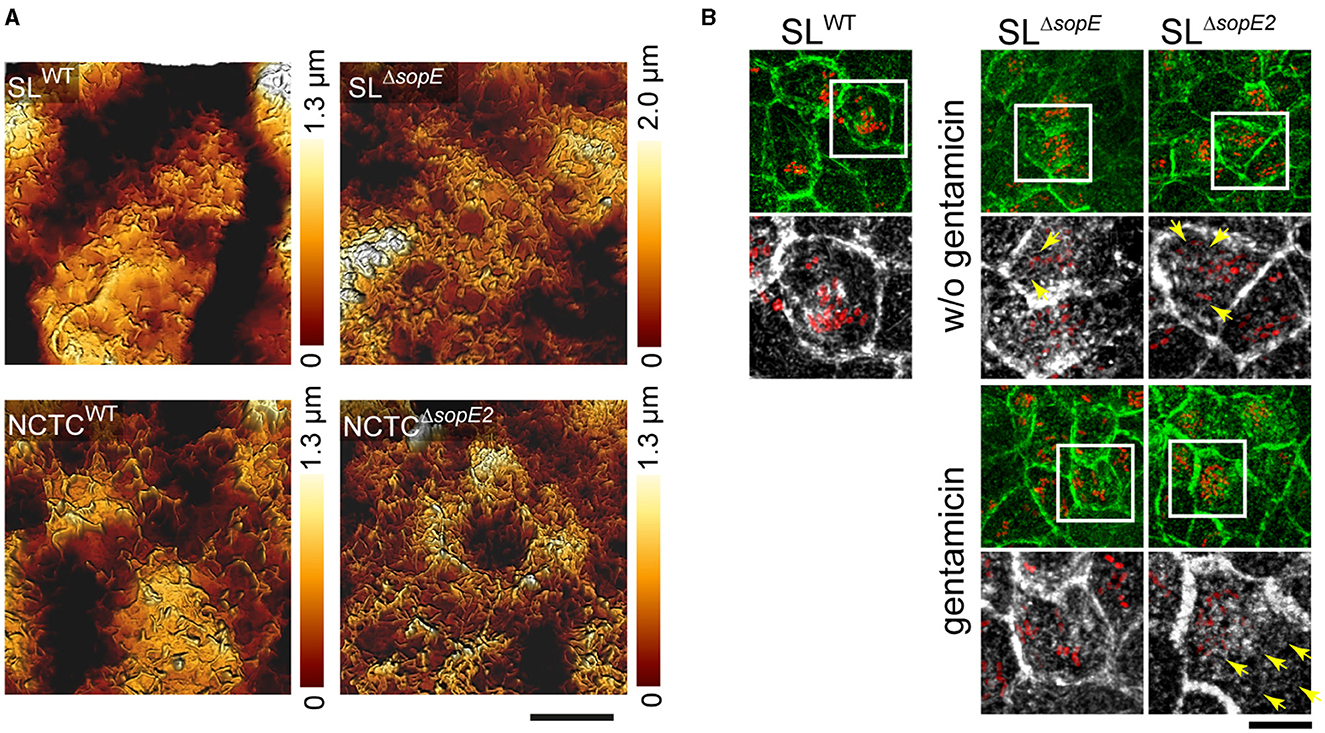
Figure 4. Brush border architecture is not restored in PEC infected by STM strains harboring sopE. Polarized MDCK cells expressing Lifeact-eGFP were grown as in Figure 3 and were infected with Salmonella WT for 25 min. F-actin is shown in green. Non-internalized STM were removed by washing, and cells were incubated for 1 h in media without gentamicin or in a medium containing 100 μg × ml−1 gentamicin to kill the remaining extracellular bacteria. Cells were fixed and stained as indicated in Figure 1 and observed by CLSM. (A) 3D topology micrographs show the degeneration of the apical side of MDCK cells after internalization of Salmonella (cells only treated with gentamicin). (B) Formation of RA is induced by SopE. Extracellular STM were removed by washing, and cells were incubated with or without the addition of gentamicin for 1 h. Only cells infected by SL1344ΔsopE but not treated with gentamicin showed RA. Yellow arrows indicate the formation of RA after internalization of STM at various time points of infection. Scale bars, (A) 5 μm, (B) 20 μm, and 10 μm for overview and detail, respectively.
Our results indicate that SopE and SopE2 induce the formation of RA after brush border effacement. Such gross alteration of the F-actin cytoskeleton might change the physiological properties of the brush border. To address this point, we determined the effect of STM invasion on the roughness of the apical side using AFM (Antonio et al., 2012). Compared to non-infected controls, peaks of roughness probability were shifted to lower roughness in STM-infected cells, in line with the observed loss of brush border (Figure 5). The roughness of the apical side of host cells infected by SLWT was highly reduced compared to non-infected cells (Figures 5C, D). The maximal peak observed in SLWT-infected cells was 10 nm less rough than that quantified in non-infected cells (23 vs. 30 nm; Figure 5D). Similarly, STM NCTCWT-infected cells showed, on average, a reduced surface roughness compared to non-infected cells (24 vs. 33 nm). However, in contrast to SLWT-infected cells, NCTCWT-infected cells showed a larger distribution of roughness probabilities. Cells infected by STM SLΔsopE or NCTCΔsopE2 showed no reduced roughness but rather values close to the maximal roughness of non-infected cells (28 vs. 30 nm). Cells infected by STM NCTCWT showed, on average, a reduced surface roughness compared to the non-infected cells (24 vs. 30 nm). However, in contrast to SLWT-infected cells, NCTCWT-infected cells showed a larger distribution of roughness probabilities.
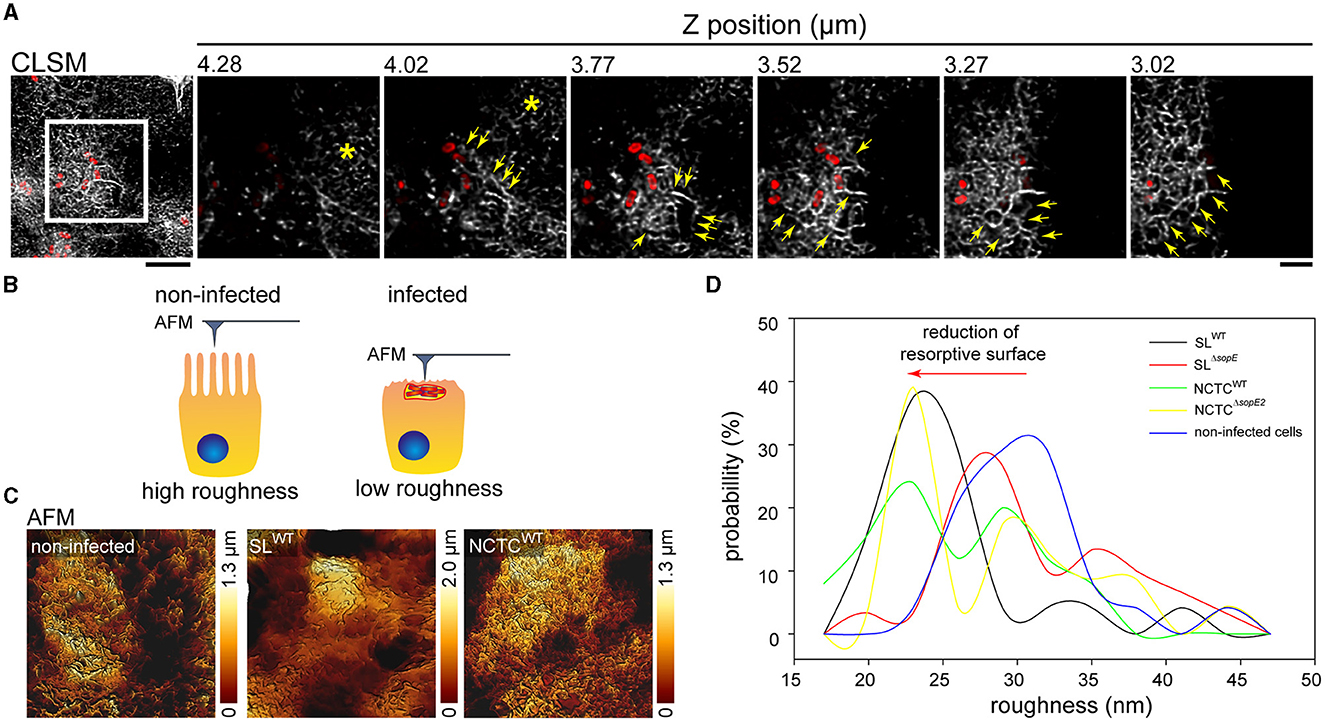
Figure 5. Destruction of the brush border by Salmonella invasion reduces the apical surface. (A) MDCK cells were infected with STM SLWT (red), and F-actin was labeled (gray). Representative CLSM image of a group of cells infected by STM (overview). Detailed images from distinct planes along the Z-axes show the organization of RA at the apical side of STM-infected cells (yellow arrows) and the remaining intact MV (asterisk). Scale bar, 10 μm (overview) and 5 μm (detail). (B) Model of the roughness measurement by AFM. When cells possess MV on the apical surface, the roughness and deepness are higher than those of cells infected by STM, showing MV effacement with a flatter surface and reduced deepness. (C) AFM images of the 3D topology of infected cells without the brush border. Cells were prepared as indicated in Figure 1 for AFM scanning and CLSM. (D) Roughness of at least 25 cells was determined by Young's module and presented as the probability of the roughest area in the cell.
These measurements demonstrate that STM infections fully remodel the apical architecture of PEC, depending on SopE. The reorganization of cells after infection with NCTC background strains naturally lacking SopE was rather moderate, and infected cells also showed high roughness similar to non-infected cells. Based on our LCI results, these cells still contained MV on the apical surface under the experimental conditions applied.
The loss of the absorptive surface of PEC, accompanied by the formation of RA, suggests that actin polymerization at the apical side may also be affected. To quantify the turnover of actin from RA, fluorescence recovery after photobleaching (FRAP) was applied to infected cells showing RA. Data were adjusted to the model proposed by Ishikawa-Ankerhold et al. (2012). After a pulse of 500 ms for photobleaching, RA was recovered (Figures 6A, B) in cells infected by STM SLWT, indicating that RA formation by F-actin polymerization continued even when STM was intracellular (Figures 6A, B). Further quantification of the signal recovery revealed that actin polymerization at the apical side of host cells was increased after infection by STM SLWT or NCTCWT (Figure 6C). The cells infected by either SLΔsopE or NCTCΔsopE2 did not cause any significant reduction of the actin polymerization rate (Figure 6C). Data from this experimental setup confirmed that actin polymerization was altered by STM infection, even when bacteria were located intracellularly, and this exclusively depended on SopE by SLWT and SopE2 in NCTCWT. Furthermore, actin remodeling occurring during STM internalization may not be sufficient to alter the physiological functions of PEC.
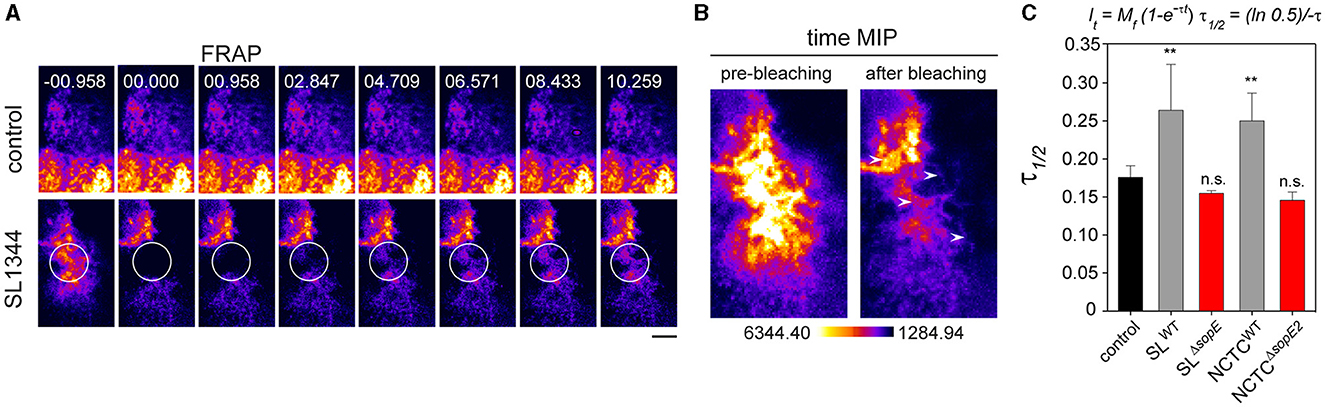
Figure 6. Salmonella invasion alters the polymerization of F-actin at the host cell's apical side. PEC were infected at MOI 25 for 25 min and then washed five times with pre-warmed MEM without phenol-red to remove extracellular bacteria. Infected cells in chamber slides were observed by SD microscopy. Areas indicated by circles were photobleached using a laser line 488 nm at 100% transmission for 100 ms. (A) Representative images of fluorescence recovery of F-actin after photo-bleaching (FRAP) of STM-infected cells are shown. Non-infected cells without photobleaching served as control. (B) Time maximal intensity projections (MIP) of a representative bleached region before and after bleaching. (C) The recovery constant (τ) is strongly reduced in cells infected by STM compared to control. Means and standard deviations of at least 25 cells per condition are shown. Quantification and mathematical adjustment were performed as described (Ishikawa-Ankerhold et al., 2012). Scale bar, 2.5 μm. One-way ANOVA was applied for statistical analysis, and results are indicated as not significant (n.s.); **p < 0.01.
Epithelia of the intestine, kidney, and other organs are responsible for the uptake of nutrients and ions. The loss of the brush border architecture abrogates this function. Given that RA is still present even after the complete invasion of STM, we investigated if replacing MV with RA alters the apical resorption of MDCK cells. At 1.5 h p.i., gentamicin-treated cells were pulsed for 30 min with FM4-64 FX to label plasma membrane or with fluid tracer dextran-10,000 Alexa568 to follow endocytic uptake. Cells infected by SLWT internalized less dextran than non-infected cells (Figure 7A). Internalized dextran in cells infected by STM SLWT appeared as small accumulations at the apical side of cells and close to clusters of intracellular bacteria. However, no colocalization was observed between STM and the fluorescent tracer (Figure 7A, detail), indicating that the internalized material was not entering the SCV at this time point of infection. Compared to SLWT-infected cells, non-infected cells contained a large number of small-sized vesicles homogenously distributed in the apical region of the cell (Figure 7A). Most of these dextran-positive vesicles colocalized with F-actin, and some were localized at the apical membrane of the cell, indicating recent uptake (Figure 7A, Z sections). Such recruitment of actin was not visible in infected cells. Infection by STM SLΔsopE resulted in increased dextran uptake compared to non-infected cells. Infection by NCTCWT or NCTCΔsopE2 did not significantly alter the uptake of dextran, and infected cells presented almost the same number of dextran spots over the inspected area, and uptake was similar to that observed in non-infected cells (mock) (Figure 7B).
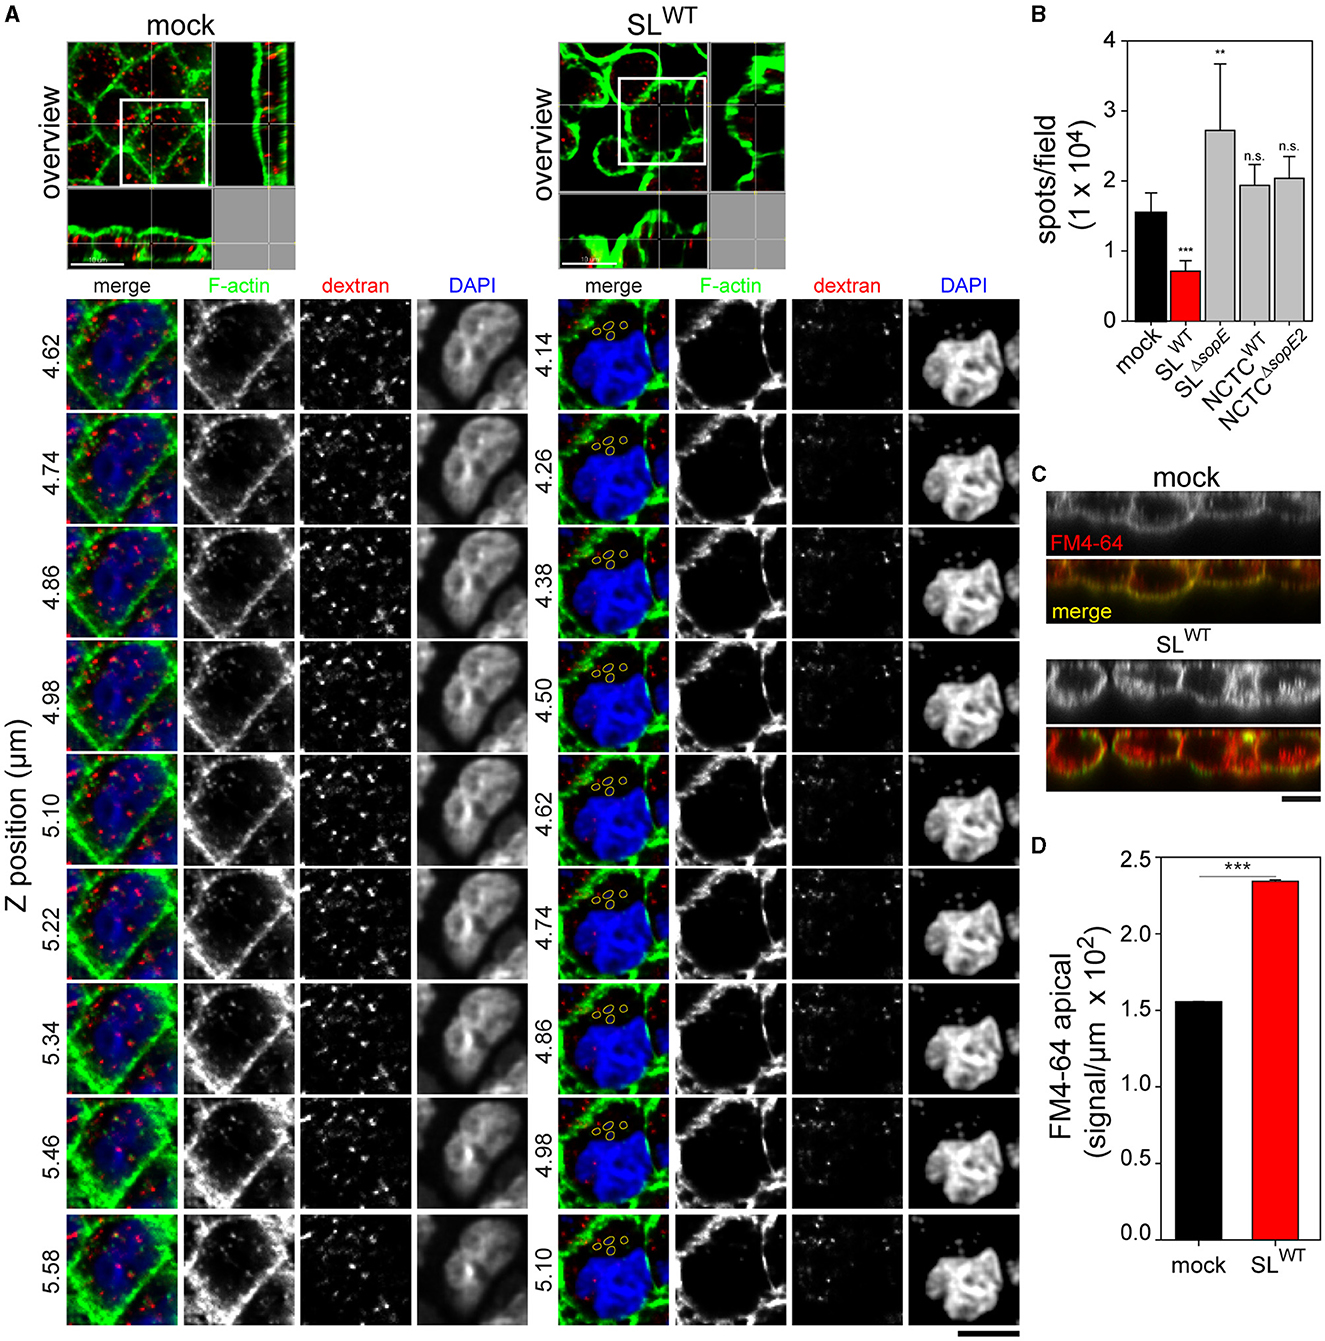
Figure 7. Destruction of the brush border by Salmonella disrupts the physiologic uptake of the apical side of polarized epithelial cells. PEC were infected, as described in Figure 1. After gentamicin treatment, cells were pulsed with Alexa568-labeled dextran (red) or membrane dye FM4-64FX (red) for 30 min. Cells were further processed as described in Figure 1; actin was labeled by phalloidin (green), and nuclear and bacterial DNA were stained by DAPI (blue). (A) Representative orthogonal images show mock-infected cells or cells infected by STM SLWT cells pulsed with dextran Alexa568. Images show lateral views or the Z-axes of the cells containing dextran along the cell body. Various Z positions are shown. In infected cells, intracellular STM stained by DAPI are outlined yellow. Scale bars, 10 μm. (B) Effect of STM infection on endocytosis of dextran Alexa568. Infection of MDCK cells with various STM strains as indicated or mock infection and dextran Alexa568 pulse were performed as above. The numbers of dextran spots were quantified by Imaris as described in Materials and methods section. (C) Representative Z projections of cells labeled with membrane stain FM4-64 (red). Cells were mock-infected or infected by STM SLWT, and actin (green) was labeled as above. Scale bars, 10 μm. (D) Quantification of FM4-64 signal intensities in the apical area of mock-infected or STM SLWT-infected MDCK cells. Scale bars, 10 μm. One-way ANOVA was applied for statistical analysis, and the results are not significant (n.s.); **p < 0.01; ***p < 0.001.
In contrast to the reduced dextran internalization, FM4-64 was highly endocytosed in cells infected by STM SLWT compared to non-infected cells (Figures 7C, D). Non-infected cells showed homogenous cytoplasmic membrane labeling by FM4-64 on the apical side (Figure 7C), while in infected cells, FM4-64 signals appeared below the apical membrane and separated from apical F-actin. The FM4-64 signals from infected and mock-infected cells were quantified, indicating that higher levels of intracellular dye in STM SLWT-infected cells were higher than measured for mock-infected cells (Figure 7D).
These results demonstrate that after internalization of STM and apparition of RA, PEC loses the ability to resorb material from the luminal space. This effect is mediated by the translocation of SopE, but not SopE2, since cells infected by strains lacking sopE2 could resorb apical markers, as shown in Figure 7C. Therefore, SopE dominantly affects the physiological resorption of host cells, likely due to its specific effect on Rac1 (Friebel et al., 2001). Although other strains expressing only SopE2, which acts on Cdc42, could efface MV and induce RA, they failed to abrogate this cellular function in the PEC infection model.
Our results demonstrate that only cells highly infected by strains lacking SopE exhibited RA, which diminished after gentamicin treatment. Furthermore, the quantification of the actin polymerization rate was only altered in those cells infected by SLWT or NCTCWT strains. The apical endocytosis of infected cells was altered by the translocation of SopE but not SopE2. These observations indicate that there may be further SPI1-T3SS effector protein functions necessary to cause actin rearrangements in the absence of SopE and SopE2 but are unable to alter apical endocytosis. Our previous work has already demonstrated that SipA can induce actin polymerization by STM strains lacking SopE and SopE2 (Schlumberger and Hardt, 2005; Schlumberger et al., 2007; Felipe-Lopez et al., 2023). Therefore, we used the same reductionist approach to test if SipA induces the formation of RA. We infected cells for 15 or 45 min with STM SLΔ5+[sipA] or SLΔ5+[sopE], and both effector proteins and F-actin were stained (Figures 8A, B). Micrographs acquired by total internal reflection microscopy (TIRF) indicated that effector proteins were localized in the F-actin-rich apical area of PEC and at 45 min p.i. sufficient amounts of effector protein accumulated to compare the distribution. While SopE was decorating RA structures at larger areas of the apical side of cells (Figure 8B), SipA was highly concentrated in small regions with F-actin (Figure 8A). The distinct distribution was in line with the observed membrane association of SipA close to the SPI1-T3SS translocon and the cytosolic distribution of SopE. The apparent reticular structure was associated with the bacteria residing (not visible) on the apical side of host cells, which continuously translocate SipA, as observed in Figure 8A (detail, 45 min).
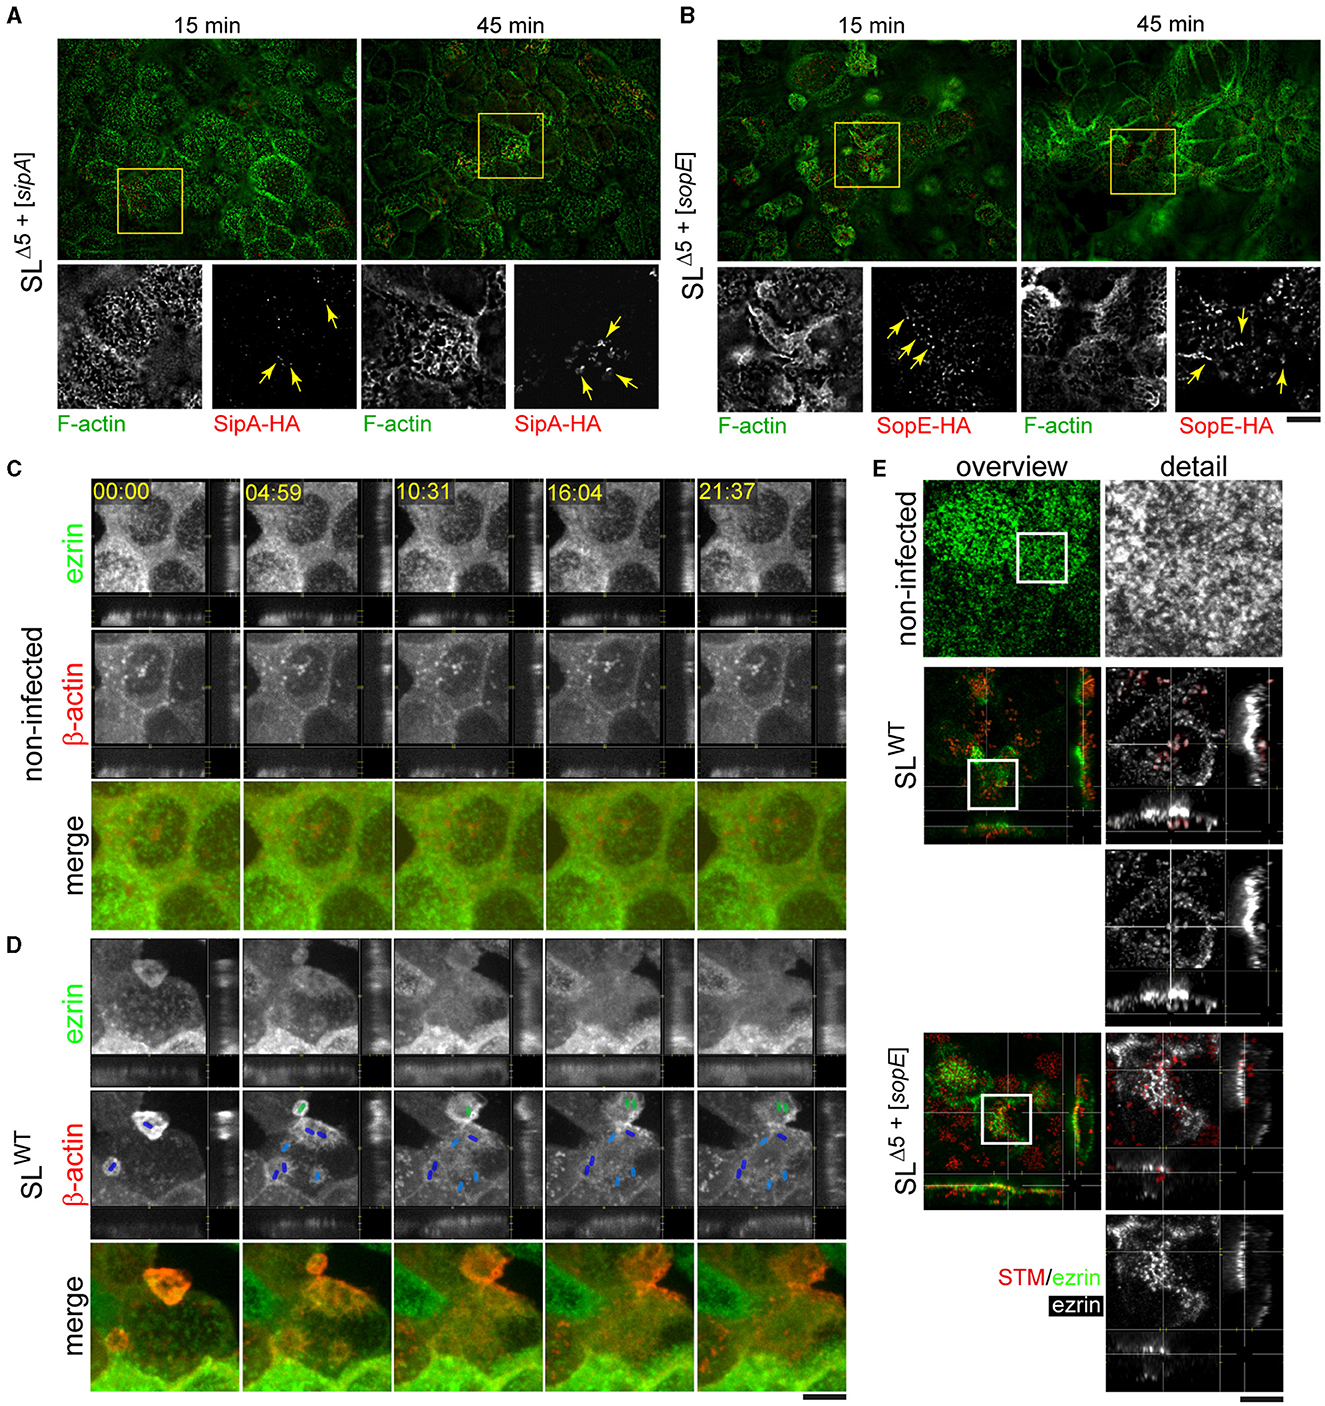
Figure 8. STM induces RA by translocation of SopE and SipA and recruits ezrin to the nascent SCV. PEC were infected with STM SLΔ5+[sipA::HA] or SLΔ5+[sopE::HA] (red) as described in Figure 1B for 15 or 45 min. After fixation and permeabilization, immunostaining for translocated effector proteins with anti-HA antibody (red) was performed, and F-actin was labeled with phalloidin (green) (A, B). Alternatively, infected cells were immunolabeled with anti-ezrin antibody (green), and F-actin was stained by phalloidin (red) (C, D). (A) Formation of RA is triggered by SipA only independent of SopE. SipA reorganizes the actin cytoskeleton into RA structures. (B) The formation of RA is triggered by SopE only independently of SipA. Both effector proteins strongly localize at the actin filaments at 45 min p.i. Yellow arrows indicated effector proteins SipA (A) or SopE (B) in the apical portion of MDCK cells. (C, D) Ezrin is delocalized after engulfment of STM. MDCK cells transfected with ezrin-eGFP and β-actin-RFP were infected with STM SLWT (not visible, positions indicated by colored rod symbols: dark blue, initial invading STM; light blue, subsequent invading STM; green, STM invading another host cell). See corresponding Supplementary Movie 2 for the time-lapse sequence. (E) STM recruits ezrin for the early SCV after the invasion of PEC. MDCK cells were infected with STM SLWT or SLΔ5+[sopE]. Images are representative of at least three independent experiments. Scale bars, 15 μm and 5 μm (A, B) for overview and detail, respectively; 5 μm (C); 20 and 10 μm (D) for overview and detail, respectively. Timestamp, min:sec.
Because STM induces massive brush border effacement and diminishes the apical resorption of fluid tracers, we considered that microvillar proteins might be lost after complete MV effacement, which would explain the origin of RA and reduced endocytic uptake. Therefore, we followed the spatial distribution of ezrin after MV effacement. MDCK cells transfected for the expression of ezrin-GFP and β-actin-RFP were infected by STM SLWT (Figure 8C; Supplementary Movie 2) since we observed the most severe phenotypes with this strain. Ezrin clearly localized in MV in non-infected cells or in cells prior to infection. After STM triggered ruffle formation and MV effacement was initiated, ezrin was lost from the MV and recruited to ruffles. However, once STM was completely engulfed, cells did not recover ezrin at the apical membrane. Instead, the signal of ezrin mainly remained in the cytoplasm at the apical side, as images from lateral projections from LCI sequences indicate (Figure 8D). In contrast, non-infected cells showed no changes in the localization of ezrin over the acquisition period (Figure 8C). These results may indicate the recruitment of ezrin to nascent SCV after complete engulfment. To address this hypothesis, MDCK cells were infected for 45 min and stained with antibodies against ezrin. Most ezrin signals were concentrated at nascent SCV harboring STM SLWT (Figure 8E), compared to non-infected cells, which maintained the ezrin at the apical side of the cell. To evaluate whether the recruitment of ezrin is caused by SopE, we used STM SLΔ5+[sopE], only translocating SopE, but able to invade PEC and to remodel their actin cytoskeleton (Felipe-Lopez et al., 2023). In cells infected by STM SLΔ5+[sopE], ezrin was delocalized from the apical membrane as observed in STM SLWT-infected cells; however, no prominent association with nascent SCV was observed (Figure 8E).
These data demonstrate that SopE mainly controls actin remodeling after complete engulfment by STM. Although SopE-deficient strains could cause MV effacement and induce RA by translocating SipA, these morphological changes were not sufficient to alter the physiological resorption by PEC or to modify actin polymerization to the extent observed in SopE by a single bacterium. The delocalization of ezrin caused by SopE-induced actin rearrangements is an example of the loss of microvillar proteins during the invasion of STM, which might indirectly lead to reduced resorption by PEC.
The effacement of MV occurs during infection by various enteric pathogens such as EPEC, Helicobacter pylori, or Citrobacter rodentium. In contrast to the local destruction of MV by these pathogens, STM invasion causes the complete collapse of MV in PEC, such as enterocytes (Takeuchi, 1967). We previously described that the sole translocation of SopE into host cells caused MV effacement, induced the formation of RA, and mainly mediated the invasion of PEC (Felipe-Lopez et al., 2023). In this study, we additionally found that SopE is a key factor for disturbing resorption by PEC. Yet, strains lacking SopE were still able to efface MV by the accumulation of bacterial cells on the apical side of PEC over prolonged periods of infection. In both cases, the internalization of STM culminated in the appearance of RA on the apical side of PEC. RA remained even after the complete internalization of STM SLWT or NCTCWT, but disappeared in cells infected by STM SLΔsopE or NCTCΔsopE2, permitting host cells to partially recover MV after complete STM internalization. Although SopE-deficient strains also efface MV and create RA, their infected cells are still able to endocytose dextran.
Our data demonstrate that reduced invasion due to the absence of SopE can be compensated by prolonged periods of STM exposure that increase the opportunity for multiple STM to interact with host cells and to form bacterial clusters on the PEC apical side (see Figures 1B–F). Our experimental setup is similar to that published by Lorkowski et al. (2014); thus, the accumulation of bacteria is the result of the cooperativity of STM infection, allowing other bacteria to internalize once a “starter” STM cell has triggered membrane ruffles (Misselwitz et al., 2012; Lorkowski et al., 2014). In contrast to STM SLWT, STM NCTCWT did not trigger large ruffles; instead, it formed microcolonies that concluded with the loss of brush border and formation of RA, which completely replaced the brush border architecture.
While all S. enterica strains harbor sopE2, only a subset additionally possesses sopE due to lysogenic conversion through infection by sopE phage (Mirold et al., 1999). Previous research showed that several virulence traits of STM are associated with the function of SopE, such as intestinal inflammation due to caspase-1 activation (Muller et al., 2009) and activation of NOD1 signaling (Keestra et al., 2013). By comparing intracellular phenotypes of STM strains with and without SopE, we recently demonstrated that the presence of SopE leads to increased invasion, damage of the nascent SCV, and escape of STM into host cell cytosol (Röder and Hensel, 2020). Sensing cytosolic STM by the NAIP/NLRC4 inflammasome results in the expulsion of infected PEC into the intestinal lumen (Chong et al., 2021; Fattinger et al., 2021a), and this increases shedding and the further spread of STM. The data reported here add reduced resorption by PEC as a further pathogenic consequence of the presence of SopE in STM strains. Therefore, SopE can be considered as a factor increasing the severity of STM intestinal infections.
MV effacement is caused by bacterial accumulation and RA formation, but capability in endocytosis suggests that a third effector protein is involved in the absence of SopE and SopE2. Indeed, only SipA participated in the formation of RA, as our reductionist approach revealed. We previously demonstrated that SipA, SopE, and SopE2 independently mediate ruffle formation or discrete actin polymerization, leading to the invasion of PEC (Felipe-Lopez et al., 2023). Our observations are supported by results from murine infection models (Zhang et al., 2018; Fattinger et al., 2020). STM can discretely penetrate enterocytes exclusively by the translocation of SipA in the absence of SopE, SopE2, or both SopE and SopE2. These in vivo observations support our data showing that RA appears after infection by STM strains only expressing SipA. In our model, the absence of SopE and SopE2 did not alter the endocytosis of PEC and SLΔsopE, SLΔsopEsopE2, or NCTCΔsopE2still invaded if sufficiently long interaction with host cells was allowed. Contrary to our in vitro observations, MV are not effaced in vivo by SipA-mediated invasion. These observations would suggest that SipA-mediated invasion of STM may reduce the damage to the intestinal epithelium. Nevertheless, SipA and ezrin mediate the recruitment of neutrophils (Agbor et al., 2011), and inflammation of epithelial tissue is caused by strains expressing only SipA in the ileal loop model (Zhang et al., 2002).
The formation of MV or actin networks is directly proportional to the density of proteins recruited to the apical side of the cell, including bundling, anchoring proteins, and actin (Gov, 2006). Once this group of proteins localizes at the apical side of PEC, actin polymerization and an assembly of bundles originate a protrusion force that first creates actin networks. Further, actin polymerization by treadmilling creates new MV on the apical surface (Gaeta et al., 2021). In contrast, if actin polymerization is disturbed or membrane anchoring fails, then no further bundling proteins are recruited, as we observed with infection of STM.
Hence, in our model, actin polymerization is redirected to ruffle formation by the activity of SipA, SopE, and/or SopE2; the further disorganization of ezrin and depolymerization of actin by villin (Lhocine et al., 2015; Felipe-Lopez et al., 2023) would explain that infected host cells fail to restore their brush border architecture. Instead, the apical surface remains as a reticular structure until the action of virulence proteins ceases, as we observed in those cells treated with gentamicin. Further published evidence supports this model. MV elongation and stabilization depended on the binding and capping functions of EPS8, villin, epsin, and fimbrin (Meenderink et al., 2019; Gaeta et al., 2021). Indeed, PEC of ezrin knockout mice only developed short MV, a disorganized terminal web (Saotome et al., 2004), and showed altered localization of apical transporters (Engevik and Goldenring, 2018). In mice lacking either villin, epsin, fimbrin, or a combination of these three proteins, MV were specifically reduced in amount and developed only short-length structures (Revenu et al., 2012). In yeast, fimbrin contributes to the breaching of F-actin filaments depending on the fimbrin concentration (Laporte et al., 2012). Moreover, the expression of EPS8 also regulates the length of MV in porcine kidney cell lines. Therefore, at low concentrations of fimbrin, disassociation of MV proteins such as ezrin, villin, or ESP8, actin filaments form highly ramified structures as we observed in this study, and supported by our previous work (Felipe-Lopez et al., 2023).
Based on our observations, we propose that loss of ezrin from MV during STM invasion hinders the anchoring of new F-actin filaments (Figure 9). In turn, this would avoid the formation of MV, as previously described (Gloerich et al., 2012; Solaymani-Mohammadi and Singer, 2013; Dhekne et al., 2014; Gaeta et al., 2021). Since actin polymerization required for MV formation is redirected to sites of STM invasion, other bundling proteins may not be properly recruited. Consequently, low concentrations of bundling proteins such as fimbrin (Revenu et al., 2012), ezrin (along with EPS8) (Gaeta et al., 2021), and villin (Meenderink et al., 2019; Felipe-Lopez et al., 2023) may only permit the formation of RA after the complete internalization of Salmonella (Figure 9C). The loss of ezrin from the apical side of PEC may be attributed to the degradation of phosphoinositide 4,5 bis-phosphate (PI-4,5P2) by SopE-activated phospholipase γ (PLC γ) and SopB (Terebiznik et al., 2002; Felipe-Lopez et al., 2023).
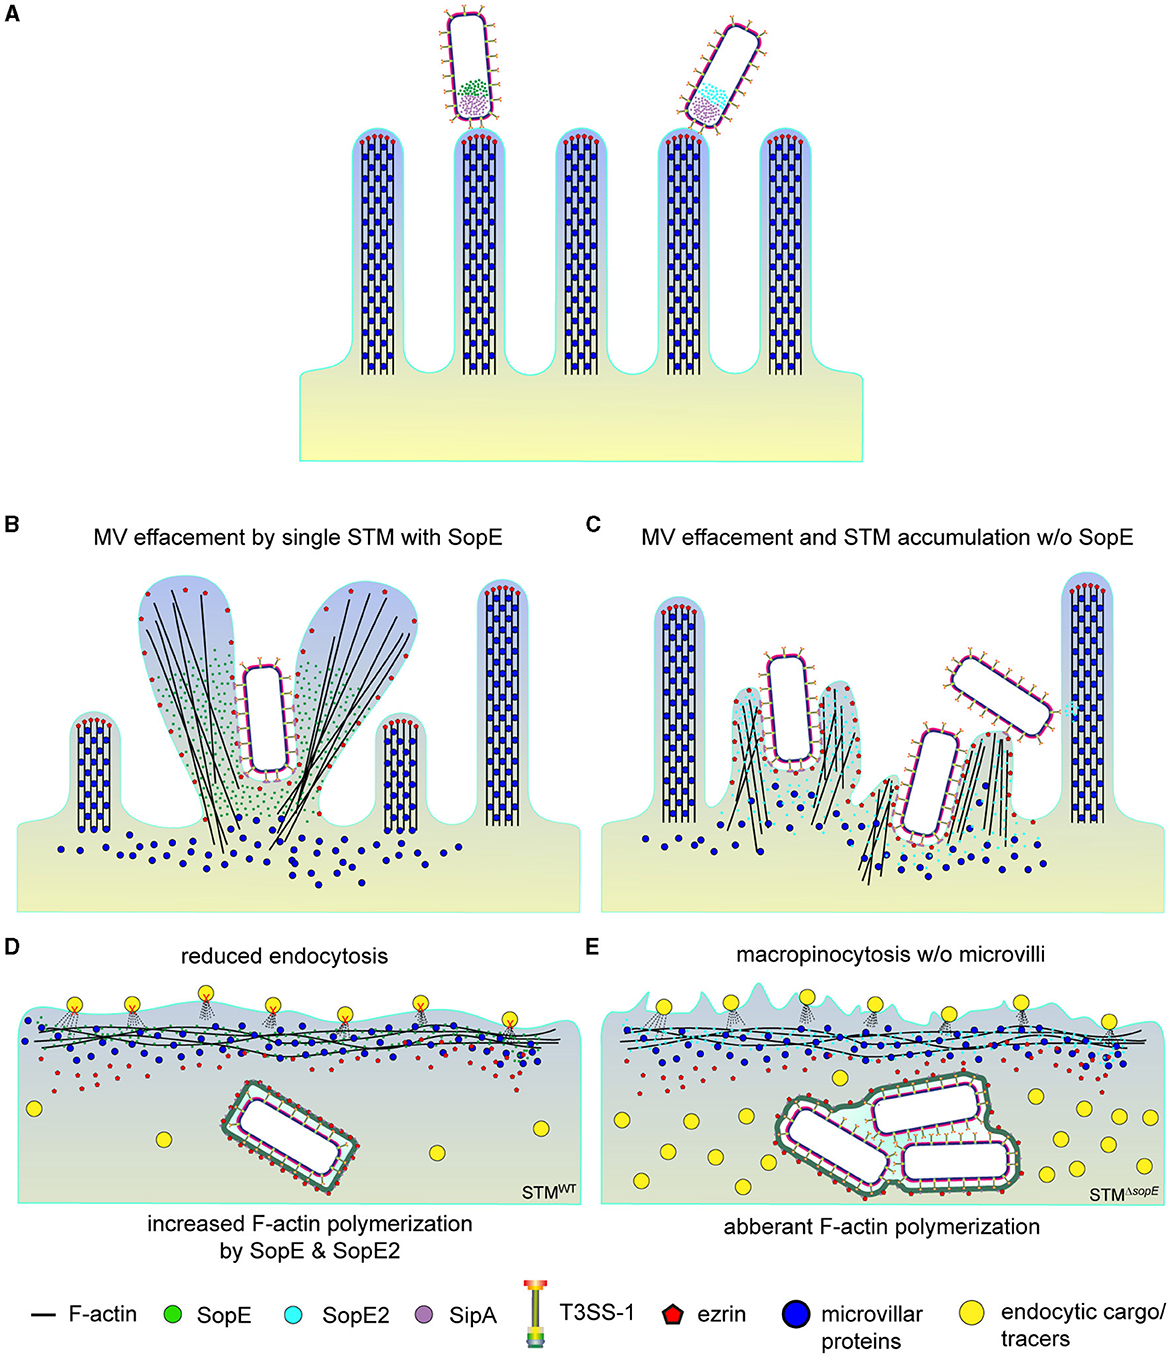
Figure 9. Destruction of the brush border by SPI1-T3SS effector SopE abolishes endocytosis of PEC. The model depicts the sequence of events observed during the STM invasion of PEC. (A) After adhesion, STM translocate SPI1-T3SS effector proteins into host cells. (B) SopE-induced MV effacement also causes delocalization of ezrin and probably other microvillar proteins affected, whereas (C) bacterial cells of STM lacking SopE accumulate to cause local actin reorganization and MV effacement. (D) Internalization of STM-secreting SopE concludes with RA formation (not displayed), recruitment of ezrin to the nascent SCV, and severe reduction of resorption of luminal content (tracers). Delocalization of ezrin and other microvillar proteins probably prevents recovery of MV but has minor effects on resorption since cells infected by SopE-negative STM (E) still endocytose dextran are representative endocytic cargo.
MV effacement and formation of RA have further consequences for PEC in this model. Cells infected by SopE-harboring STM lost MV and were deficient in dextran uptake from the luminal side. Previous observations with MDCK cells attributed the altered uptake of fluid tracers to the inhibition of members of the Src kinase pathway (Mettlen et al., 2006). These authors found that after Src kinase activation by decreasing the temperature from 40 to 34°C, cells formed ruffles, which enhanced the uptake of dextran. The uptake of dextran and holo-transferrin was blocked by inhibitors of F-actin formation, phospholipase, and PIP5K, which indicates the participation of active actin polymerization. In our model, the polymerization of actin in infected cells was 50% higher in zones with RA. Despite SopE2 also altering the actin polymerization, endocytosis in cells infected by STM only containing SopE2 was not altered. Therefore, the alteration of actin polymerization by SopE, but not SopE2, and loss of the absorptive surface of PEC are factors affecting the endocytosis of infected cells.
In contrast, we found that the membrane stain FM4-64 was highly adsorbed only in infected cells, where Salmonella secretes SopE and forms a macropinocytic cup. The accumulation of FM4-64 was previously associated with the production of phosphatidyl-inositol 3,4,5, tri-phosphate (PI-3,4,5P3) in macropinocytic cups of macrophages stimulated with M-CSF (Yoshida et al., 2009). PI-3,4,5P3 is a product of PI3K, a kinase downstream of Rac1. These observations relate to infection by STM expressing SopE; since SopE is a GEF for Rac1, consequently, constant activation of Rac1 via SopE may have further effects on the PI pool at the plasma membrane, which increase during the formation of macropinocytic cups of STM internalization. We speculate that the strong activation of Rac1 by SopE may additionally be the cause of the high recruitment of other proteins, such as Rab5, necessary for the closure of the macropinocytic cups. If so, the amount of Rab5 and other proteins necessary for proper macropinocytosis could be exhausted during STM infection, thus preventing the resorption of luminal content such as dextran. This result also suggests that the selective action of SopE2 on Cdc42 would not affect other proteins necessary for physiological endocytosis.
Similar to our infection model of Salmonella in PEC, infection of C2BBe1 cells by EPEC also culminated in a reduction of the uptake of substrates from the lumen, accompanied by the loss of function of the sodium/D-glucose cotransporter SGLT (Dean et al., 2006). These phenotypes mainly correlated to the infection doses in the experiments and translocation of EPEC effector proteins Map, EspF, Tir, and adhesin Eae. These proteins are necessary to remodel the F-actin in MV since Map binds to the PDZ domain, which interferes with the association of the NHERF transporters to the F-actin cytoskeleton in MV. Its action is enhanced by a cooperative mechanism of the proteins NheI and EspI (Martinez et al., 2010) and the NleH effector protein of EPEC targeting EPS8 to reorganize the apical surface of the host cells to form microcolonies (Lhocine et al., 2015).
Our observations also suggest that effector proteins may not have redundant virulence functions in the host cells but rather cooperatively act to permit a proper internalization of STM into host cells. Another interesting point for further investigation is the reduction of virulence to one or two effector proteins using reduced bacterial infecting doses and long incubation periods for bacterial internalization. Using this setup, we observed no extreme alterations in host cells. Whether this may be sufficient to penetrate enterocytes and disseminate into lymph organs without causing inflammation is still open since SipA triggers neutrophils into the infection area in vivo and in vitro (Zhang et al., 2002; Agbor et al., 2011). It would be interesting to know whether this inflammation causes erosion of the epithelial layer and confines intestinal infection.
Altogether, our data demonstrate that translocation of SopE and SipA dominantly induces the formation of RA at the apical side of host cells, which is a consequence of the loss of ezrin and probably other microvillar proteins after internalization of Salmonella. Furthermore, loss of MV and maintenance of RA via SopE abrogate endocytosis of infected PEC. These physiological alterations of the apical side of PEC and the reduction of the uptake function seem to be a common result of infections by intestinal pathogens. This points out that the organization of the actin and endocytic capacity are highly interdependent processes and are regulated by the same family of proteins in MV, which are directly or indirectly manipulated by bacterial virulence proteins. Further investigations are needed to identify the precise molecular mechanisms behind the alteration of endocytic capacity caused by infection with intestinal pathogens and the physiological consequences.
Salmonella enterica serovar Typhimurium strain SL1344 (SLWT) and NCTC 12023 (NCTCWT) were used as wild-type strains, and their isogenic mutant strains were employed throughout the experiments described in this study (see Table 1). Gene deletion strains were generated by the insertion of an aph cassette into specific target genes. Mutations were generated in NCTC12023 by red-mediated recombination (Datsenko and Wanner, 2000) using pKD13 as a template and primers specified in Table 2. If required, mutant alleles were transferred to the SL1344 strain background by P22 transduction as previously described (Felipe-Lopez et al., 2023).
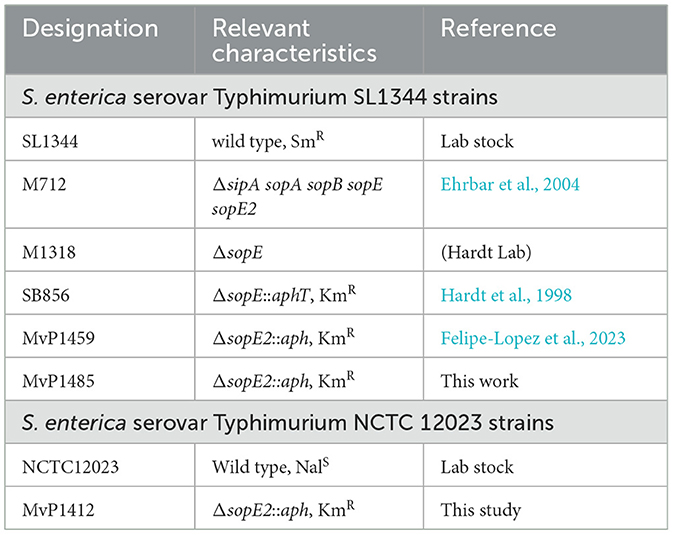
Table 1. Bacterial strains used in this study.
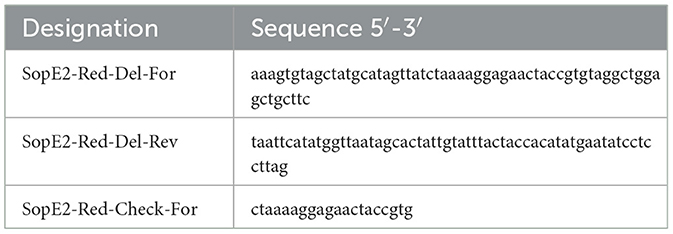
Table 2. Oligonucleotides used in this study.
All cell lines employed in this study were cultured at 37°C in a humidified atmosphere containing 5% CO2. For invasion assays and microscopy analyses, MDCK clone Pf was used as a standard cell culture model, kindly provided by the Nephrology department of the University Hospital Erlangen, FAU Erlangen-Nürnberg. Confluent monolayers in 25 cm2 cell culture flasks were seeded each week in a new 25 cm2 flask with MEM supplemented with 1 × non-essential amino acids (PAA, Germany), 10% inactivated fetal calf serum (FCS, Sigma, Germany) and 1 × Glutamax (PAA, Germany). Changes in the trans-epithelial electrical resistance (TEER) due to the infection of Salmonella were monitored using the cell line Caco-2 BBe1, which is a derivate of Caco-2 cells (ATCC CRL-2102). These cells were cultured in DMEM high glucose without pyruvate (PAA, Germany), containing Glutamax, 10% FCS, and 2.5 μg × mL−1 human holo-transferrin (Sigma-Aldrich, Germany). Cells were seeded at 105 cells per 12 mm polycarbonate filter insert (0.4 μm pore size, Millipore, Germany). TEER was measured every third day with a platinum electrode and an Ohm meter EVOM (World Precision Instruments, USA). Cells were cultured until a TEER of 500–700 Ω per well was observed, usually 10–15 d. For cultivation, media were supplemented with penicillin/streptomycin (PAA, Germany). The medium was changed every third day.
Five days prior to infection, MDCK cells were seeded at 1 × 10⁵ cells per well in 24-well plates (Nunc, Denmark). At least 4 h before infection, the medium was substituted with a medium without antibiotics. Bacterial strains were inoculated in LB and incubated overnight at 37°C with continuous aeration. Cultures were diluted 1:31 in fresh LB and incubated for another 4 h in glass test tubes in a roller drum. Next, the optical density of each culture was measured and adjusted in 1 ml MEM to OD600 = 0.2 (estimated 3 × 10⁸ bacteria × mL−1) to generate a master mix. Cells were infected at multiplicity of infection (MOI) as indicated in subsequent sections, and assays were performed in triplicates for each strain and infection condition. After incubation at indicated periods of time for invasion, cells were washed three times with PBS. Next, fresh medium with gentamicin at 100 μg × mL−1 was added for 1 h. Finally, infected cells were washed five times with PBS and lysed with 0.5% deoxycholic acid for 10 min. Lysates were diluted and plated onto Mueller Hinton II agar (BD, Germany) plates with an Eddy Jet spiral platting instrument (IUL Instruments, Barcelona). Plates were incubated at 37°C overnight, and colony-forming units (CFU) were counted. For infection of monolayers on filter inserts, bacterial strains were added at MOI 50, and TEER was recorded every 20 min over a period of 2 h. Finally, cells were washed three times with pre-warmed PBS and fixed with methanol at −20°C overnight.
For imaging, bacterial strains harbored pWGR435 or pFPV-mCherry for constitutive expression of mTagRFP or mCherry, respectively, under the control of PrpsM (plasmids are listed in Table 3). The same amount of cells as for invasion (see above) were seeded on coverslips and infected in duplicates at MOI 50 with a master mix of the respective STM strain. At various time points after infection, infection was stopped by washing cells with PBS four times. Cells were immediately fixed with pre-warmed 3% PFA in PBS for 1 h at 37°C. After fixation or any subsequent incubation with fluorescent dyes or antibodies, cells were washed three times with PBS at 37°C. Fixed cells were permeabilized by incubation for 15 min at 37°C with 0.5% Triton X-100 (Sigma-Aldrich, Germany) in a blocking solution consisting of 2% BSA (Biomol, Germany) and 2% goat serum (Gibco, Germany) in PBS in a humid chamber. Antibodies were diluted in a blocking solution, and incubations were performed at 37°C in a humid chamber. Rabbit anti-ezrin (Dianova, Germany) was diluted 1:100 and incubated for 1 h. Actin-stain 488-conjugated phalloidin (Cytoskeleton, France) was added at 1:200 dilution and incubated for 45 min at 37°C. Coverslips were then mounted on glass slides with Fluoroprep (Biomerieux, France), sealed with Entellan (Merck, Germany), and kept in the dark at 4°C.
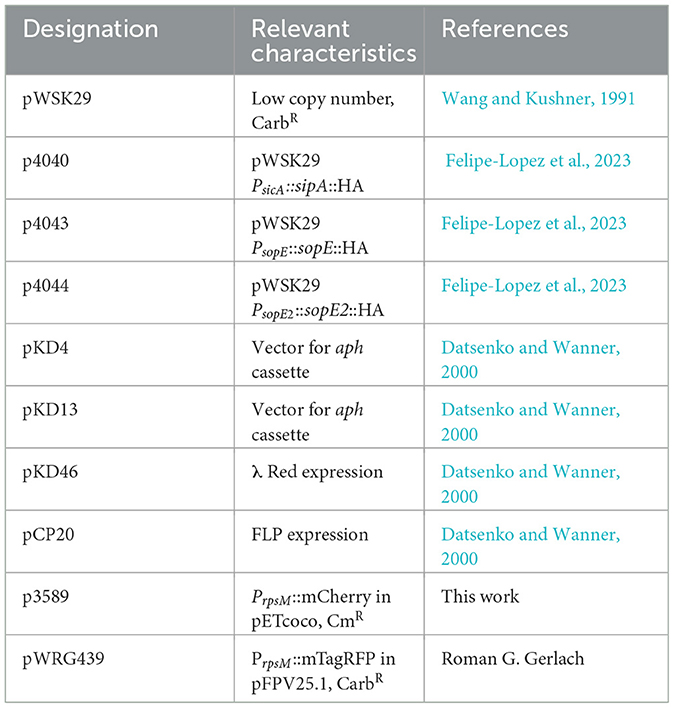
Table 3. Plasmids used in this study.
Fluorescent fluid tracers were deployed to evaluate the uptake at the apical side of MDCK cells after infection and destruction of the brush border. Cells were infected as described for invasion experiments (see above). After 1 h of gentamicin treatment, cells were washed three times with pre-warmed PBS. Next, cells were pulsed with 250 μg × mL−1 dextran Alexa-568 10,000 FX, or 50 μg × mL−1 of the membrane dye FM4-64FX (Life Technologies, Netherlands). Both fluid tracers were mixed in MEM, 30 mM HEPES, pH 7.4 w/o phenol red, and w/o sodium bicarbonate. Cells were then incubated for 30 min at 37°C at 5% CO2. Finally, tracers were removed from the cells by washing them three times with pre-warmed PBS. They were then fixed with 3% PFA and further processed for microscopy as described above with additional staining of DNA by adding DAPI at 1:1,000 to Fluoroprep.
Images from the fixed samples were acquired with a DMI 6000 SP5 II confocal laser-scanning microscope (Leica Microsystems Wetzlar, Germany). They were acquired with a 100x objective with a numerical aperture of 1.44. The pinhole was adjusted to 1 Airy unit for all acquisitions, and the pixel size of the images was 70.85 × 70.85, with a bit depth of 16 bits. Z-slice thickness was adjusted to 0.12 μm using the Nyquist theorem. The Ar 488 nm laser line was used for Alexa488-conjugated antibodies and eGFP. The HeNe 543 nm laser line was used for the excitation of Alexa568-conjugated antibodies and mCherry or mTagRFP. Images were acquired with Leica Acquisition Software V. 2.3.6. and further processed with Imaris V. 7.6.1 (BitPlane, Switzerland) and FIJI (Max-Planck Institute for Cell Biology, Dresden, Germany).
Live-cell imaging (LCI) was performed using Lifeact-EGFP MDCK cells, which are described before (Felipe-Lopez et al., 2023), and mCherry-, or mTagRFP-expressing Salmonella strains. LCI was performed using a CellObserver microscopy system (Zeiss, Germany) coupled to a Yokogawa spinning disc unit. Images were acquired for 120 min shortly after infection at maximal speed with intervals of 100–200 ms at distances between Z planes of 0.30–0.35 μm. LCI was performed with a water immersion objective with a numerical aperture of 1.333. The acquisition was performed with either a cooled CCD camera (CoolSNAP HQ2, Photometrics) with a chip of 1,040 × 1,392 pixels for high spatial resolution or an EM-CCD camera (Evolve, Photometrics) with a chip of 512 × 512 pixels for high sensitivity and FRAP analysis. The acquisition and processing of the time-lapse images were performed with ZEN 2012. Images from CLSM or SD were deconvolved with Huygens V.4.2 using a theoretical PSF. Bleaching and Z-drift were also corrected with Huygens. Further processing and movie export were performed with Imaris 7.6.1.
Fixed samples of infected MDCK cells fed with dextran Alexa568 10 000 FX were observed by laser confocal-spinning disc microscopy with an EmCCD camera (see above). DAPI-stained structures were excited by a 405 nm laser line; F-actin stained with phalloidin Actin-stain 488 was excited with the laser line 488 nm; finally, dextran-stained samples were excited with a laser line 561. Images were acquired with a 63x oil immersion objective with a refraction index of 1.51 and a numerical aperture of 1.44 through the Z axis with intervals of 0.12 μm between each slice. Images were further deconvolved using Huygens 4.2. for the detection of dextran in all other cells. Then, restored images were visualized in Imaris V.7.6.1. For quantification, dextran spots of the non-infected cells and non-stained cells were set up at a lower threshold for processing the rest of the infected samples. The minor diameter of dextran spots was defined to be ~ 0.5 μm. Quantification of dextran was then performed using the “Spot” function of Imaris, briefly: a region of interest of 45 × 45 pixels, which represents approximately one cell, was set. Next, the spots with a diameter of ~0.5 μm were recognized by their maximal intensity signal. The threshold values from the emission spectrum of each sample were then adjusted from 450 to 10,000 voxels from a total emission spectrum of 16,000 voxels. Finally, the whole observation field was processed with these parameters. The average of the total number of spots per field was calculated and plotted as indicated in the Results section.
Images from samples stained with the membrane fluorescent dye FM4-64FX were acquired by confocal laser-scanning microscopy (see below) with the XZY mode. This mode allows the acquisition of a vertical section of the sample w/o Z-slices. Therefore, the observation of the distribution of the membrane dye throughout the cytoplasmic membrane was possible. Samples were observed with a 100x-objective with a numerical aperture of 1.44 and a refraction index of 1.51. Image resolution was 1,024 × 1,024 pixels from a field size of 45 × 45 μm with a bit depth of 8 bits. The thickness of each slice in the Y-axis was 0.12 μm. FM4-64 or phalloidin Actin-stain 488 were excited by the Ar 488 nm laser line. Images were further processed with FIJI. A profile line was drawn at the apical side of each section. The total signal from the apical side of the section was added, and the average of this signal from several fields was calculated and plotted, as shown in the results section.
To evaluate the polymerization of F-actin to RA, fluorescence recovery after photobleaching (FRAP) was performed in cells infected by Salmonella. MDCK Lifeact-EGFP cells were seeded on treated chamber slides (Ibidi, Germany) at 25,000 cells per well. After 5 days, the medium was substituted with MEM 30 mM HEPES pH 7.4 w/o sodium bicarbonate and phenol red. Then, cells were infected by Salmonella at MOI 25 as described for invasion experiments. At 25 min p.i., cells were washed with a pre-warmed MEM medium to avoid alterations of any cellular structures such as MV or RA. Cells were further incubated with MEM as described above and observed by SD microscopy.
Image acquisition was performed at the apical side of the infected cells with a frame rate of 100 ms per frame per channel. The 488 nm and 561 nm laser lines were set to 2 and 5% intensity, respectively. The electrical gain of the EmCCD camera was set to 100 in both channels. Before bleaching, 50 frames were acquired. A bleaching pulse was performed for 500 ms with a 488 nm laser line at transmission of 100% using a pre-established mask of 5 μm. Signal recovery was quantified during 200 frames after the bleaching pulse. Results from the FRAP signal were plotted as relative signals over time in seconds. The recovery constant was calculated from the bleaching point until the next 200 frames by the method described by Ishikawa-Ankerhold et al. (2012). Results were plotted as described above.
To observe topological changes in cell surface as a consequence of STM-induced cytoskeletal remodeling, AFM measurements were conducted using the NanoWizard II AFM system (JPK Instruments AG, Berlin, Germany). High-resolution surface images were acquired by operating the AFM under ambient conditions in soft contact mode using silicon nitride AFM probes with a nominal force constant of 0.06 N/m (SiNi, Budget Sensors, Wetzlar, Germany). Samples were prepared as described above. For each sample, topographic overview images with a 90 × 90 μm scan area were taken before zoom-ins were generated. All images were polynomially fitted and unsharpened mask filtered using JPK data processing software (JPK Instruments AG). Presented images are 3D projections of the height profiles, tilted 12° in X direction.
The raw data supporting the conclusions of this article will be made available by the authors, without undue reservation.
AF-L: Conceptualization, Data curation, Investigation, Project administration, Validation, Visualization, Writing – original draft, Writing – review & editing, Formal analysis, Methodology, Resources. NH: Conceptualization, Data curation, Formal analysis, Investigation, Methodology, Resources, Validation, Visualization, Writing – original draft. MH: Conceptualization, Data curation, Investigation, Validation, Visualization, Writing – original draft, Funding acquisition, Project administration, Supervision, Writing – review & editing.
The author(s) declare financial support was received for the research, authorship, and/or publication of this article. This work was supported by the Deutsche Forschungsgemeinschaft grants P4 and Z within the collaborative research center SFB 944. AF-L was supported by a research fellowship of the German Academic Exchange Service (DAAD/A-0773175). The funders had no role in the design of the study and interpretation of results. Open access publication was supported by the DFG, DEAL project ID: 180879236.
We thank the MWK Niedersachsen for the start-up funding of MH.
The authors declare that the research was conducted in the absence of any commercial or financial relationships that could be construed as a potential conflict of interest.
The handling editor SH declared a past co-authorship with the author MH.
All claims expressed in this article are solely those of the authors and do not necessarily represent those of their affiliated organizations, or those of the publisher, the editors and the reviewers. Any product that may be evaluated in this article, or claim that may be made by its manufacturer, is not guaranteed or endorsed by the publisher.
The Supplementary Material for this article can be found online at: https://www.frontiersin.org/articles/10.3389/fmicb.2024.1329798/full#supplementary-material
Supplementary Figure 1. Manipulation of the apical side of PEC and F-actin cytoskeleton by STM. Previously reported analyses of the apical side of PEC during STM adhesion and invasion were compiled. (A) MDCK cells are infected by STM WT, fixed, and prepared for scanning EM. STM is pseudo-colored red. Modified from Gerlach et al. (2008). (B) MDCK cells were infected by STM WT expressing mCherry (red). At indicated time points, p.i. were fixed and labeled for F-actin (white). MV, microvilli; R, membrane ruffle; RA reticular F-actin. Arrowheads indicate RA. Modified from Lorkowski et al. (2014). (C) AFM analyses of surface topologies of STM-infected MDCK at indicated time points p.i. modified from Lorkowski et al. (2014). (D) Live-cell correlative live-cell scanning electron microscopy of MDCK monolayers expressing Lifeact (green in inserts), infected by STM WT (red in inserts). Arrowhead indicates RA. Modified from Kommnick et al. (2019). (E) CLSM and AFM of MDCK Lifeact-GFP cells apical side after infection by STM WT. The arrowhead indicates MV, R, or RA as indicated. Modified from Felipe-Lopez et al. (2023). For full experimental details, see the respective references. Timestamp min:sec. Scale bars, 10 μm (A, Left, B, E), 1 μm (A mid and right, D).
Supplementary Movie 1. STM destroys the brush border architecture of PEC and induces the formation of reticular F-actin. MDCK Lifeact-eGFP cells (gray) were infected with STM SLWT, SLΔsopE, NCTCWT, or NCTCΔsopE2. Bacterial strains were expressing mTagRFP or mCherry. Time-lapse series of LCI were recorded for 110 min. Timestamp, h:min:sec.ms. Scale bar, 5 μm. The movie corresponds to Figure 3.
Supplementary Movie 2. STM recruits ezrin to the nascent SCV. MDCK cells expressing GFP-ezrin (green) and β-actin-RFP (red) were infected with STM SLWT (not visible), and a time-lapse series of LCI was recorded for 35 min. Timestamp, h:min:sec:ms. Scale bar, 5 μm. The movie corresponds to Figures 8C, D.
AFM, atomic force microscopy; Caco-2 BBe1, cancer coli cell line; CLSM, confocal laser-scanning microscopy; EHEC, enterohemorrhagic E. coli; EPEC, enteropathogenic E. coli; ETEC, enterotoxinogenic E. coli; FRAP, fluorescence recovery after photobleaching; LCI, live-cell imaging; LT, labile toxin; MDCK, Madin-Darby canine kidney cells; MIP, maximal intensity projection; MV, Microvilli; PEC, polarized epithelial cells; p.i., post-infection; RA, reticular F-actin; STM, Salmonella enterica serovar Typhimurium; SPI, Salmonella pathogenicity island; TEER, transepithelial electrical resistance; TIRF, total internal reflection microscopy; T1SS, type I secretion system; T3SS, type III secretion system; WT, wild type.
Agbor, T. A., Demma, Z. C., Mumy, K. L., Bien, J. D., and Mccormick, B. A. (2011). The ERM protein, ezrin, regulates neutrophil transmigration by modulating the apical localization of MRP2 in response to the SipA effector protein during Salmonella Typhimurium infection. Cell. Microbiol. 13, 2007–2021. doi: 10.1111/j.1462-5822.2011.01693.x
Antonio, P. D., Lasalvia, M., Perna, G., and Capozzi, V. (2012). Scale-independent roughness value of cell membranes studied by means of AFM technique. Biochim. Biophys. Acta 1818, 3141–3148. doi: 10.1016/j.bbamem.2012.08.001
Chong, A., Cooper, K. G., Kari, L., Nilsson, O. R., Hillman, C., Fleming, B. A., et al. (2021). Cytosolic replication in epithelial cells fuels intestinal expansion and chronic fecal shedding of Salmonella Typhimurium. Cell Host Microbe 29, 1177–1185 e1176. doi: 10.1016/j.chom.2021.04.017
Datsenko, K. A., and Wanner, B. L. (2000). One-step inactivation of chromosomal genes in Escherichia coli K-12 using PCR products. Proc. Natl. Acad. Sci. U. S. A. 97, 6640–6645. doi: 10.1073/pnas.120163297
Dean, P., Maresca, M., Schuller, S., Phillips, A. D., and Kenny, B. (2006). Potent diarrheagenic mechanism mediated by the cooperative action of three enteropathogenic Escherichia coli-injected effector proteins. Proc. Natl. Acad. Sci. U. S. A. 103, 1876–1881. doi: 10.1073/pnas.0509451103
Delacour, D., Salomon, J., Robine, S., and Louvard, D. (2016). Plasticity of the brush border - the yin and yang of intestinal homeostasis. Nat. Rev. Gastroenterol. Hepatol. 13, 161–174. doi: 10.1038/nrgastro.2016.5
Dhekne, H. S., Hsiao, N. H., Roelofs, P., Kumari, M., Slim, C. L., Rings, E. H., et al. (2014). Myosin Vb and rab11a regulate ezrin phosphorylation in enterocytes. J. Cell Sci. 127 (Pt 5):1007–1017. doi: 10.1242/jcs.137273
Ehrbar, K., Hapfelmeier, S., Stecher, B., and Hardt, W. D. (2004). InvB is required for type III-dependent secretion of SopA in Salmonella enterica serovar Typhimurium. J. Bacteriol. 186, 1215–1219. doi: 10.1128/JB.186.4.1215-1219.2004
Engevik, A. C., and Goldenring, J. R. (2018). Trafficking ion transporters to the apical membrane of polarized intestinal enterocytes. Cold Spring Harb. Perspect. Biol. 10:a027979. doi: 10.1101/cshperspect.a027979
Fattinger, S. A., Bock, D., Di Martino, M. L., Deuring, S., Samperio Ventayol, P., Ek, V., et al. (2020). Salmonella Typhimurium discreet-invasion of the murine gut absorptive epithelium. PLoS Pathog. 16:e1008503. doi: 10.1371/journal.ppat.1008503
Fattinger, S. A., Geiser, P., Samperio Ventayol, P., Di Martino, M. L., Furter, M., Felmy, B., et al. (2021a). Epithelium-autonomous NAIP/NLRC4 prevents TNF-driven inflammatory destruction of the gut epithelial barrier in Salmonella-infected mice. Mucosal Immunol. 14, 615–629. doi: 10.1038/s41385-021-00381-y
Fattinger, S. A., Sellin, M. E., and Hardt, W. D. (2021b). Salmonella effector driven invasion of the gut epithelium: breaking in and setting the house on fire. Curr. Opin. Microbiol. 64, 9–18. doi: 10.1016/j.mib.2021.08.007
Felipe-Lopez, A., Hansmeier, N., Danzer, C., and Hensel, M. (2023). Manipulation of microvillar proteins during Salmonella enterica invasion results in brush border effacement and actin remodeling. Front. Cell. Infect. Microbiol. 13:1137062. doi: 10.3389/fcimb.2023.1137062
Finlay, B. B., Gumbiner, B., and Falkow, S. (1988). Penetration of Salmonella through a polarized Madin-Darby canine kidney epithelial cell monolayer. J. Cell Biol. 107, 221–230. doi: 10.1083/jcb.107.1.221
Frankel, G., Phillips, A. D., Rosenshine, I., Dougan, G., Kaper, J. B., and Knutton, S. (1998). Enteropathogenic and enterohaemorrhagic Escherichia coli: more subversive elements. Mol. Microbiol. 30, 911–921. doi: 10.1046/j.1365-2958.1998.01144.x
Friebel, A., Ilchmann, H., Aepfelbacher, M., Ehrbar, K., Machleidt, W., and Hardt, W. D. (2001). SopE and SopE2 from Salmonella typhimurium activate different sets of RhoGTPases of the host cell. J. Biol. Chem. 276, 34035–34040. doi: 10.1074/jbc.M100609200
Gaeta, I. M., Meenderink, L. M., Postema, M. M., Cencer, C. S., and Tyska, M. J. (2021). Direct visualization of epithelial microvilli biogenesis. Curr. Biol. 31, 2561–2575 e2566. doi: 10.1016/j.cub.2021.04.012
Galan, J. E. (2021). Salmonella Typhimurium and inflammation: a pathogen-centric affair. Nat. Rev. Microbiol. 19, 716–725. doi: 10.1038/s41579-021-00561-4
Gerlach, R. G., Claudio, N., Rohde, M., Jäckel, D., Wagner, C., and Hensel, M. (2008). Cooperation of Salmonella pathogenicity islands 1 and 4 is required to breach epithelial barriers. Cell. Microbiol. 10, 2364–2376. doi: 10.1111/j.1462-5822.2008.01218.x
Ginocchio, C., Pace, J., and Galan, J. E. (1992). Identification and molecular characterization of a Salmonella typhimurium gene involved in triggering the internalization of salmonellae into cultured epithelial cells. Proc. Natl. Acad. Sci. U. S. A. 89, 5976–5980. doi: 10.1073/pnas.89.13.5976
Gloerich, M., Ten Klooster, J. P., Vliem, M. J., Koorman, T., Zwartkruis, F. J., Clevers, H., et al. (2012). Rap2A links intestinal cell polarity to brush border formation. Nat. Cell Biol. 14, 793–801. doi: 10.1038/ncb2537
Gov, N. S. (2006). Dynamics and morphology of microvilli driven by actin polymerization. Phys. Rev. Lett. 97:018101. doi: 10.1103/PhysRevLett.97.018101
Hardt, W. D., Urlaub, H., and Galan, J. E. (1998). A substrate of the centisome 63 type III protein secretion system of Salmonella typhimurium is encoded by a cryptic bacteriophage. Proc. Natl. Acad. Sci. U. S. A. 95, 2574–2579. doi: 10.1073/pnas.95.5.2574
Hölzer, S. U., and Hensel, M. (2012). Divergent roles of Salmonella Pathogenicity Island 2 and metabolic traits during interaction of S. enterica serovar Typhimurium with host cells. PLoS ONE 7:e33220. doi: 10.1371/journal.pone.0033220
Ishikawa-Ankerhold, H. C., Ankerhold, R., and Drummen, G. P. (2012). Advanced fluorescence microscopy techniques - FRAP, FLIP, FLAP, FRET and FLIM. Molecules 17, 4047–4132. doi: 10.3390/molecules17044047
Keestra, A. M., Winter, M. G., Auburger, J. J., Frassle, S. P., Xavier, M. N., Winter, S. E., et al. (2013). Manipulation of small Rho GTPases is a pathogen-induced process detected by NOD1. Nature 496, 233–237. doi: 10.1038/nature12025
Kommnick, C., Lepper, A., and Hensel, M. (2019). Correlative light and scanning electron microscopy (CLSEM) for analysis of bacterial infection of polarized epithelial cells. Sci. Rep. 9:17079. doi: 10.1038/s41598-019-53085-6
Lai, Y., Rosenshine, I., Leong, J. M., and Frankel, G. (2013). Intimate host attachment: enteropathogenic and enterohaemorrhagic Escherichia coli. Cell. Microbiol. 15, 1796–1808. doi: 10.1111/cmi.12179
Laporte, D., Ojkic, N., Vavylonis, D., and Wu, J. Q. (2012). alpha-Actinin and fimbrin cooperate with myosin II to organize actomyosin bundles during contractile-ring assembly. Mol. Biol. Cell 23, 3094–3110. doi: 10.1091/mbc.e12-02-0123
Lhocine, N., Arena, E. T., Bomme, P., Ubelmann, F., Prevost, M. C., Robine, S., et al. (2015). Apical invasion of intestinal epithelial cells by Salmonella typhimurium requires villin to remodel the brush border actin cytoskeleton. Cell Host Microbe 17, 164–177. doi: 10.1016/j.chom.2014.12.003
Lorkowski, M., Felipe-Lopez, A., Danzer, C. A., Hansmeier, N., and Hensel, M. (2014). Salmonella enterica invasion of polarized epithelial cells is a highly cooperative effort. Infect. Immun. 82, 2657–2667. doi: 10.1128/IAI.00023-14
Martinez, E., Schroeder, G. N., Berger, C. N., Lee, S. F., Robinson, K. S., Badea, L., et al. (2010). Binding to Na(+) /H(+) exchanger regulatory factor 2 (NHERF2) affects trafficking and function of the enteropathogenic Escherichia coli type III secretion system effectors Map, EspI and NleH. Cell. Microbiol. 12, 1718–1731. doi: 10.1111/j.1462-5822.2010.01503.x
McConnell, R. E., Higginbotham, J. N., Shifrin, D. A. Jr., Tabb, D. L., Coffey, R. J., and Tyska, M. J. (2009). The enterocyte microvillus is a vesicle-generating organelle. J. Cell Biol. 185, 1285–1298. doi: 10.1083/jcb.200902147
McConnell, R. E., and Tyska, M. J. (2007). Myosin-1a powers the sliding of apical membrane along microvillar actin bundles. J. Cell Biol. 177, 671–681. doi: 10.1083/jcb.200701144
Meenderink, L. M., Gaeta, I. M., Postema, M. M., Cencer, C. S., Chinowsky, C. R., Krystofiak, E. S., et al. (2019). Actin dynamics drive microvillar motility and clustering during brush border assembly. Dev. Cell 50, 545–556 e544. doi: 10.1016/j.devcel.2019.07.008
Mettlen, M., Platek, A., Van Der Smissen, P., Carpentier, S., Amyere, M., Lanzetti, L., et al. (2006). Src triggers circular ruffling and macropinocytosis at the apical surface of polarized MDCK cells. Traffic 7, 589–603. doi: 10.1111/j.1600-0854.2006.00412.x
Mirold, S., Rabsch, W., Rohde, M., Stender, S., Tschäpe, H., Rüssmann, H., et al. (1999). Isolation of a temperate bacteriophage encoding the type III effector protein SopE from an epidemic Salmonella typhimurium strain. Proc. Natl. Acad. Sci. U. S. A. 96, 9845–9850. doi: 10.1073/pnas.96.17.9845
Misselwitz, B., Barrett, N., Kreibich, S., Vonaesch, P., Andritschke, D., Rout, S., et al. (2012). Near surface swimming of Salmonella Typhimurium explains target-site selection and cooperative invasion. PLoS Pathog. 8:e1002810. doi: 10.1371/journal.ppat.1002810
Muller, A. J., Hoffmann, C., Galle, M., Van Den Broeke, A., Heikenwalder, M., Falter, L., et al. (2009). The S. Typhimurium effector SopE induces caspase-1 activation in stromal cells to initiate gut inflammation. Cell Host Microbe 6, 125–136. doi: 10.1016/j.chom.2009.07.007
Pedersen, G. A., Jensen, H. H., Schelde, A. B., Toft, C., Pedersen, H. N., Ulrichsen, M., et al. (2017). The basolateral vesicle sorting machinery and basolateral proteins are recruited to the site of enteropathogenic E. coli microcolony growth at the apical membrane. PLoS ONE 12:e0179122. doi: 10.1371/journal.pone.0179122
Pelaseyed, T., and Bretscher, A. (2018). Regulation of actin-based apical structures on epithelial cells. J. Cell Sci. 131:221853. doi: 10.1242/jcs.221853
Revenu, C., Ubelmann, F., Hurbain, I., El-Marjou, F., Dingli, F., Loew, D., et al. (2012). A new role for the architecture of microvillar actin bundles in apical retention of membrane proteins. Mol. Biol. Cell 23, 324–336. doi: 10.1091/mbc.e11-09-0765
Röder, J., and Hensel, M. (2020). Presence of SopE and mode of infection result in increased Salmonella-containing vacuole damage and cytosolic release during host cell infection by Salmonella enterica. Cell. Microbiol. 22:e13155. doi: 10.1111/cmi.13155
Saotome, I., Curto, M., and McClatchey, A. I. (2004). Ezrin is essential for epithelial organization and villus morphogenesis in the developing intestine. Dev. Cell 6, 855–864. doi: 10.1016/j.devcel.2004.05.007
Schlumberger, M. C., and Hardt, W. D. (2005). Triggered phagocytosis by Salmonella: bacterial molecular mimicry of RhoGTPase activation/deactivation. Curr. Top. Microbiol. Immunol. 291, 29–42. doi: 10.1007/3-540-27511-8_3
Schlumberger, M. C., Kappeli, R., Wetter, M., Muller, A. J., Misselwitz, B., Dilling, S., et al. (2007). Two newly identified SipA domains (F1, F2) steer effector protein localization and contribute to Salmonella host cell manipulation. Mol. Microbiol. 65, 741–760. doi: 10.1111/j.1365-2958.2007.05823.x
Segal, E. D., Falkow, S., and Tompkins, L. S. (1996). Helicobacter pylori attachment to gastric cells induces cytoskeletal rearrangements and tyrosine phosphorylation of host cell proteins. Proc. Natl. Acad. Sci. U. S. A. 93, 1259–1264. doi: 10.1073/pnas.93.3.1259
Sheikh, A., Tumala, B., Vickers, T. J., Martin, J. C., Rosa, B. A., Sabui, S., et al. (2022). Enterotoxigenic Escherichia coli heat-labile toxin drives enteropathic changes in small intestinal epithelia. Nat. Commun. 13:6886. doi: 10.1038/s41467-022-34687-7
Solaymani-Mohammadi, S., and Singer, S. M. (2013). Regulation of intestinal epithelial cell cytoskeletal remodeling by cellular immunity following gut infection. Mucosal Immunol. 6, 369–378. doi: 10.1038/mi.2012.80
Takeuchi, A. (1967). Electron microscope studies of experimental Salmonella infection. I. Penetration into the intestinal epithelium by Salmonella typhimurium. Am. J. Pathol. 50, 109–136.
Tan, S., Noto, J. M., Romero-Gallo, J., Peek, R. M. Jr., and Amieva, M. R. (2011). Helicobacter pylori perturbs iron trafficking in the epithelium to grow on the cell surface. PLoS Pathog. 7:e1002050. doi: 10.1371/journal.ppat.1002050
Tan, S., Tompkins, L. S., and Amieva, M. R. (2009). Helicobacter pylori usurps cell polarity to turn the cell surface into a replicative niche. PLoS Pathog. 5:e1000407. doi: 10.1371/journal.ppat.1000407
Teafatiller, T., Subramanya, S. B., Lambrecht, N., and Subramanian, V. S. (2023). Salmonella Typhimurium infection reduces the ascorbic acid uptake in the intestine. Mediators Inflamm. 2023:2629262. doi: 10.1155/2023/2629262
Terebiznik, M. R., Vieira, O. V., Marcus, S. L., Slade, A., Yip, C. M., Trimble, W. S., et al. (2002). Elimination of host cell PtdIns(4,5)P(2) by bacterial SigD promotes membrane fission during invasion by Salmonella. Nat. Cell Biol. 4, 766–773. doi: 10.1038/ncb854
Wang, R. F., and Kushner, S. R. (1991). Construction of versatile low-copy-number vectors for cloning, sequencing and gene expression in Escherichia coli. Gene 100, 195–199. doi: 10.1016/0378-1119(91)90366-J
Wong, A. R., Pearson, J. S., Bright, M. D., Munera, D., Robinson, K. S., Lee, S. F., et al. (2011). Enteropathogenic and enterohaemorrhagic Escherichia coli: even more subversive elements. Mol. Microbiol. 80, 1420–1438. doi: 10.1111/j.1365-2958.2011.07661.x
Yoshida, S., Hoppe, A. D., Araki, N., and Swanson, J. A. (2009). Sequential signaling in plasma-membrane domains during macropinosome formation in macrophages. J. Cell Sci. 122, 3250–3261. doi: 10.1242/jcs.053207
Zhang, K., Riba, A., Nietschke, M., Torow, N., Repnik, U., Putz, A., et al. (2018). Minimal SPI1-T3SS effector requirement for Salmonella enterocyte invasion and intracellular proliferation in vivo. PLoS Pathog. 14:e1006925. doi: 10.1371/journal.ppat.1006925
Zhang, S., Santos, R. L., Tsolis, R. M., Stender, S., Hardt, W. D., Baumler, A. J., et al. (2002). The Salmonella enterica serotype typhimurium effector proteins SipA, SopA, SopB, SopD, and SopE2 act in concert to induce diarrhea in calves. Infect. Immun. 70, 3843–3855. doi: 10.1128/IAI.70.7.3843-3855.2002
Keywords: epithelial cells, brush border, endocytosis, ezrin, invasion
Citation: Felipe-López A, Hansmeier N and Hensel M (2024) Destruction of the brush border by Salmonella enterica sv. Typhimurium subverts resorption by polarized epithelial cells. Front. Microbiol. 15:1329798. doi: 10.3389/fmicb.2024.1329798
Received: 29 October 2023; Accepted: 06 May 2024;
Published: 04 June 2024.
Edited by:
Sébastien Holbert, INRA Centre Val de Loire, FranceReviewed by:
Vianney Ortiz-Navarrete, National Polytechnic Institute of Mexico (CINVESTAV), MexicoCopyright © 2024 Felipe-López, Hansmeier and Hensel. This is an open-access article distributed under the terms of the Creative Commons Attribution License (CC BY). The use, distribution or reproduction in other forums is permitted, provided the original author(s) and the copyright owner(s) are credited and that the original publication in this journal is cited, in accordance with accepted academic practice. No use, distribution or reproduction is permitted which does not comply with these terms.
*Correspondence: Michael Hensel, bWljaGFlbC5oZW5zZWxAdW5pLW9zbmFicnVlY2suZGU=
†Present addresses: Alfonso Felipe-López, Mikrobiologisches Institut, Universitätsklinikum Erlangen, FAU Erlangen-Nürnberg, Erlangen, Germany;
Nicole Hansmeier, Department of Biology, Luther College at the University of Regina, Regina, SK, Canada
Disclaimer: All claims expressed in this article are solely those of the authors and do not necessarily represent those of their affiliated organizations, or those of the publisher, the editors and the reviewers. Any product that may be evaluated in this article or claim that may be made by its manufacturer is not guaranteed or endorsed by the publisher.
Research integrity at Frontiers
Learn more about the work of our research integrity team to safeguard the quality of each article we publish.