 Kairi Tanaka
 Scott Collins3
 Vivek Fellner
- 1Department of Animal Science, North Carolina State University, Raleigh, NC, United States
- 2Department of Plant and Microbial Biology, North Carolina State University, Raleigh, NC, United States
- 3Department of Chemical and Biomolecular Engineering, North Carolina State University, Raleigh, NC, United States
Mitigation of enteric methane (CH4) emissions from ruminant livestock represents an opportunity to improve the sustainability, productivity, and profitability of beef and dairy production. Ruminal methanogenesis can be mitigated via two primary strategies: (1) alternative electron acceptors and (2) enzymatic inhibition of methanogenic pathways. The former utilizes the thermodynamic favorability of certain reactions such as nitrate/nitrite reduction to ammonia (NH3) while the latter targets specific enzymes using structural analogs of CH4 and methanogenic cofactors such as bromochloromethane (BCM). In this study, we investigated the effects of four additives and their combinations on CH4 production by rumen microbes in batch culture. Sodium nitrate (NaNO3), sodium sulfate (Na2SO4), and 3-nitro-1-propionate (3NPA) were included as thermodynamic inhibitors, whereas BCM was included as a enzymatic inhibitor. Individual additives were evaluated at three levels of inclusion in experiments 1 and 2. Highest level of each additive was used to determine the combined effect of NaNO3 + Na2SO4 (NS), NS + 3NPA (NSP), and NSP + BCM (NSPB) in experiments 3 and 4. Experimental diets were high, medium, and low forage diets (HF, MF, and LF, respectively) and consisted of alfalfa hay and a concentrate mix formulated to obtain the following forage to concentrate ratios: 70:30, 50:50, and 30:70, respectively. Diets with additives were placed in fermentation culture bottles and incubated in a water bath (39°C) for 6, 12, or 24h. Microbial DNA was extracted for 16S rRNA and ITS gene amplicon sequencing. In experiments 1 and 2, CH4 concentrations in control cultures decreased in the order of LF, MF, and HF diets, whereas in experiments 3 and 4, CH4 was highest in MF diet followed by HF and LF diets. Culture pH and NH3 in the control decreased in the order of HF, MF, to LF as expected. NaNO3 decreased (p < 0.001) CH4 and butyrate and increased acetate and propionate (p < 0.03 and 0.003, respectively). Cultures receiving NaNO3 had an enrichment of microorganisms capable of nitrate and nitrite reduction. 3NPA also decreased CH4 at 6h with no further decrease at 24 h (p < 0.001). BCM significantly inhibited methanogenesis regardless of inclusion levels as well as in the presence of the thermodynamic inhibitors (p < 0.001) while enriching succinate producers and assimilators as well as propionate producers (p adj < 0.05). However, individual inclusion of BCM decreased total short chain fatty acid (SCFA) concentrations (p < 0.002). Inhibition of methanogenesis with BCM individually and in combination with the other additives increased gaseous H2 concentrations (p < 0.001 individually and 0.028 in combination) while decreasing acetate to propionate ratio (p < 0.001). Only the cultures treated with BCM in combination with other additives significantly (padj < 0.05) decreased the abundance of Methanobrevibacter expressed as log fold change. Overall, the combination of thermodynamic and enzymatic inhibitors presented a promising effect on ruminal fermentation in-vitro, inhibiting methanogenesis while optimizing the other fermentation parameters such as pH, NH3, and SCFAs. Here, we provide a proof of concept that the combination of an electron acceptor and a methane analog may be exploited to improve microbial efficiency via methanogenesis inhibition.
1 Introduction
Methane (CH4) is the key to tackling two of the major obstacles in ruminant nutrition: feed efficiency and greenhouse gas (GHG) emissions. Enteric methane emissions represent up to 10% of dietary energy loss (Blaxter and Clapperton, 1965) and 26.9% of the total anthropogenic CH4 emissions in the US (US EPA, 2022). Further, these factors of ruminal methanogenesis may create a negative feedback loop around the price of not only beef and dairy but also other agricultural products because agricultural practices are often dependent on local climate, which is expected to vary drastically due to climate change thereby impacting productivity (Gornall et al., 2010). With the growing public concerns of food insecurity (Capitán-Moyano et al., 2023) and environmental impacts (Myers et al., 2022), mitigation of ruminal methanogenesis is a pivotal point for the future of our agriculture (Beauchemin et al., 2020).
However, methanogenesis serves as a major hydrogen (H2) sink to maintain functional microbial fermentation in the rumen (Ungerfeld, 2020). Because of the symbiotic nature of ruminant digestive physiology, merely inhibiting methanogenesis may result in the accumulation of H2 thereby inhibiting microbial fermentation and growth (van Soest, 1994). Therefore, ideal means of ruminal methanogenesis inhibition should not only inhibit the methanogenesis pathways but also account for the vacant niche space of H2 sink due to the absence of methanogenesis. One strategy to achieve such simultaneous inhibition and replacement would take advantage of the thermodynamics and kinetics of enzymes involved in microbial biochemistry so that thermodynamic inhibitors act as alternative H2 sinks while a enzymatic inhibitor directly inactivates a methanogenic molecule.
Thermodynamics dictates the favorability of a reaction while kinetics corresponds to reaction rates, which are governed by the underlying enzymatic mechanisms (Kohn and Boston, 2000; Ungerfeld, 2020). Hence, a thermodynamic inhibitor would be an electron acceptor that competes with methanogenesis for available H2 (Kohn and Boston, 2000; Ungerfeld and Kohn, 2006). Conversely, an enzymatic inhibitor exerts its effect by inhibiting an enzyme or cofactor (Ungerfeld and Kohn, 2006). Enzymatic inhibition is reported to be the most efficacious among numerous anti-methanogenic strategies (Chalupa, 1977; Goel et al., 2009; Matsui et al., 2020). Based on the above strategies, we hypothesized that 1) methane inhibition via thermodynamics is dose-dependent whereas methanogenesis inhibition by an enzymatic inhibitor is dose-independent; 2) combinations of thermodynamic inhibitors offer an additive anti-methanogenic effect; and 3) combination of thermodynamic and enzymatic inhibitors inhibit methanogenesis and redistribute H2 to other fermentation end products.
Our objective was to determine the effect of four feed additives on CH4 production by in-vitro cultures of mixed ruminal microbes. Sodium nitrate (NaNO3), sodium sulfate (Na2SO4), and 3-nitro-1-propionate (3NPA) were used as thermodynamic inhibitors, while bromochloromethane (BCM) was used as an enzymatic inhibitor. A total of 4 experiments were conducted. In experiments 1 and 2, individual additives were evaluated at three inclusion levels. In experiment 3 and 4, the highest level of individual additives from previous experiments was used to determine the combined effect of the additives. The effect of additive treatments was evaluated at three different energy levels achieved by varying the forage to concentrate ratio of the basal diets, which consisted of alfalfa pellets and a concentrate mix.
2 Materials and methods
2.1 Additives and basal diets
Four independent experiments were conducted to test the effectiveness of individual and combined additions of NaNO3 (Sigma-Aldrich; purity ≥ 99.0%), Na2SO4 (EM Science; purity ≥ 99.0), 3NPA (Cayman Chemical Company; purity ≥ 95.0%), and BCM (Chem Service Inc.; purity = 100) on inhibiting CH4 in batch cultures of mixed ruminal microbes. Experiments 1 and 2 assessed the effect of independent additives included at four levels (DM basis). The additive treatments were as follows: control (no additive), NaNO3 at 7, 14, & 28 g/kg, and Na2SO4 at 3, 6, & 12 g/kg in experiment 1; and control, 3NPA at 0.5, 1.0, & 2.0 g/kg, and BCM at 0.075, 0.15, & 0.30 g/kg in experiment 2. Doses of NaNO2 (Patra and Yu, 2014; Nguyen et al., 2015), Na2SO4 (van Zijderveld et al., 2010; Patra and Yu, 2014; Gupta et al., 2017), 3NPA (Ochoa-García et al., 2019), and BCM (Tomkins et al., 2009; Abecia et al., 2012) were determined based on literature as cited. Based on the results of experiments 1 and 2, we determined the inclusion levels and combinations for experiments 3 and 4 and assessed the effect of combined additives included at one level as follows: control (no additive); NS(28 g/kg of NaNO3, 12 g/kg of Na2SO4); NSP (NS + 2.0 g/kg of 3NPA); and NSPB (NSP + 0.30 g/kg of BCM). The stock solutions of the above additives were dissolved in deionized H2O, except for BCM, which was dissolved in methanol (Supplementary Table S1).
Basal diets consisted of ground alfalfa hay and concentrate mix in three proportions as follows: (1) 70:30 high forage (HF); (2) 50:50 medium forage (MF); and (3) 30:70 low forage (LF). The concentrate mix consisted of a mixture of ground corn, soybean meal, and vitamin and mineral mix. The ingredients and chemical composition of the basal diets are presented in Table 1. Basal diets were designed to provide varying levels of energy from alfalfa and concentrate mix, which averaged 2.28, 2.35, and 2.42 Mcal of ME/kg DM in HF, MF, and LF diets, respectively (National Research Council, 2001). Basal diets (~1.0 g) were quantitatively weighed and placed in 100-mL glass culture bottles in duplicate. The same batches of ground alfalfa and concentrate mix were utilized for all four experiments. On the day of inoculation, respective additive treatments were quantitatively included in the culture bottles. All experiments were repeated twice in separate batch runs for statistical analysis (n = 2). For experiments 1 and 2, the first and second batch runs were conducted in summer and fall of 2021, respectively. For experiments 3 and 4, both batch runs were conducted at the same time in winter of 2022.
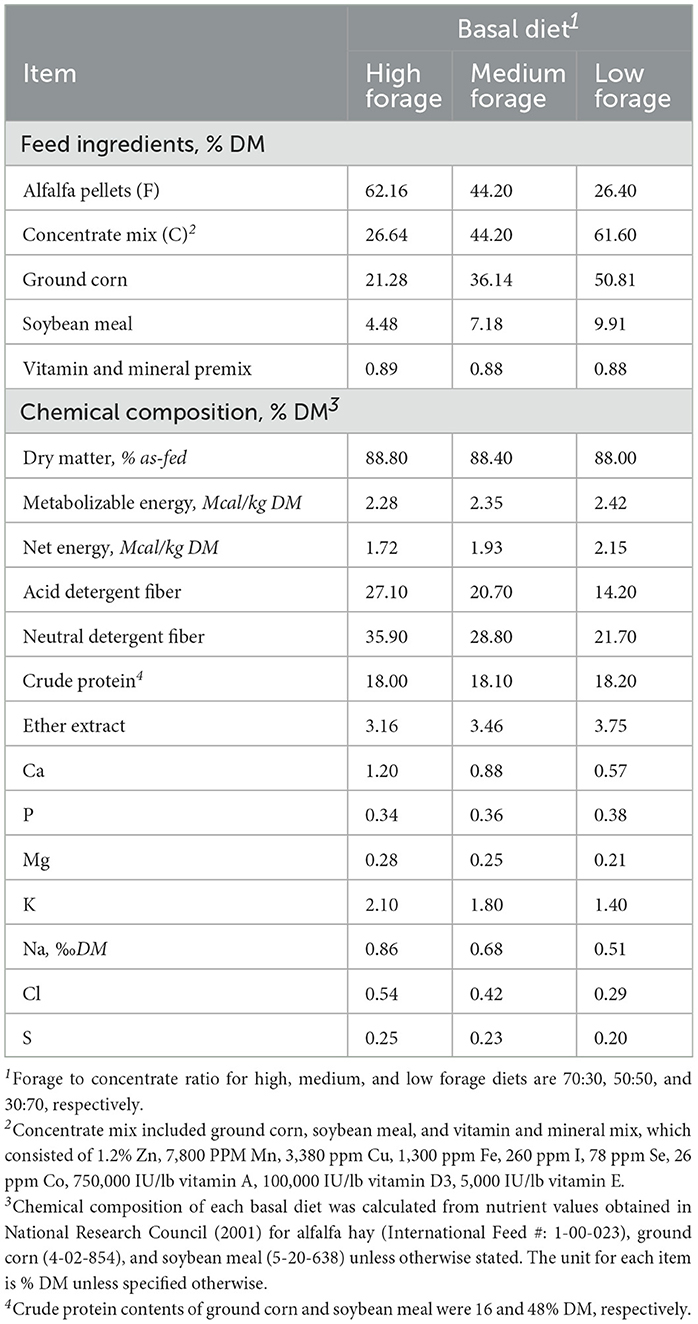
Table 1. Ingredients and chemical composition of three basal diets (high, medium, and low forage) on a dry matter basis (DM).
2.2 Rumen fluid collection and inoculation
Rumen contents were collected from a cannulated Hereford steer (Bos taurus) fed a basal diet, which consisted predominantly of orchardgrass pasture, throughout the experimental period. The steer was housed at the NCSU Metabolic Unit. The surgery protocol and animal handling procedures were approved by the North Carolina State University Institution of Animal Care and Use Committee (Approval No. 23-163). Whole ruminal contents (approximately 6 L) were obtained 2h postprandially, transported to the lab in pre-heated vacuum containers and squeezed through a double-layered cheesecloth. The strained ruminal fluid was used to inoculate culture bottles. Rumen inoculum was prepared by mixing rumen fluid and artificial saliva in a 1:2 ratio (Gawad and Fellner, 2018). The artificial saliva was prepared according to the ruminant saliva composition as previously outlined by McDougall (1948) and Slyter et al. (1966) and consisted of NaHCO3, NaH2PO4•H2O, NaCl, KCl, CaCl2•2H2O, MgCl2•6H2O, and Urea. Thirty mL of rumen inoculum were added to each fermentation bottle (nominal volume = 100 mL) that contained 1.0 g of feed substrate and the additive treatments. Culture bottles were flushed with a continuous stream of CO2 prior to and during inoculation to maintain anaerobicity. Immediately following the inoculation, the bottles were sealed with rubber-lined septum caps and incubated in a water bath at 39°C. After 0, 6, 12, and 24h of fermentation, respective culture bottles were transferred to an ice bath to terminate further microbial activity. The 12h time point was not measured in experiment 3 and 4 based on experiments 1 and 2.
2.3 Chemical measurements
We measured CH4, H2, pH, ammonia-N (NH3), and short-chain fatty acids (SCFAs). At the end of 0, 6, 12, and 24 h, and prior to opening the bottles, a gas sample was taken from the headspace and immediately analyzed for CH4 and H2. Gas samples (10 μL) were withdrawn directly from the headspace with the aid of a gas tight syringe (Hamilton Co., Reno, NV) and analyzed using a gas chromatograph (model CP-3800; Varian, Walnut Creek, CA) equipped with a stainless-steel column packed with Molsieve 5A 45/60 mesh (Supelco Inc., Bellefonte, PA) as well as the flame ionization detector for the detection of CH4 and the thermal conductivity detector for H2. Seventy mL of headspace in the bottle allowed for the collection of gas, and the rubber-lined septum cap for retaining the gas in the headspace while taking samples. The expressions of both CH4 and H2 concentrations (in mM and μM, respectively) are based on the headspace volume of 70 mL (0.07 L). Area counts from 10 μL injections of CH4 (770191.76) and H2 (98.35) standard gases were used to calculate the concentration (reported as mM for CH4 and μM for H2) of the respective gas in a sample using the following formula (Equation 1) given the gas constant that 1 mol of gas occupies 22.4 L (and the units were converted from M to mM or μM for CH4 and H2, respectively):
After the headspace gas measurement, pH of the culture fluid in the bottle was measured with a pH probe (VWR SympHony—model AR25; Accumet Research, Dual Channel pH/Ion Meter Fisher Scientific). Following pH measurements, culture contents were transferred to a tube and centrifuged at 500 xg for 5 min at 4°C to separate the solid digesta from the liquid. Four mL aliquots of supernatant were transferred to two 5.0-mL centrifuge tubes and kept in a freezer at -80°C for subsequent NH3 and SCFA measurements and DNA extraction. After thawing the 4.0-mL aliquots, two 1.0-mL aliquots were transferred into separate microcentrifuge tubes for NH3 and SCFA analyses.
Ammonia-N was analyzed using the colorimetric procedure outlined by Beecher and Whitten (1970). Standards containing 0, 4, 8, 12, and 16 μg/mL of NH3-N were prepared to generate a standard curve. Culture samples were centrifuged at 21,000 xg for 15 minutes at 4°C to separate any remaining solid particles from the liquid. For the analysis, 5.0 μL of sample or standard were transferred, in duplicate, into glass tubes. Each tube received 100 μL of deionized water, and 0.5 mL of phenol and sodium hypochlorite reagent. The samples and standards were allowed to react for 30 minutes at room temperature. Following 30 min, 4.0 mL of deionized water was added, and the sample was transferred into a cuvette. Absorbance was measured at a wavelength of 630 nm. The standards were used to determine the concentration of unknown samples.
Short chain fatty acids were measured as previously described by Eun et al. (2004) using gas-liquid chromatography (model CP- 3380; Varian, Walnut Creek, CA) equipped with a fused silica capillary column, 30 m × 0.25 mm with 0.25-μm film thickness (NukolTM; Superlco Inc., Bellefonte, PA). One mL aliquots of culture contents were frozen, thawed, and centrifuged at 21,000 xg for 15 min at 4°C to separate remaining solid particles from the liquid. The 1.0-mL sample aliquot was treated with 0.2 mL of a metaphosphoric acid, which included 2-ethylbutyrate as internal standard. The sample was then centrifuged at 21,000 xg for 5 minutes at 4°C, and the supernatant was transferred into a GC vial. The column used in this study detected acetate, propionate, butyrate, valerate, and the isoacids (isobutyrate and isovalerate; we did not measure 2-methylbutyrate, but our results would include it in the isovalerate estimate).
Using the CH4, H2, and SCFA values measured, theoretical amount of hexose metabolized, production of metabolic hydrogen, recovery of metabolic hydrogen in fermentation end-products and in cells, and the total metabolic hydrogen recovery were calculated using the equation provided by Marty and Demeyer (1973). Additionally, dissolved H2 concentrations were estimated using the equation provided by Wang et al. (2016) though the authors highlight the limitation of this estimation. Data were normalized by subtracting the values from the rumen fluid blanks (i.e., rumen inocula without substrates, sacrificed at 0h) from those of samples at 6, 12, and 24h.
2.4 DNA sequencing
For DNA sequencing, the following criteria were used to select samples: control and highest level of inclusion; high- and low-forage diets; and incubation of 0 and 24h. This resulted in a total of 88 samples. To facilitate the lysis of microbial cells, an enzymatic lysis mixture was prepared, containing 200 μL of Lytic Enzyme Solution (Qiagen) and 400 μL of MetaPolyzyme (Millipore Sigma MAC4L-5MG), mixed in 19,400 μL of PBS, following the protocol outlined by Maghini et al. (2021). Samples containing 4.0 mL of ruminal fluid were thawed and centrifuged at 12,000 xg for 5 mins at 4°C to separate solid particles from the liquid phase. Supernatant was removed and 200 mL of the enzymatic lysis mixture was added to each sample. The samples were then incubated at 37°C for 1h. After the incubation, microbial DNA was extracted using a Zymo Quick-DNA Fungal/Bacterial Miniprep Kit (Zymo Research), following the manufacturer's protocol.
The concentration of extracted DNA in each sample was measured by UC/Vis spectroscopy using a NanoDrop spectrophotometer (Thermo Fisher Scientific). The DNA concentrations in the samples were standardized to approximately 30 ng/μL of DNA, which was then amplified via polymerase chain reaction (PCR). For PCR, Q5 DNA Polymerase and the following three primer pairs were included separately (i.e. one primer pair per PCR) at 1.25 μL each for forward and reverse primers with Illumina p5 and p7 adapters, respectively (Supplementary Table S2): 515F-806R for universal 16S rRNA gene V4 hypervariable region (Walters et al., 2016); 516F-915R for archaea-specific 16S rRNA gene V4-V5 hypervariable region (Raymann et al., 2017); and ITS3F-ITS4R for fungal ITS2 region (White et al., 1990). For the 515F-806R and 516F-915R primer pairs, the thermocycling conditions included denaturation at 98°C for 15 sec, annealing at 55°C for 20 sec, and extension at 72°C for 15 sec in 35 cycles. For ITS3F-ITS4R primer pair, the thermocycling conditions included denaturation at 98°C for 15 sec, annealing at 65°C for 20 sec, and extension at 72°C for 15 sec in 35 cycles.
The DNA templates were purified with AMPure XP beads (Beckman Coulter, Inc.). Four μL of the purified PCR products were mixed with 25 μL of Q5 DNA Polymerase, 11 μL of nuclease-free H2O, and 10 μL of IDT for Illumina DNA/RNA UD Indexes. The prepared libraries were purified with AMPure XP beads (Beckman Coulter, Inc.). The libraries were pooled at 10:1:1 for universal 16S rRNA, archaea-specific 16S rRNA, and fungal ITS2 amplicons, respectively, and sequenced on Illumina MiSeq using a MiSeq v3 2x300bp paired end flow cell (20M reads) in the Genomic Sciences Laboratory at North Carolina State University.
2.5 Bioinformatics
Sequence data were first processed using Cutadapt (Martin, 2011) to separate reads into three separate FASTQ files based on the primer sequence present, resulting in three sets of sequence reads: universal 16S, archaea-specific 16S, and fungal ITS datasets. A custom bash script was created to run the Cutadapt program and to count the number of reads in each of the original and new FASTQ files. Each dataset was then processed following the DADA2 pipeline (Callahan et al., 2016) in R version 4.3.0 (R Core Team, 2023) using RStudio (Posit team, 2023) to infer amplicon sequence variants (ASVs) and assign taxonomy, i.e. the standard DADA2 pipeline for universal and archaea-specific 16S amplicon sequences and the ITS DADA2 pipeline for fungal ITS2 amplicon sequences. For ASVs in the universal and archaea-specific 16S datasets, Silva version 138 reference database was utilized (Quast et al., 2013; Yilmaz et al., 2014). For ASVs in the fungal ITS dataset, UNITE general FASTA release for Fungi 2 was used (Abarenkov et al., 2022).
The ASV and taxa tables from the three separate runs through the DADA2 pipelines were merged for sequence alignment and phylogenetic information inference using the DECIPHER (Wright, 2016) and phangorn (Schliep, 2011) packages, respectively. The NCSU High Performance Computing Hazel Cluster was utilized for this step due to the computational requirements. The ASV, taxonomy assignment, sequence, and phylogenetic information was compiled into a phyloseq (McMurdie and Holmes, 2013) object for downstream analyses.
For alpha diversity, Chao1 diversity, Shannon diversity, and Simpson diversity indices were estimated on the ASV level. For further downstream analyses, ASVs were filtered to the abundance and prevalence of more than 3 (i.e. ASVs only present in more than 3 counts and samples). Beta diversity was estimated on centered-log ratio transformed abundance data using the Bray-Curtis dissimilarity and weighted UniFrac distance as measurements of dissimilarity. To ordinate these dissimilarity and distance measurements, principal coordinate analysis (PCoA) was performed.
From the filtered sequences, pathway abundances were predicted using PICRUSt2 (Douglas et al., 2020). The predicted metagenomic functional data were imported into R and used as a TreeSummarizedExperiment (Huang et al., 2021) object for statistical analysis.
2.6 Statistical analysis
Data from above measurements and estimations were analyzed according to a completely randomized block design using a mixed model using the following R packages: lme4 (Bates et al., 2015), lmerTest (Kuznetsova et al., 2017), and emmeans (Lenth, 2023) including polynomial contrasts for linear and quadratic trend of the level effect. Data from 6, 12, and 24h were analyzed separately. Thus, the model included treatment and diet as fixed effects while the replicate variable nested within the batch run as a random effect. Thus, the model is represented by:
where
yijkl = each response variable measured,
β0 = overall mean,
βixi = fixed effect of additive level or treatment,
βjxj = fixed effect of diet,
βijxij = interaction term of additive level or treatment and diet fixed effects,
γk(l) = random effect of replicate nested within run,
ϵijkl = residuals.
For alpha and beta diversity, the RRPP package (Collyer and Adams, 2018) was used for permutational analysis of variance (PERMANOVA). To analyze the relative abundance of archaeal taxa, untransformed abundance data were transformed to relative terms, which were then used as the response variable in the above mixed model. For differential abundance analysis of microbial taxa as well as predicted pathways, the ANCOMBC package was used to conduct the analysis of compositions of microbiomes with bias correction 2 (ANCOM-BC2) (Lin and Peddada, 2020; Lin et al., 2022). Only the individual fixed effects of treatment and diet were included in the model for this analysis because the interaction term could not be included due to the sample size requirement of the ANCOM-BC2 algorithm. The Benjamini-Hochberg adjustment was used as a p-value adjustment method (padj) for multiple hypothesis tests.
Significant effects were declared at p-value ≤ 0.05 and tendencies at p-value ≤ 0.10. The analyzed data were visualized in figures using the following R packages: tidyverse (Wickham et al., 2019) and ggpubr (Kassambara, 2023).
3 Results
3.1 Experiment 1—In-vitro fermentation profile
Effects of diets and additives in experiment 1 are reported in Tables 2, 3, Supplementary Tables S3–S6, Figure 1A. There was an interaction between time and treatment (p < 0.001) in all experiments; results are shown by time. The pH values in control cultures ranged from 5.9 at 6 h to 5.2 at 24 h. Total SCFA concentrations at 24h were similar (p > 0.10) in control cultures (Table 3). Acetate decreased and butyrate increased as dietary concentrate increased (Table 3). But proportions of propionate were not affected (p > 0.10). Molar proportions of valerate and isoacids were not affected by diet.
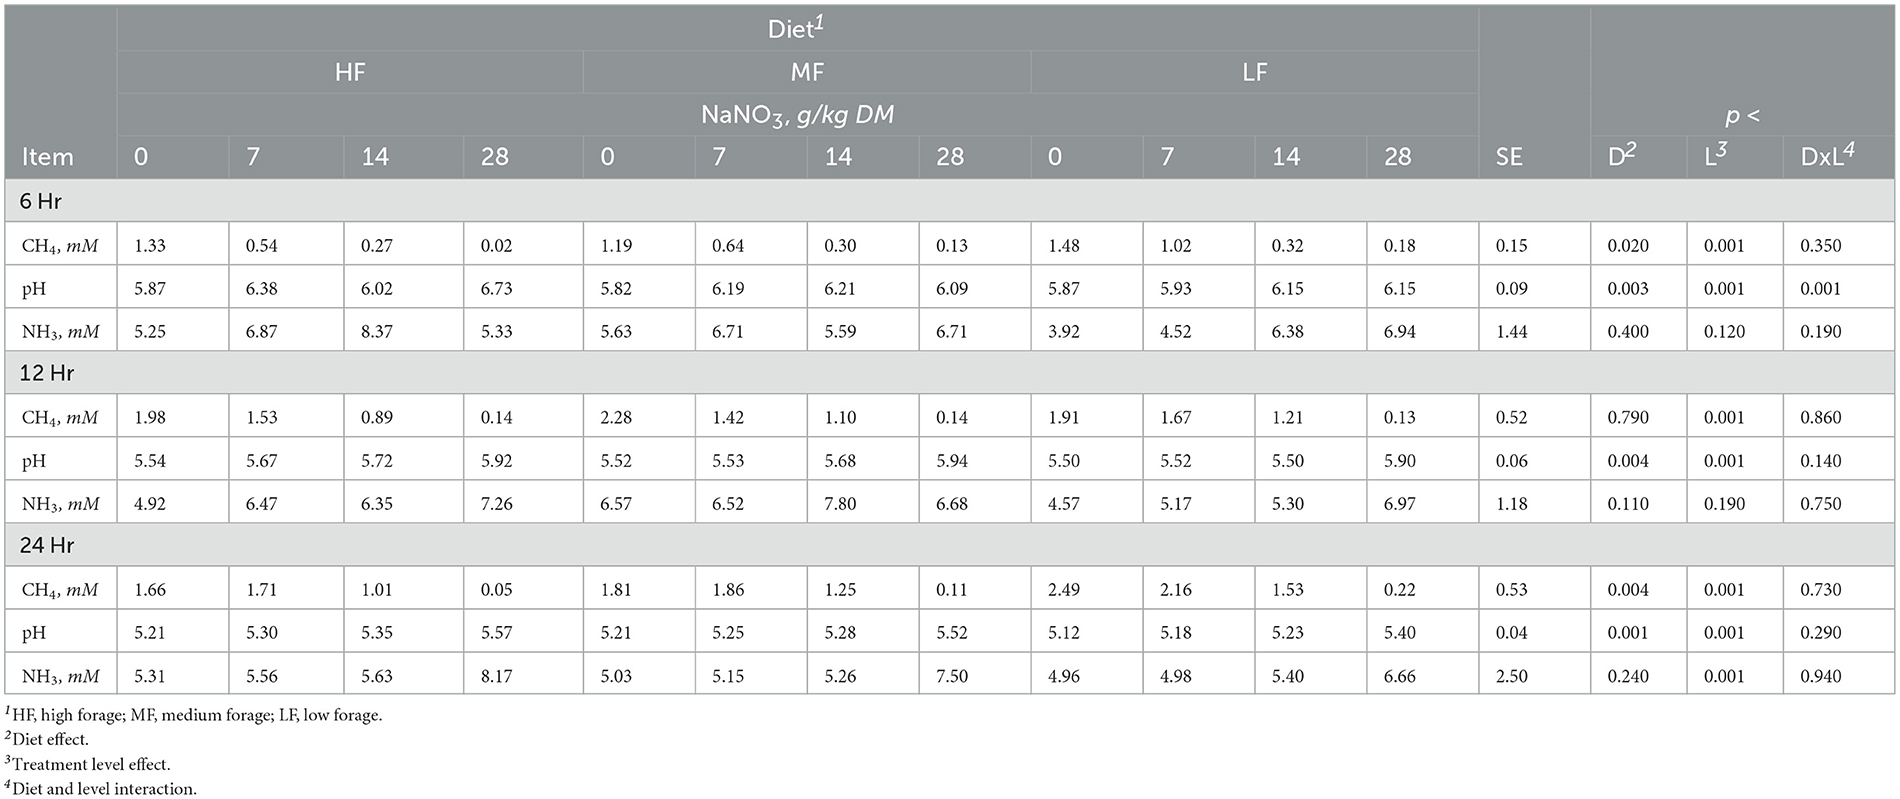
Table 2. Effect of sodium nitrate (NaNO3) on methane (CH4), pH and ammonia (NH3) after 6, 12, and 24h of incubation with rumen microbes in an in-vitro mixed batch culture system fed varying forege:concentrate (HF = 70:30, MF=50:50, and LF = 30:70) in experiment 1.
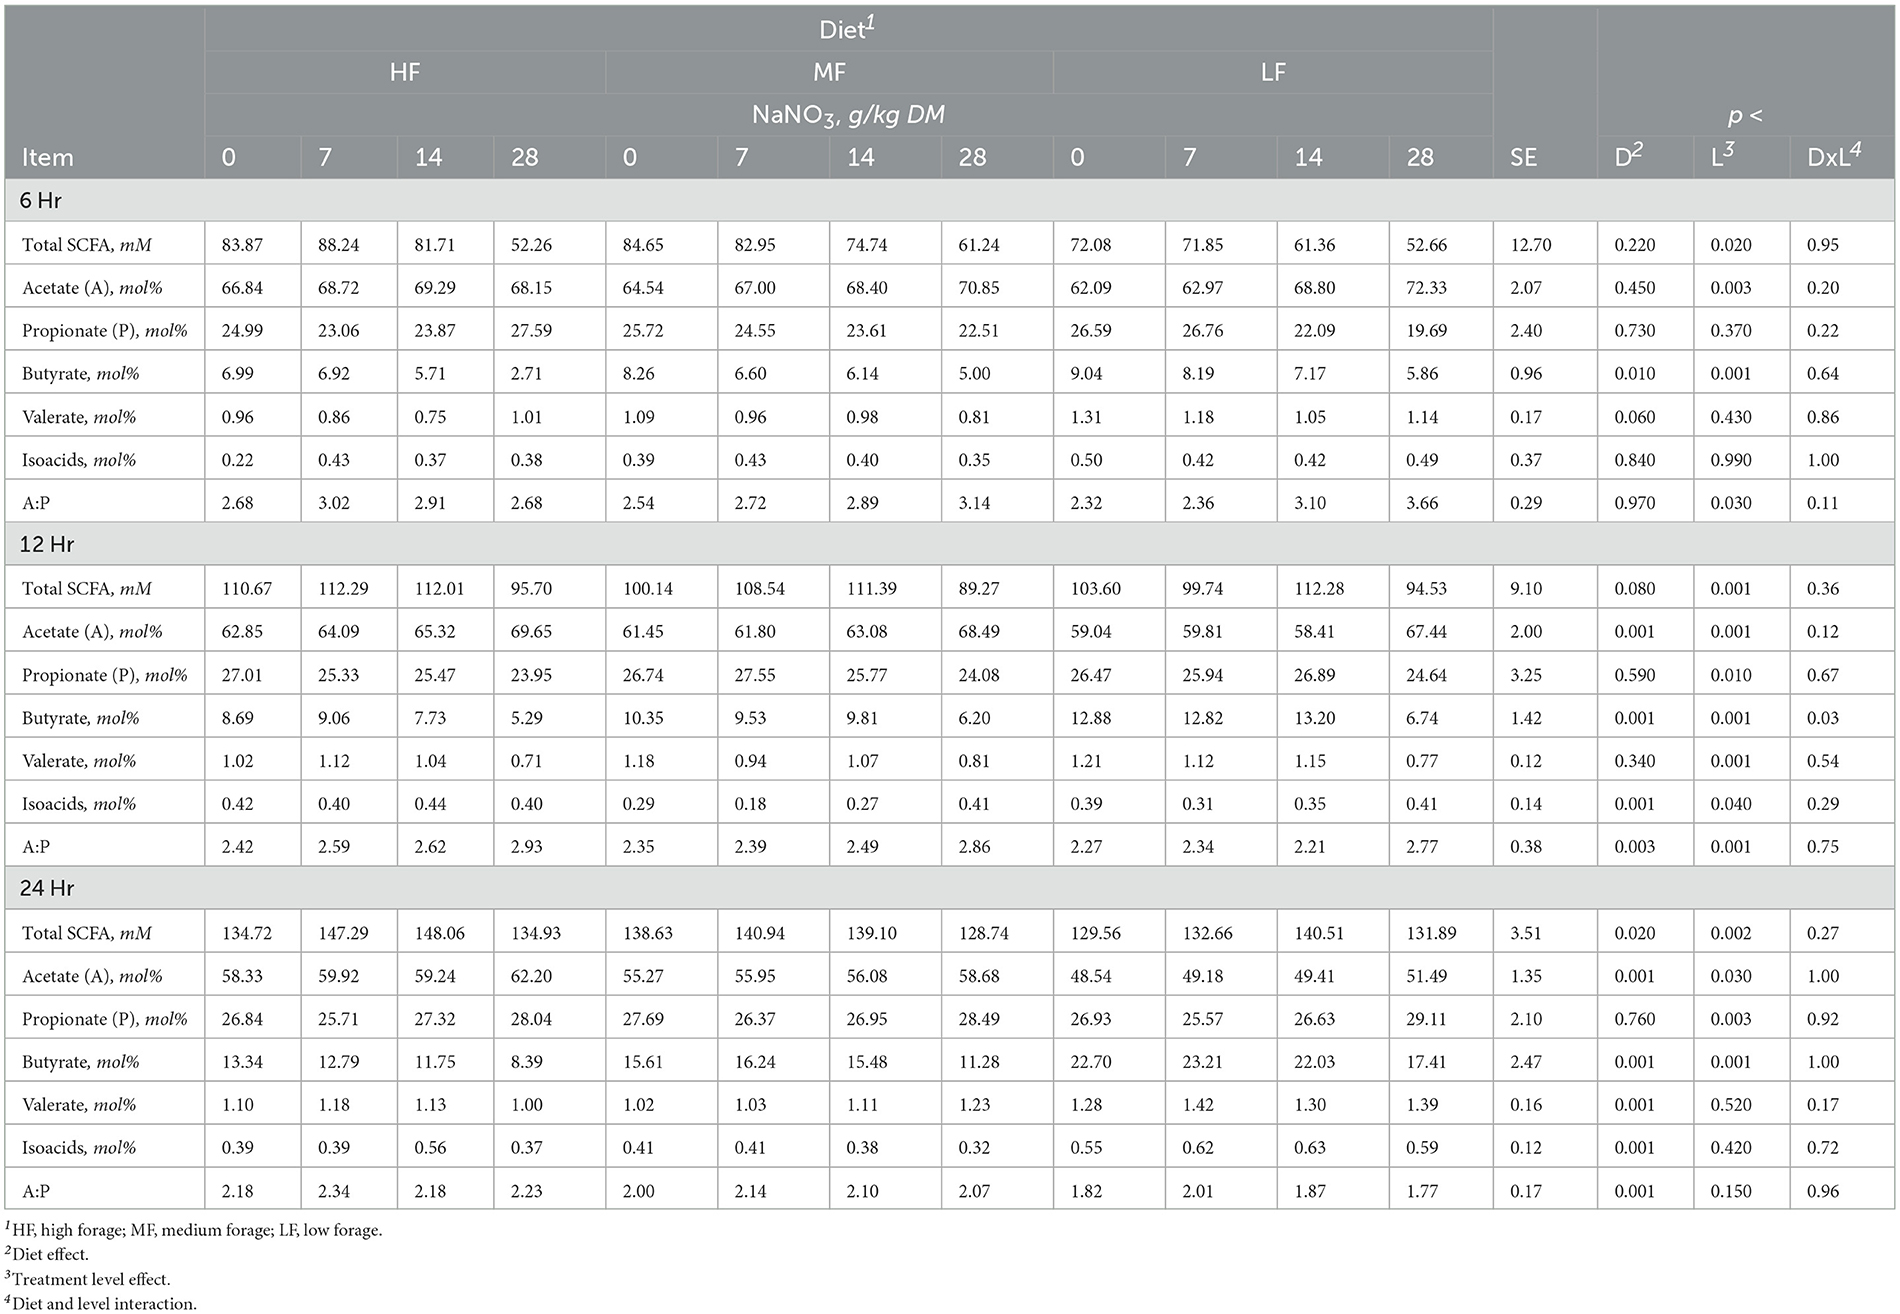
Table 3. Effect of sodium nitrate (NaNO3) on short chain fatty acids (SCFA) after 6, 12, and 24h of incubation with rumen microbes in an in-vitro mixed batch culture system fed varying forege:concentrate (HF = 70:30, MF = 50:50, and LF = 30:70) in experiment 1.
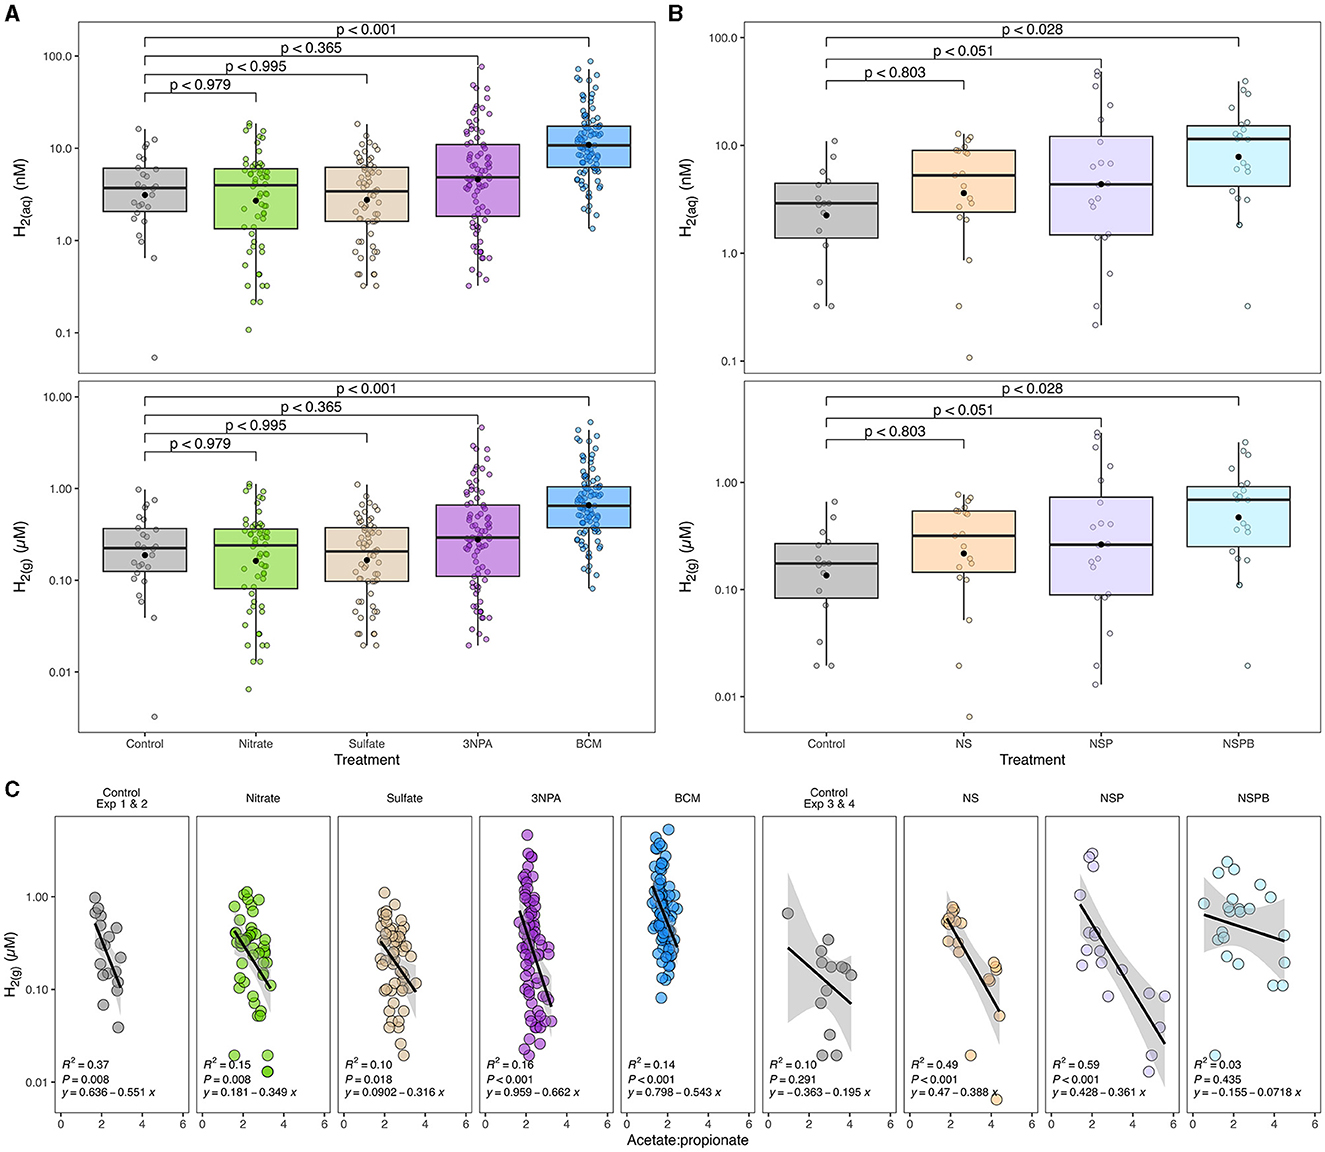
Figure 1. Effects of individual (A) and combined (B) sodium nitrate (Nitrate; N), sodium sulfate (Sulfate; S), 3-nitro-1-propionate (3NPA; P), and bromochloromethane (BCM; B) on gaseous and estimated dissolved hydrogen concentration (H2(g) μM and H2(aq) nM, respectively) and its correlation with acetate-to-propionate ratio (C). Dissolved H2 was estimated as outlined in Wang et al. (2016). In (A, B), the black filled point within each box plot represents the mean. The y-axes of the three figures are presented on log10 scale. Data are representative of all incubation periods (6, 12, and 24h) and diet (varying forege:concentrate, 70:30, 50:50, and 30:70) with rumen microbes in an in-vitro mixed batch culture system.
At 6h, there was an interaction (p < 0.001) between inclusion level of NaNO3 and diet on culture pH. At 24h, NaNO3 decreased (p < 0.01) CH4 irrespective of diet. The decrease was more than 90% and greatest at the highest level of inclusion. In contrast, NaNO3 increased (p < 0.01) culture pH and NH3 irrespective of diet (Table 2).
Sodium nitrate inclusion levels increased acetate and valerate and decreased butyrate in a linear manner (all at p < 0.001). Nitrate supplementation also had a linear effect (p < 0.004) on total SCFA that increased at the 7 and 14 g/kg DM inclusion levels and remained similar to the control at the 28 g/kg DM level. Acetate molar proportions increased linearly (p < 0.001) while butyrate molar proportions decreased linearly (p < 0.001). Molar proportions of propionate increased at the 28 g/kg DM inclusion level of NaNO3 (p < 0.005; Table 3).
Sodium sulfate had a diet by treatment interaction with respect to CH4, pH, and NH3 at 24h (p < 0.02, 0.05, and 0.04, respectively). Methane decreased in HF diet and increased in MF but in LF diets, the 3 g/kg DM level increased CH4 while the 6 and 12 g/kg DM levels decreased CH4 (Supplementary Table S3). Culture pH and NH3 increased in HF diet and decreased in MF and LF diets. Propionate decreased (p < 0.04) with the inclusion of 6 and 12 g/kg DM of Na2SO4 inclusion, which was also reflected in increased A:P (p < 0.02; Supplementary Table S4). Other SCFAs were not affected (p > 0.10).
The levels of NaNO3 inclusion had a linear effect (p < 0.04) on theoretical amounts of hexose metabolized at 6 and 12h (p < 0.04), on metabolic hydrogen recovered in end-products at 24h (p < 0.001), on cellular metabolic hydrogen recovery at 12 and 24h (p < 0.001) and total metabolic hydrogen recovery at 24h (p < 0.001; Supplementary Table S5).
The inclusion levels of Na2SO4 had a linear effect on theoretical hexose metabolism at 24h (p < 0.004), total metabolic hydrogen production at 12 and 24h (p < 0.01 and 0.001), end-product hydrogen recovery at 24h (p < 0.001), cellular metabolic hydrogen recovery at 6 and 24 h (p < 0.001), and total metabolic hydrogen recoveries at 24h (p < 0.001). Quadratic effects of sodium sulfate inclusion levels were observed for total metabolic hydrogen production at 6h (p < 0.03) and cellular metabolic hydrogen recovery at 12h (p < 0.02; Supplementary Table S6).
3.2 Experiment 2—In-vitro fermentation profile
Effects of diets and additives in experiment 2 are reported in Tables 4, 5, Supplementary Tables S7–S10, and Figure 1A. There was an interaction between 3NPA and diet at 24h for CH4 and pH (p < 0.005 and 0.03, respectively). In the HF diet, 0.5 g/kg of 3NPA decreased CH4 by 63% and increased pH compared to the MF and LF diets and the control. In contrast, 0.5 g/kg of 3NPA increased CH4 at the 0.5 g/kg DM level with MF diet but decreased CH4 at the 2.0 g/kg level with MF and LF diet (Supplementary Table S7). At 3NPA inclusion of 0.5 g/kg in HF, at 2.0 g/kg in MF and LF diets, culture pH was the highest within the diet. Total SCFA concentration decreased linearly (p < 0.002) with the 3NPA inclusion levels (Supplementary Table S8). Propionate decreased linearly (p < 0.02), which in turn linearly increased A:P (p < 0.001). Valerate increased (p < 0.01), and other SCFAs were not affected. At 6h, molar proportions of butyrate and valerate decreased linearly and quadratically (p < 0.001 and 0.004, respectively).
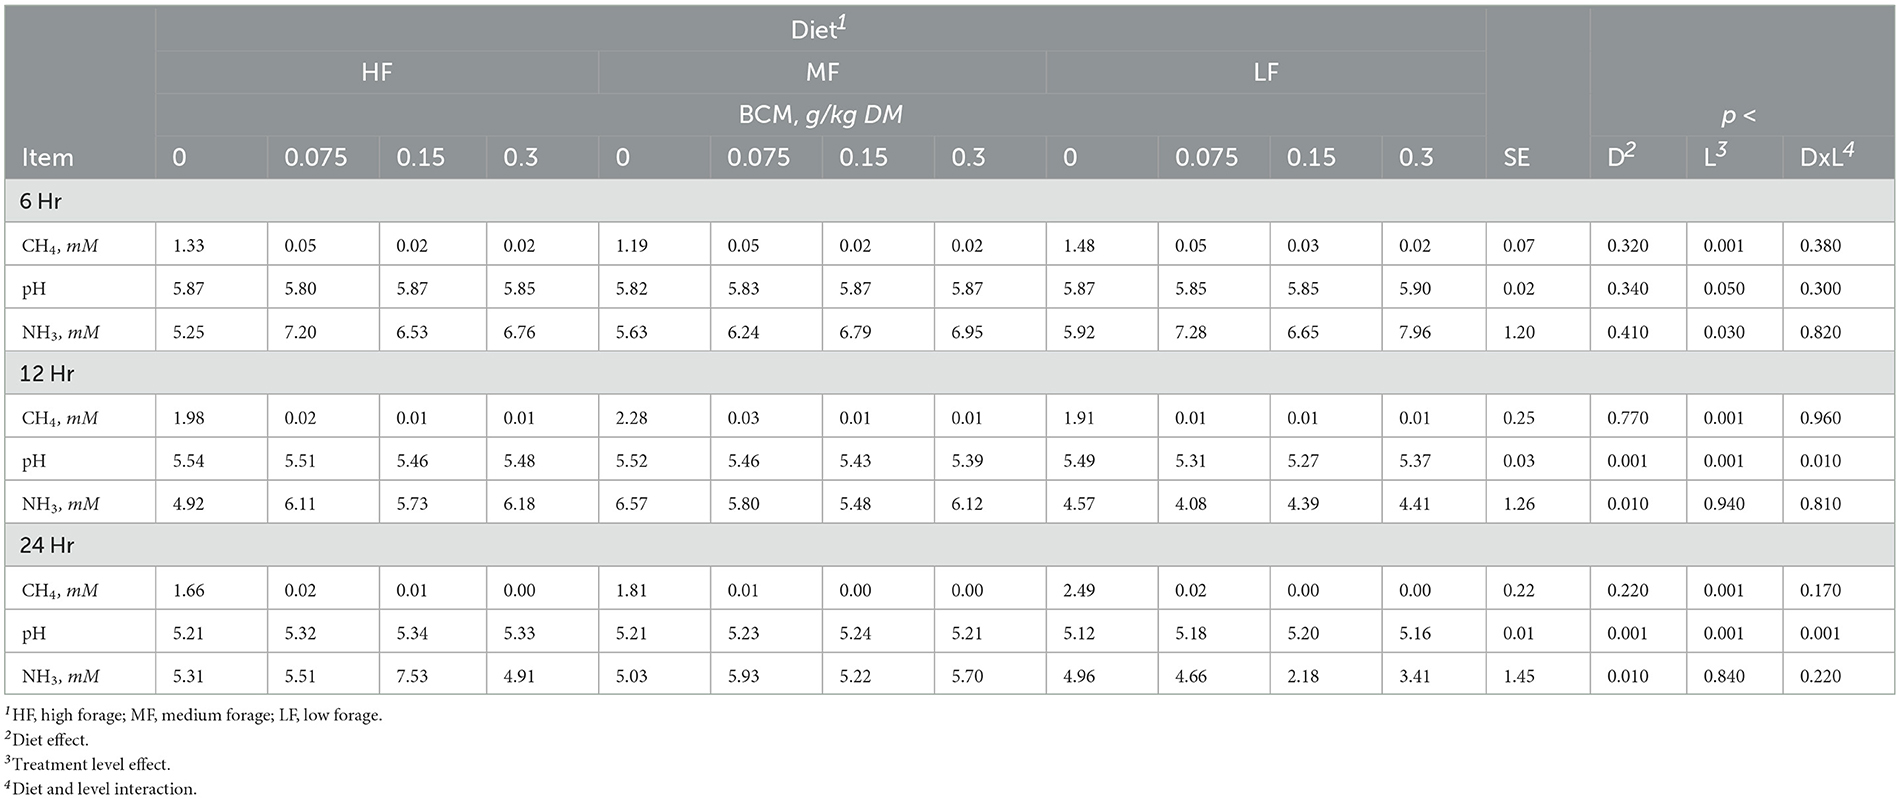
Table 4. Effect of bromochloromethane (BCM) on methane (CH4), pH and ammonia (NH3) after 6, 12, and 24h of incubation with rumen microbes in an in-vitro mixed batch culture system fed varying forege:concentrate (HF = 70:30, MF = 50:50, and LF = 30:70) in experiment 2.
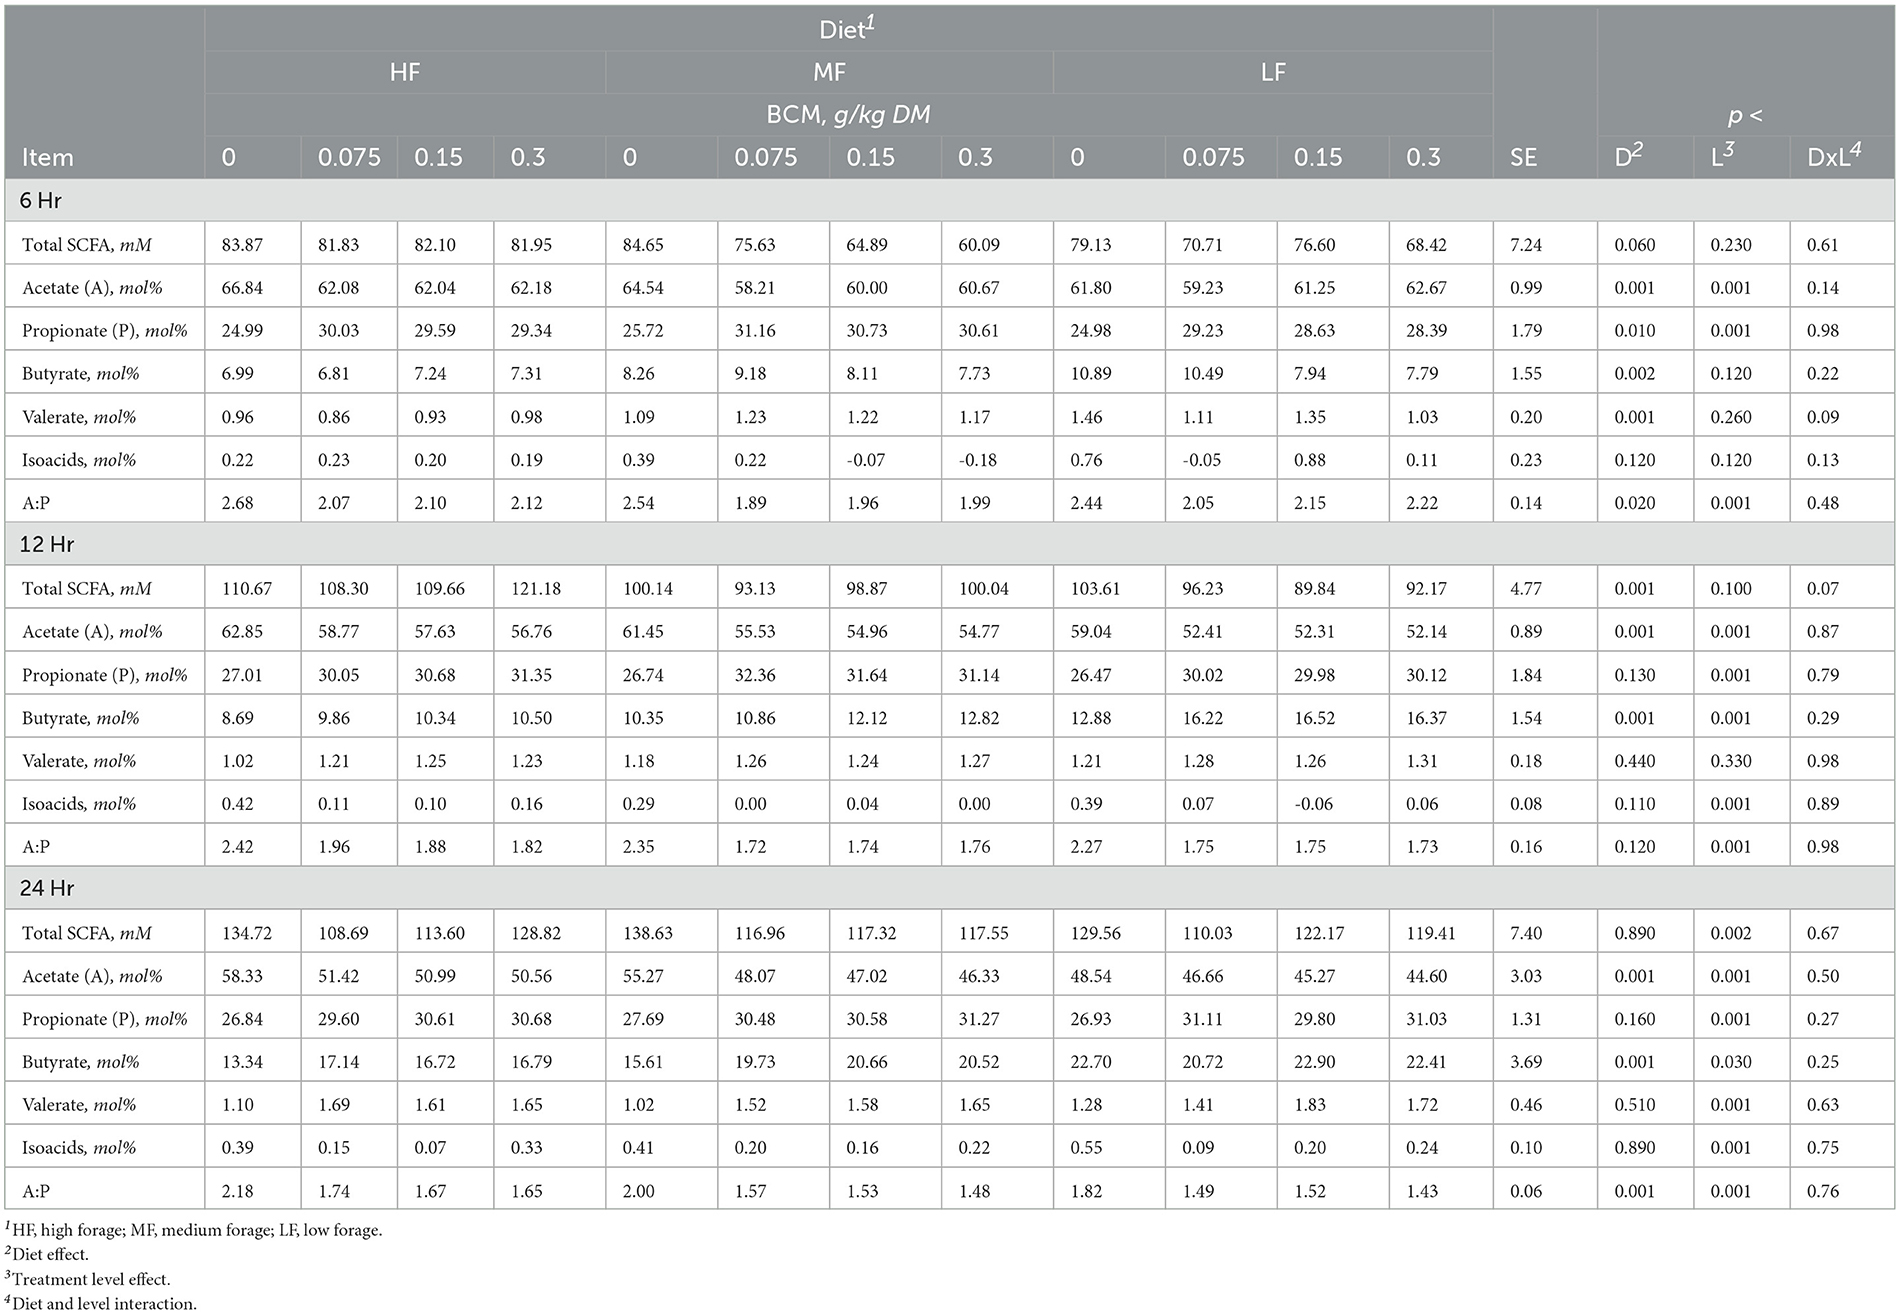
Table 5. Effect of bromochloromethane (BCM) on short chain fatty acids (SCFA) after 6, 12, and 24h of incubation with rumen microbes in an in-vitro mixed batch culture system fed varying forege:concentrate (HF = 70:30, MF = 50:50, and LF = 30:70) in experiment 2.
Methane linearly decreased with the addition of BCM at 6, 12, and 24h (at least p < 0.01; Table 4). At 12 and 24h, there was an interaction (p < 0.01 and 0.001, respectively) between inclusion level of BCM and diet on pH. Culture pH increased quadratically at 24h (p < 0.04) and linearly at 12 h (p < 0.001). Concentration of NH3 increased linearly with the BCM inclusion levels at 6 and 24h (p < 0.05 and 0.005, respectively) and quadratically at 12h (p < 0.05). Concomitantly, H2 in the BCM treatment increased (p < 0.001) when averaged across inclusion level compared to control (Figure 1A).
Total SCFA decreased (p < 0.002) with the addition of BCM at 24 h (Table 5). Molar proportion of acetate decreased (p < 0.001) while that of butyrate (p < 0.001) and propionate (p < 0.04) increased with an increase in the level of BCM inclusion. Consequently, the A:P ratio was decreased (p < 0.04) with an increase in the level of BCM inclusion. BCM increased (p < 0.05) valerate and decreased (p < 0.001) isoacids.
The levels of 3NPA had a linear effect on hexose metabolism at 6h (p < 0.04), total metabolic hydrogen production at 12 and 24 h (p < 0.001), end-product hydrogen recovery at 12 and 24 h (p < 0.01 and 0.001), cellular hydrogen recovery across all time points (p < 0.01, 0.001, and 0.001), and total hydrogen recovery at 24 h. The 3NPA levels exhibited quadratic effects on total metabolic hydrogen production and recovery (p < 0.01) at 6 h (Supplementary Table S9).
BCM had linear effects on hexose metabolism at 6 and 12 h (p < 0.05 and 0.002), end-product metabolic hydrogen recovery at 12 and 24 h (p < 0.001) and cellular metabolic hydrogen recovery at 24 h (p < 0.001) as well as quadratic effects on total metabolic hydrogen production at 6 and 12 h (p < 0.01 and 0.02), end-product metabolic hydrogen recovery at 6 h (p < 0.01), cellular metabolic hydrogen recovery at 6 and 12 h (p < 0.03), and total metabolic hydrogen recovery across all time points (p < 0.01, 0.02, and 0.001; Supplementary Table S10).
3.3 Experiments 3 and 4—In-vitro fermentation profile
Effects of diets and additives are reported in Tables 6, 7, Supplementary Table S11, Figure 1B. Methane concentration in control cultures at 24 h was similar (p > 0.10). Culture pH and NH3 in control cultures decreased as the proportion of concentrate mix increased in the diet (Table 6).
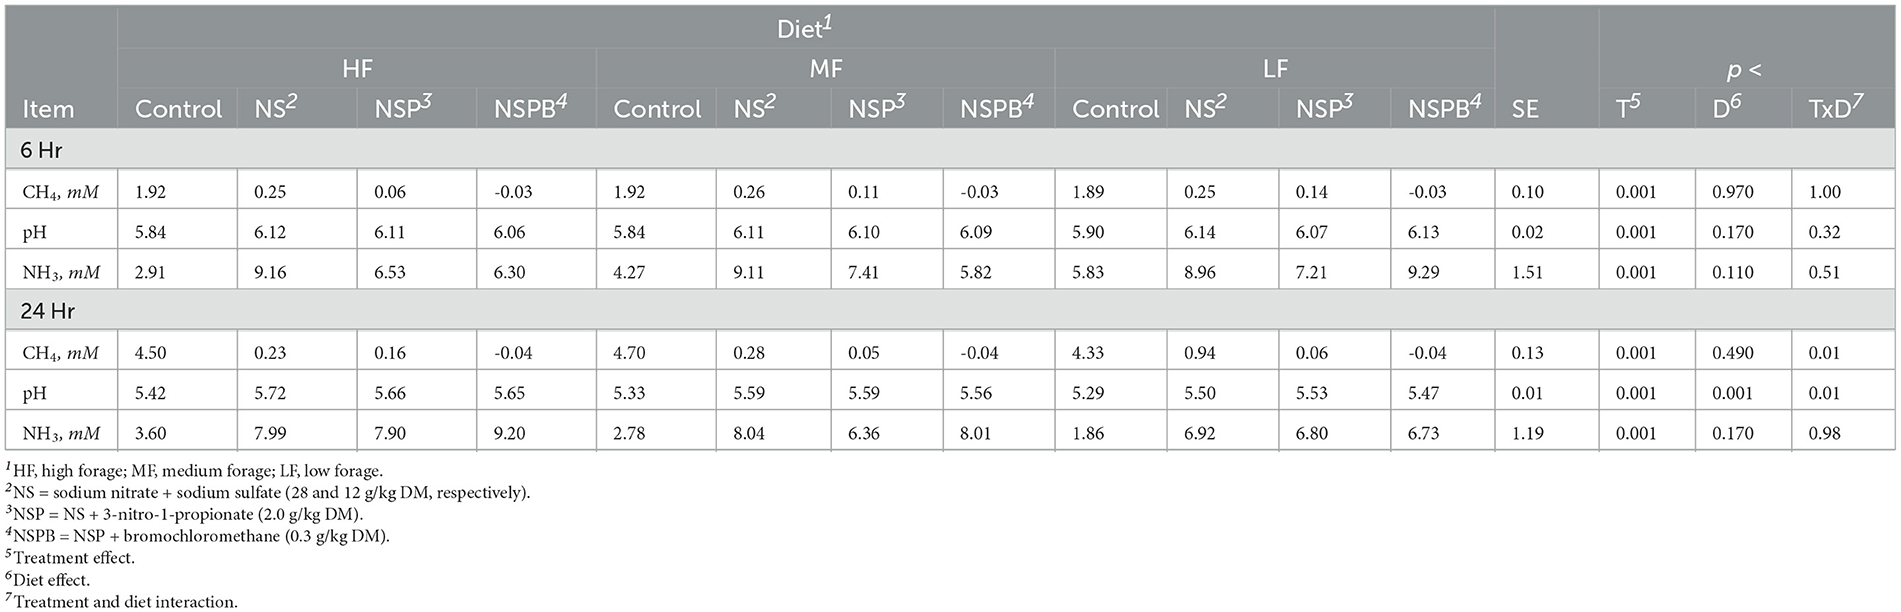
Table 6. Effects of treatments combining sodium nitrate (N), sodium sulfate (S), 3-nitro-1-propionate (P), and bromochloromethane (B) on methane (CH4), pH and ammonia (NH3) after 6, 12, and 24 h of incubation with rumen microbes in an in-vitro mixed batch culture system fed varying forege:concentrate (HF = 70:30, MF = 50:50, and LF = 30:70) in experiments 3 and 4.
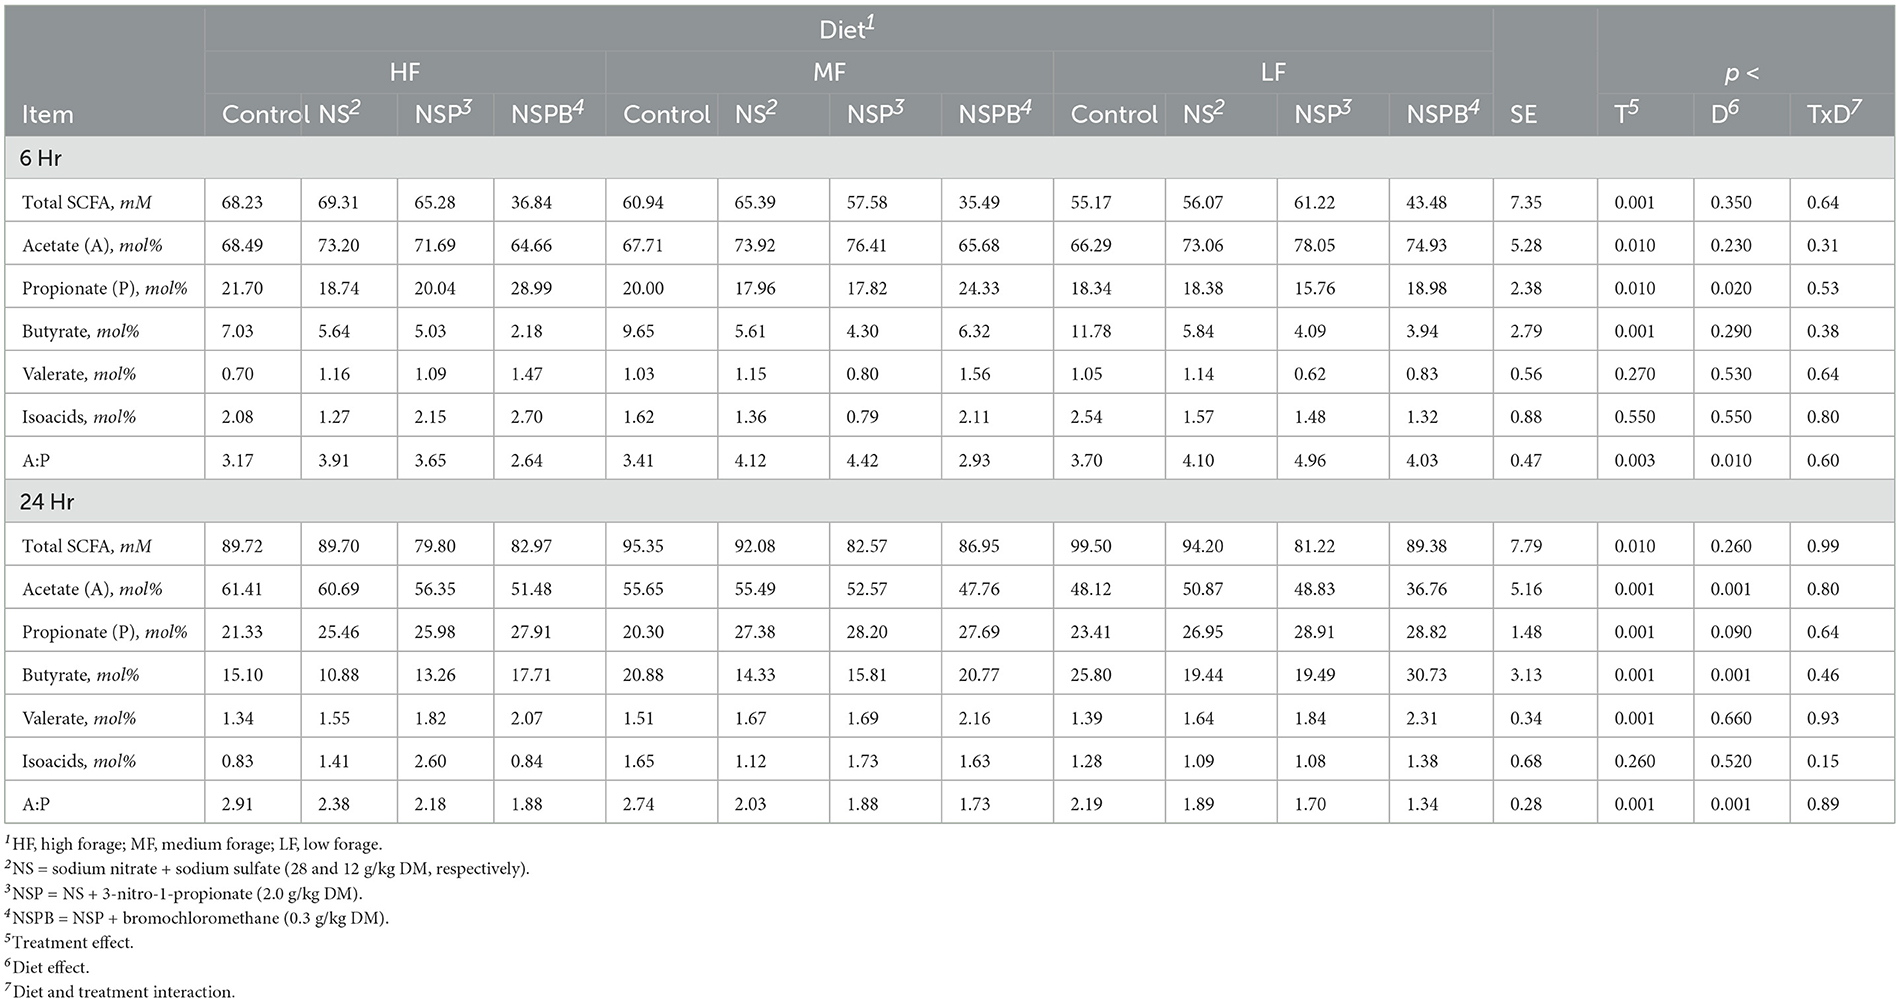
Table 7. Effects of treatments combining sodium nitrate (N), sodium sulfate (S), 3-nitro-1-propionate (P), and bromochloromethane (B) on short chain fatty acids (SCFA) after 6, 12, and 24h of incubation with rumen microbes in an in-vitro mixed batch culture system fed varying forege:concentrate (HF = 70:30, MF = 50:50, and LF = 30:70) in experiments 3 and 4.
At 24h, total SCFA in control cultures increased with an increase in the proportion of concentrate mix in the diet (Table 7). Acetate decreased and propionate and butyrate increased (p > 0.10) with an increase in dietary concentrate (Table 7). Molar proportions of valerate and isoacids were not affected (p > 0.10).
At 24h, there was an interaction between inclusion level of NaNO3 and diet on CH4 and culture pH (p < 0.01). All additive treatments decreased CH4 (p < 0.01) regardless of diet and increased (p < 0.01) pH and NH3 (Table 6). Methane decreased by 88, 97, and 99.5% on average by NS, NSP, and NSPB, respectively. Whereas the NSP treatment tended (p < 0.052) to increase H2, the NSPB increased (p < 0.028) H2 in the headspace of the culture bottles (Figure 1B).
There were significant effects (p < 0.01) of additives on fermentation profile. Diet had no effect (p > 0.10) on total SCFA. When averaged across diets, NSP decreased total SCFAs when compared with control (p < 0.007) and NS (p < 0.04); both NSP and NSPB decreased acetate when compared to the control and NS. All three additive treatments increased propionate when compared with the control, resulting in a decrease (p < 0.001) in the A:P ratio (Table 7). Cultures receiving the NSPB treatment had greater butyrate than those receiving the NS and NSP treatments. All treatments increased (p < 0.001) valerate while the NSP treatment increased (p < 0.05) isoacids in the HF diet compared to the control and NSPB treatment. The theoretical estimations of hexose metabolism, total metabolic hydrogen production, end-product, cellular, and total metabolic hydrogen recoveries were affected by the additive combinations (at least p < 0.01 across all of these estimations; Supplementary Table S11).
3.4 Amplicon sequencing data
3.4.1 Species richness and evenness (alpha-diversity) in cultures
There was no significant effect (p > 0.05) of diet, additive treatment, or interaction thereof on alpha-diversity indices (Supplementary Figures S1A, S2A). For experiments 1 and 2, only the Chao1 diversity tended to differ (p < 0.052) by treatment (Supplementary Figure S1A).
3.4.2 Community compositions (beta-diversity) in cultures
Among the control and highest inclusion levels of NaNO3, Na2SO4, 3NPA, and BCM in experiments 1 and 2, the treatment and diet individually altered the Bray-Curtis dissimilarity and weighted UniFrac distances (p < 0.05; Supplementary Figures S1B and S1C). The microbial communities between the control and NaNO3 were significantly different via the Bray-Curtis dissimilarity (p < 0.007) and weighted UniFrac distance (p < 0.001). On the other hand, the interaction term between treatment and diet changed (padj < 0.05) the Bray-Curtis dissimilarity and weighted UniFrac distances among the control and NS, NSP, NSPB treatments in experiments 3 and 4 (Supplementary Figure S2B). Microbial communities of NS (p < 0.03), NSP (p < 0.001), and NSPB (p < 0.04) treatments differed from that of the control via the Bray-Curtis dissimilarity, whereas only the NSP community differed (p < 0.003) from the control via the weighted UniFrac distance (Supplementary Figures S2B, C).
3.4.3 Differential abundance analysis of microbial taxa
Differential abundance analysis of microbial taxa between the control and respective additive treatments were conducted on the genus-species level. For this analysis via ANCOMBC2, we were only interested in the treatment effect averaged across diets. Significant results (p adj < 0.05) on the species level are shown for NaNO3, NS, NSP, and NSPB treatments in Figures 2A–D.
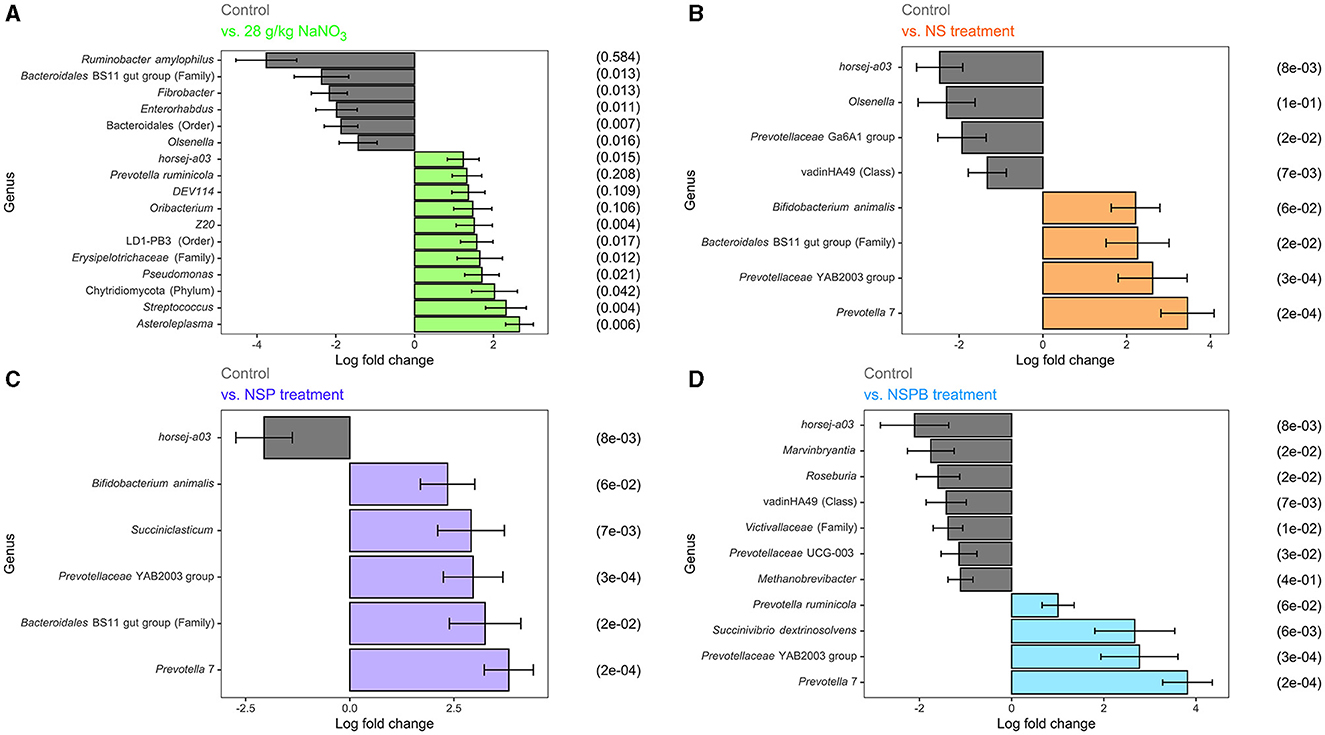
Figure 2. Effect of 28 g/kg DM sodium nitrate (NaNO3) and combination treatments with sodium nitrate + sodium sulfate (NS), NS + 3-nitro-1-propionate (NSP), and NSP + bromochloromethane (NSPB) on log fold change of microbial abundance on the species level after 24h of fermentation in vitro. Amplicon sequence variants (ASVs) were agglomerated at the lowest taxonomic level assigned. Taxonomy of these ASVs are annotated as follows. Genus and species are italicized; otherwise, the taxon of an unknown genus with its lowest available taxonomic rank (Family, Order, etc.) is indicated within parentheses. Using the ANCOMBC R package, log (ln) fold changes of differentially abundant taxa (padj < 0.05) between the control and: (A) 28 g/kg DM NaNO3; (B) combination of 28 g/kg DM NaNO3 and 12 g/kg DM Na2SO4 (NS); (C) combination of NS and 2.0 g/kg DM 3-nitro-1-propionate (NSP), and (D) combination of NSP and 0.30 g/kg DM bromochloromethane (NSPB). To the left of each subfigure is the relative abundance (%) of each taxon in the control group as a reference.
In experiments 1 and 2, the NaNO3 treatment affected the largest number of microbial taxa. On the species level, the addition of 28 g/kg of NaNO3 decreased (p adj < 0.05) the abundances of Ruminobacter amylophilus, unassigned taxa belonging to the family Bacteroidales BS11 gut group, Fibrobacter, Enterorhabdus, unassigned taxa belonging to the order Bacteroidales, and Olsenella and increased (p adj < 0.05) those of Asteroleplasma, Streptococcus, unassigned taxa belonging to the phylum Chytridiomycota, Pseudomonas, unassigned taxa belonging to the Family Erysipelotrichaceae, unassigned taxa belonging to the order LD-PB3, Z20, Oribacterium, DEV114, Prevotella ruminicola, and horsej-a03. On the other hand, the addition of 0.30 g/kg BCM increased (p adj < 0.05) Desulfovibrio and Megasphaera elsdenii. The addition of Na2SO4 and 3NPA had no effect (p adj > 0.10) on microbial taxa abundance.
In experiments 3 and 4, the addition of treatments from NS, NSP, and NSPB successively increased the number of differentially abundant microbial taxa compared to the control. The NS treatment decreased (padj < 0.05) the abundance of horsej-a03, Olsenella, Prevotellaceae Ga6A1 group, and unassigned taxa belonging to the class vadinHA49 and increased (padj < 0.05) Prevotella 7, Prevotellaceae YAB2003 group, unassigned taxa belonging to the family Bacteroidales BS11 gut group, and Bifidobacterium animalis. The NSP treatment decreased (padj < 0.05) horsej-a03 and increased (padj < 0.05) Prevotella 7, unassigned taxa belonging to the family Bacteroidales BS11 gut group, Prevotellaceae YAB2003 group, Succiniclasticum, Bifidobacterium animalis. Lastly, the NSPB treatment decreased (padj < 0.05) the abundances of horsej-a03, Marvinbryantia, Roseburia, unassigned taxa belonging to the class vadinHA49, unassigned taxa belonging to the family Victivallaceae, Prevotellaceae UCG-003, and Methanobrevibacter and increased (padj < 0.05) Prevotella 7, Prevotellaceae YAB2003 group, Succinivibrio dextrinosolvens, and Prevotella ruminicola.
3.4.4 Differential abundance analysis of predicted MetaCyc pathways
Differential abundance analyses of pathways predicted from the amplicon sequences were conducted between the control and each additive treatment via ANCOMBC2. In Experiments 1 and 2, 28 g/kg of NaNO3 decreased (padj < 0.05) the predicted pathway abundances of biotin biosynthesis II, L-glutamate degradation VIII to propanoate, TCA cycle VII of acetate-producers, and superpathway of polyamine biosynthesis I. Other additives did not affect (p adj > 0.10) pathway abundances.
In experiments 3 and 4, only the NSP and NSPB treatments affected pathway abundances. In the NSP treatment, polymyxin resistance was decreased (p adj < 0.05). The NSPB treatment decreased (p adj < 0.05) coenzyme B biosynthesis, archaetidylserine and archaetidylethanolamine biosynthesis, factor 420 biosynthesis, archaetidylinositol biosynthesis, CDP-archaeol biosynthesis, methanogenesis from H2 and CO2, 7-(3-amino-3-carboxypropyl)-wyosine biosynthesis, NAD salvage pathway II, phosphopantothenate biosynthesis II (archaea), mevalonate pathway II (archaea), and polymyxin resistance while increasing superpathway of L-arginine and L-ornithine degradation, superpathway of L-arginine, putrescine, and 4-aminobutanoate degradation, enterobacterial common antigen biosynthesis, and L-arginine degradation II (AST pathway) (Figure 3).
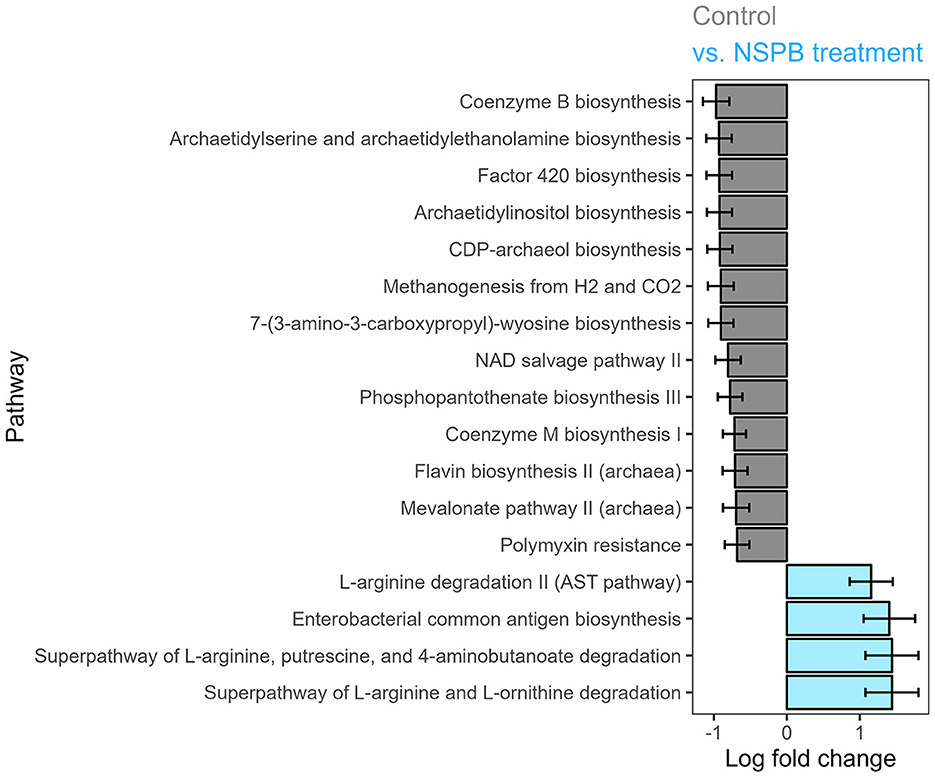
Figure 3. Effect of combination treatments with sodium nitrate (N), sodium sulfate (S), 3-nitro-1-propionate (P), and bromochloromethane (B) on log (ln) fold change of predicted MetaCyc pathway abundance on the species level after 24h of fermentation in vitro, calculated using the ANCOMBC package. Log fold changes of differentially abundant predicted pathways (padj < 0.05) between the control and combination of NaNO3, Na2SO4, 3-nitro-1-propionate, and bromochloromethane at 28, 12, 2.0, and 0.30 g/kd DM inclusion levels, respectively.
4 Discussion
4.1 NaNO3, but not Na2SO4, inhibits in-vitro methanogenesis in a dose-dependent manner
In the anaerobic condition of the rumen, the economy of reduction and oxidation is managed through the microbial transaction of electrons as the currency. Plant carbohydrates are composed of polymers of hexoses and pentoses, which are liberated through hydrolysis and further metabolized by ruminal microbes through complete and incomplete glycolytic pathways (Hackmann et al., 2017). Glycolysis requires reduction of cofactors such as NAD+ to NADH that ultimately leads to the generation of ATP and GTP as a biological form of energy through substrate-level phosphorylation and electron transport phosphorylation (Ungerfeld, 2020). Through fermentation, microbial hydrogenases oxidize reduced cofactors, to maintain the redox recycling of cofactors, and generate H2, which is utilized by hydrogenotrophic biochemical reactions such as methanogenesis serving as a primary H2 sink (Ungerfeld, 2020).
Common thermodynamically favorable alternatives to methanogenesis are the reduction of nitrate (NO3-) and sulfate (SO42-) (Thauer et al., 1977). Some plants accumulate NO3- and SO42- due to abiotic stress from the environment (Giordano and Raven, 2014). In this study, NaNO3 was effective in inhibiting CH4 with almost 96% decline in CH4 when included at 28 g/kg DM level. Nitrate (NO3-) is well known for its anti-methanogenic potential due to its thermodynamic favorability of its reduction to nitrite (NO2-) and then to ammonia/ammonium (NH3/NH4+) with Gibbs free energy of -163.2 and -436.4 kJ/mol, respectively (Thauer et al., 1977). In comparison, the Gibbs free energy of hydrogenotrophic methanogenesis is -131 kJ/mol (Thauer et al., 1977). Additionally, NO2- is toxic to the ruminant and ruminal microorganisms including methanogens (Takahashi and Young, 1991; Iwamoto et al., 2001), contributing to the anti-methanogenic effect.
Despite the favorable thermodynamics of sulfate as an electron acceptor, our data did not show any marked effects of SO42- on methanogenesis. Sulfate inclusion has been reported to be ineffective on ruminal methanogenesis below 20 mM (Ohashi et al., 1996). In the present study, the highest level (12 g/kg DM) of Na2SO4 equates to 2.8 mM. A similar inclusion level at 2.3 mM (Gupta et al., 2017) of Na2SO4 and 5 mM (Patra and Yu, 2014) of K2SO4 has been reported to be ineffective in vitro. A sulfate inclusion of 26 g/kg DM or larger has been shown to be effective in decreasing CH4 in vivo without the risk of polioencephalomalacia, particularly with dietary adaptation for the ruminal microbiota (van Zijderveld et al., 2010). Thus, had adaptation time for the sulfate inclusion been allowed, it may be possible for small inclusion levels such as mentioned above to show an effect in vitro.
Theoretically, NaNO3 owes its observed anti-methanogenic efficacy to two potential modes of action: first, it serves as a H2 sink during the reduction of NO3- and NO2-; second, NO2- accumulates and is toxic to methanogens. In the present study, it appears that the former was the major contributor of methanogenesis inhibition as the methanogen abundance did not significantly decrease were it for nitrite toxicity (Figure 2A).
The nitrate treatment enriched several other ASVs belonging to bacterial and fungal taxa that possess nitrate or ammonia assimilation capability (Figure 2A). Pseudomonas sp., enriched in the nitrate-treated cultures, likely possesses several genes essential to nitrate and nitrite metabolism: narK encoding nitrate/nitrite transporter, nasA encoding assimilatory nitrate reductase catalytic subunit, nirB and nirD encoding nitrite reductase (NADH) large and small subunits, as well as ncd2 and npd encoding nitronate monooxygenase catalyzing the conversion of nitroalkane to acetaldehyde and nitrite (Nordberg et al., 2014). A fungal phylum Chytridiomycota was enriched in the nitrate treatment group compared to the control; Chytridiomycota fungi are capable of assimilating NO3- as a nitrogen source (Digby et al., 2010). Though the present study does not provide clear distinction, the following two possibilities may explain the decrease in butyrate in the presence of nitrate-respiring microbes. First, the H2 partial pressure of nitrate-treated culture may have been low, wherein H2 is produced by NADH:ferredoxin oxidoreductase and hydrogenase, shunting NADH from the reduction of acetoacetyl-CoA to butyryl-CoA and thus decreasing butyrate (Macfarlane and Macfarlane, 2003). Another possibility is the conversion of butyrate to acetate, which also requires a low H2 partial pressure and produces reducing equivalents (McInerney et al., 2008; van Lingen et al., 2016).
In the nitrate-treated cultures, a notable increase in the abundance of ammonia-assimilating microbes was observed, among which was Prevotella ruminicola. The enrichment of P. ruminicola likely reflects the broader capacity of many ruminal microorganisms to reduce NO3- and utilize NH3 as a nitrogen source, further enhancing its production (Kim et al., 2017). While P. ruminicola is generally recognized as a versatile ammonia assimilator and a ubiquitous fermenter in the rumen (Wang et al., 2015; Kim et al., 2017), the specific mechanisms driving the enrichment of this bacterium and possibly others remain unclear. It may be speculated, nonetheless, that the increased abundance exemplifies a high metabolic activity, perhaps warranted by the metabolic versatility, though abundance and metabolic activity do not always correlate (Stevenson and Weimer, 2007). The observed increase of metabolic hydrogen recovery in cells may reflect this phenomenon for the general microbial body in the nitrate-treated culture. Further, the metabolic hydrogen recovery was lower than that of the control and suggests incorporation of some reducing equivalents into pathways such as nitrate reduction other than those accounted for in the equation (i.e. CH4, H2, SCFAs).
4.2 3NPA may be a potent methanogenesis inhibitor that is metabolized rapidly
An additional purpose of the present study was to evaluate the effect of 3NPA on in-vitro methanogenesis. Naturally occurring in certain plants and fungi as a chemical defense against herbivores (Nishino et al., 2010; Francis et al., 2013; Torres-Guzman et al., 2021), 3NPA is reduced to β-alanine by ruminal microbes (Anderson et al., 1993), which is then metabolized in combination with pyruvate to malonate semialdehyde and then to acetyl-CoA and CO2 (Hayaishi et al., 1961; Nishino et al., 2010; Latham et al., 2016). However, 3NPA's mode of action in the rumen has not clearly been elucidated (Smith and Anderson, 2013) while its structural resemblance to 3-nitrooxypropanol (3NOP) may hint a possible enzymatic inhibition of methanogenesis similar to that of 3NOP [3NOP's mode of action described by Duin et al. (2016)].
In the present study, 3NPA inhibited methanogenesis by up to 54% when included at 2.0 g/kg DM level at 6h and 63% with 0.5 g/kg DM at 24h. The inhibitory effect of 3NPA was concomitant with a numerical increase in H2 concentration (Figure 1A) and a decrease in total SCFA concentration. Based on the results, the fermentation profiles of 3NPA-treated cultures were similar to those treated with BCM but to a lesser extent. Nevertheless, the mechanism of action for the anti-methanogenic effect of 3NPA remains unclear. Evaluating the effects of 3NPA on methanogenic enzymes, especially methyl-coenzyme M reductase, would elucidate whether or not the molecule serves as an enzymatic inhibitor in methanogenesis.
4.3 BCM inhibits in-vitro methanogenesis regardless of inclusion level
The present study also evaluated the effect of BCM on emphin-vitro fermentation. Belonging to one of the most potent categories of methane inhibitor, BCM is a CH4 analog and inhibits the cobamide-dependent methyl-transfer at the last step of methanogenesis (Wood et al., 1968). In contrast to NaNO3, an effective thermodynamic inhibitor, BCM resulted in nearly complete inhibition of methanogenesis irrespective of the inclusion levels. In BCM-treated cultures, H2 concentrations increased (p < 0.001) compared the control, NaNO3, Na2SO4, and 3NPA (Figure 1A). As expected, there was a significant increase in the molar proportion of propionate, as an internal sink of reducing equivalents, compared to the control throughout the incubation period. Additionally, at earlier incubation intervals (i.e. 6h), concentrations of NH3, as another internal H2 sink, in the BCM-treated cultures significantly increased despite the absence of any additional NaNO3.
When the ASVs were agglomerated to the genus and species levels based on their taxonomic assignment, Desulfovibrio and Megasphaera elsdenii were enriched in the BCM-treated culture than the control. Both bacterial species are related to internal H2 sinks in the rumen, sulfate and lactate/propionate, respectively; Desulfovibrio is a major sulfate-reducing bacterium in the rumen (Wu et al., 2021) while M. elsdenii is a lactate-fermenting and propionate-producing bacterium (Li et al., 2021), whose enrichment may suggest that H2 or reducing equivalents were partially redirected to sulfate reduction and lactate assimilation, respectively. However, it is clear that not all H2 was redistributed to internal H2 sinks, but rather, small amounts of H2 were released as gas evidenced by significantly increased (p < 0.001) H2 concentrations in culture treated with BCM (Figure 1A). The disturbance in the H2 concentration in culture likely contributed to the significantly declined total SCFA concentration (Janssen, 2010; Ungerfeld, 2020).
4.4 Combination of thermodynamic and enzymatic inhibitors additively inhibits methanogenesis
The NS and NSP treatments inhibited methanogenesis, on average, by 88 and 97%, respectively, similarly to the effect when NaNO3 was added as a single additive. Since the addition of Na2SO4 alone had no anti-methanogenic effect, it seems that the decline in CH4 in the NS treatment was solely due to NaNO3 with a possible antagonistic effect by Na2SO4 inclusion. 3NPA alone decreased CH4 by approximately 30% on average. Interestingly, when 3NPA was included with NaNO3, it further decreased CH4, and the mitigation effect was particularly greater in higher concentrate diets. The effect of BCM on methanogenesis was as expected, regardless of whether it was included alone or in combination with the other additives, i.e. the NSPB treatment. The effect of BCM was so drastic that cultures receiving BCM resulted in the buildup of H2 in the gaseous phase (p < 0.05; Figure 1B). However, it is intriguing that BCM alone did not seem to affect rumen NH3 at 24h, whereas NH3 increased substantially when the other additives were included with BCM (NSPB treatment), likely due to the inclusion of NaNO3.
We observed differences in the accounting of metabolic hydrogen recovery in cultures treated with potent inhibitors, NaNO3 and BCM alone and in combination (Supplementary Tables S7, S10, S11). At 24h, NaNO3 alone or in combination with Na2SO4 and 3NPA decreased the metabolic hydrogen recovery in fermentation end-products but increased that in cells. On the contrary, BCM alone decreased the latter. When combined, the effects of NaNO3 and BCM seem additive, in that the NSPB treatment decreased cellular metabolic hydrogen recovery and increased end-product and total metabolic hydrogen recovery compared to the NS and NSP treatment. Metabolic hydrogen recovery calculations suggest altered hydrogen metabolism directing hydrogen away from methanogenesis to fermentation products such as propionate and other hydrogenotrophic pathways such as nitrate reduction that are unaccounted for in the equations.
The drastic decline in in-vitro CH4 concentration was not concomitant with methanogen populations. In fact, several methanogen ASVs were enriched in the NS and NSP treatment. Notably, the relative abundance of methylotrophic methanogens belonging to the phylum Thermoplasmatota increased (p < 0.05) in the NS and NSP treatments compared to the control, but not in NaNO3, Na2SO4, and 3NPA individually (Supplementary Figure S3B). Because both NS and NSP treatments introduced competitive H2 (or reducing equivalent) sinks, methylotrophic methanogenesis may have partially occupied the niche space of methanogenesis under limited H2 availability; the methylotrophic pathway possesses a thermodynamic advantage over the hydrogenotrophic counterpart for H2 (or reducing equivalents) given the availability of methylated substrates (e.g. mono-, di-, and tri-methylamines) (Li et al., 2021).
In the NSPB treatment, the three following imputed pathways of L-arginine degradation were significantly enriched (Figure 3): (1) arginine succinyltransferase pathway; (2) superpathway of L-arginine, putrescine, and 4-aminobutanoate degradation; and 3) superpathway of L-arginine and L-ornithine degradation. If the imputation held true, these L-arginine catabolic pathways would lead to the production of succinate (Tabor and Tabor, 1985; Stalon et al., 1987; Kashiwagi et al., 1991). Succinate could then be utilized in propionate production by ruminal bacteria (Blackburn and Hungate, 1963). Among the propionate-producing bacteria in the present study, P. ruminicola depends on vitamin B12 for propionate production (Strobel, 1992). The B12 family of cofactors may have been more available in the absence of methanogenesis, which also relies on the same cofactors. Further, as with the NSPB treatment in this study, butyrate molar proportions have been reported to increase concomitantly with vitamin B12 concentration due to cobalt supplementation in a continuous culture (Tiffany et al., 2006). Concomitantly, the NSPB treatment decreased 12 imputed archaeal pathways (Figure 3), demonstrating specific suppression of the archaeal populations in the rumen, which are primarily composed of methanogens (Janssen and Kirs, 2008).
Bacteria of the family Prevotellaceae (Prevotella 7 and Prevotellaceae YAB2003 group) have been shown to promote propionate biosynthesis via succinate (Trautmann et al., 2022) and were enriched in all of the combination treatments (Figures 2B–D). ASVs identified as Prevotella 7 have > 97% sequence similarity to P. albensis on NCBI BLAST (Zhang et al., 2000). P. albensis appears to be capable of producing propionate from succinyl-CoA (Nordberg et al., 2014). Additionally, in the NSPB treatment, succinate-producing bacteria, Succinivibrio dextrinosolvens and P. ruminicola, were enriched. As mentioned above, the addition of NaNO3 alone increased the abundance of P. ruminicola (Figure 2A). Therefore, the enrichment of Prevotellaceae bacteria in the NaNO3, NS, NSP, and NSPB treatments may be attributed to the inclusion of NaNO3 (Abdelmoteleb et al., 2020; Hassan et al., 2021).
The enrichment of Succiniclasticum in the NSP treatment further attests to the increase in the conversion of succinate to propionate. Succiniclasticum is a unique bacterium that produces propionate from succinate as a sole energy source (van Gylswyk, 1995; Abbas et al., 2020). Also of note in the NSP treatment is the enrichment of Denitrobacterium at the genus level, as this bacterial genus is capable of metabolizing nitro-compounds such as reduction of NO3- to NH3 and 3NPA to β-alanine (Anderson et al., 1993, 1996; Latham et al., 2016; Correa et al., 2017), which presumably was in response to the addition of NaNO3 and 3NPA in the treatment. As mentioned above, in the 3NPA-treated culture, we did not detect significant difference in the Denitrobacterium enrichment; however, this is not surprising given the early onset of anti-methanogenic effect from 3NPA observed at 6h in the present study, which seems to have subsided thereafter. The above pattern observed in the bacterial enrichment indicates the shuffling of H2 allocation, wherein succinate and ultimately propionate production seems to act as alternative sinks of reducing equivalents (Figure 1C). The estimated metabolic hydrogen recovery was lower than the control across the treatments, indicating the utilization of reducing equivalents in other reductive pathways.
The above results maintain that the thermodynamic and enzymatic modes of inhibition explored in this study acted independently of one another. The results herein provided may serve as a proof of concept, though limitations exist in this study, including the following: low cultural pH range, in which fiber degradation was likely impacted (Slyter, 1986), and so was methanogenesis (Sung et al., 2006); and use of one cannulated steer as the source of inoculum, which limits the statistical inference to this very steer. Thermodynamic inhibition by NaNO3 decreased CH4, as expected by the standard Gibbs free energy of -599.6 kJ/mol for the reduction of NO3- to NH3 compared to that of -131.0 kJ/mol for methanogenesis (Thauer et al., 1977; Latham et al., 2016). Nitrate increased NH3 and propionate but decreased butyrate. On the other hand, enzymatic inhibition by BCM decreased CH4 via competitive inhibition as demonstrated by Wood et al. (1968), resulting in decreased acetate but increased propionate and gaseous H2. Presumably, NO3- and BCM increased propionate via the succinate and acrylate pathways, respectively. Combining both NO3- and BCM, the NSPB treatment decreased acetate but increased NH3, propionate, and valerate, as well as gaseous H2. The concomitant increase in propionate and enrichment of Prevotella spp. in the combination treatments may allude to a proliferation of atypical consortia of energy conserving microbiota (Hackmann et al., 2017). The accumulation of H2 can thermodynamically inhibit NADH oxidation, but electron acceptors (i.e., NO3- reduction and succinate/propionate biosynthesis pathways by Prevotella), can recycle electrons from reduced ferredoxin; the redox state of NAD and ferredoxin serve as important drivers of ruminal fermentation processes (van Lingen et al., 2016).
4.5 Conclusion
Exploitation of thermodynamics for inhibition of methanogenesis follows the availability of alternative electron acceptors that are competitive to CH4 production. NO3- demonstrated a dose-response inhibition of CH4. NO3- as a competitive electron acceptor enriched ruminal microbes capable of nitrate/nitrite reduction as well as NH3/NH4+ assimilation. Multiple electron acceptors may inhibit methanogenesis given their thermodynamic competitiveness. Enzymatic inhibition, in contrast, was effective at all dose levels tested. Inhibition of methanogenesis, particularly with NaNO3 and BCM, upregulated internal H2 sinks including NH3 and propionate as supported by the enrichment of members of the family Prevotellaceae and M. elsdenii, respectively. The NSPB treatment decreased CH4 and the major ruminal methanogen Methanobrevibacter, but channeled reducing equivalents to NH3, propionate, and valerate. BCM also decreased CH4 but resulted in a build-up of gaseous H2. Both NSPB and BCM were associated with an increased propionate production. However, it seems that the accumulation of gaseous H2 by the enzymatic inhibition pose a detrimental impact on overall fermentation without an external H2 sink. Ruminal microbiome is known to adapt to shifts in dietary substrates via alteration of its profile and metabolic pathways. The results of the present study provide further evidence to the adaptability of the ruminal microbiome under suppression of methanogenesis.
Data availability statement
The datasets analyzed for this study can be found in the NCBI SRA repository: BioProject ID PRJNA1020825; accession SAMN37529565-37529652.
Ethics statement
The animal study was approved by NC State Institution of Animal Care and Use Committee. The study was conducted in accordance with the local legislation and institutional requirements.
Author contributions
KT: Writing – review & editing, Writing – original draft, Visualization, Methodology, Investigation, Formal analysis, Data curation, Conceptualization. SC: Writing – review & editing, Validation, Resources, Formal analysis. KP: Writing – review & editing, Validation, Resources, Formal analysis. VF: Writing – review & editing, Supervision, Resources, Project administration, Methodology, Investigation, Funding acquisition, Formal analysis, Conceptualization.
Funding
The author(s) declare financial support was received for the research, authorship, and/or publication of this article. This study was supported by the NC Dairy Foundation Research Grant.
Acknowledgments
We thank Mrs. Tabatha Wilson for her care and maintenance of the cannulated steer at the NCSU Metabolism Education Unit, Mrs. Sarah Jo McLeod for her technical assistance in the Polk laboratory, Dr. Nathan Crook for allowing the lab space and equipment for library preparation in the Partners II laboratory, Dr. Zhe Lyu for his advice in identifying fungal ITS primers, Dr. Christine Hawkes for demonstrating the methods of microbiome analysis, and last but certainly not least, Dr. Benjamin Callahan for his expert advice and guidance in bioinformatic procedures.
Conflict of interest
The authors declare that the research was conducted in the absence of any commercial or financial relationships that could be construed as a potential conflict of interest.
Publisher's note
All claims expressed in this article are solely those of the authors and do not necessarily represent those of their affiliated organizations, or those of the publisher, the editors and the reviewers. Any product that may be evaluated in this article, or claim that may be made by its manufacturer, is not guaranteed or endorsed by the publisher.
Supplementary material
The Supplementary Material for this article can be found online at: https://www.frontiersin.org/articles/10.3389/fmicb.2024.1322207/full#supplementary-material
References
Abarenkov, K., Zirk, A., Piirmann, T., Pohonen, R., Ivanov, F., Nilsson, R. H., et al. (2022). UNITE General FASTA Release for Fungi 2.
Abbas, W., Howard, J. T., Paz, H. A., Hales, K. E., Wells, J. E., Kuehn, L. A., et al. (2020). Influence of host genetics in shaping the rumen bacterial community in beef cattle. Scient. Rep. 10:15101. doi: 10.1038/s41598-020-72011-9
Abdelmoteleb, M., Knoell, A., and Fernando, S. (2020). PSVI-14 effect of dietary nitrates and sulfates on enteric methane mitigation in finishing cattle. J. Anim. Sci. 98, 220–221. doi: 10.1093/jas/skaa054.384
Abecia, L., Toral, P. G., Martín-García, A. I., Martínez, G., Tomkins, N. W., Molina-Alcaide, E., et al. (2012). Effect of bromochloromethane on methane emission, rumen fermentation pattern, milk yield, and fatty acid profile in lactating dairy goats. J. Dairy Sci. 95, 2027–2036. doi: 10.3168/jds.2011-4831
Anderson, R. C., Rasmussen, M. A., and Allison, M. J. (1993). Metabolism of the plant toxins nitropropionic acid and nitropropanol by ruminal microorganisms. Appl. Environ. Microbiol. 59, 3056–3061. doi: 10.1128/aem.59.9.3056-3061.1993
Anderson, R. C., Rasmussen, M. A., and Allison, M. J. (1996). Enrichment and isolation of a nitropropanol-metabolizing bacterium from the rumen. Appl. Environ. Microbiol. 62, 3885–3886. doi: 10.1128/aem.62.10.3885-3886.1996
Bates, D., Mächler, M., Bolker, B., and Walker, S. (2015). Fitting linear mixed-effects models using lme4. J. Stat. Softw. 67, 1–48. doi: 10.18637/jss.v067.i01
Beauchemin, K. A., Ungerfeld, E. M., Eckard, R. J., and Wang, M. (2020). Review: Fifty years of research on rumen methanogenesis: lessons learned and future challenges for mitigation. Animal 14, s2–s16. doi: 10.1017/S1751731119003100
Beecher, G. R., and Whitten, B. K. (1970). Ammonia determination: reagent modification and interfering compounds. Anal. Biochem. 36, 243–246. doi: 10.1016/0003-2697(70)90356-8
Blackburn, T. H., and Hungate, R. E. (1963). Succinic acid turnover and propionate production in the bovine rumen. Appl. Microbiol. 11, 132–135. doi: 10.1128/AEM.11.2.132-135.1963
Blaxter, K. L., and Clapperton, J. L. (1965). Prediction of the amount of methane produced by ruminants. Br. J. Nutr. 19, 511–522. doi: 10.1079/BJN19650046
Callahan, B. J., McMurdie, P. J., Rosen, M. J., Han, A. W., Johnson, A. J. A., and Holmes, S. P. (2016). DADA2: High-resolution sample inference from Illumina amplicon data. Nat. Methods 13, 581–583. doi: 10.1038/nmeth.3869
Capitán-Moyano„, L, Cañellas-Iniesta, N., Arias-Fernández, M., Bennasar-Veny, M., Yáñez, A. M., and Castro-Sánchez, E. (2023). Environmental factors of food insecurity in adolescents: a scoping review protocol. PLoS ONE 18:e0294506. doi: 10.1371/journal.pone.0294506
Chalupa, W. (1977). Manipulating rumen fermentation. J. Anim. Sci. 45, 585–599. doi: 10.2527/jas1977.453585x
Collyer, M. L., and Adams, D. C. (2018). RRPP: An r package for fitting linear models to high-dimensional data using residual randomization. Meth. Ecol. Evol. 9, 1772–1779. doi: 10.1111/2041-210X.13029
Correa, A. C., Trachsel, J., Allen, H. K., Corral-Luna, A., Gutierrez-Bañuelos, H., Ochoa-Garcia, P. A., et al. (2017). Effect of sole or combined administration of nitrate and 3-nitro-1-propionic acid on fermentation and Salmonella survivability in alfalfa-fed rumen cultures in vitro. Bioresour. Technol. 229, 69–77. doi: 10.1016/j.biortech.2017.01.012
Digby, A. L., Gleason, F. H., and McGee, P. A. (2010). Some fungi in the Chytridiomycota can assimilate both inorganic and organic sources of nitrogen. Fungal Ecol. 3, 261–266. doi: 10.1016/j.funeco.2009.11.002
Douglas, G. M., Maffei, V. J., Zaneveld, J. R., Yurgel, S. N., Brown, J. R., Taylor, C. M., et al. (2020). PICRUSt2 for prediction of metagenome functions. Nat. Biotechnol. 38, 685–688. doi: 10.1038/s41587-020-0548-6
Duin, E. C., Wagner, T., Shima, S., Prakash, D., Cronin, B., Yáñez-Ruiz, D. R., et al. (2016). Mode of action uncovered for the specific reduction of methane emissions from ruminants by the small molecule 3-nitrooxypropanol. Proc. Nat. Acad. Sci. 113, 6172–6177. doi: 10.1073/pnas.1600298113
Eun, J.-S., Fellner, V., and Gumpertz, M. L. (2004). Methane production by mixed ruminal cultures incubated in dual-flow fermentors. J. Dairy Sci. 87, 112–121. doi: 10.3168/jds.S0022-0302(04)73148-3
Francis, K., Smitherman, C., Nishino, S. F., Spain, J. C., and Gadda, G. (2013). The biochemistry of the metabolic poison propionate 3-nitronate and its conjugate acid, 3-nitropropionate. IUBMB Life 65, 759–768. doi: 10.1002/iub.1195
Gawad, R., and Fellner, V. (2018). Evaluation of glycerol encapsulated with alginate and alginate-chitosan polymers in gut environment and its resistance to rumen microbial degradation. Asian-Aust. J. Animal Sci. 32, 72–81. doi: 10.5713/ajas.18.0110
Giordano, M., and Raven, J. A. (2014). Nitrogen and sulfur assimilation in plants and algae. Aquat. Bot. 118, 45–61. doi: 10.1016/j.aquabot.2014.06.012
Goel, G., Makkar, H. P. S., and Becker, K. (2009). Inhibition of methanogens by bromochloromethane: effects on microbial communities and rumen fermentation using batch and continuous fermentations. Br. J. Nutr. 101, 1484–1492. doi: 10.1017/S0007114508076198
Gornall, J., Betts, R., Burke, E., Clark, R., Camp, J., Willett, K., et al. (2010). Implications of climate change for agricultural productivity in the early twenty-first century. Philos. Trans. R. Soc. Lond. B. Biol. Sci. 365, 2973–2989. doi: 10.1098/rstb.2010.0158
Gupta, V., Kamra, D., Agarwal, N., and Chaudary, L. (2017). Effect of sulphate and blend of plant parts containing secondary metabolites on in vitro methanogenesis, digestibility and feed fermentation with buffalo rumen liquor. Indian J. Anim. Sci. 87:199–202. doi: 10.56093/ijans.v87i2.67745
Hackmann, T. J., Ngugi, D. K., Firkins, J. L., and Tao, J. (2017). Genomes of rumen bacteria encode atypical pathways for fermenting hexoses to short-chain fatty acids. Environm. Microbiol. 19, 4670–4683. doi: 10.1111/1462-2920.13929
Hassan, F. U., Guo, Y., Li, M., Tang, Z., Peng, L., Liang, X., et al. (2021). Effect of methionine supplementation on rumen microbiota, fermentation, and amino acid metabolism in in vitro cultures containing nitrate. Microorganisms 9:1717. doi: 10.3390/microorganisms9081717
Hayaishi, O., Nishizuka, Y., Tatibana, M., Takeshita, M., and Kuno, S. (1961). Enzymatic studies on the metabolism of beta-alanine. J. Biol. Chem. 236, 781–790. doi: 10.1016/S0021-9258(18)64309-1
Huang, R., Soneson, C., Ernst, F. G., Rue-Albrecht, K. C., Yu, G., Hicks, S. C., et al. (2021). Treesummarizedexperiment: a s4 class for data with hierarchical structure. F1000Research 9:1246. doi: 10.12688/f1000research.26669.2
Iwamoto, M., Asanuma, N., and Hino, T. (2001). Effects of ph and electron donors on nitrate and nitrite reduction in ruminal microbiota. Nihon Chikusan Gakkaiho 72, 117–125. doi: 10.2508/chikusan.72.117
Janssen, P. H. (2010). Influence of hydrogen on rumen methane formation and fermentation balances through microbial growth kinetics and fermentation thermodynamics. Anim. Feed Sci. Technol. 160, 1–22. doi: 10.1016/j.anifeedsci.2010.07.002
Janssen, P. H., and Kirs, M. (2008). Structure of the archaeal community of the rumen. Appl. Environ. Microbiol. 74, 3619–3625. doi: 10.1128/AEM.02812-07
Kashiwagi, K., Suzuki, T., Suzuki, F., Furuchi, T., Kobayashi, H., and Igarashi, K. (1991). Coexistence of the genes for putrescine transport protein and ornithine decarboxylase at 16 min on Escherichia coli chromosome. J. Biol. Chem. 266, 20922–20927. doi: 10.1016/S0021-9258(18)54798-0
Kim, J. N., Méndez-García, C., Geier, R. R., Iakiviak, M., Chang, J., Cann, I., et al. (2017). Metabolic networks for nitrogen utilization in Prevotella ruminicola 23. Sci. Rep. 7:7851. doi: 10.1038/s41598-017-08463-3
Kohn, R. A., and Boston, R. C. (2000). “The role of thermodynamics in controlling rumen metabolism,” in Modelling Nutrient Utilization in Farm Animals (Wallingford Oxon: CAB International), 11–24.
Kuznetsova, A., Brockhoff, P. B., and Christensen, R. H. B. (2017). lmerTest package: tests in linear mixed effects models. J. Stat. Softw. 82, 1–26. doi: 10.18637/jss.v082.i13
Latham, E. A., Anderson, R. C., Pinchak, W. E., and Nisbet, D. J. (2016). Insights on alterations to the rumen ecosystem by nitrate and nitrocompounds. Front. Microbiol. 7:228. doi: 10.3389/fmicb.2016.00228
Lenth, R. V. (2023). “emmeans: estimated marginal means, aka least-squares means,” in R Package Version 1.8.6.
Li, Y., Kreuzer, M., Clayssen, Q., Ebert, M.-O., Ruscheweyh, H.-J., Sunagawa, S., et al. (2021). The rumen microbiome inhibits methane formation through dietary choline supplementation. Sci. Rep. 11:21761. doi: 10.1038/s41598-021-01031-w
Lin, H., Eggesb, M., and Peddada, S. D. (2022). Linear and nonlinear correlation estimators unveil undescribed taxa interactions in microbiome data. Nat. Commun. 13:4946. doi: 10.1038/s41467-022-32243-x
Lin, H., and Peddada, S. D. (2020). Analysis of compositions of microbiomes with bias correction. Nat. Commun. 11:3514. doi: 10.1038/s41467-020-17041-7
Macfarlane, S., and Macfarlane, G. T. (2003). Regulation of short-chain fatty acid production. Proc. Nutr. Soc. 62, 67–72. doi: 10.1079/PNS2002207
Maghini, D. G., Moss, E. L., Vance, S. E., and Bhatt, A. S. (2021). Improved high-molecular-weight DNA extraction, nanopore sequencing and metagenomic assembly from the human gut microbiome. Nat. Protoc. 16, 458–471. doi: 10.1038/s41596-020-00424-x
Martin, M. (2011). Cutadapt removes adapter sequences from high-throughput sequencing reads. EMBnet J. 17, 10–12. doi: 10.14806/ej.17.1.200
Marty, R. J., and Demeyer, D. I. (1973). The effect of inhibitors of methane production of fermentation pattern and stoichiometry in vitro using rumen contents from sheep given molasses. Br. J. Nutr. 30, 369–376. doi: 10.1079/BJN19730041
Matsui, H., Tajima, K., and Itabashi, H. (2020). Diversity of prokaryotes in the rumen of steers fed a diet supplemented with or without bromochloromethane, an anti-methanogenic compound. Japan Agricult. Res. Quart. JARQ 54, 179–183. doi: 10.6090/jarq.54.179
McDougall, E. I. (1948). The composition and output of sheep's saliva. Biochem. J. 43, 99–109. doi: 10.1042/bj0430099
McInerney, M. J., Struchtemeyer, C. G., Sieber, J., Mouttaki, H., Stams, A. J. M., Schink, B., et al. (2008). Physiology, ecology, phylogeny, and genomics of microorganisms capable of syntrophic metabolism. Ann. N. Y. Acad. Sci. 1125, 58–72. doi: 10.1196/annals.1419.005
McMurdie, P. J., and Holmes, S. (2013). phyloseq: an R package for reproducible interactive analysis and graphics of microbiome census data. PLoS ONE 8:e61217. doi: 10.1371/journal.pone.0061217
Myers, S., Fanzo, J., Wiebe, K., Huybers, P., and Smith, M. (2022). Current guidance underestimates risk of global environmental change to food security. BMJ 378:e071533. doi: 10.1136/bmj-2022-071533
National Research Council (2001). Nutrient Requirements of Dairy Cattle: Seventh revised edition. Washington DC: National Academies Press.
Nguyen, S., Li, L., and Hegarty, R. (2015). Effects of rumen protozoa of brahman heifers and nitrate on fermentation and in vitro methane production. Asian Aust. J. Anim. Sci. 29:641. doi: 10.5713/ajas.15.0641
Nishino, S. F., Shin, K. A., Payne, R. B., and Spain, J. C. (2010). Growth of bacteria on 3-nitropropionic acid as a sole source of carbon, nitrogen, and energy. Appl. Environ. Microbiol. 76, 3590–3598. doi: 10.1128/AEM.00267-10
Nordberg, H., Cantor, M., Dusheyko, S., Hua, S., Poliakov, A., Shabalov, I., et al. (2014). The genome portal of the Department of Energy Joint Genome Institute: 2014 updates. Nucleic Acids Res. 42, D26–D31. doi: 10.1093/nar/gkt1069
Ochoa-García, P. A., Arevalos-Sánchez, M. M., Ruiz-Barrera, O., Anderson, R. C., Maynez-Pérez, A. O., Rodríguez-Almeida, F. A., et al. (2019). In vitro reduction of methane production by 3-nitro-1-propionic acid is dose-dependent. J. Anim. Sci. 97, 1317–1324. doi: 10.1093/jas/skz012
Ohashi, Y., Ushida, K., Miyasaki, K., and Kojima, Y. (1996). Effect of initial sulfate level on electron partition between methanogenesis and sulfate reduction in the rumen. Annales de Zootechnie 45, 320–320. doi: 10.1051/animres:19960660
Patra, A. K., and Yu, Z. (2014). Combinations of nitrate, saponin, and sulfate additively reduce methane production by rumen cultures in vitro while not adversely affecting feed digestion, fermentation or microbial communities. Bioresour. Technol. 155, 129–135. doi: 10.1016/j.biortech.2013.12.099
Posit Team (2023). RStudio: Integrated Development Environment for R. Boston, MA: Posit Software, PBC.
Quast, C., Pruesse, E., Yilmaz, P., Gerken, J., Schweer, T., Yarza, P., et al. (2013). The SILVA ribosomal RNA gene database project: improved data processing and web-based tools. Nucleic Acids Res. 41, D590–D596. doi: 10.1093/nar/gks1219
R Core Team (2023). R: A Language and Environment for Statistical Computing. Vienna: R Foundation for Statistical Computing.
Raymann, K., Moeller, A. H., Goodman, A. L., and Ochman, H. (2017). Unexplored archaeal diversity in the great ape gut microbiome. mSphere 2, e00026–e00017. doi: 10.1128/mSphere.00026-17
Schliep, K. P. (2011). phangorn: phylogenetic analysis in R. Bioinformatics 27, 592–593. doi: 10.1093/bioinformatics/btq706
Slyter, L., Bryant, M., and Wolin, M. (1966). Effect of pH on population and fermentation in a continuously cultured rumen ecosystem. Appl. Microbiol. 14, 573–578. doi: 10.1128/am.14.4.573-578.1966
Slyter, L. L. (1986). Ability of ph-selected mixed ruminal microbial populations to digest fiber at various phs. Appl. Environm. Microbiol. 52, 390–391. doi: 10.1128/aem.52.2.390-391.1986
Smith, D. J., and Anderson, R. C. (2013). Toxicity and metabolism of nitroalkanes and substituted nitroalkanes. J. Agric. Food Chem. 61, 763–779. doi: 10.1021/jf3039583
Stalon, V., Vander Wauven, C., Momin, P., and Legrain, C. (1987). Catabolism of arginine, citrulline and ornithine by Pseudomonas and related bacteria. J. Gen. Microbiol. 133, 2487–2495. doi: 10.1099/00221287-133-9-2487
Stevenson, D. M., and Weimer, P. J. (2007). Dominance of Prevotella and low abundance of classical ruminal bacterial species in the bovine rumen revealed by relative quantification real-time PCR. Appl. Microbiol. Biotechnol. 75, 165–174. doi: 10.1007/s00253-006-0802-y
Strobel, H. J. (1992). Vitamin B12-dependent propionate production by the ruminal bacterium Prevotella ruminicola 23. Appl. Environ. Microbiol. 58, 2331–2333. doi: 10.1128/aem.58.7.2331-2333.1992
Sung, H. G., Kobayashi, Y., Chang, J., Ha, A., Hwang, I. H., and Ha, J. K. (2006). Low ruminal ph reduces dietary fiber digestion via reduced microbial attachment. Asian-Aust. J. Anim. Sci. 20, 200–207. doi: 10.5713/ajas.2007.200
Tabor, C. W., and Tabor, H. (1985). Polyamines in microorganisms. Microbiol. Rev. 49, 81–99. doi: 10.1128/MMBR.49.1.81-99.1985
Takahashi, J., and Young, B. A. (1991). Prophylactic effect of l-cysteine on nitrate-induced alterations in respiratory exchange and metabolic rate in sheep. Anim. Feed Sci. Technol. 35, 105–113. doi: 10.1016/0377-8401(91)90103-Y
Thauer, R. K., Jungermann, K., and Decker, K. (1977). Energy conservation in chemotrophic anaerobic bacteria. Bacteriol. Rev. 41, 100–180. doi: 10.1128/MMBR.41.1.100-180.1977
Tiffany, M. E., Fellner, V., and Spears, J. W. (2006). Influence of cobalt concentration on vitamin B12 production and fermentation of mixed ruminal microorganisms grown in continuous culture flow-through fermentors. J. Anim. Sci. 84, 635–640. doi: 10.2527/2006.843635x
Tomkins, N. W., Colegate, S. M., and Hunter, R. A. (2009). A bromochloromethane formulation reduces enteric methanogenesis in cattle fed grain-based diets. Anim. Prod. Sci. 49, 1053–1058. doi: 10.1071/EA08223
Torres-Guzman, J. C., Padilla-Guerrero, I. E., Cervantes-Quintero, K. Y., Martinez-Vazquez, A., Ibarra-Guzman, M., and Gonzalez-Hernandez, G. A. (2021). Peculiarities of nitronate monooxygenases and perspectives for in vivo and in vitro applications. Appl. Microbiol. Biotechnol. 105, 8019–8032. doi: 10.1007/s00253-021-11623-1
Trautmann, A., Schleicher, L., Koch, A., Günther, J., Steuber, J., and Seifert, J. (2022). A shift towards succinate-producing Prevotella in the ruminal microbiome challenged with monensin. Proteomics 23:e2200121. doi: 10.1002/pmic.202200121
Ungerfeld, E., and Kohn, R. (2006). “The role of thermodynamics in the control of ruminal fermentation,” in Ruminant Physiology: Digestion, Metabolism and Impact of Nutrition on Gene Expression, Immunology and Stress (Wageningen: Wageningen Academic Publisher), 55–85.
Ungerfeld, E. M. (2020). Metabolic hydrogen flows in rumen fermentation: principles and possibilities of interventions. Front. Microbiol. 11:589. doi: 10.3389/fmicb.2020.00589
van Gylswyk, N. O. (1995). Succiniclasticum ruminis gen. nov., sp. nov., a ruminal bacterium converting succinate to propionate as the sole energy-yielding mechanism. Int. J. Syst. Evol. Microbiol. 45, 297–300. doi: 10.1099/00207713-45-2-297
van Lingen, H. J., Plugge, C. M., Fadel, J. G., Kebreab, E., Bannink, A., and Dijkstra, J. (2016). Thermodynamic driving force of hydrogen on rumen microbial metabolism: a theoretical investigation. PLoS ONE 11:e0161362. doi: 10.1371/journal.pone.0161362
van Zijderveld, S. M., Gerrits, W. J. J., Apajalahti, J. A., Newbold, J. R., Dijkstra, J., Leng, R. A., et al. (2010). Nitrate and sulfate: effective alternative hydrogen sinks for mitigation of ruminal methane production in sheep. J. Dairy Sci. 93, 5856–5866. doi: 10.3168/jds.2010-3281
Walters, W., Hyde, E. R., Berg-Lyons, D., Ackermann, G., Humphrey, G., Parada, A., et al. (2016). Improved bacterial 16s rrna gene (V4 and V4-5) and fungal internal transcribed spacer marker gene primers for microbial community surveys. mSystems 1, e00009–e00015. doi: 10.1128/mSystems.00009-15
Wang, M., Ungerfeld, E. M., Wang, R., Zhou, C. S., Basang, Z. Z., Ao, S. M., et al. (2016). Supersaturation of dissolved hydrogen and methane in rumen of Tibetan sheeps. Front. Microbiol. 7:850. doi: 10.3389/fmicb.2016.00850
Wang, P., Tan, Z., Guan, L., Tang, S., Zhou, C., Han, X., et al. (2015). Ammonia and amino acids modulates enzymes associated with ammonia assimilation pathway by ruminal microbiota in vitro. Livest. Sci. 178, 130–139. doi: 10.1016/j.livsci.2015.05.033
White, T. J., Bruns, T., Lee, S., and Taylor, J. (1990). “Amplification and direct sequencing of fungal ribosomal rna genes for phylogenetics,” in PCR Protocols, eds. M. A. Innis, D. H. Gelfand, J. J. Sninsky, and T. J. White (San Diego: Academic Press), 315–322.
Wickham, H., Averick, M., Bryan, J., Chang, W., McGowan, L. D., François, R., et al. (2019). Welcome to the Tidyverse. J. Open Source Softw. 4:1686. doi: 10.21105/joss.01686
Wood, J. M., Kennedy, F. S., and Wolfe, R. S. (1968). The reaction of multihalogenated hydrocarbons with free and bound reduced vitamin B 12. Biochemistry 7, 1707–1713. doi: 10.1021/bi00845a013
Wright, E. (2016). Using DECIPHER v2.0 to analyze big biological sequence data in R. R Journal 8, 352–359. doi: 10.32614/RJ-2016-025
Wu, H., Li, Y., Meng, Q., and Zhou, Z. (2021). Effect of high sulfur diet on rumen fermentation, microflora, and epithelial barrier function in steers. Animals 11:2545. doi: 10.3390/ani11092545
Yilmaz, P., Parfrey, L. W., Yarza, P., Gerken, J., Pruesse, E., Quast, C., et al. (2014). The SILVA and “All-species Living Tree Project (LTP)” taxonomic frameworks. Nucleic Acids Res. 42, D643–D648. doi: 10.1093/nar/gkt1209
Keywords: methane mitigation, rumen microbiome, anaerobic fermentation, methanogenesis, thermodynamics, enzymatic reactions
Citation: Tanaka K, Collins S, Polkoff K and Fellner V (2024) Inhibiting methanogenesis by targeting thermodynamics and enzymatic reactions in mixed cultures of rumen microbes in vitro. Front. Microbiol. 15:1322207. doi: 10.3389/fmicb.2024.1322207
Received: 16 October 2023; Accepted: 17 July 2024;
Published: 14 August 2024.
Edited by:
Yosra Ahmed Soltan, Alexandria University, EgyptReviewed by:
Paul James Weimer, University of Wisconsin-Madison, United StatesJeffrey Firkins, The Ohio State University, United States
Copyright © 2024 Tanaka, Collins, Polkoff and Fellner. This is an open-access article distributed under the terms of the Creative Commons Attribution License (CC BY). The use, distribution or reproduction in other forums is permitted, provided the original author(s) and the copyright owner(s) are credited and that the original publication in this journal is cited, in accordance with accepted academic practice. No use, distribution or reproduction is permitted which does not comply with these terms.
*Correspondence: Vivek Fellner, dmZlbGxuZXJAbmNzdS5lZHU=