 Enriqueta Garcia-Gutierrez
 Liam H. Walsh1,4
 Paul D. Cotter
- 1Food Bioscience Department, Teagasc Food Research Centre Moorepark, County Cork, Ireland
- 2APC Microbiome Ireland, University College Cork, County Cork, Ireland
- 3VistaMilk SFI Research Centre, Moorepark, County Cork, Ireland
- 4School of Microbiology, University College Cork, County Cork, Ireland
1 Introduction
Scientific communication is becoming ever more important (Burns et al., 2003). It goes beyond imparting scientific knowledge and includes a focus on enhancing public understanding of the role and impact that science can have in society. Scientific-based communication facilitates conversations with the general public or specific sectors and can empower individuals and communities to participate in scientific processes, such as citizen science, which can even give people a voice in local decision-making (Bonney et al., 2016). Moreover, it can raise awareness about how public money is used for science-based interventions to tackle societal challenges, e.g., during the COVID-19 pandemic, and contribute to the understanding of the roles of researchers (Nosek and Bar-Anan, 2012).
Unsurprisingly, public outreach activities are encouraged by the vast majority of academic institutions and funding bodies, and many programmes and activities have been developed to make science more accessible to the non-academic population (Caballe and Bardelli, 2022; Rouzer et al., 2023). Microbiology is not an exception and, as a result, there has been an increase in public dissemination actions in recent years (Chang, 2011). Surveys represent a flexible avenue for gathering information to facilitate better communication between researchers and the general public. For example, surveys can be employed to determine the general population's, or a specific group's, awareness of microbiology-related topics and identify hot themes from the scientific literature. Moreover, one of the most impactful reasons for carrying out surveys is that the results can be used to create effective communications that target gaps and misconceptions in people's mental frameworks, thereby helping to address misinformation (Bruine de Bruin and Bostrom, 2013).
Although there are service providers who specialize in designing and conducting surveys, researchers can directly do both. However, conducting surveys might pose some unexpected challenges that can complicate the execution of the primary objective. Here, we briefly compile some considerations based on our experience of conducting surveys relating to microbiology, specifically in areas relating to the gut microbiota and fermented foods, and the lessons that we have learned to help other researchers successfully and effectively design and conduct surveys (Figure 1).
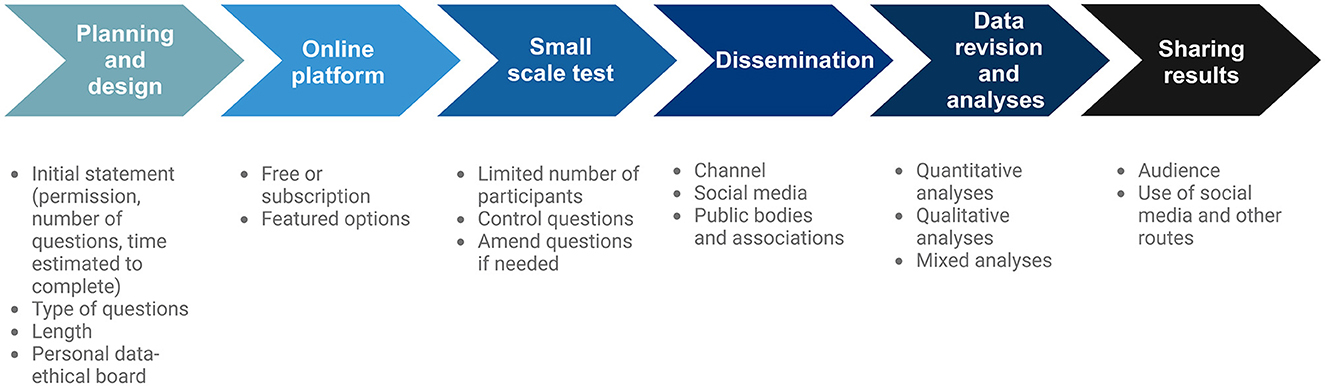
Figure 1. Proposed pipeline for conducting online surveys.
2 Planning and design
The first thing you need to consider is whether or not you are collecting personal data. Personal data include any piece of information that could be used to trace back the information provided to a person, including IP identification. If so, you will have to follow the guidelines for data protection in your country and organization. In the case of Europe, the General Data Protection Regulation (GDPR) provides the framework for these endeavors. Additionally, it is likely that you will have to write and submit documentation, including your fully designed survey, to be approved by a registered ethical board before starting your study (Fink, 2015). It is important to note that, if you decide to make any modifications, you will have to communicate these changes to the ethical board for further approval. If your questions are designed to only obtain demographic information, you are exempt from ethical requirements and do not need to undergo this step.
Designing the survey involves developing the questions according to the information you want to obtain. Communication with the participants is also of key importance. You will have to inform them about the purpose of your survey, how many questions are included, and an estimate of the time required to complete the survey, provide a contact, and explicitly ask the participant whether they want to be a part of the study, before proceeding with the survey questions. You can ask questions with yes/no answers, multiple choice, select the correct answer, fill in the blanks, order the options, etc. The type of question can influence the number of responses that you receive, i.e., a question that requires an extended written or typed response would be less likely to be answered than a yes/no question. Consider providing a choice for “opt out” in the form of “I prefer not to say,” “I don't know,” “Not applicable,” etc. (Penn and Hu, 2021). This will increase the likelihood of receiving responses to all questions. Similarly, provide a space at the end of the survey for people to leave feedback, as many people may wish to express their opinions or provide some additional insight.
Consider including control questions, i.e., if you are particularly interested in acquiring information relating to a specific topic, there is merit in evaluating the participant's knowledge in various ways, as people can respond differently if the question is phrased differently.
Finally, consider the length of your survey. Ideally, a survey should be short and completed in a few minutes (3–5), as the longer the survey, the lower the completion rates (Kost and Rosa da, 2018). For that, it would be useful to include in your initial statement the number of questions and how long it is estimated that the survey can be completed.
3 The platform
Traditionally, surveys have been conducted via mail, telephone, or in person, and some studies are still completed using these methods. However, online surveys can be faster, reach more potential participants, and be more cost-effective (Evans and Mathur, 2018).
There are different platforms where you can design and host an online survey according to your needs (Table 1). One free-of-charge option is to use Google Forms. This is a very intuitive platform and offers different question types. The form can be disseminated by simply sharing a link. Many of the platforms that specialize in surveys also provide free-of-charge options. These free options differ with respect to the number of surveys you can conduct, the number of questions you can ask, the number of responses you can collect, etc. Some options, such as Survicate's free plans, allow unlimited surveys and answers. The subscription plans provided by other platforms include featured options, normally including customization, use of different languages, analytical features, and/or unlimited responses. Some of the most commonly used platforms include SurveyMonkey, Qualtrics, and SurveyPlanet. Some institutions may have subscriptions in place that researchers can avail of. Alternatively, if you are conducting a survey after a talk, a seminar, or an outreach activity, such as citizen science, you can consider using mobile applications, such as Socrative, where you can design your questions and receive the answers in real time.
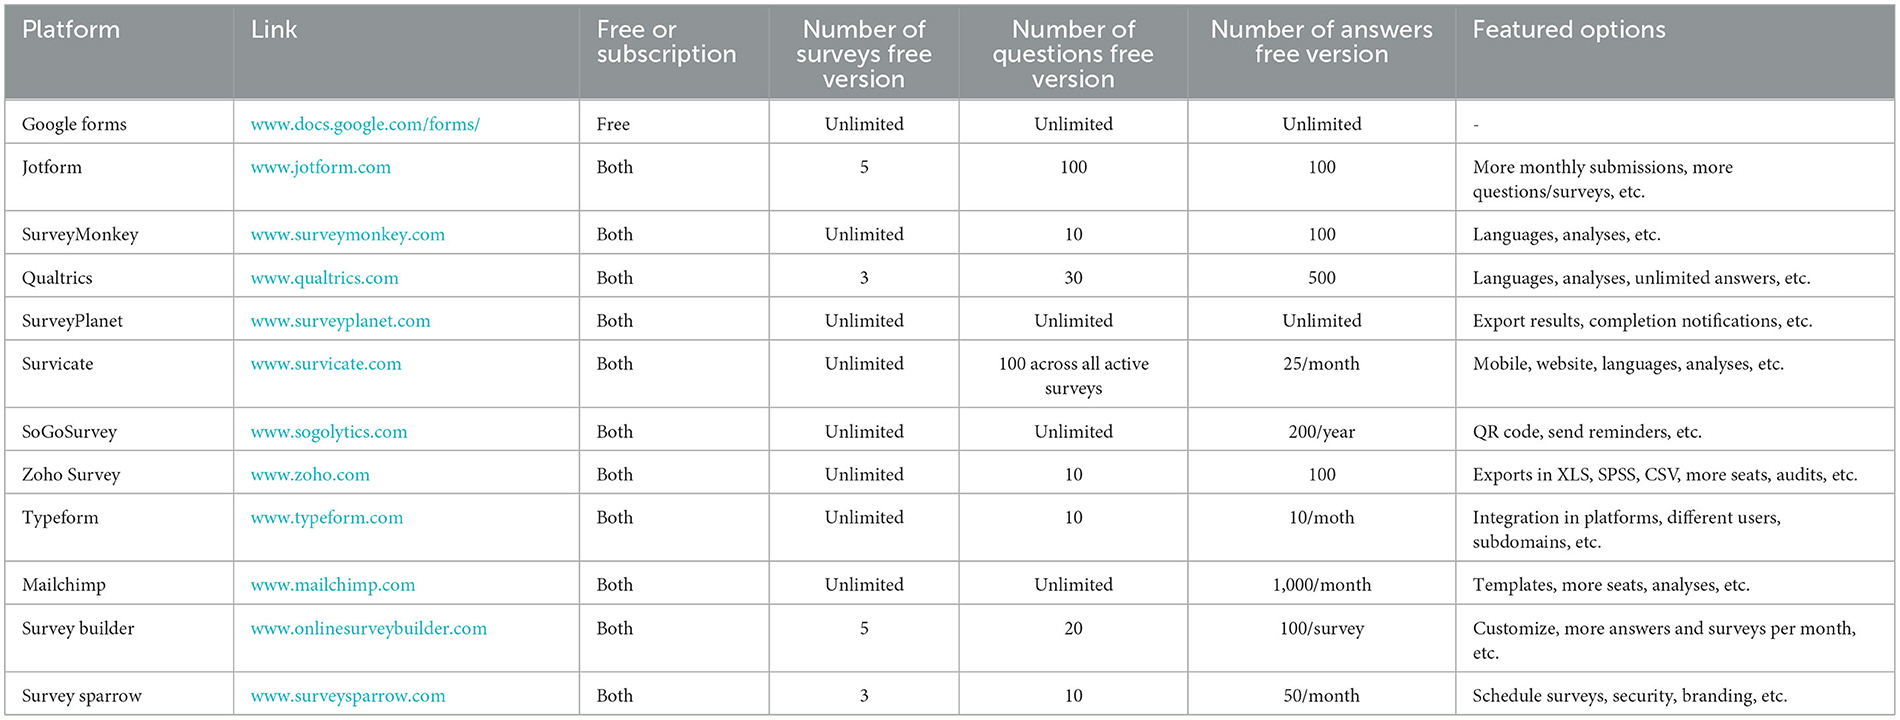
Table 1. Detailed free features of frequently used survey platforms.
4 The ride test
It is advisable to conduct a small test with a limited number of participants to confirm that the answers are understood and that no final amendments need to be made. One approach to revealing potentially ambiguous questions is to identify responses to control questions that are contradictory; e.g., in one of our tests, participants indicated they knew how to order a gut microbiota analysis, but in our control question, it was clear that they were thinking about a colorectal screening. The question was amended for clarity before going into the definitive release.
5 Dissemination
This can frequently be the most challenging stage. A priori, it might seem like an easy task to just circulate the survey, but we have observed that it is difficult to reach high levels of completion when randomly circulated by email or social media.
It is important to consider your audience and identify which channels of dissemination are most likely to lead to results where the audience becomes aware of and completes the survey. For example, if you are interested in the general public's opinion on a topic but circulate the survey only through academic channels, the initiative will not be successful.
Social media has become a powerful means via which surveys can be disseminated very widely. Frequently used options include LinkedIn, Twitter, Facebook, and Instagram. Dissemination through the social media accounts of a researcher's institution or other accounts with a large following, including influencers, can still be valuable. Newly created social media accounts dedicated to the completion of the survey can also be of value.
Sharing via email through different public bodies, such as universities, professional associations, and other organizations is another approach that can be considered. However, such organizations will typically only circulate emails on behalf of researchers affiliated with the organization and will likely want to first screen the survey.
6 The analyses and representation of the data
Once you have collected all the data, another challenge can be obtaining meaningful information from it. If you have many variables, it can be difficult to find a clear message. Data should be analyzed thoughtfully, and care should be taken when deciding how best to represent the conclusions based on the research objectives and the type of data collected.
There are various approaches to analyse the data, including quantitative, qualitative, and mixed methods. Quantitative analysis involves using statistical techniques to analyse numerical data collected from surveys, which is useful for examining patterns, relationships, and trends in the data. It involves calculating descriptive statistics, such as means, frequencies, and correlations, as well as conducting inferential statistics, such as t-tests or regression analyses, to test hypotheses (Nardi, 2018). Quantitative analyses are suitable for examining large datasets and identifying statistical relationships. This approach, for example, can be easily represented by the use of bar or pie charts.
Qualitative analysis involves analyzing non-numerical data, such as open-ended survey responses or interview transcripts, which would involve understanding the meaning and context of participant's responses. Techniques include thematic and content analyses and grounded theory, focused on identifying themes, patterns, and categories in the data (Loehnert, 2010). Qualitative analysis is valuable for exploring participant's perspectives and generating contextual insights. Representing this type of data can be a bit more challenging. An example of how to represent it is the word cloud, whereby the keywords representing ideas that are most repeated will be effectively identified (DePaolo and Wilkinson, 2014).
Mixed methods combine quantitative and qualitative data with the aim of gaining a comprehensive understanding of the data by validating findings and results, as well as providing a more nuanced interpretation. It involves merging datasets, comparing results, or using one method to explain or expand on the findings of another (Driscoll et al., 2007).
7 Sharing your results
There are several strategies to communicate the results of your survey, but their effectiveness will depend on the nature of the survey, the target audience, and the desired level of detail and engagement.
If you are planning to share your results with a scientific audience, the most common and appropriate approach would be either a formal peer-reviewed journal or a research report. However, presenting your data to a broader audience for scientific communication would typically involve the use of less technical language and more visual representations. Infographics can be used to present the key findings in a concise and visually appealing manner via the use of charts, graphs, and illustrations (Krum, 2013). Similarly, data dashboards present the information in an interactive way, even providing real-time results and allowing readers to filter and visualize results based on their specific interests (Smith, 2013). A very useful strategy involves the use of summary reports, which condense the key findings and implications in a digestible and accessible way for a broader audience and are used to transfer knowledge to policymakers or media outlets (Mea et al., 2016).
All of these approaches can be further shared in another communication layer using social media and online platforms such as X, Facebook, LinkedIn, or Instagram to reach a broader audience, or in presentations conducted in person to smaller audiences or conducted online for larger public audiences.
8 Conclusion
As the importance of scientific communication is increasingly appreciated, surveys are proving to be a valuable tool for gathering data and information and collecting perspectives and opinions that will allow the researcher to gain insight into public perceptions of a given topic and design communication strategies accordingly. Moreover, surveys can be used to assess the effectiveness of scientific communication strategies and interventions and help in the development of more effective communication channels and platforms, ensuring that scientific knowledge reaches the intended audience in a timely and accessible manner. However, the reliability of the results is dependent on careful survey design and the appropriate analyses and interpretation of the data, which will require careful and educated consideration.
Author contributions
EG-G: Conceptualization, Writing—original draft, Writing—review & editing, Funding acquisition. LW: Writing—review & editing. PC: Conceptualization, Writing—review & editing, Funding acquisition.
Funding
The author(s) declare financial support was received for the research, authorship, and/or publication of this article. This work was supported by Enterprise Ireland and the European Union's Horizon 2020 research and innovation programme under the Marie Skłodowska-Curie grant agreement number 847402 awarded to EG-G. This work was also funded by the European Union's Horizon 2020 research and innovation programme, under the MASTER project (grant number 818368), by Science Foundation Ireland (SFI) under grant number SFI/12/RC/2273_P2 (APC Microbiome Ireland SFI Research Centre), and by SFI together with the Irish Department of Agriculture, Food, and the Marine under grant number SFI/16/RC/3835 (VistaMilk SFI Research Centre). Research in the Cotter laboratory is also funded by Enterprise Ireland and industry in the Food for Health Ireland (FHI)-3 project under grant number TC/2018/0025.
Acknowledgments
The authors thank members of the Vision 1 Laboratory, Teagasc, for their advice and helpful discussions. The figure was made using Biorender.com.
Conflict of interest
The authors declare that the research was conducted in the absence of any commercial or financial relationships that could be construed as a potential conflict of interest.
Publisher's note
All claims expressed in this article are solely those of the authors and do not necessarily represent those of their affiliated organizations, or those of the publisher, the editors and the reviewers. Any product that may be evaluated in this article, or claim that may be made by its manufacturer, is not guaranteed or endorsed by the publisher.
References
Bonney, R., Phillips, T. B., Ballard, H. L., and Enck, J. W. (2016). Can citizen science enhance public understanding of science?. Pub. Understanding Sci. 25, 2–16. doi: 10.1177/0963662515607406
Bruine de Bruin, W., and Bostrom, A. (2013). Assessing what to address in science communication. Proc. Nat. Acad. Sci. 110, 14062–14068. doi: 10.1073/pnas.1212729110
Burns, T. W., O'Connor, D. J., and Stocklmayer, S. M. (2003). Science communication: a contemporary definition. Pub. Understanding Sci. 12, 183–202. doi: 10.1177/09636625030122004
Caballe, A., and Bardelli, M. (2022). Building blocks of virtuous science communication: grant funding, policy making, and public engagement. DNA Cell Biol. 41, 6–10. doi: 10.1089/dna.2021.0523
Chang, A. (2011). A retrospective look at 20 years of ASM education programs (1990–2010) and a prospective look at the next 20 years (2011–2030). J. Microbiol. Biol. Educ. 12, 8–12. doi: 10.1128/jmbe.v12i1.253
DePaolo, C. A., and Wilkinson, K. (2014). Get your head into the clouds: using word clouds for analyzing qualitative assessment data. TechTrends 58, 38–44. doi: 10.1007/s11528-014-0750-9
Driscoll, D. L., Appiah-Yeboah, A., Salib, P., and Rupert, D. J. (2007). “Merging qualitative and quantitative data in mixed methods research: How to and why not,” in Ecological and Environmental Anthropology (University of Georgia), 18.
Evans, J. R., and Mathur, A. (2018). The value of online surveys: a look back and a look ahead. Int. Res. 28, 854–887. doi: 10.1108/IntR-03-2018-0089
Kost, R. G., and Rosa da, J. C. (2018). Impact of survey length and compensation on validity, reliability, and sample characteristics for ultrashort-, short-, and long-research participant perception surveys. J. Clin. Transl. Sci. 2, 31–37. doi: 10.1017/cts.2018.18
Krum, R. (2013). Cool Infographics: Effective Communication With Data Visualization and Design. New York, NY: John Wiley and Sons.
Loehnert, S. (2010). About statistical analysis of qualitative survey data. J. Q. Reliab. Eng. 2010, 9043. doi: 10.1155/2010/849043
Mea, M., Newton, A., Uyarra, M. C., Alonso, C., and Borja, Á. (2016). From science to policy and society: enhancing the effectiveness of communication. Front. Marine Sci. 3, 168. doi: 10.3389/fmars.2016.00168
Nosek, B. A., and Bar-Anan, Y. (2012). Scientific utopia: I. Opening scientific communication. Psychol. Inquiry 23, 217–243. doi: 10.1080/1047840X.2012.692215
Penn, J., and Hu, W. (2021). Mitigating hypothetical bias by defaulting to opt-out in an online choice. Appl. Econ. 53, 315–328. doi: 10.1080/00036846.2020.1808172
Rouzer, S. K., Kalinowski, L. M., and Kaseda, E. T. (2023). The importance of promoting scientific advocacy and outreach for trainees. Neuropsychopharmacology 48, 713–715. doi: 10.1038/s41386-023-01530-6
Keywords: scientific communication, survey, gut microbiota, microbiology, fermented foods
Citation: Garcia-Gutierrez E, Walsh LH and Cotter PD (2023) Six areas of consideration when designing and conducting online surveys in microbiology for facilitating improved scientific communication. Front. Microbiol. 14:1288822. doi: 10.3389/fmicb.2023.1288822
Received: 04 September 2023; Accepted: 17 November 2023;
Published: 05 December 2023.
Edited by:
Jean L. Schoeni, Eurofins Microbiology Laboratory, United StatesReviewed by:
Sujata A. Sirsat, University of Houston, United StatesCopyright © 2023 Garcia-Gutierrez, Walsh and Cotter. This is an open-access article distributed under the terms of the Creative Commons Attribution License (CC BY). The use, distribution or reproduction in other forums is permitted, provided the original author(s) and the copyright owner(s) are credited and that the original publication in this journal is cited, in accordance with accepted academic practice. No use, distribution or reproduction is permitted which does not comply with these terms.
*Correspondence: Paul D. Cotter, UGF1bC5jb3R0ZXJAdGVhZ2FzYy5pZQ==