
95% of researchers rate our articles as excellent or good
Learn more about the work of our research integrity team to safeguard the quality of each article we publish.
Find out more
ORIGINAL RESEARCH article
Front. Microbiol. , 02 November 2023
Sec. Aquatic Microbiology
Volume 14 - 2023 | https://doi.org/10.3389/fmicb.2023.1271535
This article is part of the Research Topic Women in Aquatic Microbiology: 2023 View all 18 articles
 Anastasia Tsiola1*
 Grégoire Michoud2†
 Daniele Daffonchio2
 Stilianos Fodelianakis2
 Antonia Giannakourou3
 Dimitris Malliarakis4
 Alexandra Pavlidou3
 Elli Pitta3
 Stella Psarra1
 Ioulia Santi1†
 Christina Zeri3
 Paraskevi Pitta1
Introduction: Marine viruses regulate microbial population dynamics and biogeochemical cycling in the oceans. The ability of viruses to manipulate hosts’ metabolism through the expression of viral auxiliary metabolic genes (AMGs) was recently highlighted, having important implications in energy production and flow in various aquatic environments. Up to now, the presence and diversity of viral AMGs is studied using -omics data, and rarely using quantitative measures of viral activity alongside.
Methods: In the present study, four depth layers (5, 50, 75, and 1,000 m) with discrete hydrographic features were sampled in the Eastern Mediterranean Sea; we studied lytic viral community composition and AMG content through metagenomics, and lytic production rates through the viral reduction approach in the ultra-oligotrophic Levantine basin where knowledge regarding viral actions is rather limited.
Results and Discussion: Our results demonstrate depth-dependent patterns in viral diversity and AMG content, related to differences in temperature, nutrients availability, and host bacterial productivity and abundance. Although lytic viral production rates were similar along the water column, the virus-to-bacteria ratio was higher and the particular set of AMGs was more diverse in the bathypelagic (1,000 m) than the shallow epipelagic (5, 50, and 75 m) layers, revealing that the quantitative effect of viruses on their hosts may be the same along the water column through the intervention of different AMGs. In the resource- and energy-limited bathypelagic waters of the Eastern Mediterranean, the detected AMGs could divert hosts’ metabolism toward energy production, through a boost in gluconeogenesis, fatty-acid and glycan biosynthesis and metabolism, and sulfur relay. Near the deep-chlorophyll maximum depth, an exceptionally high percentage of AMGs related to photosynthesis was noticed. Taken together our findings suggest that the roles of viruses in the deep sea might be even more important than previously thought as they seem to orchestrate energy acquisition and microbial community dynamics, and thus, biogeochemical turnover in the oceans.
Viruses are the most abundant biological entities in the oceans and have a large impact on biogeochemical processes. Indeed viruses modulate the cycling of nutrients, since organic matter is released from the lysed cells and returns to prokaryotes in readily-available dissolved form rather than being transferred to higher trophic levels (Suttle, 2007). Viral activity also results in the formation of gelatinous, aggregated particles from the products of lysis and through this process, organic material is diverted from surface layers to deeper ones (Zimmerman et al., 2020).
But even without lysing their hosts, viruses may reprogram hosts’ metabolism and thus alter nutrients flow, through the expression of viral Auxiliary Metabolic Genes (AMGs). AMGs are expressed by viral genomes when the host is infected and still intact; their expression causes a “shift” in hosts’ metabolism toward viral replication, for instance through enhancement of microbial nutrient uptake under low nutrients availability. This pattern was particularly studied under P limited conditions (Zeng and Chisholm, 2012; Kelly et al., 2013; Lin et al., 2016) and resulted in boosted host survival and viral replication too. Expression of AMGs has been described at the transcriptional level mostly in cultures (Lin et al., 2016; Bachy et al., 2018; Howard-Varona et al., 2020) and rarely in natural communities (Sieradzki et al., 2019; Heyerhoff et al., 2022) but also at the genome level in various ecosystems including the open and coastal ocean (Crummett et al., 2016; Luo et al., 2020; Tsiola et al., 2020; Jian et al., 2021). Special focus has been given on photosynthesis and carbon-metabolism related AMGs (Thompson et al., 2011) as well as on deciphering the wide variability of phage-host interactions that lead to totally different host metabolisms (Howard-Varona et al., 2018, 2020).
High-throughput exploration of viral populations is nowadays predominant (Guo et al., 2021; Nayfach et al., 2021; Pons et al., 2021; Gregory et al., 2022; Roux et al., 2023) in comparison to earlier studies that mostly applied flow cytometry (Marie et al., 1999) despite the fact that the usual nucleic acid stains may have underestimated viral counts. Viral community structure and diversity is now known across spatial and temporal scales (Mizuno et al., 2013; Hurwitz et al., 2015; Paez-Espino et al., 2016; Coutinho et al., 2019; Gregory et al., 2019; Luo et al., 2020; Tsiola et al., 2020; Wu et al., 2020). Global expeditions revealed that patterns of diversity are linked to temperature as well as oxygen and nutrients concentration and Prochlorococcus abundance (Brum et al., 2015; Coutinho et al., 2017; Gregory et al., 2019). Similarly to diversity, selection of AMGs was also found to be driven by environmental variables at the global and smaller scales, mainly by temperature and depth (Williamson et al., 2008). Temperature in specific seems to control not only diversity patterns (Steward et al., 2000; Hurwitz et al., 2013, 2015) but also viral abundances and cytometric characteristics (Winter et al., 2012).
Next, to the so called “qualitative” implications, the most straightforward implications of viruses in the oceans are quantitative; viruses cause mortality, i.e., removal of standing stock and release of carbon that may reach approx. 10 billion tons day−1 in the oceans (Suttle, 2007; Brussaard et al., 2008). Quantitative data, such as the frequency of lytically-infected and lysogenic cells, mostly originate by applying the viral reduction approach (Wilhelm et al., 2002; Winget et al., 2005). The dynamics of infections seem to be highly related to temperature (Mojica and Brussaard, 2014) and depth (Brum, 2005) but also to hosts’ abundance and productivity (Brum et al., 2016) and organic matter and energy availability (Lara et al., 2017).
To link quantitative and qualitative implications, relevant data needs to be worked together. We hereby describe viral abundances and lysis rates, viral community structure, and AMG content in the lytic fraction (<0.2 μm) in relation to the environmental setting of a largely unexplored basin in the Eastern Mediterranean Sea (EMS). The EMS is a semi-enclosed, concentration-type basin where evaporation largely exceeds precipitation and river run-off. It has unique circulation patterns (Velaoras et al., 2019) and physicochemical features, including high bottom-water temperatures, salinity and transparency, extreme oligotrophy and limited microbial plankton growth associated mainly to low phosphate and inorganic nitrogen sources (Azov, 1991; Krom et al., 2004). We sampled the Levantine Basin, the easternmost part of the EMS, at 5, 50, 75, and 1,000 m depths in order to investigate water masses with discrete temperature, density, and levels of oxygen, nutrients and chlorophyll; these factors that are among the most frequent controlling the microbial communities, including the viral component (Techtmann et al., 2015). According to Velaoras et al. (2019) who performed the hydrographic study in this cruise, distinct water masses are encountered in the studied area from the surface to the seafloor. Down to 75 m, Atlantic Water and Levantine Surface Water masses are rather warm, saline and saturated in oxygen, with no major differences in current distributions across the vertical scale of this depth layer. Levantine Surface Water masses are mostly prominent in the easternmost side of the sampling area (LV13 and LV18 sampling stations, see section 2.1), while the westernmost side (LV3 and LV10 sampling stations, see section 2.1) is additionally affected by a branch of Mid-Mediterranean Jet that carries low-salinity Atlantic Water from the Ionian to the Levantine Sea. Deeper than 75 m, the intermediate layer extends down to ~165 m, and further below, three water masses can be identified: the Transitional Mediterranean Water between ~600 and 1,200 m, the old Cretan Deep Water between ~1,400 and 2,500 m, and the Eastern Mediterranean Deep Water below ~3,000 m. As part of a multidisciplinary sampling expedition with pre-defined sampling depths, we chose to collect water from 5 m (representing surface water), 75 m [representing the deep euphotic layer, approaching the deep-chlorophyll maximum (Livanou et al., 2019)] and 50 m (representing an additional depth within the mixed layer and the thermocline, with nearly equal primary productivity levels as the deep-chlorophyll maximum, not published data). All surface/subsurface depths were chosen so they remain within the mixed layer (during the sampling time, stratification of the water column was just starting) and within the thermocline. Further, we chose to collect water from 1,000 m [representing a depth layer dominated by Transitional Mediterranean Water masses, rich in nutrients and of low salinity and oxygen (Velaoras et al., 2019)]. We coupled traditional and modern ecological and genomic approaches to shed light on ecosystem processes that are affected by viral actions. We expected to find discrete viral populations in terms of activity and genomic signature in the coldest waters in the bathypelagic zone, dependent on temperature and energy. Sampling constraints and high analytical costs did not allow us to study a higher number of replicated sampling stations and seasons. Thus, we wish to point out that the presented findings should be generalized to other ecosystems/seasons with caution, and that further testing is needed to confirm our hypotheses. According to previous findings in the same project that revealed depth-specific eukaryotic community patterns (Santi et al., 2020) and other recent similar surveys (Coutinho et al., 2019, 2023), we hypothesized that a wider repertoire of viral AMGs characterize the cold bathypelagic waters, available to aid energy acquisition under resource-depleted conditions.
Sampling was carried out on board the R/V Aegaeo in April 2016, at the onset of seasonal thermal stratification. Seawater was collected between 09:00 and 12:00 am by Rosette-Niskin deployment from 4 stations in the Western Levantine basin (Eastern Mediterranean Sea), encoded as LV3 (35.0333oN, 23.4667oE), LV10 (34.6667oN, 24.3667oE), LV13 (34.2500oN, 25.4833oE), and LV18 (34.4333oN, 26.3833oE). Four depth layers were sampled in each station: 5, 50, 75, and 1,000 m. The collected volume was transferred from the Niskin bottles into acid-cleaned and deionized water-rinsed low-density polyethylene containers, and further processed for the various analyses.
Hydrographic profiles of salinity (S), temperature (T) and density (D) were obtained using a Seabird SBE 9plus CTD underwater unit connected to a Seabird SBE 11 deck unit (Velaoras et al., 2019). The methodologies for the determination of dissolved oxygen (DO), nitrate (NO3−), nitrite (NO2−), silicate (SiO4), ammonium (NH4), phosphate (PO43−), dissolved organic carbon (DOC), phosphorus (DOP) and nitrogen (DON), total nitrogen (TN) and phosphorus (TP) and chlorophyll a (Chl) concentrations are presented in the Supplementary material.
The abundance of virus-like particles (VLP) was determined based on the protocol of Brussaard (2004) and that of heterotrophic and autotrophic bacteria based on Marie et al. (1997) from glutaraldehyde-fixed samples (0.5% final concentration). Samples were stained with SYBR™ Green I nucleic acid stain (ThermoFisher Scientific) at 5 × 10⁻⁵ and 4 × 10⁻⁴ final dilution of the stock solution for VLP and heterotrophic bacteria, respectively, and then incubated for approx. 15 min at 80°C and for approx. 30 min in the dark for VLP and heterotrophic bacteria, respectively. Autotrophic bacteria were distinguished based on their auto-fluorescence signals. Yellow-green latex beads of 1 μm nominal size (Polysciences) were added and used as an internal standard of fluorescence. A FACSCalibur™ instrument (Becton Dickinson) was used at conventional air pressure, with an air-cooled laser at 488 nm and standard filter setup. Data were processed with the CellQuest™ Pro software (Becton Dickinson).
Viral production rates were estimated following the viral reduction approach (Winter et al., 2004; Winget et al., 2005). Two L of seawater were pre-filtered through 0.8 μm pore size polycarbonate membranes to exclude large particles and grazers. The 0.8 μm-filtrate was concentrated using a tangential flow filtration system (Sartorius, VF20P7, 0.2 μm MWCO). The 0.22-μm filtrate was back-flushed with the use of the reverse flow mode of a peristaltic pump (Masterflex, EW-07523-80) in order to produce an ultra-concentrated-in-bacteria seawater volume (100 mL). The remaining 0.22-μm filtrate was further filtered with a spiral-wound ultra-filtration cartridge (Sartorius, VF20P2, 30.000 MWCO) so to produce a virus-free ultra-filtered volume (200 mL). Bacterial-concentrated and virus-free water masses were mixed gently, and then equally distributed into 50-mL centrifuge tubes (triplicate incubations). Tubes were incubated at in situ temperature (as determined by CTD) and in the dark for 24 h. Every 0, 1, 3, 6, 12, and 24 h during the incubation, samples were fixed for the determination of viral and bacterial abundances as described above. Lytic viral production (lytic VP, expressed in virus-like particles mL−1 h−1) was estimated from the slopes of the relationships between net increases in viral abundance over the respective time period of the net increase.
Lytic VP was further corrected for the bacterial losses due to the filtration; the recovery percentage was determined by dividing the mean bacterial abundance at the onset of the incubations (B0) by the in situ bacterial abundance (B original), and this factor was multiplied to the lytic VP measurement.
The methodology for the assessment of heterotrophic bacterial production is presented in the Supplementary material.
Seawater was filtered through 0.2 μm polycarbonate membranes under low vacuum. The 0.2-μm filtrate was chemically treated with 1 mg L−1 FeCl3 to achieve viral particle flocculation within the following 6–12 h (John et al., 2011) and filtered again through 1 μm polycarbonate filters. The 1 μm filters were stored at 4°C, pending resuspension in ascorbic acid buffer. The solution of ascorbate-EDTA buffer was prepared daily (0.25 M ascorbic acid, 0.2 M Mg2EDTA, pH 6–6.5), kept in the dark and added in the viral flocculate, followed by hand shaking and overnight rotation at 4°C. After resuspension, viral particles in liquid were retained from the 1 μm filter by ultra-centrifugation at 141.000 g (SorvallTM WX100 ultracentrifuge, ThermoFisher Scientific, Sorvall TH 641 swing out rotor). Viral DNA was extracted following a CTAB protocol (Winnepenninckx et al., 1993) and purified as described in details elsewhere (Tsiola et al., 2020). The extracted DNA was dissolved in ultrapure water and stored at −20°C. Quantification of viral dsDNA was done with the Qubit high sensitivity assay kit in a 3.0 Qubit™ fluorometer (ThermoFisher Scientific).
Viral DNA shearing was done at 300 bp using the standard protocol for Covaris™ focused ultra-sonicator system. An indexed library for Illumina sequencing was prepared using the NEBNext Ultra DNA Library Prep Kit for Illumina (New England BioLabs) following the manual instructions. Size selection was done using AMPure XP beads (Beckman Coulter). PCR cycles were 6 (according to the manufacturer advice with regards to the amount of DNA input). Metagenomic libraries were sequenced in the Illumina Hiseq 4000 platform available at KAUST Bioscience Core Lab using paired-end sequencing.
Viral metagenome reads in FASTQ format were imported to CLC Genomics Workbench v.7 (CLC Bio) and trimmed using a minimum phred score of 20, a minimum length of 50 bp, allowing no ambiguous nucleotides and trimming off Illumina sequencing adaptors if found. The trimmed metagenome reads were assembled using CLC’s de novo assembly algorithm, using a k-mer of 63 and a minimum scaffold length of 500 bp. Raw reads were deposited on the NCBI with reference PRJNA996089.1 The assembled contigs were then analyzed using the iVirus pipeline (Bolduc et al., 2017) through the Cyverse platform (Goff et al., 2011) and VirFinder software (Ren et al., 2017) with criteria as described previously. Viral sequences with a VirFinder score ≥ 0.7 and p < 0.05 and VirSorter categories 1 and 2 were used for further analysis. The abundance and metabolic potential of auxiliary and metabolic potential of AMGs was determined through VIBRANT (v1.2.1; Kieft et al., 2019) using the virome option. The taxonomy of viral contigs was determined with the VPF-Class software which uses the IMG/VR v3 database for this purpose (Pons et al., 2021; Roux et al., 2021). Further, viral metagenomic sequence data were processed with the MetaPop multi-functional bioinformatic pipeline (Gregory et al., 2022) for macrodiversity analyses with the “vegan” R package. MetaPop was run with default parameters and cut-offs. Raw population abundances were normalized in order to mitigate sample-to-sample variation in the number of reads, via normalizing to the library with the highest number of reads. The abundance table of viral operational taxonomic units and then, it was used to generate a Bray-Curtis distance matrix. MetaPop macrodiversity outputs included population abundances, and alpha- (within community) and beta-diversity (between community) indices. Realizing the need to apply up-to-date pipelines for quality assessment of our viral metagenomes, we tested the clustering function of CheckV (Nayfach et al., 2021). However, no viruses were clustered indicating a lack of duplicates in our analyses. The raw number of viral metagenome reads, the quality of reads, the number of total contigs, the contig length (total, minimum and maximum) and the N50 contig length are summarized in Table 1.
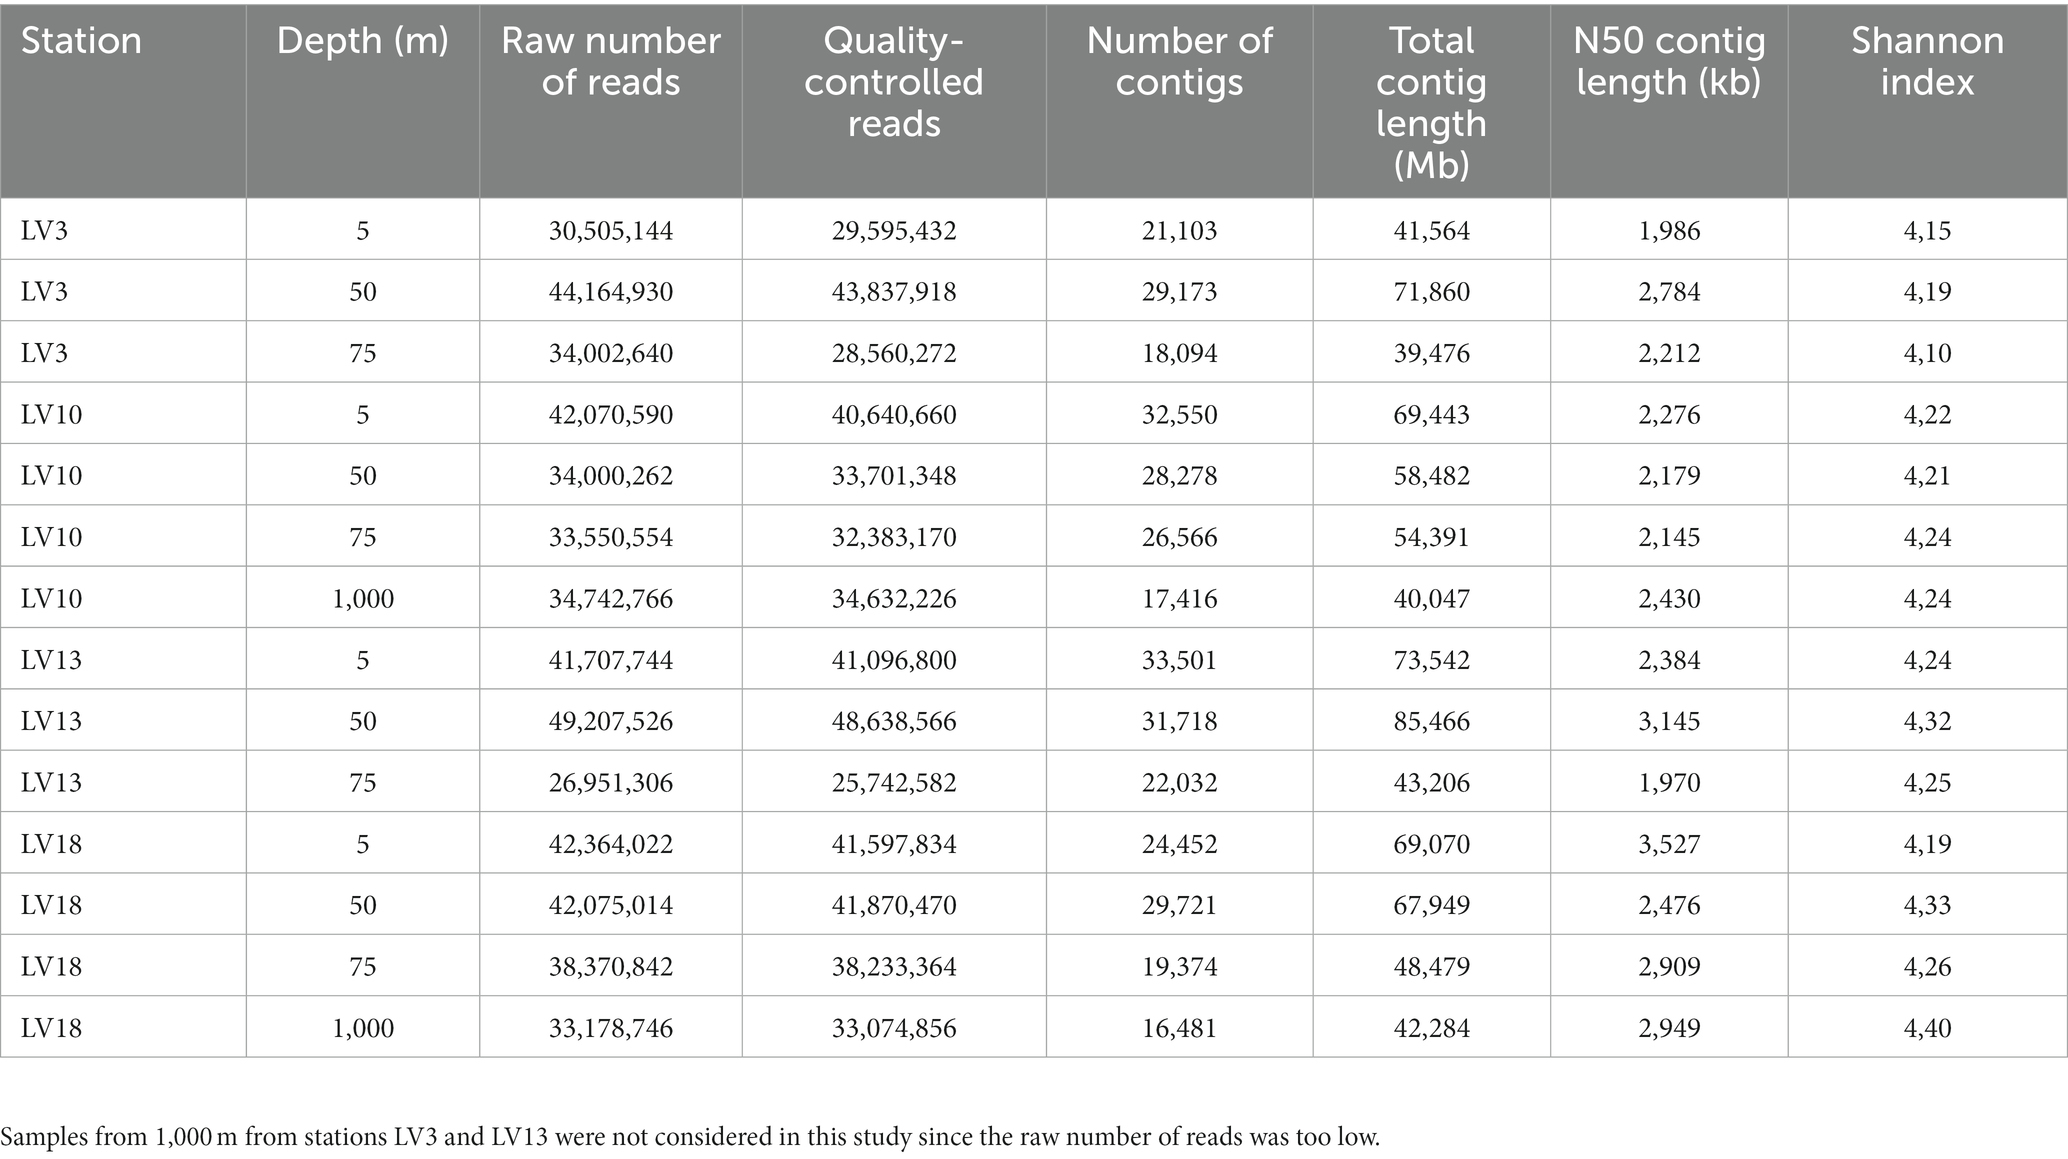
Table 1. Raw numbers of viral metagenome reads, number of reads after quality control, number of total contigs, total contig length, the N50 contig length, and Shannon index of the viral metagenomes at the sampling stations.
Principal coordinates analysis was applied to coordinate the viral diversity and AMG data (Clarke and Ainsworth, 1993). Canonical analysis of principal coordinates (CAP) was applied to define clusters of samples based on “depth,” using the set of physical and chemical measurements (S, T, D, and the concentrations of PO43−, NO3−, NO2−, NH4, SiO4, TN, TP, DO, DOC, DOP, DON). The clustering was tested by permutational multivariate analysis of variance (PERMANOVA). Then, patterns in viral diversity and AMG content between the stations were tested for significance by applying one-factor PERMANOVA using the factor “depth.” The null hypothesis was that there are no differences. When 5, 50, and 75 m were not different to each other, they were named as “surface/subsurface samples” for brevity. Bray–Curtis dissimilarity matrices on square-root transformed metagenomics data were constructed (Clarke and Warwick, 1994) to avoid misleading interpretations due to the sample-to-sample variation in read counts (Table 1). Hypothesis testing was performed using 999 permutations and pairwise tests using a significant level of 0.05. A principal coordinate analysis (PCoA) plot of all Bray-Curtis distances was created via the MetaPop pipeline and is presented as a means of macrodiversity visualization of the viral metagenomic data. The list of explanatory variables was normalized and the normalized matrix was used to create a resemblance matrix using Euclidean distances. Statistical analyses were done with the software package PRIMER v6 (PRIMER-E Ltd, Plymouth Marine Laboratory, Natural Environmental Research Council, United Kingdom) with PERMANOVA + add-on software (Anderson et al., 2008; Somerfield, 2008).
One-way analysis of variance (ANOVA) was applied to check for significant differences among the different depth layers in: the percentage contribution of individual genera and families over total viral contigs, the percentage contribution of viral AMGs over total number of AMGs and over their assigned KEGG category, the abundances of bacteria and virus-like particles, and finally in the physical, chemical and biological variables. The significance of the differences was assessed with post hoc Tukey test. Homogeneity of variance was checked using Levene’s test. ANOVAs were performed using IBM SPSS statistics software v23.
None of the measured variables differed between stations at the horizontal scale (PERMANOVA), thus, stations LV3, LV10, LV13, and LV18 are considered as replicates. Supplementary Table 1 summarizes output of all PERMANOVAs testing for differences between the sampling stations. Output of all PERMANOVAs testing variation among sampling depths are presented in Table 2, and not in the main body text (degrees of freedom, mean square, Pseudo-F ratio, p value). The Canonical Analysis of Principal coordinates (CAP) of physical and chemical variables (S, T, D, and the concentrations of NOx, PO43−, DO, SiO4, DO, DOC, DOP, DON, TN and TP) revealed four significantly different groups, which were confirmed by PERMANOVA (p < 0.001). Samples from the same depth layers were grouped together and distantly from the others (Figure 1A).
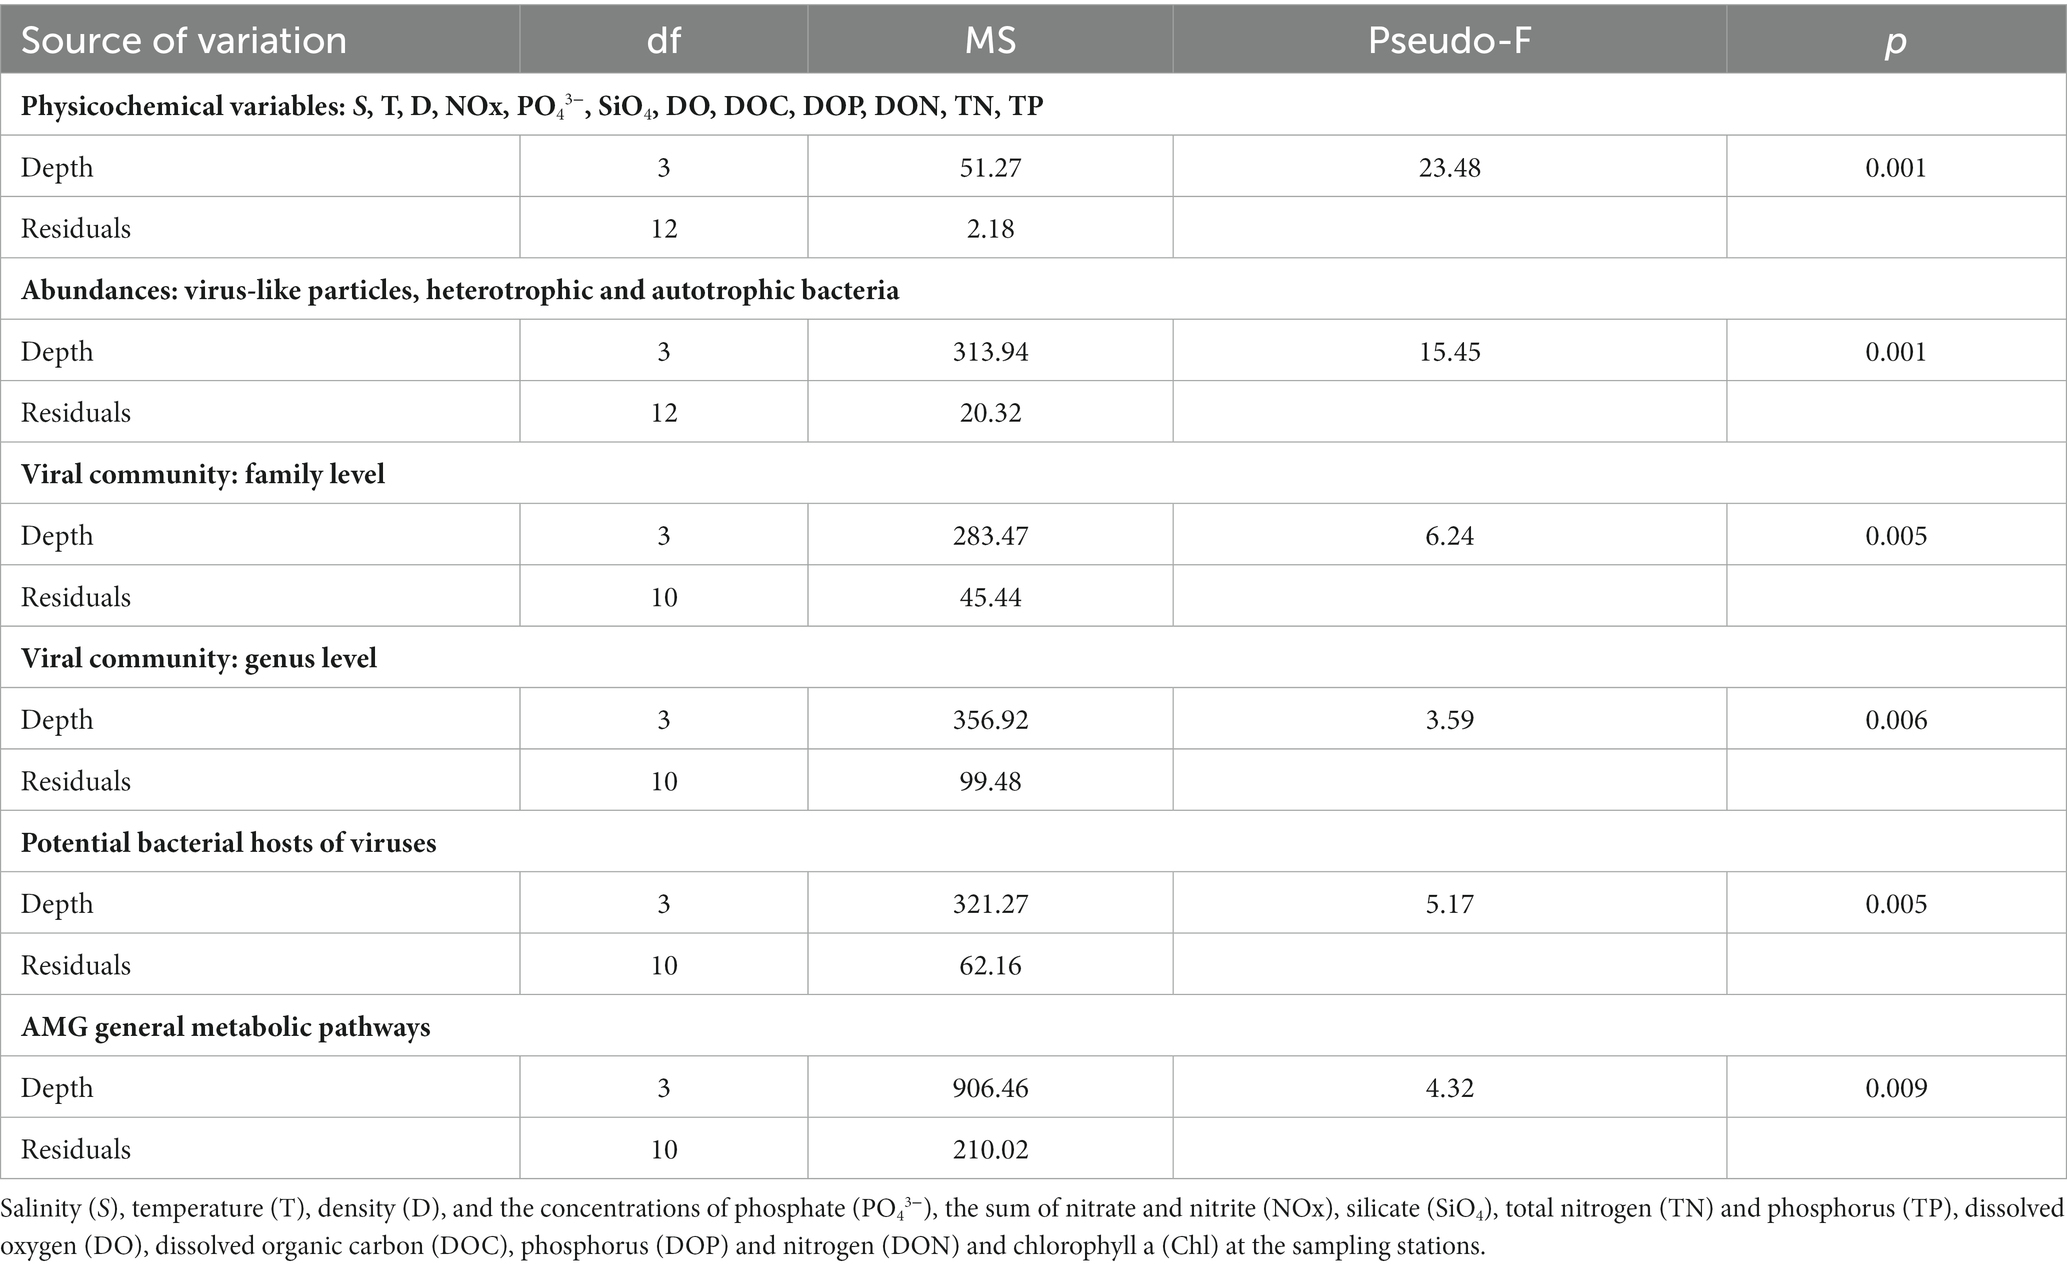
Table 2. Output of permutational analysis of variance (PERMANOVA) testing variation among sampling depths.
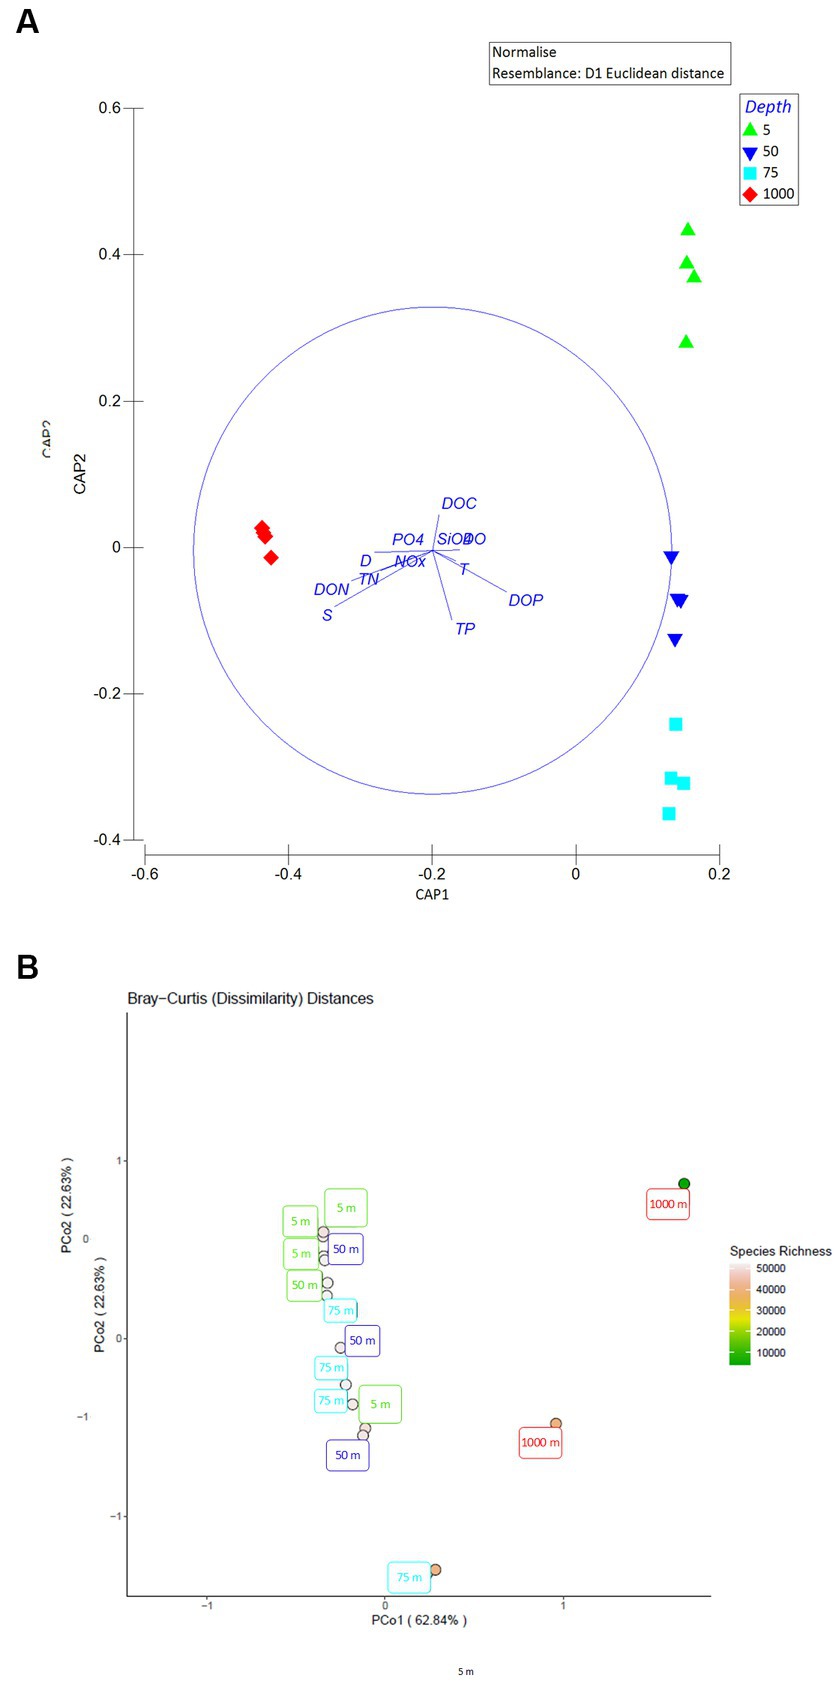
Figure 1. (A) Canonical analysis of principal coordinates (CAP) of the seawater physicochemical variables (blue solid-lined circle), depicting the sample grouping based on “depth” and Pearson correlations of the physicochemical variables with the canonical axes. Explanatory variables were normalized and the normalized matrix was used to create a resemblance matrix using Euclidean distances. S, salinity; T, temperature; D, density, concentrations of NOx, dissolved inorganic nitrogen; PO4, phosphate; DO, dissolved oxygen; SiO4, silicate; DON, dissolved organic nitrogen; DOC, dissolved organic carbon; TN, total nitrogen; and TP, total phosphorus. The length and direction of the vectors indicate their relative strength and direction of relationship, respectively. (B) Principal coordinates analysis (PCoA) ordination plot of all Bray-Curtis distances. An abundance table of viral operational taxonomic units was generated via MetaPop and then, the abundance table was used to generate a Bray-Curtis distance matrix to visualize viral community distributions using a PCoA ordination method. The color of each circle represents the species richness within each sample.
S averaged 38.98 ± 0.13 in the sampling stations with equally high values at surface/subsurface depths (one-way ANOVA, p > 0.05). Approx. 0.21 lower S was measured at 1,000 m compared to averaged surface/subsurface values (Table 3) but the difference was significant only when 1,000 m were compared to 75 m (one-way ANOVA, p < 0.05). T ranged between 13.80°C and 18.30°C (Table 3). Small variation was seen between 50 and 75 m (16.81°C ± 0.46°C). All other depth layers exhibited significantly different T between them (one-way ANOVAs, p < 0.05), with the coldest waters seen at 1,000 m (post hoc Tukey test, p < 0.05).
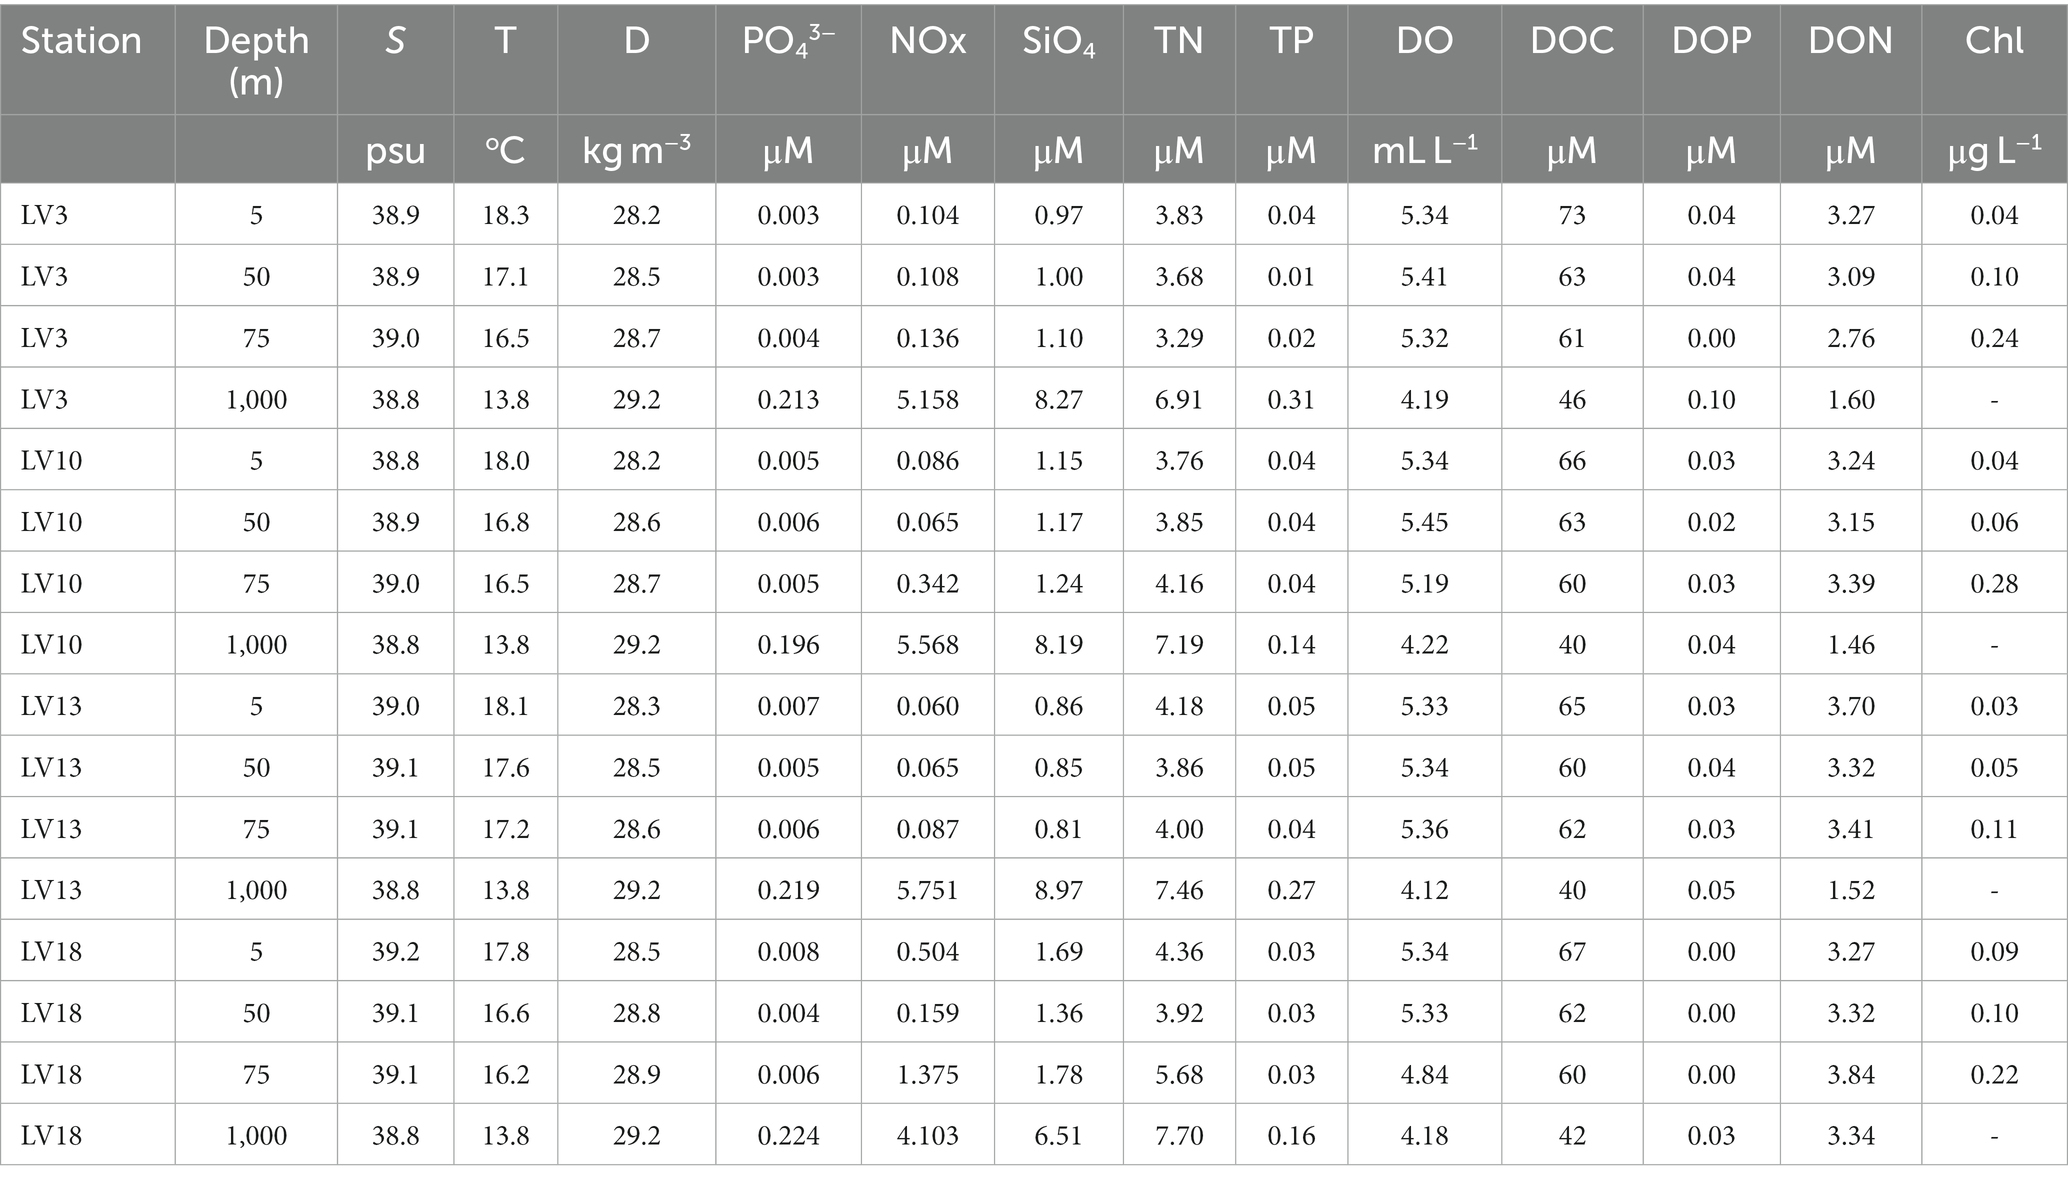
Table 3. Salinity (S), temperature (T), density (D), and the concentrations of phosphate (PO43−), the sum of nitrate and nitrite (NOx), silicate (SiO4), total nitrogen (TN) and phosphorus (TP), dissolved oxygen (DO), dissolved organic carbon (DOC), phosphorus (DOP) and nitrogen (DON) and chlorophyll a (Chl) at the sampling stations.
The concentrations of dissolved inorganic and organic nutrients significantly differed between surface/subsurface depths and 1,000 m (one-way ANOVAs, p < 0.05), being higher at 1,000 m (post hoc Tukey test, p < 0.05). DO concentration followed the opposite pattern (i.e., it was significantly lower at 1,000 m compared to surface/subsurface layers, post hoc Tukey test, p < 0.05). Measurements of these variables as well as of D, DOC, DON, DOP are presented in Table 3, and are discussed in the Supplementary material. Chl concentrations differed significantly between 5 and 75 m, and between 50 and 75 m (one-way ANOVAs, p < 0.05). Chl concentration was ~4x higher at 75 m than 5 m, and ~3x higher at 75 m than 50 m (post hoc Tukey tests, p < 0.05, Table 3).
Neither viral (4.6 × 10⁶ ± 4.3 × 10⁵ mL−1) nor heterotrophic bacterial (3.2 × 10⁵ ± 8.4 × 10⁴ mL−1) abundances differed within the surface/subsurface layers (one-way ANOVAs, p > 0.05, Figures 2A,B). Significant differences were seen between surface/subsurface and 1,000 m samples at both cases (one-way ANOVA, p < 0.05); abundances were significantly lower at 1,000 m than at the other depths (post hoc Tukey test, p < 0.05). The abundance of Synechococcus did not differ between the sampling depths, opposite to Prochlorococcus (one-way ANOVA, p < 0.05), which was significantly lower at 5 than 75 m, as well as at 50 than 75 m (post hoc Tukey tests, p < 0.05). Synechococcus overcame in abundance Prochlorococcus by approx. one order of magnitude at 5 m, and the opposite was noticed at 75 m (Figures 2C,D). The resulting virus-to-bacteria ratio (VBR) varied greatly between surface/subsurface (9–21) and 1,000 m (56–107) considering in the calculation total bacterial abundances (Figure 2E). Significantly higher VBR was measured at 1,000 m than surface/subsurface samples (post hoc Tukey test, p < 0.05).
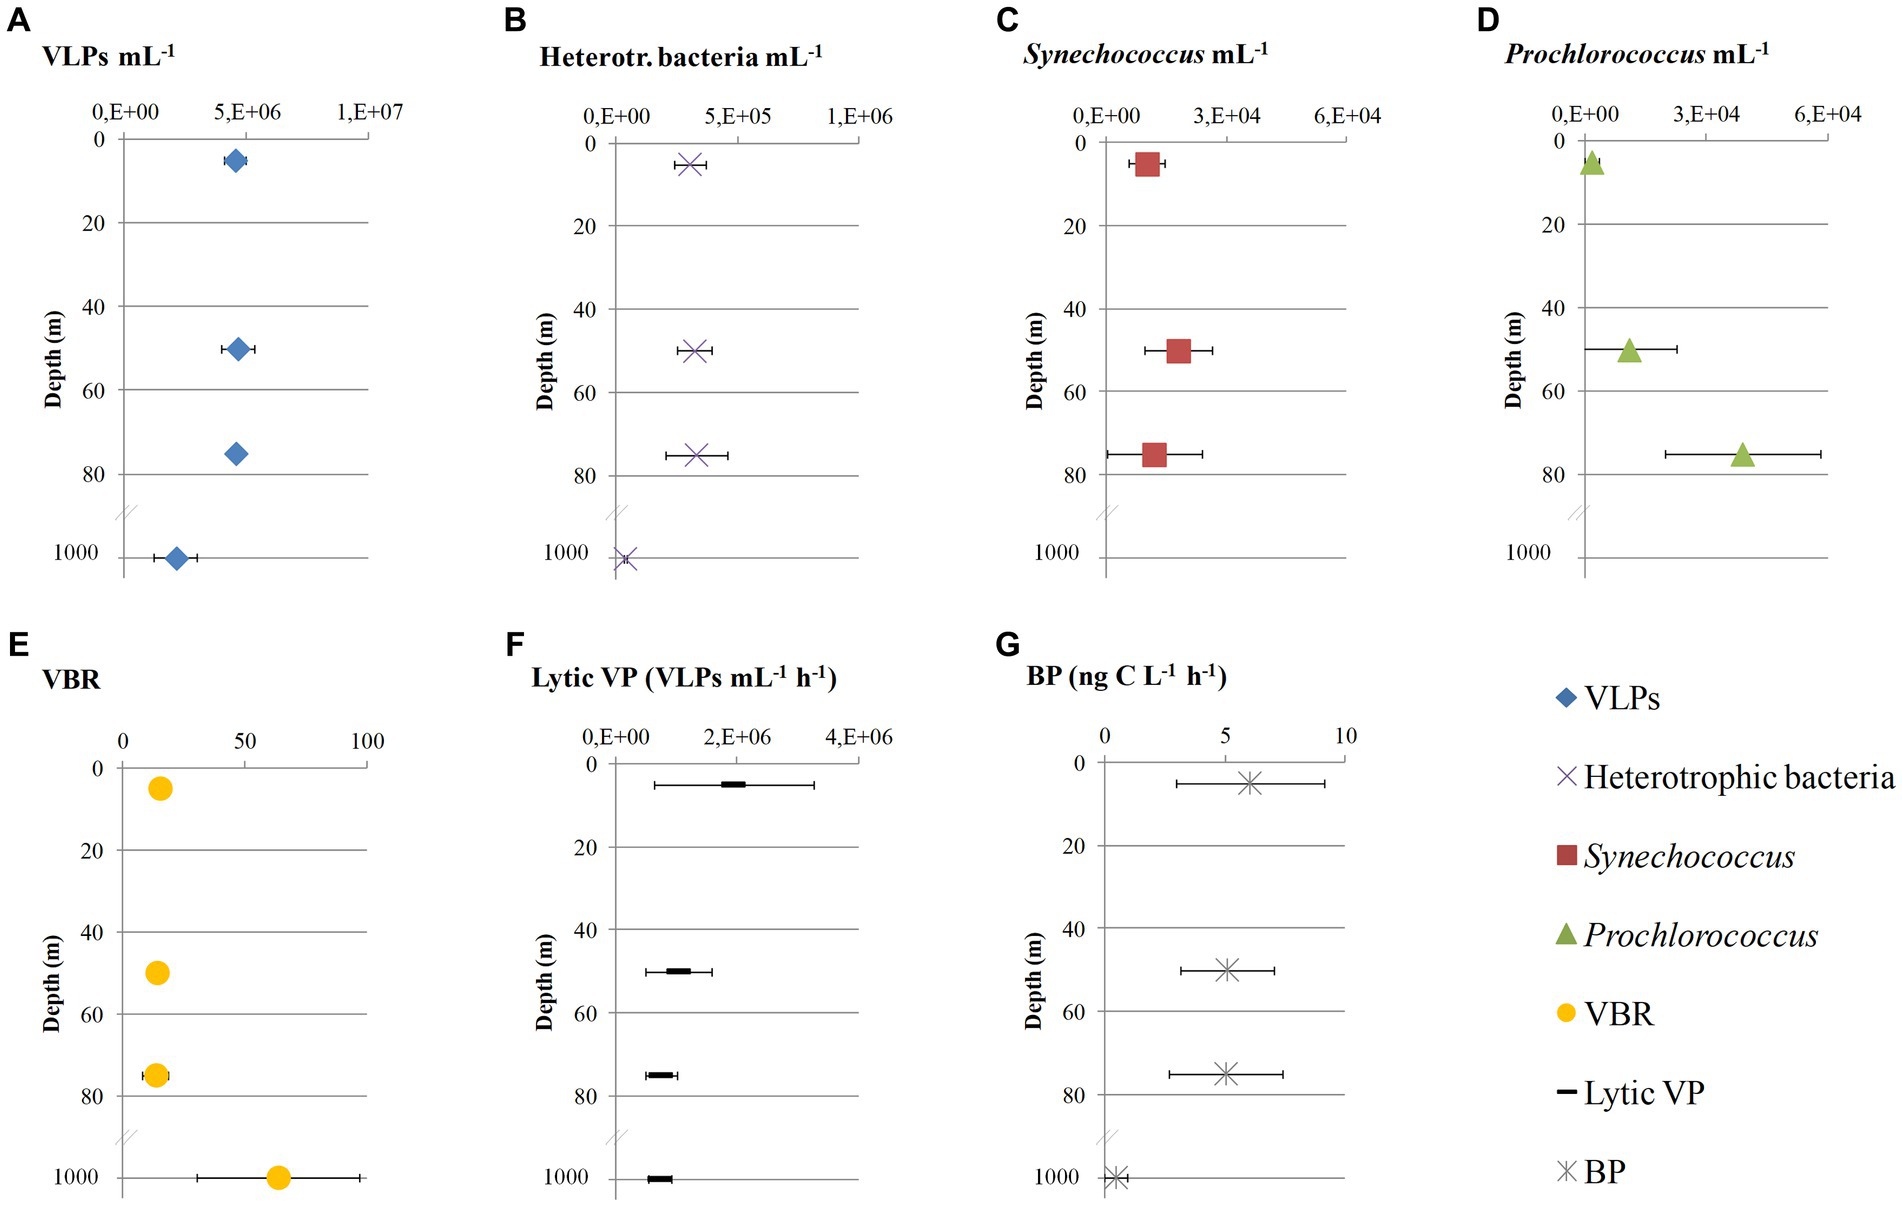
Figure 2. Abundances of virus-like particles (A: VLPs), heterotrophic bacteria (B), Synechococcus (C), Prochlorococcus (D), the ratio between virus-like particles and total bacteria (E: VBR), lytic viral production rate (F: Lytic VP) and heterotrophic bacterial production (G: BP) at the sampling area represented as average values and standard deviations that derive from the four sampling stations (LV3, LV10, LV13, and LV18) at four sampling depths (5, 50, 75, and 1,000 m).
Lytic VP did not differ between the sampling depths (one-way ANOVA, p > 0.05), and it was slightly higher at 5 m (1.9 × 10⁶ ± 1.3 × 10⁶ cells mL−1 h−1) than the other depths (8.3 × 10⁵ ± 3.6 × 10⁵ cells mL−1 h−1; Figure 2F). BP did not differ within the surface/subsurface samples (one-way ANOVA, p > 0.05) and ranged between 2.35 and 9.28 ng C L−1 h−1 (Figure 2G). There was a significant difference between surface/subsurface and 1,000 m samples (one-way ANOVA, p < 0.05); significantly lower BP levels were seen at 1,000 m than surface/subsurface (post hoc Tukey test, p < 0.05).
Viral community composition differed with the sampling depth at the family and genus level (PERMANOVAs, p < 0.01). Bray-Curtis distances were plotted using the principal coordinates analysis method (PCoA, Figure 1B). The two 1,000-m samples were more dissimilar to the rest and exhibited the highest species richness among all samples, while surface/subsurface samples were less dissimilar to each other and clustered together (Figure 1B). Alpha diversity indices (richness, Chao1, ACE, Shannon’s H, Simpsons, inverse Simpsons, Fisher, and Pielou’s J) for the samples are presented in Supplementary Table 1A. A percentage of 30 ± 7% of the contigs remained unassigned to the family level. Within the assigned contigs, the dominant families were Podoviridae (29% ± 3%) and Siphoviridae (23% ± 3%, Figure 3A). At 1,000 m, significantly lower contribution of Podoviridae (24% ± 2%) was seen compared to 5 m (27% ± 1%) and 50 m (30% ± 2%; one-way ANOVAs, p < 0.05). The same was noticed for Siphoviridae that contributed less at 1,000 m (19% ± 4%) compared to 5 m (22% ± 2%) and 50 m (24% ± 2%; one-way ANOVAs, p < 0.05). The third most abundant family was that of Myoviridae, exhibiting a decreasing trend (post hoc Tukey test, p < 0.05) from surface (23% ± 5% relative abundance) to deep waters (14% ± 0.3%, Figure 3A). Phycodnaviridae family was seen at all surface/subsurface stations with no significant differences in its contribution (0.7%–1.4%). The remaining taxa (<0.5%) were rare families (27 in total). Most of them were found in few stations each. The families Adenoviridae, Baculoviridae, Herpesviridae, Inoviridae, Iridoviridae, Marseilleviridae, Microviridae, Mimiviridae, Poxviridae were found in all stations (Figure 3B). The contribution of genera is presented in the Supplementary material (Supplementary text and Supplementary Table 2).
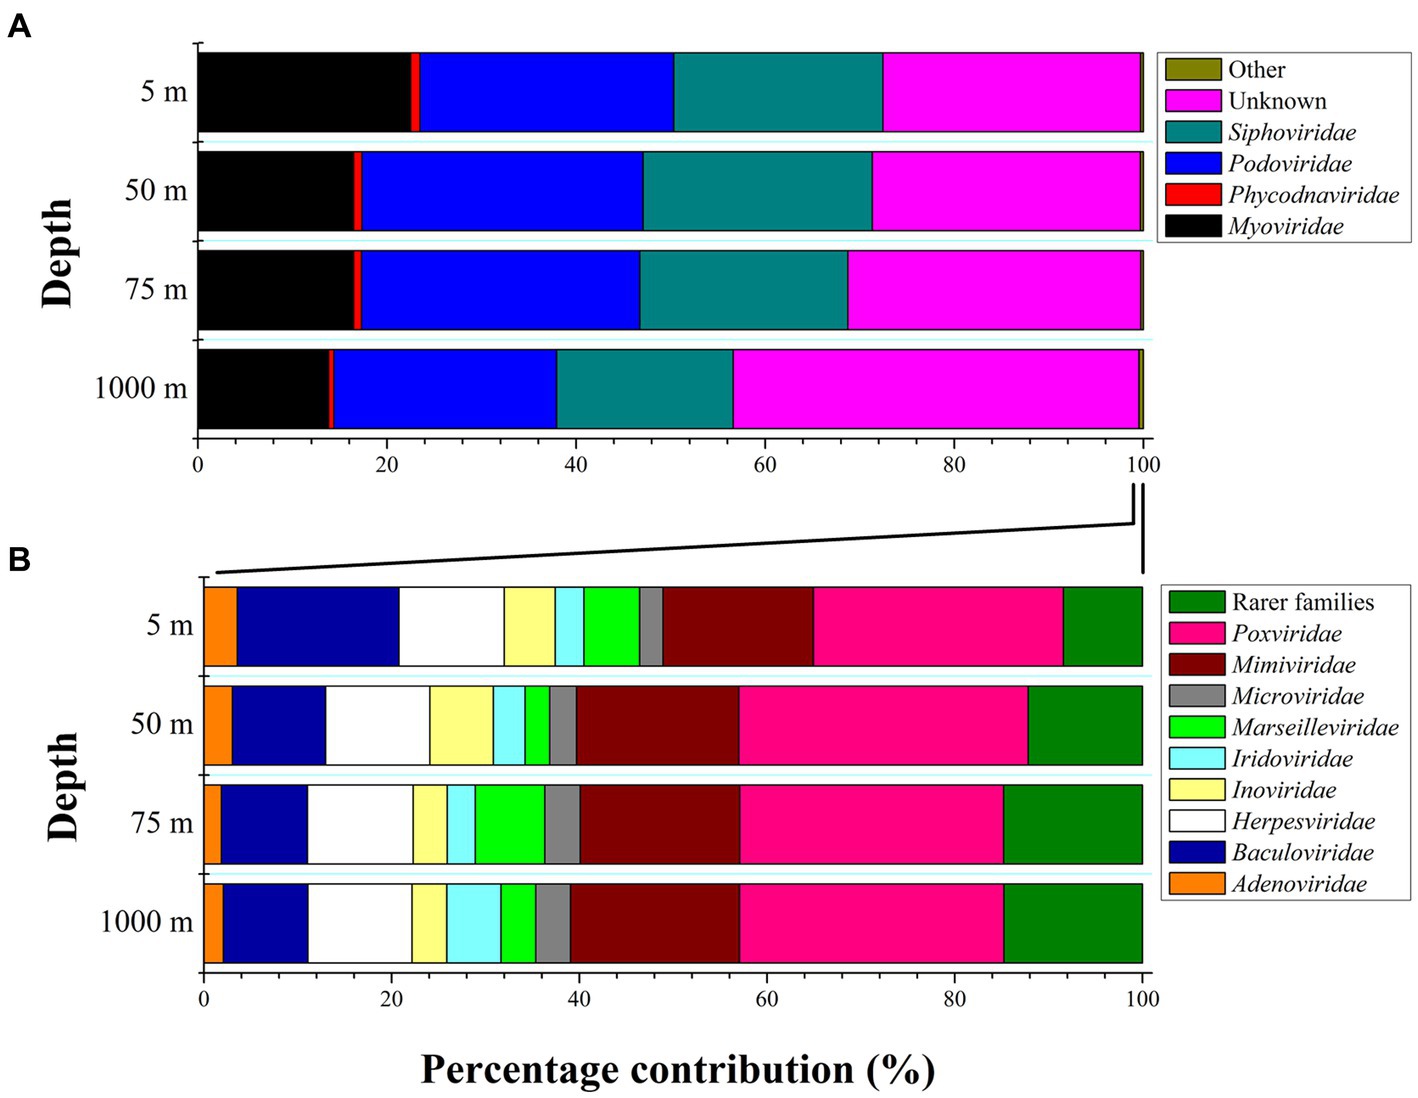
Figure 3. (A,B) Percentage contribution of the major viral families to total viral taxa at the sampling area represented as average values and standard deviations that derive from the four sampling stations (LV3, LV10, LV13, and LV18) at four sampling depths (5, 50, 75, and 1,000 m). “Other” families contribute <0.5% to the total reads and are expanded in the bottom left plot (at panel B: the 100% x axis refers to the “Other” fraction of panel A).
Information about the potential host assignment is presented in the Supplementary material.
A list of 143 AMGs was counted and associated with a metabolic pathway as defined by the Kyoto Encyclopedia of Gene (KEGG) using the VIBRANT method. The general pathways are shown in Table 4 and include: “amino acid metabolism,” “carbohydrate metabolism,” “metabolism of cofactors and vitamins,” “energy metabolism,” “lipid metabolism,” “glycan biosynthesis and metabolism,” “nucleotide metabolism,” “biosynthesis of secondary metabolites,” “folding, sorting and degradation,” “metabolism of other amino acids,” “metabolism of terpenoids and polyketides,” and “xenobiotics biodegradation and metabolism.” The specific metabolic pathways within the general ones are shown in Figure 4 and Supplementary Table 3. Statistical analysis for differences between the sampling depths was performed (1) in percentage contribution of specific AMG pathways within their general metabolic category, as well as (2) in percentage contribution of specific AMG pathways over total AMG reads.
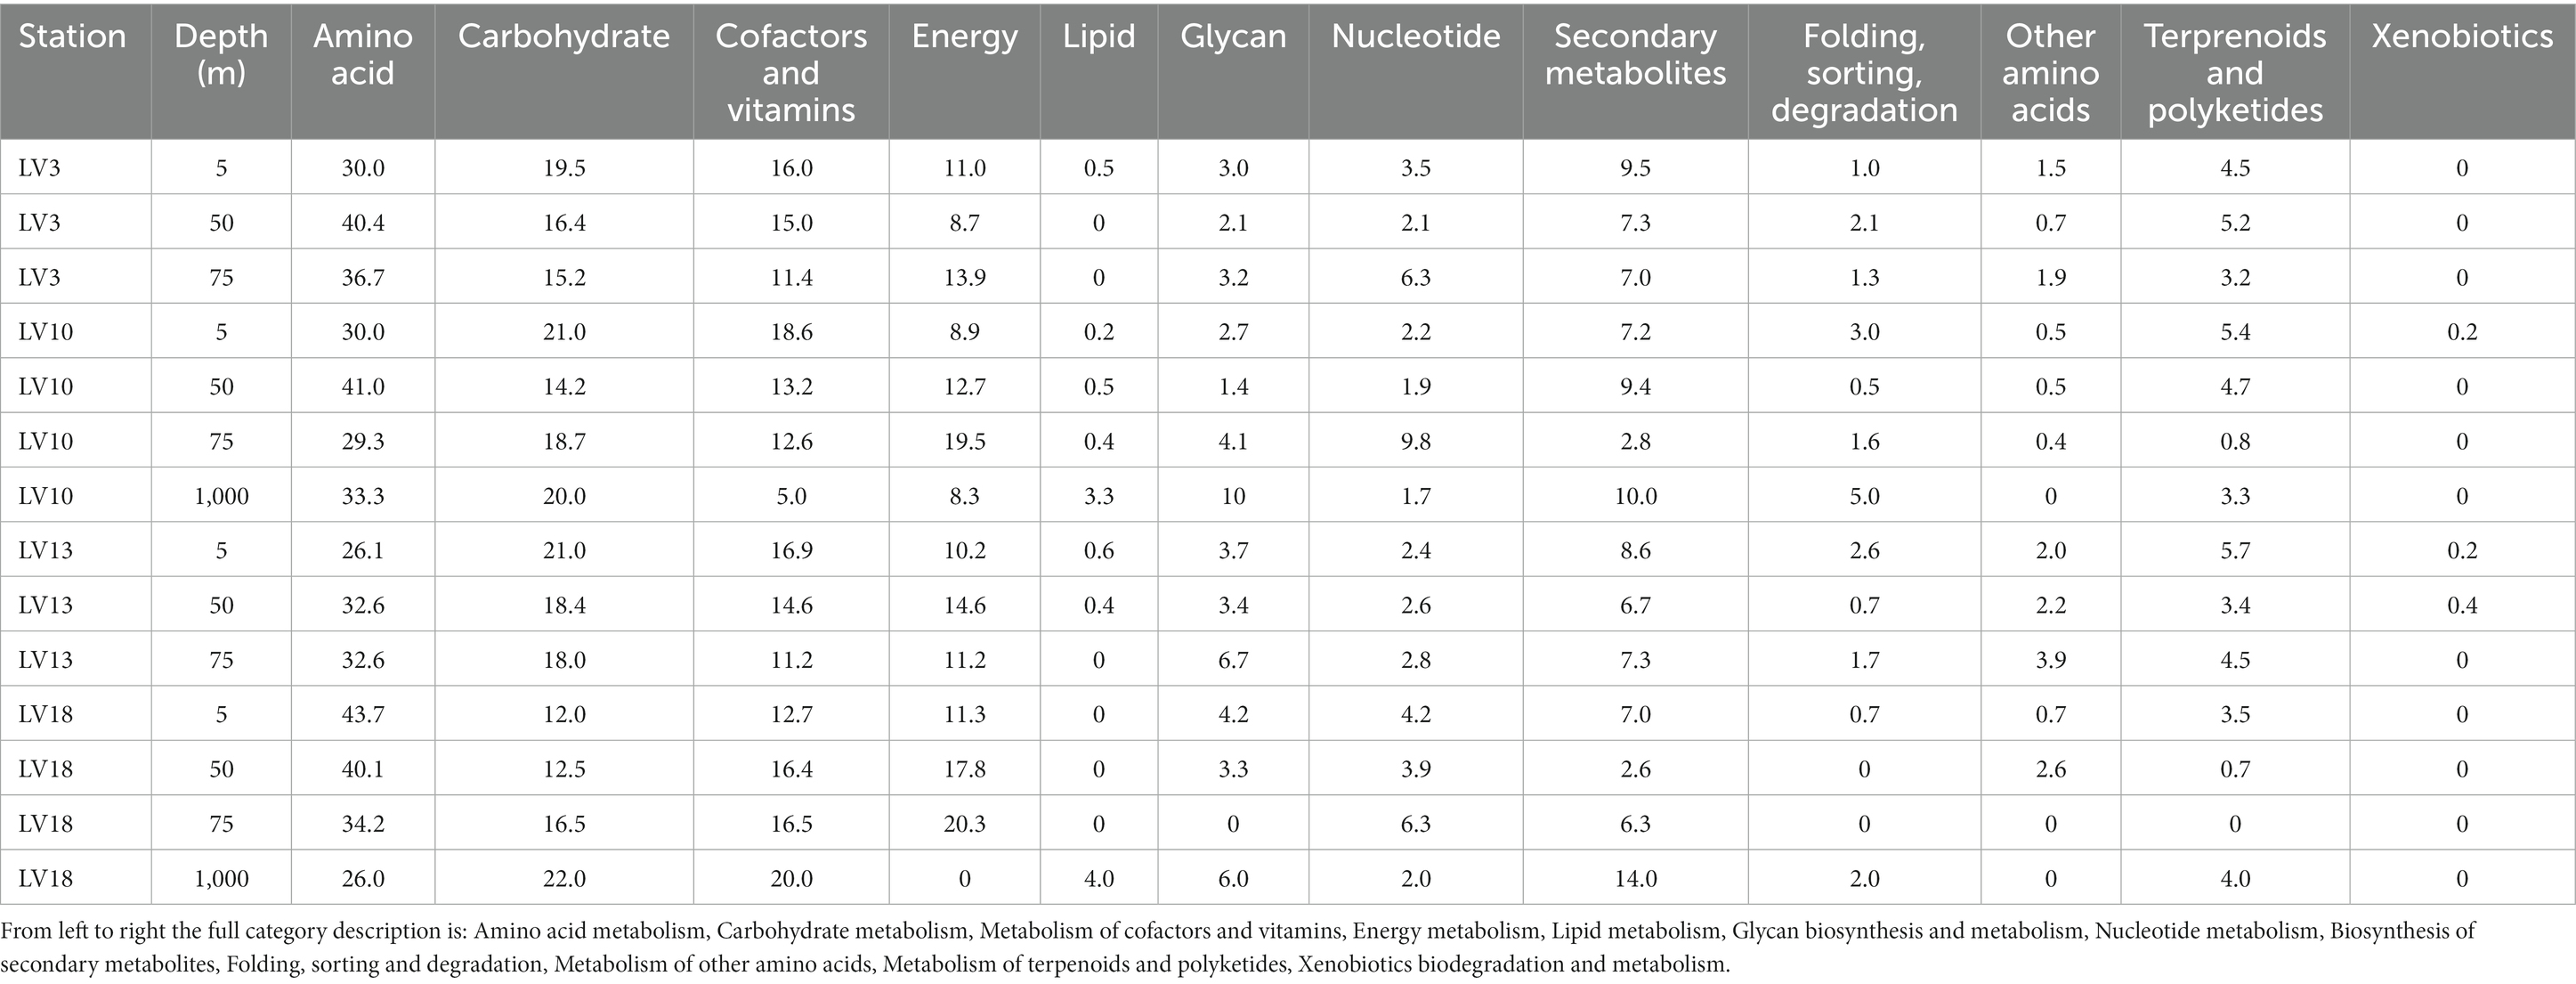
Table 4. Percentage contribution of the general AMG metabolic pathways (as defined by KEGG using the VIBRANT method) identified at the sampling stations.
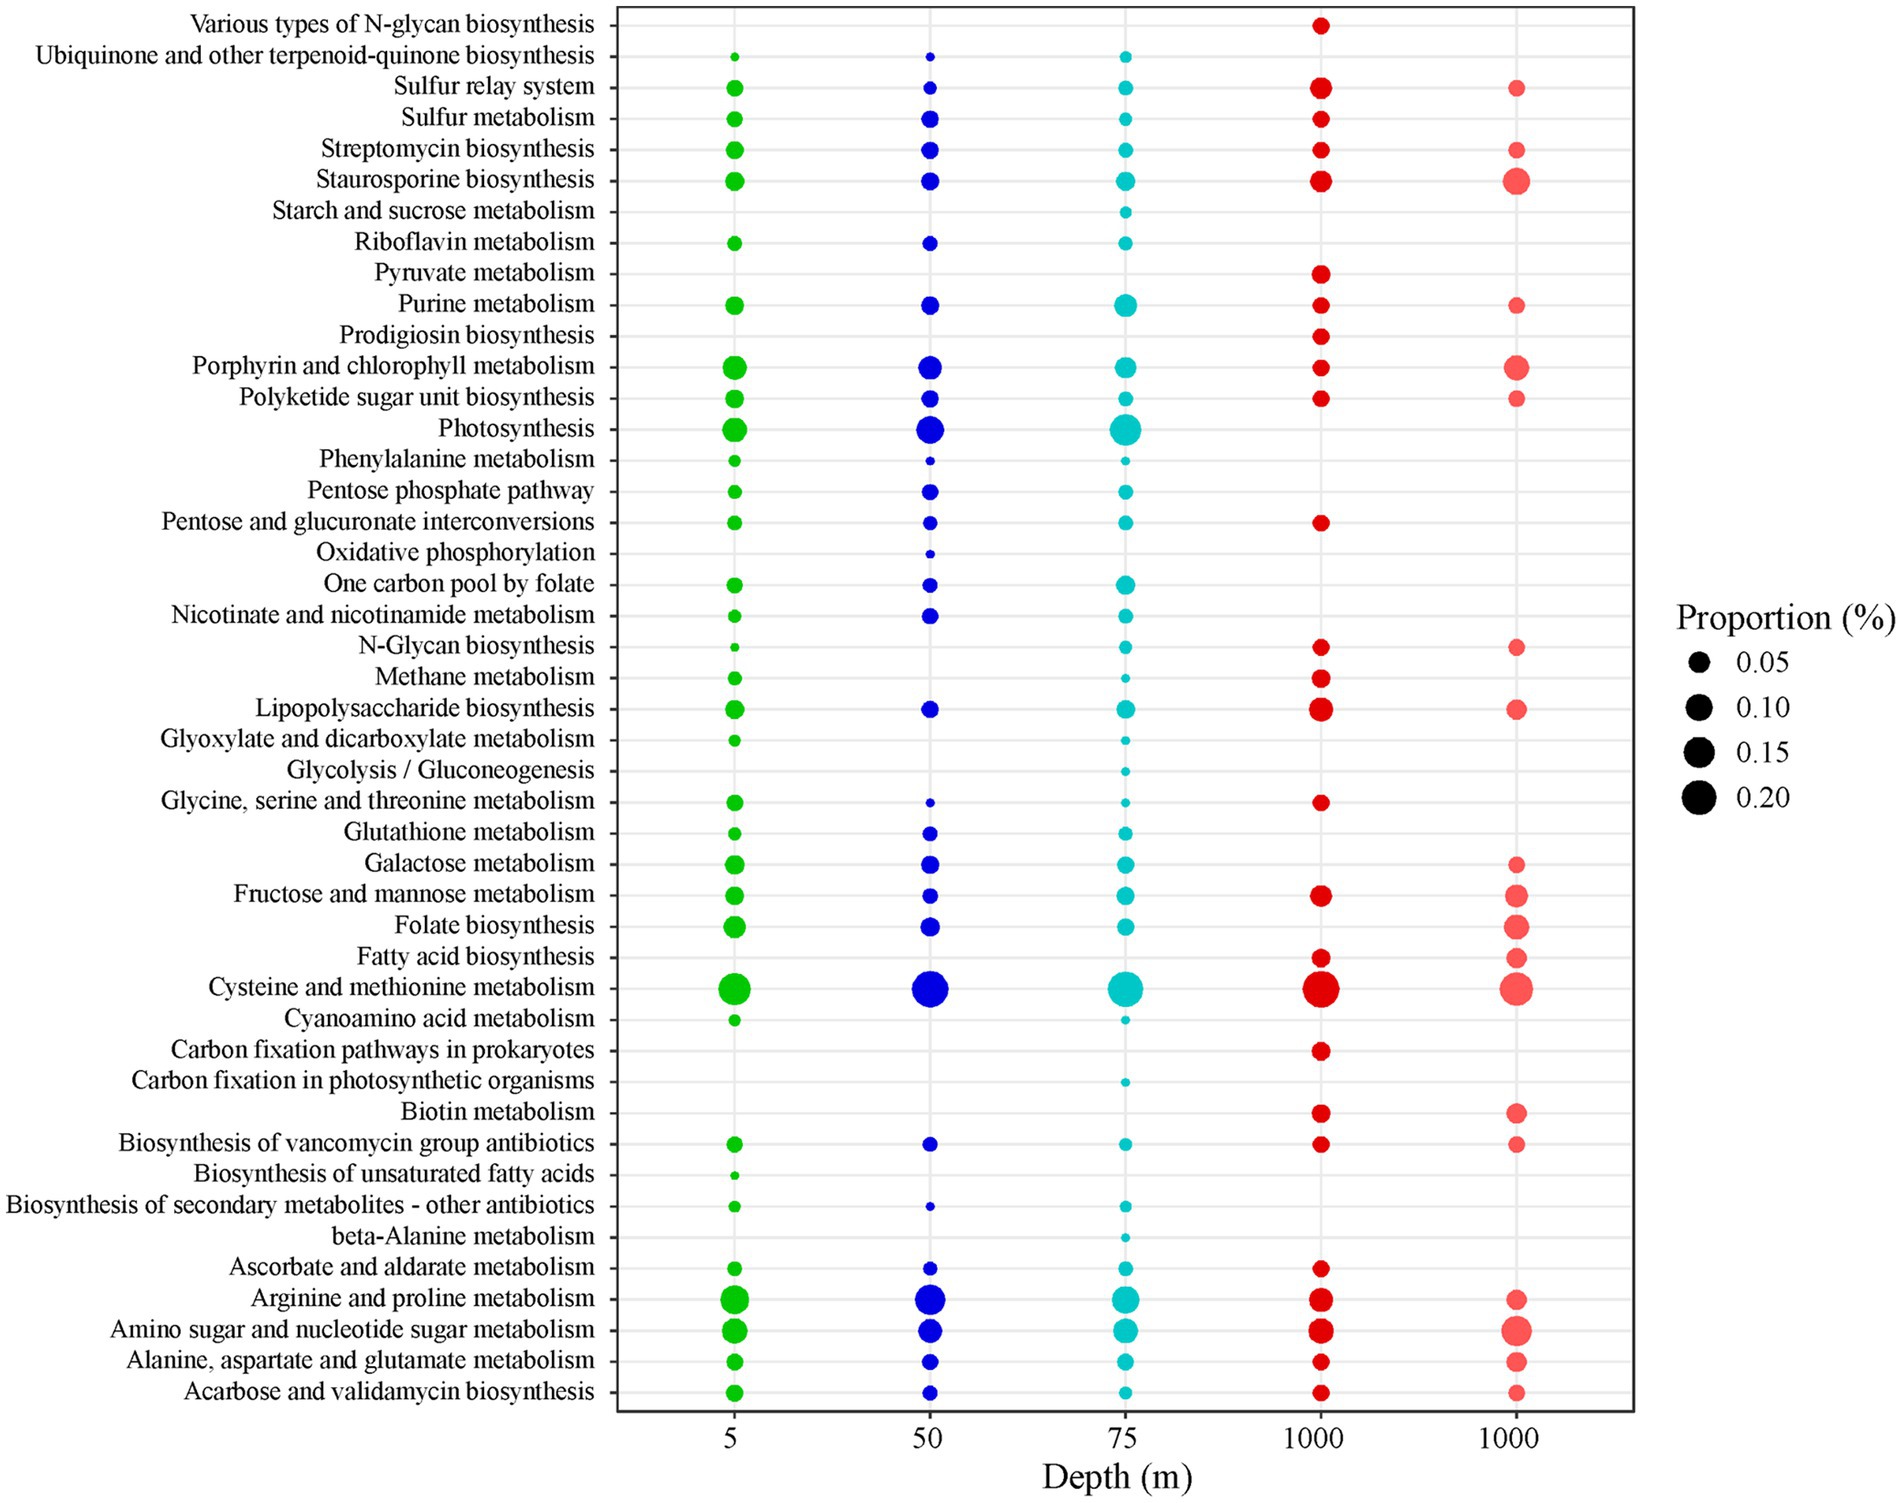
Figure 4. Bubble chart reporting the percentage contribution of the specific AMG metabolic pathways (as defined by KEGG using the VIBRANT method) over the total number of AMGs identified at the four sampling depths. For 5, 50, and 75 m: averaged values derive from the four sampling stations (LV3, LV10, LV13, and LV18). For 1,000 m, the values of the two deep stations are presented separately (dark red: LV10 and light red: LV18). The dimension of each bubble is proportional to the relative percentage contribution of the specific AMG categories.
The content of AMGs differed with the sampling depth when considering both general and specific metabolic pathways (PERMANOVAs, p < 0.01). AMG content differed between 1,000 m and surface/subsurface samples. In terms of percentage contribution, the most frequently-detected general metabolic pathway was “amino acid metabolism” (34% ± 6%), followed by “carbohydrate metabolism” (18% ± 3%), “metabolism of cofactors and vitamins” (14% ± 4%), “energy metabolism” (12% ± 5%), and then “lipid metabolism” and “glycan biosynthesis and metabolism” (Table 4). The remaining categories are presented in the Supplementary material (Supplementary text and Supplementary Table 3).
“Amino acid metabolism” AMGs were mostly related to “cysteine and methionine metabolism” and “arginine and proline metabolism” contributing 59% ± 8% and 32% ± 7% within the category, respectively (Supplementary Table 3). The “cysteine and methionine metabolism” AMGs contributed significantly less within the category at 5 m than the rest depths (one-way ANOVA, p < 0.05, post hoc Tukey test). The remaining percentage at 5 m was attributed to “glycine, serine and threonine metabolism” AMGs (Supplementary Table 3), involving glyA, GATM and serA. Within “cysteine and methionine metabolism,” the involved genes were DNMT1, DNMT3A, mtnN, mtn and pfs at all depths, while at 50 and 75 m the gene yrrT was also detected. The “arginine and proline metabolism” AMGs contributed significantly more within the category at 5, 50, and 75 m than 1,000 m (one-way ANOVA, p < 0.05, post hoc Tukey tests).
Nearly half of the detected AMGs involved in “carbohydrate metabolism” were associated to “amino sugar and nucleotide sugar metabolism” (46% ± 8% within the category, Supplementary Table 3). “Amino sugar and nucleotide sugar metabolism” AMGs exhibited lower diversity at 1000 m (ugd, gmd, ascC, ddhC, rfbH, algA, xanB, rfbA, wbpW, psIB, glmS, galE) compared to surface/subsurface samples (all genes in the previous parenthesis and additionally: TSTA3, fcl, per, rfbE, wecC, nagB, GNPDA, UDP-glucoronate 4-epimerase, GMPP, neuA, wbpP, glum, UDP-glucose 4,6-dehydratase, pgm and wbpA). Other consistently-high “carbohydrate metabolism” AMGs were those involved in “fructose and mannose metabolism” having significantly higher percentage contribution over all AMGs at 1000 m than the rest depths (one-way ANOVA, p < 0.05, post hoc Tukey test, Figure 4). Higher diversity was also seen in genes involved at “fructose and mannose” in the surface/subsurface depths compared to 1,000 m. Opposite, “galactose metabolism” AMGs had significantly lower percentage contribution within the category at 1,000 m compared to the other depths (one-way ANOVA, p < 0.05, post hoc Tukey test, Supplementary Table 3). AMGs associated to “pentose phosphate pathway” (PPP) were not detected at 1,000 m. At surface/subsurface samples, PPP AMGs involved rpiB, gnd, gntZ, PGD, zwf, pgm, talA and talB. Only at 1,000 m, 2 reads assigned to “pyruvate metabolism” (pps, ppsA, Figure 4).
Only at 1,000 m, AMGs related to “metabolism of cofactors and vitamins” included “biotin metabolism” (fabG, fabF, fabZ, Figure 4). At surface/subsurface depths, the detected AMGs were involved mainly in “porphyrin and chlorophyll metabolism” (bchE, cobS, cobT, and ahbD) and “riboflavin metabolism,” “folate biosynthesis” and “ubiquinone and other terpenoid-quinone biosynthesis” with highest contribution of “folate biosynthesis” (folA, glyA, purT, and purN) in all 5-m samples (Figure 4).
Significantly higher contribution of “energy metabolism” AMGs was seen at 50 and 75 m compared to 1,000 m (one-way ANOVA, p < 0.05, post hoc Tukey tests, Table 4). More than 90% of “energy metabolism” AMGs were associated to “photosynthesis” at all 75 m-samples (Supplementary Table 3; Figure 4). The AMGs involved were psbA and psbD. At 5 and 50 m-samples, AMGs related to “photosynthesis” did not exceed 73% and 77%, respectively. At 5 and 50 m, AMGs were mostly associated to “sulfur metabolism” (20% ± 3%, msmA, cysC, fccA, and dsrA) and “oxidative phosphorylation” (CYTB and petB) and “methane metabolism” (serA, PHGHD, glyA, SHMT, cofF, torD, fbaB; Figure 4). At 1,000 m, “energy metabolism” AMGs were associated to “carbon fixation pathways in prokaryotes” (pps and ppsA, Figure 4) but also to “methane metabolism” and “sulfur metabolism” with different specific genes involved compared to surface/subsurface layers. At 1,000 m, pps and ppsA and cysH were found within “methane metabolism” and “sulfur metabolism,” respectively.
The percentage of “lipid metabolism” AMGs significantly differed between surface/subsurface depths and 1,000 m (one-way ANOVA, p < 0.05) being higher at 1,000 m (post hoc Tukey test; Table 4). All AMGs in the category were related to “fatty acid biosynthesis” at 1,000 m (Supplementary Table 3; Figure 4) involving fabG, fabF, and fabZ. In the surface/subsurface depths, no “fatty acid biosynthesis” AMGs were found and the great majority were related to “biosynthesis of unsaturated fatty acids” (desC; Figure 4).
The percentage of “glycan biosynthesis and metabolism” AMGs significantly differed between surface/subsurface depths and 1,000 m (one-way ANOVA, p < 0.05) being higher at 1,000 m (post hoc Tukey test; Table 4). Most AMGs were related to “lipopolysaccharide biosynthesis” (Figure 4), with the most common AMGs at 1,000 m being waaF, rfaF and rfaE1 and lpxA, and at surface/subsurface depths being kdsB, kdsA, lpxH, gmhC, and gmhD.
We studied oceanic viral populations taking into consideration the lytic efficiency and the possible mechanisms that viruses employ to alter their hosts’ metabolism using their own metagenome footprint. Our results demonstrate clear depth-dependent patterns (surface/subsurface shallow vs. deep waters) in viral community composition and AMG content during the early stratification season in the Eastern Mediterranean Sea. The vertical environmental variability of this oligotrophic basin was considered in order to uncover, and propose viral actions that lead to energy acquisition and lysis sustenance. The depth-dependent patterns were linked to differences in temperature, nutrient availability (total and dissolved nitrogen and phosphorus), host productivity and host population density. While viral productivity levels did not change significantly along the water column, the numbers of free viruses per bacteria (VBR) were significantly higher at 1,000 m, resembling a similar peak in VBR in shallower mesopelagic depths in the same study area (Magiopoulos and Pitta, 2012). Interestingly, the diversity of viral taxa and AMGs was also substantially different at this depth. The presented findings suggest that a similar quantitative effect of viruses on their hosts (lytic activity) is achieved by different viral populations carrying different auxiliary metabolic genes.
Differences in viral communities with temperature were highlighted in the Mediterranean and globally (Coutinho et al., 2019; Gregory et al., 2019) and differences with depth were also reported for the hadal zone (Jian et al., 2021) and the Pacific Ocean using either high-throughput sequencing technology (Hurwitz et al., 2015) or genome fingerprinting approaches (Steward et al., 2000; Brum, 2005). Coutinho et al. (2019) have reported a peak in the Shannon diversity index in deep water of the western-Mediterranean. Lower contribution of the dominant families in deep rather than surface waters was seen in the hadal zone of Challenger Deep (Gao et al., 2022). Similarly, the highest species richness was recorded at 1,000 m, with the community encompassing less Podoviridae and Siphoviridae members but more unassigned reads, which is reasonable as a more complex community may sustain and optimize ecosystem functioning under low-oxygen and low-nutrients conditions.
Additionally, at 1,000 m we found that the AMG content was different than at the other depths. The main distinctive features of the deep layers in comparison to the shallower ones were (a) a higher contribution of genes involved in the sulfur relay system, the synthesis and metabolism of glycan and the metabolism of fructose, mannose, fatty acids, cofactors and vitamins and secondary metabolites, (b) a lower contribution of genes involved in energy metabolic pathways, and the metabolism of arginine, proline and galactose, (c) different AMG content within the categories of metabolism of amino sugar and sugar nucleotide, fructose and mannose, lipopolysaccharide, sulfur and methane, lipids and purine, and finally (d) the absence of genes related to pentose phosphate pathway, and the unique finding of genes related to pyruvate and biotin metabolism, and prodigiosin biosynthesis. At this point, we urge the readers to take into consideration the low number of replicated samples when deepening to our findings. Consideration of seasonal and inter-annual changes in irradiance, temperature and nutrient levels with depth would have also improved our exploration, since it is widely known that these changes largely impact viral activity (Brum et al., 2016; Coutinho et al., 2017; Gainer et al., 2017; Puxty et al., 2018).
In the energy-limited bathypelagic zone, it is expected that viruses, as their hosts (Konstantinidis et al., 2009), need to have higher metabolic flexibility and thus, exploit a variety of AMGs to support their reproduction in comparison to the more limited resources. Recent reports consider that viral genomes are under the selective pressure of the environment (Heyerhoff et al., 2022); in natural populations, the availability of nitrogen (Jian et al., 2021) and phosphorus (Kelly et al., 2013) and the variable temperature conditions (Coutinho et al., 2019) seem to drive differences in viral genomes from the community to the protein level. While the total amount of AMGs entailed in energy acquisition was lower at 1,000 m compared to surface/subsurface waters, the particular genes involved were rather more variable and seemed to ensure that diverse substrates and energy sources can be used in the EMS deep environment where light, organic matter and nutrients are limited and the growth of bacteria is carbon-limited (Rahav et al., 2019). In the bathypelagic realm of the oligotrophic EMS, nutrients are scattered in time and space, thus their high demand may have caused relevant viral genome adaptions that are discussed in chapters 4.2. and 4.3.
A higher contribution of AMGs related to energy production via gluconeogesis (pps, ppsA) was seen in the deepest samples, suggesting that the use of alternative carbon sources for the synthesis of glucose and polysaccharides is positively selected at 1,000 m. In deep waters, hexoses are preferentially removed from high-molecular weight DOC by bacteria (Garel et al., 2021). The number of hexose metabolism genes was higher in the deep, and this fact led us to think that viruses may provide a vital mechanism to build the precursors for ATP synthesis and aid viral proliferation, thus supporting the high microbial respiration needs in the bathypelagic zone (Acinas et al., 2021). AMGs involved in the pentose phosphate pathway (PPP) was proposed to divert host metabolism to nucleotide synthesis and energy production (Thompson et al., 2011). PPP is probably not boosted in the bathypelagic zone in our study area but this hypothesis needs confirmation using a larger set of samples and replicates. A range of PPP genes (rpi, gnd, zwf) was seen in the surface/subsurface samples (but not in the deep) where light and energy availability is not a limiting step for host and viral productivity, similar to recent observations for surface coastal waters of the Mediterranean (Tsiola et al., 2020).
A higher contribution of AMGs related to fatty-acid biosynthesis was seen at 1,000 m, suggesting that the elongation of fatty acids is promoted through viral AMGs. fabG encodes for the NADPH-dependent reduction of beta-ketoacyl-ACP substrates to beta-hydroxyacyl-ACP products, and has been found in viromes in the hadal zone (Jian et al., 2021). Alongside, the reaction of the enzyme of fabZ was a bottleneck in the fatty-acid production in numerous microbial hosts (Jeon et al., 2012). The presence of fabG and fabZ in the deep may be related to the need of fatty acids as electron donors in several bacteria. Sulfate-reducing bacteria for example are optimized to fully oxidize fatty acids; interestingly, their presence was indicated by the concomitant detection of CysH gene at 1,000 m.
The higher contribution of AMGs involved in the glycan biosynthesis in the deep supports the scenario of accelerated viral folding and structuring in these systems, something that totally agrees with the high VBR and VP lytic measurements in our study. The identification of genes involved in the amino sugar and nucleotide sugar metabolism along with genes involved in glycoprotein synthesis and metabolism (waaF, rfaE; now known as hldE, having key roles in the biosynthetic process of lipopolysaccharides, Graves et al., 2001; Weynberg et al., 2017) is a unique coupled finding for deep waters, that confirms the magnitude of hosts-gene hijacking in natural populations. In addition, the different repertoire of AMGs at the four depths involved in glycan metabolism, thus in correct host recognition, attachment and entry to the bacterial host cell (Kortright et al., 2020). indicates that attachment and penetration to hosts may happen by exploiting different strategies in deep vs. shallow waters, ultimately leading to equally high lytic activity at all depth layers.
The higher contribution of the mec gene at 1,000 m seems to assist nutrient acquisition in this deep ecosystem, since the gene encodes for a sulfur carrier protein that aids the biosynthesis of cysteine (Hesketh-Best et al., 2022) and possibly the degradation of sulfated organic matter (Han et al., 2023), thus viral particle formation too. Despite the low understanding of the role of mec in the viral genomes, it seems that recent investigations on viral implications on the oceanic sulfur cycling are reinforced and extended by our findings (Kieft et al., 2021); viral genes related to sulfur relay were found at 1,000 m, thus possibly contributing to sulfur’s budget manipulation.
We propose that the various above-mentioned mechanisms may have been adapted by the viral populations in order to more efficiently use the scattered energy sources in the oligotrophic deep part of the EMS water column. In such case, the selective advantage of viruses can reasonably justify the high VBR and lytic production in all depth layers, despite the low nutritional status of the bathypelagic zone.
Arginine and proline metabolism AMGs contributed less in the deepest samples, confirming that viruses “select” for certain amino acids for tolerance to cold temperatures (Alarcón-Schumacher et al., 2021) and optimal capsid formation (Weynberg et al., 2017).
The most noticeable difference in the AMG content between between 5, 50, and 75 m was that of the DCM; at 75 m, photosynthesis-related psbA and psbD outnumbered the energy-metabolism AMGs (>90%), while at 5 and 50 m these genes were significantly less. Indeed, comparing with in situ primary production measurements (Livanou et al., 2019; Psarra unpubl. data), primary production maxima at subsurface layers were consistently recorded just above the DCM layer. It was found that the psb genes are expressed during the viral latent period, thus their overrepresentation in the DCM seems supportive of extensive photosynthesis at this layer (Sharon et al., 2007; Sieradzki et al., 2019). At 75 m, no energy-production related to sulfur seemed to occur through viral AMGs, and photosynthesis governed. On the contrary, at 5 and 50 m, a repertoire of viral AMGs related to sulfur exploitation either for ATP production or for sulfur assimilation and biosynthetic processes was found; dissimilatory (e.g., dsrA) and assimilatory (e.g., cysC) sulfur metabolism genes support the auxiliary metabolism of sulfur in the host cells (Kieft et al., 2021). The dsrA, encoding for dissimilatory sulfur reductase within the pathway of sulfur oxidation was noted in the latter study, while Roux et al. (2016) and references therein have mentioned only the dissimilatory sulfur reductase subunit C (dsrC) in various pelagic and benthic samples. The authors proposed that viruses assist their sulfur oxidizer hosts through the dsrC-like genes under nutrient limiting conditions (Roux et al., 2016) that could be valid in the oligotrophic conditions of the studied area. Our findings are in agreement with previous observations that viral diversity does not differ substantially between surface and deep-chlorophyll maximum (DCM) layers except when considering protein clusters (Brum et al., 2015). An additional indication that excessive energy at DCM was diverted toward viral replication is the peak of purine metabolism genes (Puxty et al., 2015) at 75 m.
A comprehensive description of viral dynamics in surface (5 m), subsurface (50 and 75 m) and deep (1,000 m) off-shore waters of the EMS was achieved by combining whole viral metagenome sequencing, flow cytometric and productivity analyses, assuming that such a combination is the foundation of meaningful viral ecology discussions. The findings confirm our hypothesis that a more diverse repertoire of AMGs is present in bathypelagic than shallow EMS waters, diverting hosts’ metabolism toward energy production and thus, viral replication too. Further work is needed to generalize our implications to other ecosystems and seasons with regards to the diel, seasonal and annual variations in irradiance, temperature and other physicochemical characteristics of the water masses, since the sampling power in this study was limited by field-work constraints and analytical costs. AMG content was substantially different between 1,000 m and the shallower layers, revealing novel implications for the energy-production mechanisms in the resource-depleted deep waters of the EMS. The lysis rate was, however, similar along the vertical profile. Altogether, our findings advocate that viral interference with hosts’ metabolism is affected by the particular environmental setting, and must be carefully considered for deciphering the biogeochemical turnover in the oceans.
The metagenomic datasets presented in this study can be found in online repositories. The names of the repository/repositories and accession number(s) can be found in the article Section 2.5.
AT: Conceptualization, Data curation, Formal analysis, Writing – original draft, Writing – review & editing. GM: Data curation, Software, Writing – review & editing, Methodology. DD: Funding acquisition, Supervision, Writing – review & editing. SF: Methodology, Writing – review & editing. AG: Methodology, Writing – review & editing. DM: Methodology, Writing – review & editing. AP: Methodology, Writing – review & editing. EP: Methodology, Writing – review & editing. SP: Conceptualization, Data curation, Methodology, Project administration, Writing – review & editing. IS: Data curation, Methodology, Writing – review & editing. CZ: Methodology, Writing – review & editing. PP: Funding acquisition, Supervision, Writing – review & editing.
The author(s) declare financial support was received for the research, authorship, and/or publication of this article. The LEVECO sampling cruise was implemented in the frame of the “Study of the marine and submarine environment and ecosystem of the East Mediterranean, south of Crete Island,” sub-project to the “Sustainable exploitation of marine and inland water ecosystems and resources of the E. Mediterranean within the frame of Blue Growth” project financed by the General Secretariat for Research and Technology—GSRT through the “Programmatic Agreements between Research Centers—GSRT2015-2017/22.4.2015.” Metagenome sequencing and bioinformatics analysis was supported by the KAUST baseline funding to DD.
The authors are grateful to the Captain and the crew of R/V Aegaeo for their help at sea, and to Marina Koukaki for kindly hosting AT and DM at the Institute of Molecular and Biology and Biotechnology of the Foundation for Research and Technology Hellas for the purposes of viral DNA extraction.
The authors declare that the research was conducted in the absence of any commercial or financial relationships that could be construed as a potential conflict of interest.
All claims expressed in this article are solely those of the authors and do not necessarily represent those of their affiliated organizations, or those of the publisher, the editors and the reviewers. Any product that may be evaluated in this article, or claim that may be made by its manufacturer, is not guaranteed or endorsed by the publisher.
The Supplementary material for this article can be found online at: https://www.frontiersin.org/articles/10.3389/fmicb.2023.1271535/full#supplementary-material
Acinas, S. G., Sánchez, P., Salazar, G., Cornejo-Castillo, F. M., Sebastián, M., Logares, R., et al. (2021). Deep ocean metagenomes provide insight into the metabolic architecture of bathypelagic microbial communities. Commun. Biol. 4:604. doi: 10.1038/s42003-021-02112-2
Alarcón-Schumacher, T., Guajardo-Leiva, S., Martinez-Garcia, M., and Díez, B. (2021). Ecogenomics and adaptation strategies of Southern Ocean viral communities. mSystems :6:e0039621. doi: 10.1128/msystems.00396-21
Anderson, M. J., Gorley, R. N., and Clarke, K. R. (2008). PERMANOVA + for PRIMER: Guide to software and statistical methods. Primer-E Ltd: Plymouth, UK.
Azov, Y. (1991). Eastern Mediterranean—a Marine Desert? Mar. Pollut. Bull. 23, 225–232. doi: 10.1016/0025-326X(91)90679-M
Bachy, C., Charlesworth, C. J., Chan, A. M., Finke, J. F., Wong, C. H., Wei, C. L., et al. (2018). Transcriptional responses of the marine green alga Micromonas pusilla and an infecting prasinovirus under different phosphate conditions. Environ. Microbiol. 20, 2898–2912. doi: 10.1111/1462-2920.14273
Bolduc, B., Youens-Clark, K., Roux, S., Hurwitz, B. L., and Sullivan, M. B. (2017). iVirus: facilitating new insights in viral ecology with software and community data sets imbedded in a cyberinfrastructure. ISME J. 11, 7–14. doi: 10.1038/ismej.2016.89
Brum, J. R. (2005). Concentration, production and turnover of viruses and dissolved DNA pools at Stn ALOHA, North Pacific subtropical gyre. Aquat. Microb. Ecol. 41, 103–113. doi: 10.3354/ame041103
Brum, J. R., Hurwitz, B. L., Schofield, O., Ducklow, H. W., and Sullivan, M. B. (2016). Seasonal time bombs: dominant temperate viruses affect Southern Ocean microbial dynamics. ISME J. 10, 437–449. doi: 10.1038/ismej.2015.125
Brum, J. R., Ignacio-Espinoza, J. C., Roux, S., Doulcier, G., Acinas, S. G., Alberti, A., et al. (2015). Patterns and ecological drivers of ocean viral communities. Science 348:1261498. doi: 10.1126/science.1261498
Brussaard, C. P. D. (2004). Optimization of procedures for counting viruses by flow cytometry. Appl. Environ. Microbiol. 70, 1506–1513. doi: 10.1128/AEM.70.3.1506-1513.2004
Brussaard, C. P. D., Wilhelm, S. W., Thingstad, F., Weinbauer, M. G., Bratbak, G., Heldal, M., et al. (2008). Global-scale processes with a nanoscale drive: the role of marine viruses. ISME J. 2, 575–578. doi: 10.1038/ismej.2008.31
Clarke, K. R., and Ainsworth, M. (1993). A method of linking multivaritate community structure to environmental variable. Mar. Ecol. Prog. Ser. 92, 205–219. doi: 10.3354/meps092205
Clarke, K. R., and Warwick, R. M. (1994). Change in marine communities: An approach to statistical analysis and interpretation, Primer-E Ltd, Plymouth, UK.
Coutinho, F. H., Rosselli, R., and Rodríguez-Valera, F. (2019). Trends of microdiversity reveal depth-dependent evolutionary strategies of viruses in the Mediterranean. mSystems 4, 1–17. doi: 10.1128/msystems.00554-19
Coutinho, F. H., Silveira, C. B., Gregoracci, G. B., Thompson, C. C., Edwards, R. A., Brussaard, C. P. D., et al. (2017). Marine viruses discovered via metagenomics shed light on viral strategies throughout the oceans. Nat. Commun. 8, 1–12. doi: 10.1038/ncomms15955
Coutinho, F. H., Silveira, C. B., Sebastián, M., Sánchez, P., Duarte, C. M., Vaqué, D., et al. (2023). Water mass age structures the auxiliary metabolic gene content of free-living and particle-attached deep ocean viral communities. Microbiome 11:118. doi: 10.1186/s40168-023-01547-5
Crummett, L. T., Puxty, R. J., Weihe, C., Marston, M. F., and Martiny, J. B. H. (2016). The genomic content and context of auxiliary metabolic genes in marine cyanomyoviruses. Virology 499, 219–229. doi: 10.1016/j.virol.2016.09.016
Gainer, P. J., Pound, H. L., Larkin, A. A., LeCleir, G. R., DeBruyn, J. M., Zinser, E. R., et al. (2017). Contrasting seasonal drivers of virus abundance and production in the North Pacific Ocean. PloS One 12, e0184371–e0184318. doi: 10.1371/journal.pone.0184371
Gao, C., Liang, Y., Jiang, Y., Paez-Espino, D., Han, M., Gu, C., et al. (2022). Virioplankton assemblages from challenger deep, the deepest place in the oceans. iScience 25:104680. doi: 10.1016/j.isci.2022.104680
Garel, M., Panagiotopoulos, C., Boutrif, M., Repeta, D., Sempéré, R., Santinelli, C., et al. (2021). Contrasting degradation rates of natural dissolved organic carbon by deep-sea prokaryotes under stratified water masses and deep-water convection conditions in the NW Mediterranean Sea. Mar. Chem. 231:103932. doi: 10.1016/j.marchem.2021.103932
Goff, S. A., Vaughn, M., McKay, S., Lyons, E., Stapleton, A. E., Gessler, D., et al. (2011). The iPlant collaborative: cyberinfrastructure for plant biology. Front. Plant Sci. 2, 1–16. doi: 10.3389/fpls.2011.00034
Graves, M. V., Bernadt, C. T., Cerny, R., and Van Etten, J. L. (2001). Molecular and genetic evidence for a virus-encoded glycosyltransferase involved in protein glycosylation. Virology 285, 332–345. doi: 10.1006/viro.2001.0937
Gregory, A. C., Gerhardt, K., Zhong, Z. P., Bolduc, B., Temperton, B., Konstantinidis, K. T., et al. (2022). MetaPop: a pipeline for macro- and microdiversity analyses and visualization of microbial and viral metagenome-derived populations. Microbiome 10, 49–19. doi: 10.1186/s40168-022-01231-0
Gregory, A. C., Zayed, A. A., Sunagawa, S., Wincker, P., Sullivan, M. B., Ferland, J., et al. (2019). Marine DNA viral macro- and microdiversity from pole to pole article marine DNA viral macro- and microdiversity from pole to pole. Cells 177, 1109–1123.e14. doi: 10.1016/j.cell.2019.03.040
Guo, J., Bolduc, B., Zayed, A. A., Varsani, A., Dominguez-huerta, G., Delmont, T. O., et al. (2021). VirSorter2: a multi-classifier, expert-guided approach to detect diverse DNA and RNA viruses. Microbiome 9, 1–13. doi: 10.1186/s40168-020-00990-y
Han, M., Sun, J., Yang, Q., Liang, Y., Jiang, Y., Gao, C., et al. (2023). Spatiotemporal dynamics of coastal viral community structure and potential biogeochemical roles affected by an Ulva prolifera green tide. mSystems 8:22. doi: 10.1128/msystems.01211-22
Hesketh-Best, P. P., Bosco-Santos, A., Garcia, S., Werne, J., Gilhooly, W., and Silveira, C. (2022). Genomics of viruses infecting green and purple sulfur bacteria in two euxinic lakes. BioRXiv [Preprint].
Heyerhoff, B., Engelen, B., and Bunse, C. (2022). Auxiliary metabolic gene functions in pelagic and benthic viruses of the Baltic Sea. Front. Microbiol. 13, 1–16. doi: 10.3389/fmicb.2022.863620
Howard-Varona, C., Hargreaves, K. R., Solonenko, N. E., Markillie, L. M., White, R. A., Brewer, H. M., et al. (2018). Multiple mechanisms drive phage infection efficiency in nearly identical hosts. ISME J. 12, 1605–1618. doi: 10.1038/s41396-018-0099-8
Howard-Varona, C., Lindback, M. M., Bastien, G. E., Solonenko, N., Zayed, A. A., Jang, H., et al. (2020). Phage-specific metabolic reprogramming of virocells. ISME J. 14, 881–895. doi: 10.1038/s41396-019-0580-z
Hurwitz, B. L., Brum, J. R., and Sullivan, M. B. (2015). Depth-stratified functional and taxonomic niche specialization in the “core” and “flexible” Pacific Ocean Virome. ISME J. 9, 472–484. doi: 10.1038/ismej.2014.143
Hurwitz, B. L., Hallam, S. J., and Sullivan, M. B. (2013). Metabolic reprogramming by viruses in the sunlit and dark ocean. Genome Biol. 14:R123. doi: 10.1186/gb-2013-14-11-r123
Jeon, E., Lee, S., Lee, S., Han, S. O., Yoon, Y. J., and Lee, J. (2012). Improved production of long-chain fatty acid in Escherichia coli by an engineering elongation cycle during fatty acid synthesis (FAS) through genetic manipulation. J. Microbiol. Biotechnol. 22, 990–999. doi: 10.4014/jmb.1112.12057
Jian, H., Yi, Y., Wang, J., Hao, Y., Zhang, M., Wang, S., et al. (2021). Diversity and distribution of viruses inhabiting the deepest ocean on earth. ISME J. 15, 3094–3110. doi: 10.1038/s41396-021-00994-y
John, S. G., Mendez, C. B., Deng, L., Poulos, B., Kauffman, A. K. M., Kern, S., et al. (2011). A simple and efficient method for concentration of ocean viruses by chemical flocculation. Environ. Microbiol. Rep. 3, 195–202. doi: 10.1111/j.1758-2229.2010.00208.x
Kelly, L., Ding, H., Huang, K. H., Osburne, M. S., and Chisholm, S. W. (2013). Genetic diversity in cultured and wild marine cyanomyoviruses reveals phosphorus stress as a strong selective agent. ISME J. 7, 1827–1841. doi: 10.1038/ismej.2013.58
Kieft, K., Zhou, Z., and Anantharaman, K. (2019). VIBRANT: automated recovery, annotation and curation of microbial viruses, and evaluation of virome function from genomic sequences. BioRXiv [Preprint], 1–39.
Kieft, K., Zhou, Z., Anderson, R. E., Buchan, A., Campbell, B. J., Hallam, S. J., et al. (2021). Ecology of inorganic sulfur auxiliary metabolism in widespread bacteriophages. Nat. Commun. 12, 3503–3516. doi: 10.1038/s41467-021-23698-5
Konstantinidis, K. T., Braff, J., Karl, D. M., and DeLong, E. F. (2009). Comparative metagenomic analysis of a microbial community residing at a depth of 4,000 meters at station ALOHA in the North Pacific subtropical gyre. Appl. Environ. Microbiol. 75, 5345–5355. doi: 10.1128/AEM.00473-09
Kortright, K. E., Chan, B. K., and Turner, P. E. (2020). High-throughput discovery of phage receptors using transposon insertion sequencing of bacteria. Proc. Natl. Acad. Sci. U. S. A. 117, 18670–18679. doi: 10.1073/pnas.2001888117
Krom, M. D., Herut, B., and Mantoura, R. F. C. (2004). Nutrient budget for the eastern Mediterranean: implications for phosphorus limitation. Limnol. Oceanogr. 49, 1582–1592. doi: 10.4319/lo.2004.49.5.1582
Lara, E., Vaqué, D., Sà, E. L., Boras, J. A., Gomes, A., Borrull, E., et al. (2017). Unveiling the role and life strategies of viruses from the surface to the dark ocean. Sci. Adv. 3:e1602565. doi: 10.1126/sciadv.1602565
Lin, X., Ding, H., and Zeng, Q. (2016). Transcriptomic response during phage infection of a marine cyanobacterium under phosphorus-limited conditions. Environ. Microbiol. 18, 450–460. doi: 10.1111/1462-2920.13104
Livanou, E., Lagaria, A., Santi, I., Mandalakis, M., Pavlidou, A., Lika, K., et al. (2019). Pigmented and heterotrophic nanoflagellates: abundance and grazing on prokaryotic picoplankton in the ultra-oligotrophic eastern Mediterranean Sea. Deep Res. Part II Top. Stud. Oceanogr. 164, 100–111. doi: 10.1016/j.dsr2.2019.04.007
Luo, E., Eppley, J. M., Romano, A. E., Mende, D. R., and DeLong, E. F. (2020). Double-stranded DNA virioplankton dynamics and reproductive strategies in the oligotrophic open ocean water column. ISME J. 14, 1304–1315. doi: 10.1038/s41396-020-0604-8
Magiopoulos, I., and Pitta, P. (2012). Viruses in a deep oligotrophic sea: seasonal distribution of marine viruses in the epi-, meso- and bathypelagic waters of the eastern Mediterranean Sea. Deep Sea res. Part I Oceanogr. Res. Pap. 66, 1–10. doi: 10.1016/j.dsr.2012.03.009
Marie, D., Brussaard, C. P. D., Thyrhaug, R., Bratbak, G., and Vaulot, D. (1999). Enumeration of marine viruses in culture and natural samples by flow cytometry. Appl. Environ. Microbiol. 65, 45–52. doi: 10.1128/AEM.65.1.45-52.1999
Marie, D., Partensky, F., Jacquet, S., and Vaulot, D. (1997). Enumeration and cell cycle analysis of natural populations of marine picoplankton by flow cytometry using the nucleic acid stain SYBR green I. Appl. Environ. Microbiol. 63, 186–193. doi: 10.1128/aem.63.1.186-193.1997
Mizuno, C. M., Rodriguez-Valera, F., Kimes, N. E., and Ghai, R. (2013). Expanding the marine Virosphere using metagenomics. PLoS Genet. 9:e1003987. doi: 10.1371/journal.pgen.1003987
Mojica, K. D. A., and Brussaard, C. P. D. (2014). Factors affecting virus dynamics and microbial host-virus interactions in marine environments. FEMS Microbiol. Ecol. 89, 495–515. doi: 10.1111/1574-6941.12343
Nayfach, S., Camargo, A. P., Schulz, F., Eloe-Fadrosh, E., Roux, S., and Kyrpides, N. C. (2021). CheckV assesses the quality and completeness of metagenome-assembled viral genomes. Nat. Biotechnol. 39, 578–585. doi: 10.1038/s41587-020-00774-7
Paez-Espino, D., Eloe-Fadrosh, E. A., Pavlopoulos, G. A., Thomas, A. D., Huntemann, M., Mikhailova, N., et al. (2016). Uncovering Earth’s virome. Nature 536, 425–430. doi: 10.1038/nature19094
Pons, J. C., Paez-Espino, D., Riera, G., Ivanova, N., Kyrpides, N. C., and Llabrés, M. (2021). VPF-class: taxonomic assignment and host prediction of uncultivated viruses based on viral protein families. Bioinformatics 37, 1805–1813. doi: 10.1093/bioinformatics/btab026
Puxty, R. J., Evans, D. J., Millard, A. D., and Scanlan, D. J. (2018). Energy limitation of cyanophage development: implications for marine carbon cycling. ISME J. 12, 1273–1286. doi: 10.1038/s41396-017-0043-3
Puxty, R. J., Millard, A. D., Evans, D. J., and Scanlan, D. J. (2015). Shedding new light on viral photosynthesis. Photosynth. Res. 126, 71–97. doi: 10.1007/s11120-014-0057-x
Rahav, E., Silverman, J., Raveh, O., Hazan, O., Rubin-Blum, M., Zeri, C., et al. (2019). The deep water of eastern Mediterranean Sea is a hotspot for bacterial activity. Deep Res. Part II Top. Stud. Oceanogr. 164, 135–143. doi: 10.1016/j.dsr2.2019.03.004
Ren, J., Ahlgren, N. A., Lu, Y. Y., Fuhrman, J. A., and Sun, F. (2017). VirFinder: a novel k -mer based tool for identifying viral sequences from assembled metagenomic data. Microbiome 5:69. doi: 10.1186/s40168-017-0283-5
Roux, S., Brum, J. R., Dutilh, B. E., Sunagawa, S., Duhaime, M. B., Loy, A., et al. (2016). Ecogenomics and potential biogeochemical impacts of globally abundant ocean viruses. Nature 537, 689–693. doi: 10.1038/nature19366
Roux, S., Camargo, A. P., Coutinho, F. H., Dabdoub, S. M., Dutilh, B. E., Nayfach, S., et al. (2023). iPHoP: an integrated machine learning framework to maximize host prediction for metagenome-derived viruses of archaea and bacteria. PLoS Biol. 21:e3002083. doi: 10.1371/journal.pbio.3002083
Roux, S., Páez-Espino, D., Chen, I. M. A., Palaniappan, K., Ratner, A., Chu, K., et al. (2021). IMG/VR v3: an integrated ecological and evolutionary framework for interrogating genomes of uncultivated viruses. Nucleic Acids Res. 49, D764–D775. doi: 10.1093/nar/gkaa946
Santi, I., Kasapidis, P., Psarra, S., Assimakopoulou, G., Pavlidou, A., Protopapa, M., et al. (2020). Composition and distribution patterns of eukaryotic microbial plankton in the ultra-oligotrophic Eestern Mediterranean Sea. Aquat. Microb. Ecol. 84, 155–173. doi: 10.3354/ame01933
Sharon, I., Tzahor, S., Williamson, S., Shmoish, M., Man-Aharonovich, D., Rusch, D. B., et al. (2007). Viral photosynthetic reaction center genes and transcripts in the marine environment. ISME J. 1, 492–501. doi: 10.1038/ismej.2007.67
Sieradzki, E. T., Ignacio-Espinoza, J. C., Needham, D. M., Fichot, E. B., and Fuhrman, J. A. (2019). Dynamic marine viral infections and major contribution to photosynthetic processes shown by spatiotemporal picoplankton metatranscriptomes. Nat. Commun. 10:1169. doi: 10.1038/s41467-019-09106-z
Somerfield, P. J. (2008). Identification of the Bray-Curtis similarity index: comment on Yoshioka (2008). Mar. Ecol. Prog. Ser. 372, 303–306. doi: 10.3354/meps07841
Steward, G. F., Montiel, J. L., and Azam, F. (2000). Genome size distributions indicate variability and similarities among marine viral assemblages from diverse environments. Limnol. Oceanogr. 45, 1697–1706. doi: 10.4319/lo.2000.45.8.1697
Suttle, C. (2007). Marine viruses—major players in the global ecosystem. Nat. Rev. Microbiol. 5, 801–812. doi: 10.1038/nrmicro1750
Techtmann, S. M., Fortney, J. L., Ayers, K. A., Joyner, D. C., Linley, T. D., Pfiffner, S. M., et al. (2015). The unique chemistry of eastern Mediterranean water masses selects for distinct microbial communities by depth. PloS One 10, 1–22. doi: 10.1371/journal.pone.0120605
Thompson, L. R., Zeng, Q., Kelly, L., Huang, K. H., Singer, A. U., Stubbe, J., et al. (2011). Phage auxiliary metabolic genes and the redirection of cyanobacterial host carbon metabolism. Proc. Natl. Acad. Sci. 108, E757–E764. doi: 10.1073/pnas.1102164108
Tsiola, A., Michoud, G., Fodelianakis, S., Karakassis, I., Kotoulas, G., Pavlidou, A., et al. (2020). Viral metagenomic content reflects seawater ecological quality in the coastal zone. Viruses 12:806. doi: 10.3390/v12080806
Velaoras, D., Papadopoulos, V. P., Kontoyiannis, H., Cardin, V., and Civitarese, G. (2019). Water masses and hydrography during April and June 2016 in the Cretan Sea and Cretan passage (eastern Mediterranean Sea). Deep Res. Part II Top. Stud. Oceanogr. 164, 25–40. doi: 10.1016/j.dsr2.2018.09.005
Weynberg, K. D., Allen, M. J., and Wilson, W. H. (2017). Marine prasinoviruses and their tiny plankton hosts: a review. Viruses 9, 1–20. doi: 10.3390/v9030043
Wilhelm, S. W., Brigden, S. M., and Suttle, C. A. (2002). A dilution technique for the direct measurement of viral production: a comparison in stratified and tidally mixed coastal waters. Microb. Ecol. 43, 168–173. doi: 10.1007/s00248-001-1021-9
Williamson, S. J., Rusch, D. B., Yooseph, S., Halpern, A. L., Heidelberg, K. B., Glass, J. I., et al. (2008). The Corcerer II global ocean sampling expedition: metagenomic characterization of viruses within aquatic microbial samples. PloS One 3:e1456. doi: 10.1371/journal.pone.0001456
Winget, D. M., Williamson, K. E., Helton, R. R., and Wommack, K. E. (2005). Tangential flow diafiltration: an improved technique for estimation of virioplankton production. Aquat. Microb. Ecol. 41, 221–232. doi: 10.3354/ame041221
Winnepenninckx, B. T., Backeljau, T., and Wachter, R. (1993). Extraction of high molecular weight DNA from molluscs. Trends Genet. 9:407. doi: 10.1016/0168-9525(93)90102-N
Winter, C., Herndl, G. J., and Weinbauer, M. G. (2004). Diel cycles in viral infection of bacterioplankton in the North Sea. Aquat. Microb. Ecol. 35, 207–216. doi: 10.3354/ame035207
Winter, C., Payet, J. P., and Suttle, C. (2012). Modeling the winter-to-summer transition of prokaryotic and viral abundance in the Arctic Ocean. PloS One 7:e52794. doi: 10.1371/journal.pone.0052794
Wu, S., Zhou, L., Zhou, Y., Wang, H., Xiao, J., Yan, S., et al. (2020). Diverse and unique viruses discovered in the surface water of the East China Sea. BMC Genomics 21, 441–415. doi: 10.1186/s12864-020-06861-y
Zeng, Q., and Chisholm, S. W. (2012). Marine viruses exploit their host’ s two-component regulatory system in response to resource limitation. Curr. Biol. 22, 124–128. doi: 10.1016/j.cub.2011.11.055
Keywords: metagenomics, oligotrophy, viral auxiliary metabolic genes, lytic production, Eastern Mediterranean Sea
Citation: Tsiola A, Michoud G, Daffonchio D, Fodelianakis S, Giannakourou A, Malliarakis D, Pavlidou A, Pitta E, Psarra S, Santi I, Zeri C and Pitta P (2023) Depth-driven patterns in lytic viral diversity, auxiliary metabolic gene content, and productivity in offshore oligotrophic waters. Front. Microbiol. 14:1271535. doi: 10.3389/fmicb.2023.1271535
Edited by:
Camila Fernandez, UMR7621 Laboratoire d'Océanographie Microbienne (LOMIC), FranceReviewed by:
Olivier Zablocki, The Ohio State University, United StatesCopyright © 2023 Tsiola, Michoud, Daffonchio, Fodelianakis, Giannakourou, Malliarakis, Pavlidou, Pitta, Psarra, Santi, Zeri and Pitta. This is an open-access article distributed under the terms of the Creative Commons Attribution License (CC BY). The use, distribution or reproduction in other forums is permitted, provided the original author(s) and the copyright owner(s) are credited and that the original publication in this journal is cited, in accordance with accepted academic practice. No use, distribution or reproduction is permitted which does not comply with these terms.
*Correspondence: Anastasia Tsiola, YXRzaW9sYUBoY21yLmdy
†Present Addresses: Grégoire Michoud, River Ecosystems Laboratory, Alpine and Polar Environmental Research Center, Ecole Polytechnique Fédérale de Lausanne (EPFL), Lausanne, Switzerland; Ioulia Santi, Hellenic Centre for Marine Research (HCMR), Institute of Marine Biology, Biotechnology and Aquaculture (IMBBC), Heraklion, Greece; European Marine Biological Resource Centre (EMBRC-ERIC), Paris, France
Disclaimer: All claims expressed in this article are solely those of the authors and do not necessarily represent those of their affiliated organizations, or those of the publisher, the editors and the reviewers. Any product that may be evaluated in this article or claim that may be made by its manufacturer is not guaranteed or endorsed by the publisher.
Research integrity at Frontiers
Learn more about the work of our research integrity team to safeguard the quality of each article we publish.