 Yan Gao
 Olivier Bernard
 Andrea Fanesi
 Patrick Perré
 Filipa Lopes
94% of researchers rate our articles as excellent or good
Learn more about the work of our research integrity team to safeguard the quality of each article we publish.
Find out more
ORIGINAL RESEARCH article
Front. Microbiol. , 24 October 2023
Sec. Aquatic Microbiology
Volume 14 - 2023 | https://doi.org/10.3389/fmicb.2023.1250866
Introduction: Biofilm-based microalgae production technologies offer enormous potential for improving sustainability and productivity. However, the light pattern induced by these technologies is a key concern for optimization.
Methods: In this work, the effects of light/dark cycles on architecture, growth, and physiology of Chlorella vulgaris biofilms were assessed in a millifluidic flow-cell with different time cycles (15 s to 3 min) keeping the average light constant at 100 μmol·m−2·s−1.
Results and discussion: Results showed that photoinhibition can be mitigated by applying a light fraction of 1/3 and a cycle time of 15 s. By contrast, when the cycle time is extended to 90 s and 3 min, photoinhibition is high and photoefficiency dramatically decreases. To cope with light stress, cells acclimate and organize themselves differently in space. A high peak light (500 μmol·m−2·s−1) triggers a stress, reducing cell division and inducing clusters in the biofilm. This work provides guidelines for optimizing rotating microalgae production systems in biofilms and assesses the minimum rotating frequency required to maintain the net growth rate close to that of continuous light of the same average intensity, mitigating photo-inhibition. The overall gain in productivity is then provided by the total surface of the biofilm turning in the illuminated surface area.
Microalgae are a promising source of food, feed, pigments, antioxidants, and at longer term molecules for green chemistry and biofuel (Mata et al., 2010). They are mainly cultivated in suspension-based systems, such as open ponds or photobioreactors (Borowitzka, 1999) with the drawbacks of a high energy and environmental cost for culture mixing, harvesting, and dewatering (Milledge and Heaven, 2013). Some species of microalgae can also grow attached to a support, in complex structures called biofilms (De Beer and Stoodley, 2006). A biofilm is an assemblage of microbial cells irreversibly associated with a surface and enclosed in a matrix of extracellular polymers substances (EPS) (De Beer and Stoodley, 2006). Its three-dimensional structure is strongly heterogeneous in terms of physical, chemical and metabolic properties (De Beer and Stoodley, 2006).
Biofilm-based technologies are an emerging process for microalgae cultivation which has been shown to reach higher productivity (Gross and Wen, 2014; Wang et al., 2017) with lower land and water demands compared with conventional systems (Ozkan et al., 2012; Liu et al., 2013). Harvesting also becomes much simpler by scraping the biofilm (Gross et al., 2015a).
Biofilm structure, growth and cell physiology are strongly affected by environmental and operating factors (Fanesi et al., 2021, 2022). Among them, light is a major parameter to be considered when designing and operating biofilm-based systems. Photosynthetic Photon Flux Density (PPFD) from 100 to 400 μmol·m−2·s−1 is generally reported as the optimal range to maximize the biofilm growth rate (Liu et al., 2013; Mantzorou and Ververidis, 2019). Higher PPFD [e.g., over 2,000 μmol·m−2·s−1 at noon in summer (Liu et al., 2013)] induce photoinhibition and ultimately cell death. One of the technical solutions to avoid photodamage consists in diluting light in time by exposing microalgae cells to alternating light/dark (L/D) cycles (Liao et al., 2014; Abu-Ghosh et al., 2016; Toninelli et al., 2016). This strategy can be implemented by developing biofilms in partially submerged revolving reactors where sessile cells are periodically submitted to light and darkness (Bernstein et al., 2014; Gross et al., 2015b).
Fluctuating light regimes are characterized by several parameters:
• the cycle time (T) which is the total period of a light/dark (L/D) cycle,
• the maximum (or peak) PPFD (Ipeak) during one cycle,
• the time-averaged PPFD (Iave) corresponds to the light dose received by a cell during a cycle time, and
• the light fraction (ε) or duty cycle which is the fraction of time that cells are exposed to light in one cycle.
These parameters affect photosynthetic efficiency, growth, biomass and products synthesis. Photosynthetic growth in fluctuating light is generally considered to be bounded by two extreme regimes. At high light frequency (>100 Hz, short cycle time) growth rate is governed by the time-averaged PPFD [full-light-integration (Vejrazka et al., 2011)]. At low frequency (<0.01 Hz, long cycle time) growth takes place during the light periods at a rate similar to that at continuous light [no-light-integration (Xue et al., 2011; Graham et al., 2017)]. Full-light-integration was first reported by Emerson and Arnold (1932) using cycle times on the scale of milliseconds in suspended algal cultures (Sforza et al., 2012; Schulze et al., 2020). With such short periods, photosystems can use the high PPFD with minimal inhibition. Full-light-integration, corresponding to the highest photon use efficiency, is achieved when applying fast flashing light (μs–ms) even when the cells are exposed to inhibiting peak PPFD (greater than the optimal light intensity) (Xue et al., 2011; Schulze et al., 2020). By contrast, for cycle times longer than hundreds of seconds, photoinhibition is high, and photoefficiency decreases dramatically (Xue et al., 2011; Graham et al., 2017). These phenomena have been widely studied for planktonic cultures, but only few studies have focused on biofilm growth with L/D cycles (Toninelli et al., 2016; Martín-Girela et al., 2017; Grenier et al., 2019).
More investigations are required to better understand the mechanisms (photoacclimation, photoregulation) involved in biofilm development and optimize L/D cycles to enhance growth and ultimately productivity (Toninelli et al., 2016; Zhang et al., 2019). Beyond growth rate and productivity, physiological parameters such as cell size, pigment content and photosynthetic activity must be considered. In the photoacclimation process, extensively described for planktonic cultivation, cellular chlorophyll decreases when cells are submitted to a high PPFD (MacIntyre et al., 2002). Under fluctuating light regimes, chlorophyll content seems mainly dependent on the average light intensity, rather than on peak light (Combe et al., 2015). The impact of intermittent light on chlorophyll content of biofilm cultures has been much less reported (Zhang et al., 2019). Cell volume is also affected by light intensity in suspended cultures, with larger size with increased PPFD (Winokur, 1948; Claustre and Gostan, 1987). Cell size for fluctuating light has been though less studied. Combe et al. (2015), with Dunaliella salina did not record any cell size change in fluctuating regime, while Vejrazka et al. (2011) with Chlamydomonas reinhardti observed that cell size increased at faster light variations, eventually tending to similar features as in continuous light. The maximum quantum yield (Fv/Fm) provides information regarding the PSII physiological state, indicating if there is a stress on PSII (Masoj́ıdek et al., 2013). The Fv/Fm of healthy microalgae cultures (planktonic cultures) usually ranges from 0.7–0.8 depending on the microalgae species, while lower values suggest stress (Masoj́ıdek et al., 2013). Flashing light frequency and peak PPFD have been shown to impact strongly Fv/Fm in suspended cultures (Sforza et al., 2012).
The effects of L/D cycles on biofilm cultures (growth and physiology) have been poorly studied. The goal of this work is therefore to better understand the effect of L/D cycles on biofilm growth (cell number and size), structure dynamics and sessile cell physiology. Physiological and photosynthetic parameters including Fv/Fm, α, rETRmax, chlorophyll-a content and average cell volume were monitored over time. In one of our previous works, growth was not enhanced for light cycles of 30–40 min (Grenier et al., 2019). Here, shorter cycle times ranging from 15 s to 3 min, with light fraction of 1/3 and 1/5 were tested with an average PPFD of 100 μmol·m−2·s−1. Chlorella vulgaris biofilms exposed to continuous light show a decrease in photosynthetic rate at intense light of 500 μmol·m−2·s−1, revealing a strong photoinhibition (GAO et al., 2023). In this study, we also intend to verify if photoinhibition can be mitigated with intermittent illumination conditions, with a simplified single species biofilm model.
Here we demonstrate that sessile microalgae do respond to L/D cycles through physiological adjustments (size, pigment content, photosynthetic activity) to optimize photosynthetic performance and protect themselves from excess of energy. General mechanisms already described for suspended cells are involved (photoacclimation, photoregulation, clustering) but, a unique photoprotection mechanism involving cell organization in photosynthetic sessile cells is suggested here. Our experimental work eventually provided clues to choose the most appropriate operating conditions (cycle time, duty cycle) to run a rotating biofilm system.
Chlorella vulgaris SAG 211-11B (Göttingen, Germany) was cultivated in 3N-Bristol medium (Bischoff, 1963) in a 100 mL glass tube with a working volume of 70 mL in a PSI MC1000 multicultivator (Photon systems instruments, Drásov, Czech Republic) at 25°C. CO2 supply and mixing were carried out by constant air bubbling. The suspended cultures were maintained in the exponential phase (2 × 10⁶−3 × 10⁶ cells·mL−1) and photoacclimated for 2 weeks to the respective light regimes (see Section 2.3) that were further employed in the biofilm experiments.
C. vulgaris biofilms were cultivated in a flow-cell system similar to that used by Le Norcy et al. (2019). Biofilms were grown in 2-channel Poly-methyl methacrylate (PMMA) flow-cell with dimensions of 40 × 6 × 3 mm (length × width × height) where the substratum was represented by a glass coverslip (see Supplementary material). Before inoculation, the system was first sterilized by sodium hypochlorite solution (0.5%) for 3 h and then flushed with 2 L autoclaved distilled water. It was finally filled with 3N-Bristol medium overnight. For inoculation, 3 mL pre-diluted inoculum culture with a cell concentration of 7 × 10⁵cells·mL−1 was injected into each channel through an in-line luer injection port (Ibidi GmbH, Germany). After 24 h without medium flow to ensure cell attachment, fresh medium was added to the flow-cell system at 0.1 mL·min−1 (velocity = 0.093 mm·s−1; Reynolds number = 0.37 and shear stress = 2.3 mPa). The temperature was controlled at 24 ± 1°C. pH in the outlet flow, measured at days 2, 7, and 15, was similar to that of the inlet medium (6.5). Carbon limitation is therefore not expected.
Light (emitting diodes, MEAN WELL ENTERPRISES CO., LTD. ELG-240-24, China) was supplied either continuously at 100 μmol·m−2·s−1 or through L/D cycles (average PPFD of 100 μmol·m−2·s−1) and measured with a Quantitherm PAR/Temp Sensor (Hansatech Instruments Ltd., Norfolk, UK) within the detected spectra range from 400 nm to 700 nm. A first set of experiments were run with different L/D cycles (L/D of 5 s/10 s, 30 s/60 s, 1 min/2 min) with peak PPFD of 300 μmol·m−2·s−1 (for instance, “300-5s-0-10s” refers to 300 μmol·m−2·s−1 for 5 s and darkness for 10 s. “100 cont” refers to continuous light at 100 μmol·m−2·s−1). A second set of assays were then carried out with peak PPFD of 500 μmol·m−2·s−1 and L/D of 5 s/20 s (see Table 1). The number of independent assays were 5, 3, 7, 4, 3 for 100 cont, 300-5s-0-10s, 300-30s-0-60s, 300-1min-0-2min, and 500-5s-0-20s, respectively. For each independent assay, six replicates were performed (meaning 3 parallel flow-cells with a total number of 6 channels)
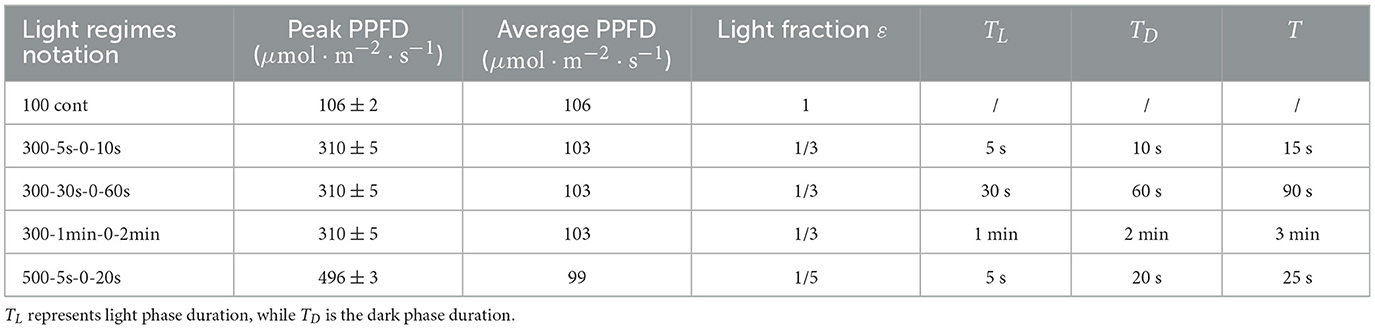
Table 1. Illumination profiles applied to the flow-cell biofilm system.
Biofilm development under different light conditions was monitored in situ and non-destructively using an inverted Zeiss LSM 700 Confocal Laser Scanning Microscope (CLSM, Carl Zeiss microscopy GmbH, Jena, Germany). All biofilm 3D structures were acquired through a LD Plan-Neofluar 20 × 0.4 Korr M27 objective with a 0.4 N.A. (numerical aperture). Each slice has a frame size of 512 × 512 pixels and image size of 638.9 × 638.9 μm2. Pixel size is 1.25 μm. Each z-step is 3.94 μm. One laser channel was applied to detect microalgal chlorophyll-a autofluorescence which was excited by 5-mW solid-state diode laser at 639 nm and detected at 615 nm after the long pass (CP) filter. The laser power was set at 1.0 and the gain (master) of the channel was set at 650.
Biofilm of each flow-cell channel was measured in situ at five positions along the channel to obtain an average index of the biofilm structure. Measurements were carried out every 24 h to follow biofilm structural dynamics. A set of structural parameters were obtained afterwards by image analysis {ImageJ 1.48v software (Schneider et al., 2012) and the plug-in COMSTAT 2.1 [Technical University of Denmark (Heydorn et al., 2000)]: biovolume (μm3·μm−2), maximum thickness (μm), average thickness (μm), roughness (A.U.)}. It is worth noting that autofluorescence of cells is related to chlorophyll within chloroplast. However, to be in accordance with the terminology presented in most of the literature (Fanesi et al., 2019), we consider the increase of autofluorescence as cells proliferation, although autofluorescence does not quantify the exact cell numbers.
Cell density measurement was carried out using a destructive method. Biofilm cells were taken out of each flow-cell channel on day 2, 7, and 15, respectively, by flushing Bristol medium through it, at least twice. Cell concentration was afterwards measured using flow cytometry [Guava easyCyte 5 flow cytometer (Millipore corporation 25801 Industrial Blvd Hayward, CA94545)] with chlorophyll-a excitation at 488 nm and fluorescence detection at 680 nm. Sample's cell concentration was kept in the range of 1 × 10⁴ to 6 × 10⁵ cells·mL−1 by medium dilution for measurements. The areal cell density was obtained from total cell number divided by the substratum surface of the channel (0.24 cm2).
Light transmission through the biofilm was calculated daily based on the difference between light intensity above and below the flow-cell (Equation 1) measured by the Quantitherm PAR/Temp Sensor.
where Iin refers to incident light on the top of the flow-cell, Iout refers to output light through the channel with biofilm (mean of three positions' outputs along the channel).
Biofilm specific growth rate was determined using light transmittance data. The light transmittance in biofilms follows the Lambert-Beer Law:
where X is the biomass (g·m−2), k is the light extinction coefficient (m2·g−1). Thus:
Accordingly, the specific growth rate (μ, d−1) based on light transmittance is the maximum slope of the regression between and time t (at least four data points were used). The specific growth rate μ stands for the average net growth rate during a cycle, resulting from the balance between gross photosynthesis in light phase and respiration (R, d−1) in light and darkness. The gross growth rate in light phases (μL, d−1) comes from gross photosynthesis. Therefore,
Sessile cell physiology (cell volume, chlorophyll content) and Fv/Fm were assessed by off-line measurements on day 2, day 7, and day 15, respectively. Biofilm cells were extracted from each channel as previously described. Physiology of the inoculum culture (day 0) was analyzed to compare with that of biofilm cells.
Cell volume was measured by image acquisition through microscope imaging (Brightfield in transmission mode) and subsequent image analysis (software ImageJ v1.48). On day 2, cell observation and volume estimations in situ were possible due to the low cell density. On days 7 and 15, the cells were withdrawn, concentrated (to 1 × 10⁸−2 × 10⁸ cells·mL−1 by centrifugation at 14,500 rpm) and observed by optical microscopy. 2D images were first obtained by the inverted Zeiss LSM 700 Confocal Laser Scanning Microscope (CLSM, Carl Zeiss microscopy GmbH, Jena, Germany) with Zen 10.0 software black edition (Carl Zeiss microscopy GmbH, Jena, Germany). LD Plan-Neofluar 20 × 0.4 Korr M27 objective with a 0.4 N.A. was used to take the picture with a frame size of 256 × 256 pixels (pixel size: 0.32 μm) and image size of 82.2 × 82.2 μm2. On the other hand, optical track channel (TV1) was used for optical microscopy acquisition. The 2D image including cells were analyzed by ImageJ v1.48 software directly. The image type was chosen as 8-bit, the threshold adjusted. After making binary of the image and all cells being filled in black with a white background, the area of each cell was analyzed by carrying out “Analyze particles.” The cell size limit was set as 0- infinity with the pixel units concerned. Assuming all cells to be spheres of similar diameter, the cell volume (μm3) can be determined from the cell area (Equation 3):
where A (μm2) is the area of the microalgae cell, which is determined from image analysis.
Chlorophyll-a was extracted from microalgal cells using Dimethyl-sulphoxide (DMSO) (Li et al., 2021). First, cells (range: 4 × 10⁶−10 × 106 cells) were filtrated on glass fiber filters (Fisher Scientific, size: 47 mm, EU). The filter was cut into 5 mm strip and then submerged in 1 mL DMSO in 1.5 mL Eppendorf tube and mixed for 5 min. Chlorophyll-a extraction was carried out for 40 min at room temperature in the dark. After being centrifuged for 5 min with 1300 rpm, the supernatant was transferred to a 1.5 mL cuvette for absorbance measurement by a UV Visible Spectrophotometer (Thermo Fisher Scientific, EVOLUTION 60s, China). Chlorophyll-a (μg·mL−1) was calculated according to Equation 4 (Li et al., 2021):
Where abs665 and abs649 refer to the absorbance at wavelength of 665 nm and 649 nm, respectively. Chlorophyll-a content per cell (pg·cell−1) and per cell volume (fg·μm−3) were subsequently calculated.
The photosynthetic efficiency of biofilms was measured by using a portable pulse amplitute modulation (PAM) fluorometer (AquaPen, Photon Systems Instruments, AP110-C, Czech Republic) as described by Li et al. (2021). Before each determination, according to the chlorophyll-a content, the concentration of harvested biofilm sample was adjusted to the range of 5 × 10⁵–1 × 10⁶ cells·mL−1 in 3 mL working volume in a 4 mL cuvette. After 15 min of dark adaptation, the samples were exposed to a stepwise increase of seven actinic lights (from 0 to 1,000 μmol·m−2·s−1) applied every 60 s. The wavelength for fluorescence excitation was 455 nm while for fluorescence detection was 667 nm–750 nm. The maximum quantum yield (Fv/Fm) and the effective quantum yield () were calculated by:
where F0 is the minimum fluorescence yield determined after dark adaptation; Fm is the maximal fluorescence measured after excitation by a 0.8 s saturation light pulse with PPFD of 3,000 μmol·m−2·s−1. Fv is the difference between Fm and F0. F and are the minimum and maximum fluorescence during illumination.
The relative electron transport rate (rETR) was calculated by:
where PAR is the photosynthetic active radiation at each step and 0.5 is a factor assuming that two photons are required for linear electron transfer. Light curves were quantitatively compared using the parameters of the maximum rate of relative ETR (rETRmax), the initial slope of the curves (termed α, representing the maximum light utilization coefficient), and the saturation PAR (Ek, Ek = rETRmax/α) obtained by fitting the rETR versus PAR curves with the rectangular hyperbola [] (Ralph and Gademann, 2005).
The Haldane model applied in Bernard and Rémond (2012) was used to represent the influence of light on phytoplankton gross growth rate, as Equation 8.
where μmax is the maximal gross growth rate at optimal light intensity (Iopt, μmol·m−2·s−1). α (m2·μmol−1) is the initial slope of the curve.
Here, we counted respiration loss (R, d−1) in the net growth rate under intermittent light regimes as Equation 9.
The respiration rate is assumed to be constant with the value provided in Grenier et al. (2019), whatever the light condition (see Supplementary material for further details). The Matlab Nelder-Mead simplex direct search minimization algorithm (fminsearch) was used to fit the data curve and identify the parameters. The students test was used to compare predictions and experimental results at a significance level of p < 0.05.
Growth yield (d−1·μmol−1·m2·s) with cycle time-averaged light input is calculated by Equation 10:
Net footprint productivity (Pf) in revolving systems with various designs (different ε) can also be calculated without photoinhibition mitigation.
where ST (m2) is the total area available for biofilm growth; Sf (m2) is the footprint of the biofilm system (note that ); ρ (g·m−3) is the dry weight-based volumeric biomass density [1.40 ·105 g·m−3 from Grenier et al. (2019)]; h (m) is the highest maximum thickness of biofilms observed in this research. More parameter values can be found in the Supplementary material.
Results were presented as mean and standard deviation. One-way or two-way ANOVA was performed by GraphPad prism 8.0 to test the statistically significant difference of means between different light regimes and time points. The level of significance was set at 0.05.
Figure 1 displays representative images of 3D structure of C. vulgaris biofilms. Cell accumulation with time, due to cell division, is clearly visible. Interestingly, differences in structural dynamics can be detected among light conditions (Figure 2). Higher biovolume was observed for biofilms developed at 300-5s-0-10s from day 9 onwards, (p <0.05) compared with those exposed to equivalent continuous light intensity (Figure 2A). On the other hand, extended light/dark cycles in the minute scale impact growth negatively (p < 0.05), suggesting inhibition by light. In general, biofilms get smoother with time but significant structural pattern differences were observed among light regimes (see Figures 2B, C). Indeed, a sharp increase in the maximum thickness was observed in the initial stages of biofilm development for high peak PPFD at 500 μmol·m−2·s−1, even at low duty cycles, suggesting cell distribution in clusters (slope of maximum thickness over biovolume in 5 days: 2.78, adjusted R2: 0.95, see Supplementary material). By contrast, cells seem to distribute homogeneously on the support under continuous light (slope in 5 days: –0.25, adjusted R2: 0.39). Similar behavior has been described for Botryococcus braunii biofilms (Van Den Berg et al., 2019). Acclimation to low light (50 μmol·m−2·s−1) led to smaller and homogeneous colonies, whereas larger and heterogeneous colonies were found for middle (150 μmol·m−2·s−1) and high light (450 μmol·m−2·s−1) (Van Den Berg et al., 2019). Spatial cell distribution seems therefore light regime dependent.
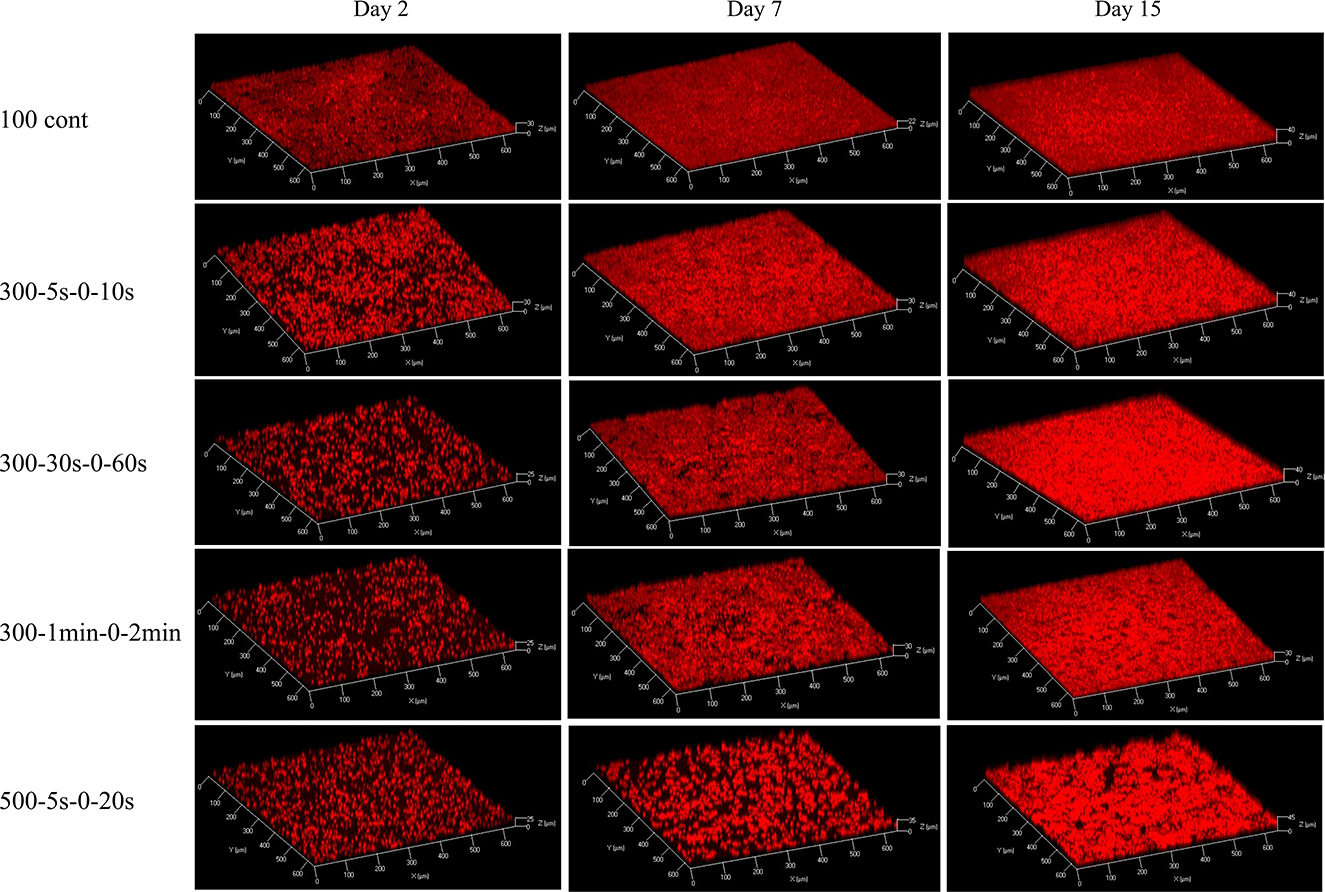
Figure 1. 3D structures of biofilms at day 2, day 7, and day 15, under five light regimes: 100 continuous, 300-5s-0-10s, 300-30s-0-60s, 300-1min-0-2min, 500-5s-0-20s, respectively. The red signal corresponds to the auto-fluorescence of chlorophyll which is used as biomass indicator.
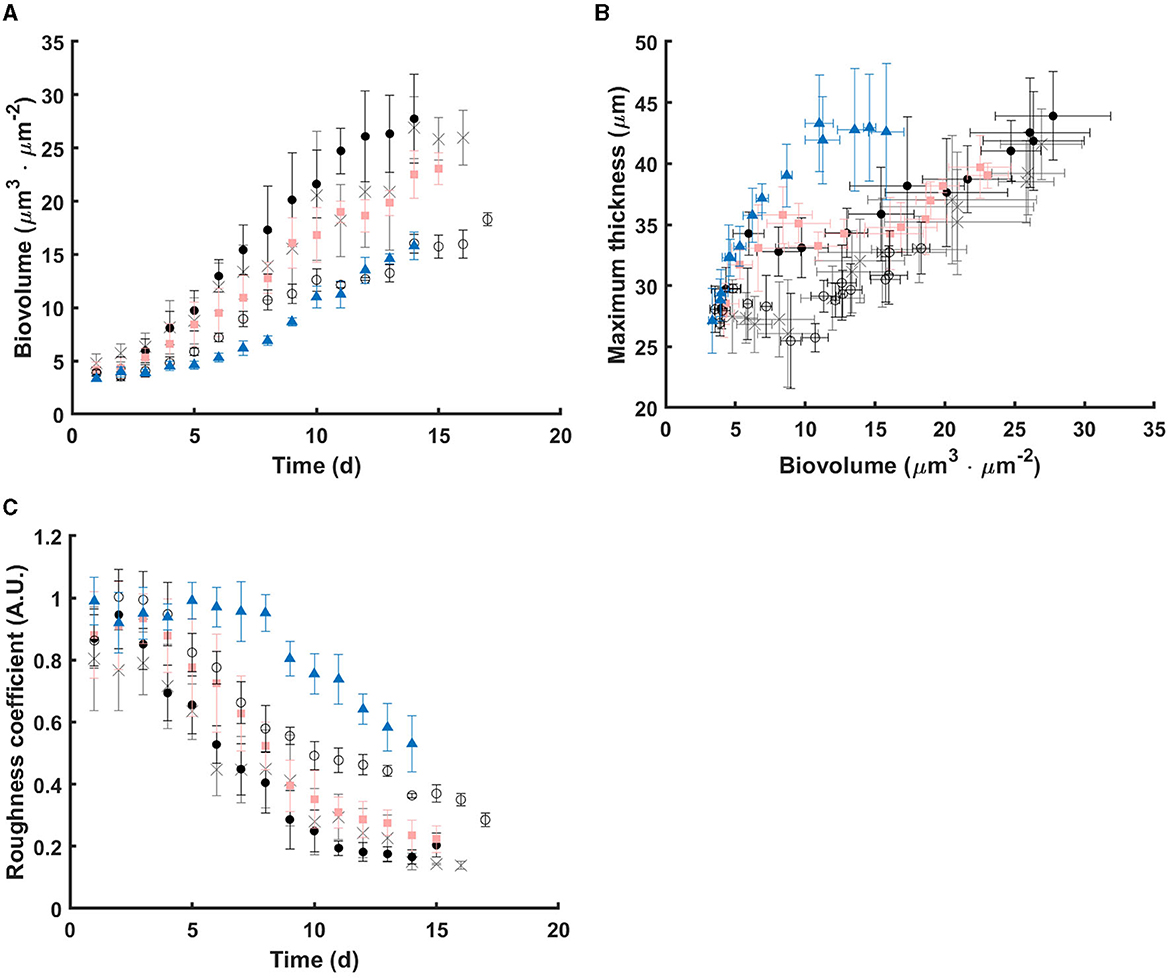
Figure 2. Dynamics of structural parameters under the tested light regimes. (A) Biovolume over time; (B) Relationships between Biovolume and Maximum thickness; (C) Roughness coefficient over time. Data points are the mean value of each parameter from replicates under continuous light (gray cross), 300-5s-0-10s (black dot), 300-30s-0-60s (pink square), 300-1min-0-2min (black circle), and 500-5s-0-20s (blue triangle), respectively. Errors bars represent the standard deviation of replicates.
In our study, full-light-integration is met up to cycle times of the order of tens of seconds (p > 0.05, Figure 4A). A decrease of the specific growth rate is though observed (p < 0.05) with extended cycle time certainly due to excess of light. This is in agreement with other studies demonstrating an improvement of biofilm photoefficiency and productivity with reduced cycle times (Toninelli et al., 2016). Regarding cell physiology, the evolution of several parameters (cell volume, chlorophyll-a content, Fv/Fm, α, and rETRmax) is plotted with time for all tested regimes in Figure 3. First, a physiological shift from planktonic (day 0) to sessile state (day 2) is clearly observed, in particular, in terms of chlorophyll content (Figure 3B) and maximum quantum yield (Figure 3C). This behavior is in agreement with our previous works for biofilm cultivation in continuous light (Li et al., 2021). Second, a decreasing pattern in terms of chlorophyll-a content and Fv/Fm were reported with time in biofilms (Figure 3B). In agreement with Combe et al. (2015) (cycle time from 0.2 s to 3 s, light fraction from 0.4 to 0.67, average PPFD of 400 μmol·m−2·s−1), cellular chlorophyll-a content photoacclimated to the same level as under equivalent continuous light, for all the tested light regimes (Figure 4B). It is also worth noting that light regime deeply impacts cell volume (Figure 3A). The interpretation of cell volume is complicated since it results from two concurrent mechanisms. The somatic growth is related to the necessity to accumulate the organic carbon produced by photosynthesis. Cell division leads to a reduction of cell size, and frequent division (high growth rate) resulting in smaller cells. In our study, growth rate is higher for continuous light and higher light frequency (at lower peak light), thus favoring smaller cell sizes. A deep decrease of cell volume is observed after 2 days for continuous light, followed by a slight increase over time. On the contrary, intermittent light at 300 μmol·m−2·s−1 peak light does not change much the cell volume. For the case of highest frequency, this suggests that lower cell size is compensated by a necessity to accumulate more photosynthetic products in the cell. In general, for these L/D cycles, the volume remains very close to that of the planktonic cells for all cycle times assessed. On the other hand, the cell behavior at 500 μmol·m−2·s−1 is totally different, with a marked increase of cell volume over time (two-fold increase in size of the cells). In this case, the high PPFD leads both to a lower growth rate, and most likely a higher energy flux in the cell during the light period, two factors leading to larger cells.
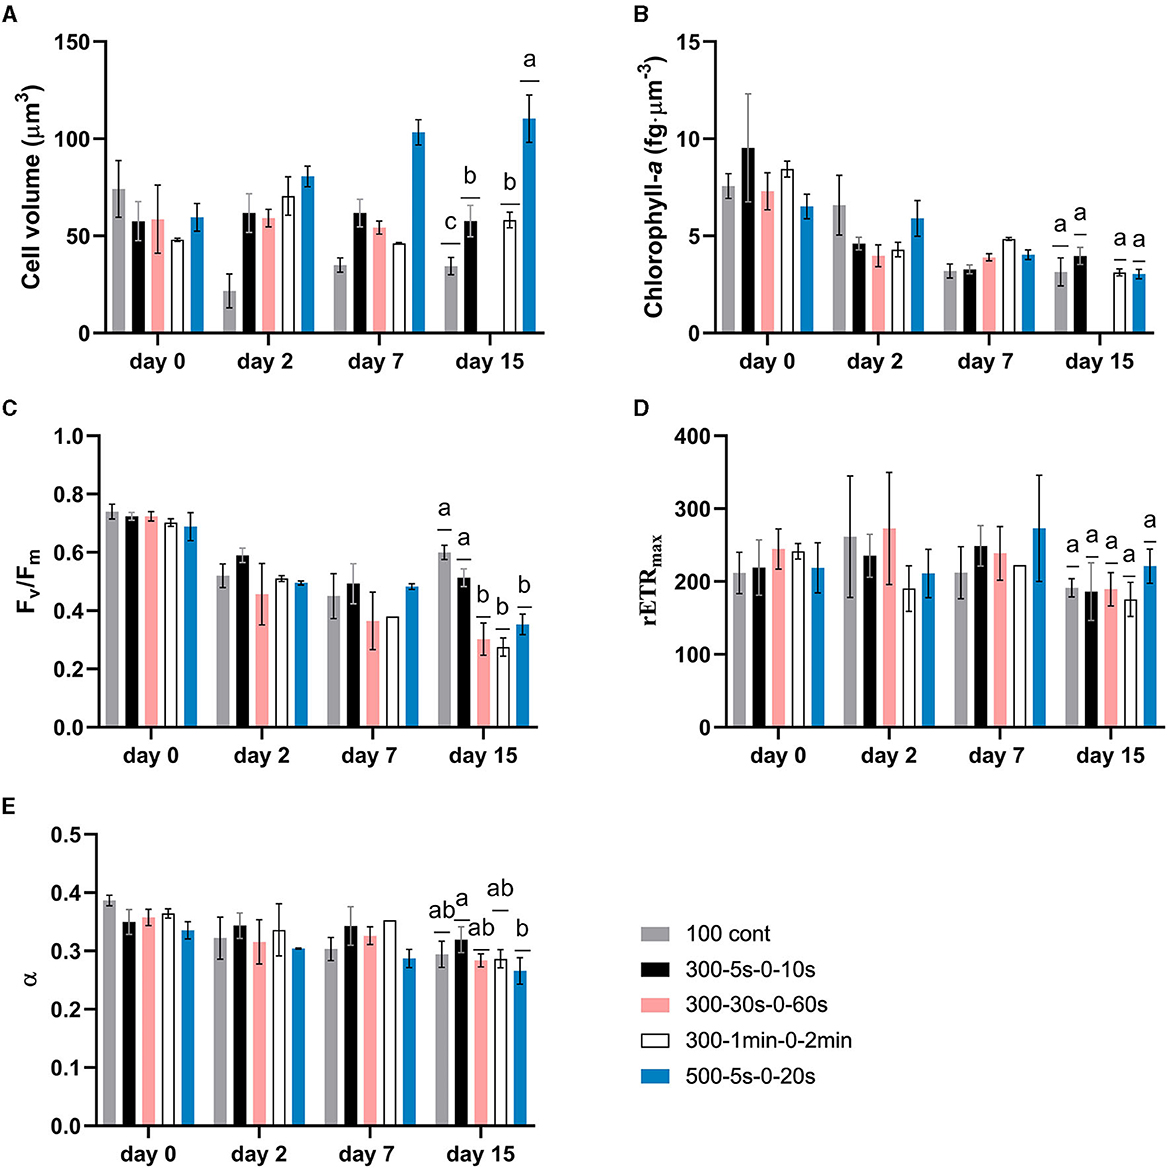
Figure 3. Dynamics of microalgae physiological parameters for biofilms under different light regimes. Data on “day 0” refer to photoacclimated suspended cells (inoculum culture). (A) average cell volume; (B) chlorophyll-a content normalized by per cell volume; (C) maximum quantum yield (Fv/Fm); (D) maximum relative electron transport rate; (E) initial slope of relative electron transport rate with respect to PPFD (α). Data are shown as mean ± standard deviation. Two-way ANOVA was carried out on each parameter, but statistics were only shown on day 15 with different letters representing the statistical differences among light regimes at the level of P < 0.05.
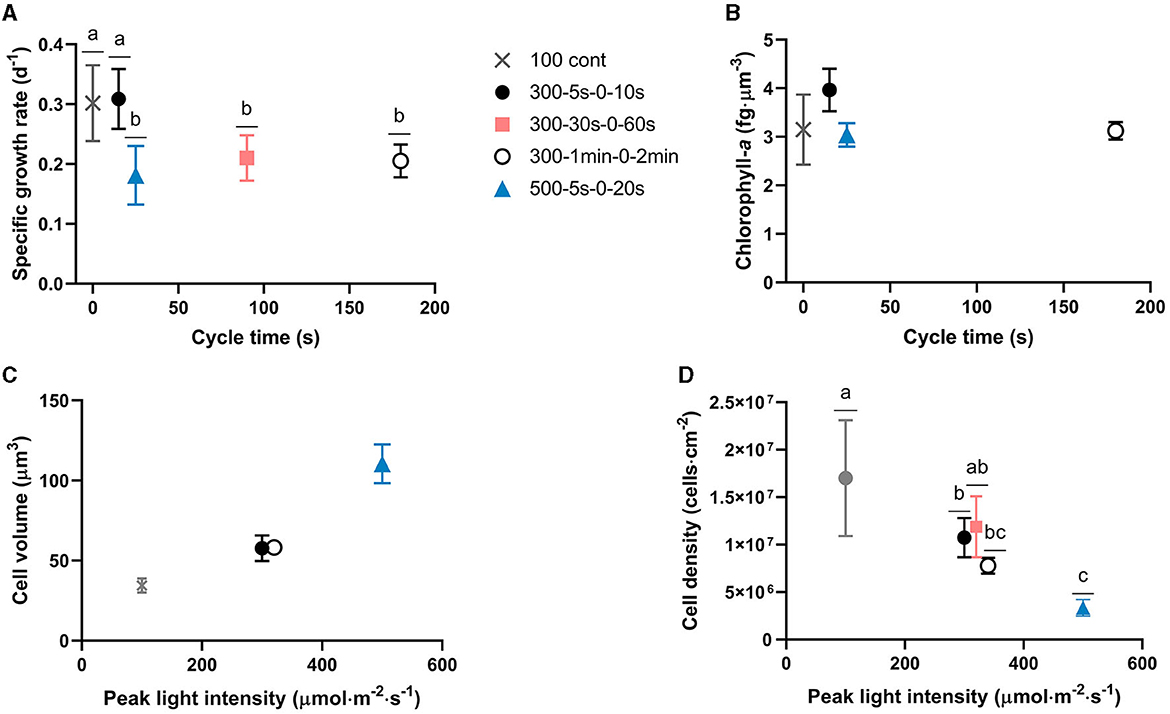
Figure 4. Cycle time and peak light intensity impacts on growth and physiology, respectively. (A) Biofilm specific growth rate and (B) Chlorophyll-a content with respect to cycle time; (C) Cell volume and (D) chlorophyll-a content per cell volume with respect to peak PPFD. Cell physiology parameters presented in this figure represent biofilm cell properties at day 15. Data points of the 3 light regimes with the same incident light of 300 μmol·m−2·s−1 shifted slightly to distinguish with each other in (C, D). Bars with different letters represent the statistical differences among light regimes at the P < 0.05 level from the One-way ANOVA test. Data are shown as mean ± standard deviation.
For all cycle times tested, the cell volume seems to be mainly driven by the peak PPFD (Figure 4C) and the necessity to accumulate on a short time scale storage compounds such as carbohydrates generated by the Calvin cycle. Interestingly, cell density is also peak light dependent (Figure 4D). This is consistent with other works demonstrating the influence of continuous light intensity on cell size (Winokur, 1948; Claustre and Gostan, 1987). A balance between light energy absorption and the overall utilization capacity of a cell must be maintained to optimize growth and protect the cell from excess of energy. In planktonic cultures of microalgae, the photo-acclimation state of the cells is not only reflected in different pigment contents and photosynthetic efficiency, but often also in changes of their macromolecular composition (Halsey and Jones, 2015). Storage pools such as carbohydrates and lipids typically serve as carbon and energy sinks during unbalanced growth due to high excitation pressure and/or nutrient limitation (Claustre and Gostan, 1987; Yilancioglu et al., 2014). An increase of intracellular sugars (Han et al., 2015; Schulze et al., 2017) and glycerol (Xu et al., 2016) has also been reported as a photoprotection mechanism in strong flashing light to avoid the generation or accumulation of harmful reactive oxygen species (ROS). Though changes in the chemical composition of biofilm cells are poorly studied, in particular in fluctuating light conditions, some works (Li et al., 2021) claim that mechanisms are similar to those involved in planktonic cultures. On the whole, there are two main mechanisms to manage the excess of light energy entering the cell during the short illumination period. Dissipating this energy through photosynthesis, while keeping the photosynthetic properties (chlorophyll content, see Figure 3B, and activity, see Figures 3D, E) for using the excess of light to produce storage compounds, consequently increasing in size. In addition, non-photochemical quenching mechanisms are known to be activated to earlier dissipate the excess excitation energy from the reaction center of PSII as already confirmed in Chlorella sp. biofilms (Wang et al., 2021). In our study, it is thus hypothesized that stressed cells exposed to high peak light intensity/low frequency are likely changing metabolism in order to use excess of light to produce storage compounds instead of dividing. However, the occurrence of non-photochemical quenching mechanisms is not ruled out. Parameters such as NPQ, carotenoids content, macromolecular (carbohydrates, lipids, proteins) composition should be therefore considered in future research to verify our hypothesis. The higher stress generated by unbalanced light regimes could also explain the formation of clusters, clearly observed for the 500 μmol·m−2·s−1 test. The cells at the surface are dramatically exposed to this high flux of energy, and in the natural diversity of the population, only the ones with less photosynthetic pigment survive. The top cells act as a protective shield to those lying underneath. They then allow cells to grow below, protecting them from this excess of light, naturally generating vertical structures. Such a photoprotection mechanism has been proposed in planktonic Bracteacoccus aggregatus cultures in response to UV-A stress (Chekanov et al., 2022). B. aggregatus aggregates with external bleached or intensely red-colored cells, due to carotenoid accumulation, and green internal cells, able to divide, were described in this work. Our observations are also in agreement with other of our studies describing the impact of light on the shape of immobilized cultures (Zhang and Perré, 2020). Additionally, to cope with high light stress, cell surface composition may also change consequently affecting cell-cell interactions and possible clustering, as previously described by Yuan et al. (2021).
Intermittent light regimes tested in this work turn out to reduce photoinhibition induced by high light (300 and 500 μmol·m−2·s−1). This is shown in Figure 5A where computations of gross growth rate during the light phase μL are shown, assuming a constant respiration rate R during the light and dark phase. The net growth rates measured under various continuous light are also shown for comparison. It turns out that the μL recorded for the various light regimes is much larger than the one which would be expected for a large cycle time, i.e., if growth rate during the light phase was the same as the one in continuous light with the same light intensity. The μL is more than twofold the one obtained for the same continuous light, which shows strong mitigation of the photoinhibition. This effect is even more marked when the net growth rate (μ) is plotted as a function of the peak light (see Figure 5B): the net growth rate is marginally affected by the periodic absence of light, and is not markedly different from the growth rate at constant peak light. Computing the apparent light yield (ratio of the net growth rate over the average light, see Figure 5C) it turns out that the yield in periodic light stays close to one observed at 100 μmol·m−2·s−1. Diluting light in time avoids the reduced yield due to photoinhibition. Cycle time controls the growth rate enhancement. With the same peak light of 300 μmol·m−2·s−1, the value of μL increases with shortened cycle time from 3 min to 15 s (p < 0.05), though the average light input is the same at 100 μmol·m−2·s−1.
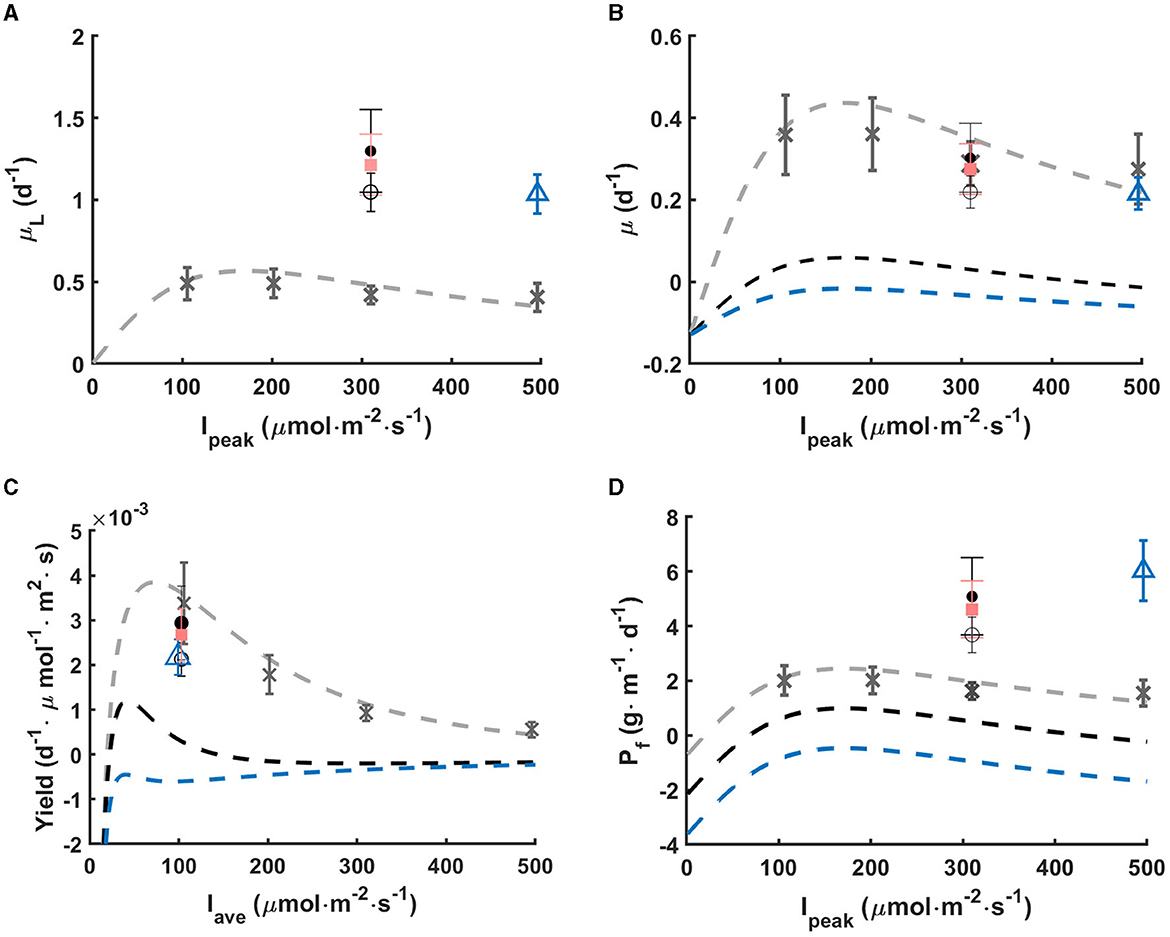
Figure 5. In rotating biofilm systems: (A) gross growth rate in light phase (μL), (B) net growth rate (μ) with respect to peak light intensity, (C) growth yield with respect to average light intensity, and (D) net footprint productivity (Pf) with respect to peak light intensity. Data points represent the mean values of μL and Pf calculated according to Sections 2.7, 2.9. Errors bars represent the standard deviation. Different light regimes are studied: continuous light (gray cross), 300-5s-0-10s (black dot), 300-30s-0-60s (pink square), 300-1min-0-2min (black circle), and 500-5s-0-20s (blue triangle). Dash lines represent the Haldane model fitting under continuous light (gray), and under intermittent light without inhibition mitigation with light fractions of 1/3 (black) and 1/5 (blue).
In the work of Grenier et al. (2019), cycle times in the order of 30 min and 40 min led to a similar μL as for constant illumination, showing that photoinhibition was not mitigated. This case is also presented on Figure 5B to better understand how short cycles enhance photoefficiency. Here, with short cycle times, photoinhibition was significantly mitigated under all L/D cycles (p < 0.05).
There is another benefit in this approach. When considering a rotating system (Gross et al., 2013), with ε = 1/3, it means that the system contains 3 times more biomass than a system with ε = 1 which would be permanently exposed to full sunlight. Figure 5D shows that productivity is considerably enhanced for the same PPFD impinging the enlighten part of the biofilm. The cornerstone of this process is to cumulate the light mitigation effect, and the increase in total biomass per footprint unit.
The L/D cycles investigated in this work are representative of the cycles that could be obtained by rotating devices considering the shear stress (Gross et al., 2013) and energy consumption. Understanding and quantifying their impact on biofilm development is of paramount importance to help the operator to identify stressful parameters in advance, to spot optimal operating conditions and improve the reactor design. The best trade-off between productivity (high rotation speed to reduce the cycle time) and energy consumption (low rotation speed) can be more objectively determined. Our study confirms that short cycle times (in the order of tens of seconds) must be applied when aiming at maximizing cell productivity. This opens new routes for the production of high-value metabolites. Modeling has also to be promoted to integrate these findings into an operational tool for the design and operation of rotating biofilm systems.
The original contributions presented in the study are included in the article/Supplementary material, further inquiries can be directed to the corresponding author.
YG, FL, and AF conceived the experiment. FL and AF contributed to the supervision of the experiments. YG, FL, AF, PP, and OB analyzed the results. YG wrote the first manuscript version which was updated by all authors. All authors contributed to the article and approved the submitted version.
The authors are grateful for the financial support of China Scholarship Council (201806120042) and ANR project Alligator. The work is also benefited from the funding of the LabeX LaSIPS project AlgaeBiofilm and Greenbelt (ANR-20-CE43-0008) managed by the French National Research Agency (ANR) under the Investissements d'avenir program.
The authors declare that the research was conducted in the absence of any commercial or financial relationships that could be construed as a potential conflict of interest.
All claims expressed in this article are solely those of the authors and do not necessarily represent those of their affiliated organizations, or those of the publisher, the editors and the reviewers. Any product that may be evaluated in this article, or claim that may be made by its manufacturer, is not guaranteed or endorsed by the publisher.
The Supplementary Material for this article can be found online at: https://www.frontiersin.org/articles/10.3389/fmicb.2023.1250866/full#supplementary-material
Abu-Ghosh, S., Fixler, D., Dubinsky, Z., and Iluz, D. (2016). Flashing light in microalgae biotechnology. Bioresour. Technol. 203, 357–363. doi: 10.1016/j.biortech.2015.12.057
Bernard, O., and Rémond, B. (2012). Validation of a simple model accounting for light and temperature effect on microalgal growth. Bioresour. Technol. 123, 520–527. doi: 10.1016/j.biortech.2012.07.022
Bernstein, H. C., Kesaano, M., Moll, K., Smith, T., Gerlach, R., Carlson, R. P., et al. (2014). Direct measurement and characterization of active photosynthesis zones inside wastewater remediating and biofuel producing microalgal biofilms. Bioresour. Technol. 156, 206–215. doi: 10.1016/j.biortech.2014.01.001
Bischoff, H. (1963). Some soil algae from enchanted rock and related algal species. Phycol. Stud. 6318, 1–95.
Borowitzka, M. A. (1999). Commercial production of microalgae: ponds, tanks, tubes and fermenters. J. Biotechnol. 70, 313–321. doi: 10.1016/S0168-1656(99)00083-8
Chekanov, K., Shibzukhova, K., Lobakova, E., and Solovchenko, A. (2022). Differential responses to uv-a stress recorded in carotenogenic microalgae haematococcus rubicundus, bracteacoccus aggregatus, and deasonia sp. Plants 11, 1431. doi: 10.3390/plants11111431
Claustre, H., and Gostan, J. (1987). Adaptation of biochemical composition and cell size to irradiance in two microalgae: Possible ecological implications. Marine Ecol. Progr. Series. 40, 167–174. doi: 10.3354/meps040167
Combe, C., Hartmann, P., Rabouille, S., Talec, A., Bernard, O., and Sciandra, A. (2015). Long-term adaptive response to high-frequency light signals in the unicellular photosynthetic eukaryote dunaliella salina. Biotechnol. Bioeng. 112, 1111–1121. doi: 10.1002/bit.25526
De Beer, D., and Stoodley, P. (2006). Microbial biofilms. Prokaryotes 1, 904–937. doi: 10.1007/0-387-30741-9_28
Emerson, R., and Arnold, W. (1932). A separation of the reactions in photosynthesis by means of intermittent light. J. General Physiol. 15, 391. doi: 10.1085/jgp.15.4.391
Fanesi, A., Lavayssière, M., Breton, C., Bernard, O., Briandet, R., and Lopes, F. (2021). Shear stress affects the architecture and cohesion of chlorella vulgaris biofilms. Scient. Rep. 11, 1–11. doi: 10.1038/s41598-021-83523-3
Fanesi, A., Martin, T., Breton, C., Bernard, O., Briandet, R., and Lopes, F. (2022). The architecture and metabolic traits of monospecific photosynthetic biofilms studied in a custom flow-through system. Biotechnol. Bioeng. 119, 2459–2470. doi: 10.1002/bit.28147
Fanesi, A., Paule, A., Bernard, O., Briandet, R., and Lopes, F. (2019). The architecture of monospecific microalgae biofilms. Microorganisms 7, 352. doi: 10.3390/microorganisms7090352
GAO, Y., Bernard, O., Fanesi, A., Perré, P., and Lopes, F. (2023). The effect of light intensity on microalgae biofilm structures and physiology under continuous illumination. Research Square [preprint], Available online at: https://doi.org/10.21203/rs.3.rs-3058230/v1 (accessed June 13, 2023).
Graham, P. J., Nguyen, B., Burdyny, T., and Sinton, D. (2017). A penalty on photosynthetic growth in fluctuating light. Scient. Rep. 7, 1–11. doi: 10.1038/s41598-017-12923-1
Grenier, J., Bonnefond, H., Lopes, F., and Bernard, O. (2019). The impact of light supply to photosynthetic moving biofilms. Algal Res. Biomass, Biofuels Bioprod. 44, 101674. doi: 10.1016/j.algal.2019.101674
Gross, M., Henry, W., Michael, C., and Wen, Z. (2013). Development of a rotating algal biofilm growth system for attached microalgae growth with in situ biomass harvest. Bioresour. Technol. 150, 195–201. doi: 10.1016/j.biortech.2013.10.016
Gross, M., Jarboe, D., and Wen, Z. (2015a). Biofilm-based algal cultivation systems. Appl. Microbiol. Biotechnol. 99, 5781–5789. doi: 10.1007/s00253-015-6736-5
Gross, M., Mascarenhas, V., and Wen, Z. (2015b). Evaluating algal growth performance and water use efficiency of pilot-scale revolving algal biofilm (rab) culture systems. Biotechnol. Bioeng. 112, 2040–2050. doi: 10.1002/bit.25618
Gross, M., and Wen, Z. (2014). Yearlong evaluation of performance and durability of a pilot-scale revolving algal biofilm (rab) cultivation system. Bioresour. Technol. 171, 50–58. doi: 10.1016/j.biortech.2014.08.052
Halsey, K. H., and Jones, B. M. (2015). Phytoplankton strategies for photosynthetic energy allocation. Annu. Rev. Mar. Sci 7, 265–297. doi: 10.1146/annurev-marine-010814-015813
Han, P., Shen, S., Wang, H., Sun, Y., Dai, Y., and Jia, S. (2015). Comparative metabolomic analysis of the effects of light quality on polysaccharide production of cyanobacterium nostoc flagelliforme. Algal Res. 9, 143–150. doi: 10.1016/j.algal.2015.02.019
Heydorn, A., Nielsen, A. T., Hentzer, M., Sternberg, C., Givskov, M., Ersbøll, B. K., et al. (2000). Quantification of biofilm structures by the novel computer program comstat. Microbiology 146, 2395–2407. doi: 10.1099/00221287-146-10-2395
Le Norcy, T., Faý, F., Obando, C. Z., Hellio, C., Réhel, K., and Linossier, I. (2019). A new method for evaluation of antifouling activity of molecules against microalgal biofilms using confocal laser scanning microscopy-microfluidic flow-cells. Int. Biodeterior. Biodegr. 139, 54–61. doi: 10.1016/j.ibiod.2019.03.001
Li, S. F., Fanesi, A., Martin, T., and Lopes, F. (2021). Biomass production and physiology of chlorella vulgaris during the early stages of immobilized state are affected by light intensity and inoculum cell density. Algal Res. 59, 102453. doi: 10.1016/j.algal.2021.102453
Liao, Q., Li, L., Chen, R., and Zhu, X. (2014). A novel photobioreactor generating the light/dark cycle to improve microalgae cultivation. Bioresour. Technol. 161, 186–191. doi: 10.1016/j.biortech.2014.02.119
Liu, T., Wang, J., Hu, Q., Cheng, P., Ji, B., Liu, J., et al. (2013). Attached cultivation technology of microalgae for efficient biomass feedstock production. Bioresour. Technol. 127, 216–222. doi: 10.1016/j.biortech.2012.09.100
MacIntyre, H. L., Kana, T. M., Anning, T., and Geider, R. J. (2002). Photoacclimation of photosynthesis irradiance response curves and photosynthetic pigments in microalgae and cyanobacteria 1. J. Phycol. 38, 17–38. doi: 10.1046/j.1529-8817.2002.00094.x
Mantzorou, A., and Ververidis, F. (2019). Microalgal biofilms: A further step over current microalgal cultivation techniques. Sci. Total Environ. 651, 3187–3201. doi: 10.1016/j.scitotenv.2018.09.355
Martín-Girela, I., Curt, M. D., and Fernández, J. (2017). Flashing light effects on co_2 absorption by microalgae grown on a biofilm photobioreactor. Algal Res. 25, 421–430. doi: 10.1016/j.algal.2017.06.008
Masojídek, J., Torzillo, G., and Koblížek, M. (2013). “Photosynthesis in microalgae,” in Handbook of Microalgal Culture: Applied Phycology and Biotechnology 21–36. doi: 10.1002/9781118567166.ch2
Mata, T. M., Martins, A. A., and Caetano, N. S. (2010). Microalgae for biodiesel production and other applications: a review. Renew. Sustain. Energy Rev. 14, 217–232. doi: 10.1016/j.rser.2009.07.020
Milledge, J. J., and Heaven, S. (2013). A review of the harvesting of micro-algae for biofuel production. Rev. Environ. Sci. Bio/Technol. 12, 165–178. doi: 10.1007/s11157-012-9301-z
Ozkan, A., Kinney, K., Katz, L., and Berberoglu, H. (2012). Reduction of water and energy requirement of algae cultivation using an algae biofilm photobioreactor. Bioresour. Technol. 114, 542–548. doi: 10.1016/j.biortech.2012.03.055
Ralph, P. J., and Gademann, R. (2005). Rapid light curves: a powerful tool to assess photosynthetic activity. Aquat. Botany 82, 222–237. doi: 10.1016/j.aquabot.2005.02.006
Schneider, C. A., Rasband, W. S., and Eliceiri, K. W. (2012). Nih image to imagej: 25 years of image analysis. Nat. Methods 9, 671–675. doi: 10.1038/nmeth.2089
Schulze, P. S., Brindley, C., Fernández, J. M., Rautenberger, R., Pereira, H., Wijffels, R. H., et al. (2020). Flashing light does not improve photosynthetic performance and growth of green microalgae. Bioresour. Technol. Rep. 9, 100367. doi: 10.1016/j.biteb.2019.100367
Schulze, P. S., Guerra, R., Pereira, H., Schüler, L. M., and Varela, J. C. (2017). Flashing leds for microalgal production. Trends Biotechnol. 35, 1088–1101. doi: 10.1016/j.tibtech.2017.07.011
Sforza, E., Simionato, D., Giacometti, G. M., Bertucco, A., and Morosinotto, T. (2012). Adjusted light and dark cycles can optimize photosynthetic efficiency in algae growing in photobioreactors. PLoS ONE 7, e38975. doi: 10.1371/journal.pone.0038975
Toninelli, A. E., Wang, J., Liu, M., Wu, H., and Liu, T. (2016). Scenedesmus dimorphus biofilm: Photoefficiency and biomass production under intermittent lighting. Scient. Rep. 6, 1–10. doi: 10.1038/srep32305
Van Den Berg, T. E., Chukhutsina, V. U., Van Amerongen, H., Croce, R., and Van Oort, B. (2019). Light acclimation of the colonial green alga botryococcus braunii strain showa. Plant Physiol. 179, 1132–1143. doi: 10.1104/pp.18.01499
Vejrazka, C., Janssen, M., Streefland, M., and Wijffels, R. H. (2011). Photosynthetic efficiency of chlamydomonas reinhardtii in flashing light. Biotechnol. Bioeng. 108, 2905–2913. doi: 10.1002/bit.23270
Wang, J., Liu, W., and Liu, T. (2017). Biofilm based attached cultivation technology for microalgal biorefineriesa review. Bioresour. Technol. 244, 1245–1253. doi: 10.1016/j.biortech.2017.05.136
Wang, Y., Jiang, Z., Lai, Z., Yuan, H., Zhang, X., Jia, Y., et al. (2021). The self-adaption capability of microalgal biofilm under different light intensities: Photosynthetic parameters and biofilm microstructures. Algal Res. 58, 102383. doi: 10.1016/j.algal.2021.102383
Winokur, M. (1948). Growth relationships of chlorella species. Am. J. Botany 35, 118–129. doi: 10.1002/j.1537-2197.1948.tb05195.x
Xu, Y., Ibrahim, I. M., and Harvey, P. J. (2016). The influence of photoperiod and light intensity on the growth and photosynthesis of dunaliella salina (chlorophyta) ccap 19/30. Plant Physiol. Biochem. 106, 305–315. doi: 10.1016/j.plaphy.2016.05.021
Xue, S., Su, Z., and Cong, W. (2011). Growth of spirulina platensis enhanced under intermittent illumination. J. Biotechnol. 151, 271–277. doi: 10.1016/j.jbiotec.2010.12.012
Yilancioglu, K., Cokol, M., Pastirmaci, I., Erman, B., and Cetiner, S. (2014). Oxidative stress is a mediator for increased lipid accumulation in a newly isolated dunaliella salina strain. PLoS ONE 9, e91957. doi: 10.1371/journal.pone.0091957
Yuan, H., Wang, Y., Lai, Z., Zhang, X., Jiang, Z., and Zhang, X. (2021). Analyzing microalgal biofilm structures formed under different light conditions by evaluating cell-cell interactions. J. Colloid Interf. Sci. 583, 563–570. doi: 10.1016/j.jcis.2020.09.057
Zhang, J., and Perré, P. (2020). Gas production reveals the metabolism of immobilized chlorella vulgaris during different trophic modes. Bioresour. Technol. 315, 123842. doi: 10.1016/j.biortech.2020.123842
Keywords: microalgae, biofilm, light cycle, photoinhibition, architecture
Citation: Gao Y, Bernard O, Fanesi A, Perré P and Lopes F (2023) The impact of light/dark regimes on structure and physiology of Chlorella vulgaris biofilms. Front. Microbiol. 14:1250866. doi: 10.3389/fmicb.2023.1250866
Received: 30 June 2023; Accepted: 04 October 2023;
Published: 24 October 2023.
Edited by:
Allen Richard Place, University of Maryland, College Park, United StatesReviewed by:
Ian Ross, The University of Queensland, AustraliaCopyright © 2023 Gao, Bernard, Fanesi, Perré and Lopes. This is an open-access article distributed under the terms of the Creative Commons Attribution License (CC BY). The use, distribution or reproduction in other forums is permitted, provided the original author(s) and the copyright owner(s) are credited and that the original publication in this journal is cited, in accordance with accepted academic practice. No use, distribution or reproduction is permitted which does not comply with these terms.
*Correspondence: Filipa Lopes, ZmlsaXBhLmxvcGVzQGNlbnRyYWxlc3VwZWxlYy5mcg==
Disclaimer: All claims expressed in this article are solely those of the authors and do not necessarily represent those of their affiliated organizations, or those of the publisher, the editors and the reviewers. Any product that may be evaluated in this article or claim that may be made by its manufacturer is not guaranteed or endorsed by the publisher.
Research integrity at Frontiers
Learn more about the work of our research integrity team to safeguard the quality of each article we publish.