 Rebecca L. Lindsey*
 Lori M. Gladney
 Andrew D. Huang
 Taylor Griswold
 Lee S. KatzBlake A. DinsmoreMonica S. ImZuzana KucerovaPeyton A. SmithCharlotte LaneHeather A. Carleton
- Centers for Disease Control and Prevention, Division of Foodborne, Waterborne and Environmental Diseases, National Center for Emerging and Zoonotic Infectious Diseases, Atlanta, GA, United States
Identification of enteric bacteria species by whole genome sequence (WGS) analysis requires a rapid and an easily standardized approach. We leveraged the principles of average nucleotide identity using MUMmer (ANIm) software, which calculates the percent bases aligned between two bacterial genomes and their corresponding ANI values, to set threshold values for determining species consistent with the conventional identification methods of known species. The performance of species identification was evaluated using two datasets: the Reference Genome Dataset v2 (RGDv2), consisting of 43 enteric genome assemblies representing 32 species, and the Test Genome Dataset (TGDv1), comprising 454 genome assemblies which is designed to represent all species needed to query for identification, as well as rare and closely related species. The RGDv2 contains six Campylobacter spp., three Escherichia/Shigella spp., one Grimontia hollisae, six Listeria spp., one Photobacterium damselae, two Salmonella spp., and thirteen Vibrio spp., while the TGDv1 contains 454 enteric bacterial genomes representing 42 different species. The analysis showed that, when a standard minimum of 70% genome bases alignment existed, the ANI threshold values determined for these species were ≥95 for Escherichia/Shigella and Vibrio species, ≥93% for Salmonella species, and ≥92% for Campylobacter and Listeria species. Using these metrics, the RGDv2 accurately classified all validation strains in TGDv1 at the species level, which is consistent with the classification based on previous gold standard methods.
Introduction
Conventional bacterial species identification methods, such as phenotypic testing and gene-sequencing analysis, have been employed within the scientific community for years. However, with the increased use of next generation sequencing, new methods are available to analyze the entire DNA of the organisms. This allows for the simultaneous capture of a wide range of information, including whole genes, core genes, and ribosomal genes for species identification and strain typing, characterization of genes for serotype, virulence, antimicrobial resistance, kmer-typing, and much more (Jolley et al., 2012; Besser et al., 2018; Gerner-Smidt et al., 2019a, Gerner-Smidt et al., 2019b; Stevens et al., 2022). More diversity has been identified with sequencing methods than was previously known, due to the limitations of conventional identification methods that rely on shared metabolic characteristics (phenotypic tests) or gene sequencing, which typically only analyze a small fraction of the organism’s DNA. This has led to the taxonomic re-classification of entire genera (Yu et al., 2021). The increased use of next generation sequencing also enhances the speed and efficiency of bacterial identification methods, whereas conventional methods were more time-consuming and provided low resolution (Carleton and Gerner-Smidt, 2016; Besser et al., 2018; Gerner-Smidt et al., 2019a; Gerner-Smidt et al., 2019b; Stevens et al., 2022).
Historically, DNA–DNA hybridization (DDH) had been the gold standard for determining prokaryotic species for taxonomic classification (Rossello-Mora and Amann, 2001; Richter and Rossello-Mora, 2009). Rossello discussed the prokaryotic species concept in 2001, “Today, the accepted species classification can only be achieved by the recognition of genomic distances and limits between the closest classified (DNA–DNA similarity), and of those phenotypic traits that are exclusive and serve as diagnostic of the taxon (phenotypic property; Rossello-Mora and Amann, 2001).” This species concept is still applicable today; however, the genomic comparisons are now based on whole genome sequence (WGS) analysis.
In 2005, the average nucleotide identity (ANI) method was shown to be a plausible substitute for DDH since a 70% DDH threshold for species classification correlated well with a 94% ANI similarity threshold. This method, proposed by Kostantinidis et al., used pairwise alignment (BLAST) to identify the best hits of shared orthologous gene content between genomes being compared, obtaining the ANIb values (Konstantinidis and Tiedje, 2004; Goris et al., 2007; Richter and Rossello-Mora, 2009; Rodriguez-R, 2016). However, a drawback of ANIb is the need to perform gene prediction on the assembly before an ANI score can be determined.
Later methods eliminated the need for this prediction step by using local alignments of sequences of varying length and similarity. In 2007, Goris et al. expanded on the ANIb method by generating 1,020 bp fragments of the query genome and compared the ANI between the fragments and a reference genome using BLAST (Goris et al., 2007). In 2009, Richter et al. implemented an ultra-fast alignment tool, which compared the entire WGS contigs between genomes using the nucmer alignment program in MuMMer software, to calculate ANI values, referred to as ANIm (Kurtz et al., 2004). Kurtz et al. provided a dnadiff wrapper, which compares the resulting output files from the nucmer alignment program, to simplify and summarize ANIm output metrics for the differences between two genomes (Kurtz et al., 2004). Jain et al. further developed ANI methods by implementing FastANI, which is a method based on the minHash algorithm and read mapping. FastANI, similar to ANIb, aims to identify reciprocal or orthologous mappings and has an 80% identity cutoff (Ondov et al., 2016; Jain et al., 2018). FastANI has shown results that are comparable to the previous methods but has significantly improved the overall runtime to just seconds (Jain et al., 2018). GAMBIT was recently described as a kmer-based method comparable in accuracy and speed to FastANI (Lumpe et al., 2023). GAMBIT computes Jaccard distances based on a subset of the genome’s kmers and, similar to FastANI, uses raw sequencing reads (Lumpe et al., 2023).
Additional methods for species and subspecies identification have also been described. Ribosomal MLST was described by Jolley et al. (2012), but this method requires gene prediction, unlike ANIm and FastANI (Jolley et al., 2012). More recently, a new method for ribosomal MLST nucleotide identity (r-MLST-NI) has been developed for classifying Klebsiella and Raoultella species and may be useful for identifying other bacterial species (Bray et al., 2022). Public health laboratories in the United States, including our laboratory, have transitioned to WGS analysis from conventional methods for identification and surveillance of enteric pathogens. For this transition, a rapid and an easily standardized method of species identification using WGS was needed, which could be easily integrated into the PulseNet national molecular surveillance system [National Center for Emerging and Zoonotic Infectious Diseases (NCEZID), 2021] for enteric pathogens. In this study, we describe the implementation of an accurate, rapid, stand-alone, sequence-based method for the identification of Campylobacter, Escherichia/Shigella, Listeria, Salmonella, and Vibrionaceae species. This method is comparable to previous gold standard methods and utilizes the ANIm method. We compared over 450 genome assemblies to set the threshold ANIm values consistent with conventional identification methods. This method is currently employed for the precise speciation of enteric organisms from WGS using the Reference Genome Dataset version 2 (RGDv2) in BioNumerics and on the command-line, for routine identification of Campylobacter, Escherichia/Shigella, Listeria, Salmonella, and Vibrionaceae species.
Materials and methods
Genome selection for ANI detection
For this study, we selected two sets of genomes which included the Reference Genome Dataset version 2 (RGDv2, Supplementary Table 1) and the Test Genome Dataset version 1 (TGDv1, Supplementary Table 2). The strains were selected from genome assemblies available on NCBI or from the PulseNet Reference Outbreak Surveillance Team’s (PROST) enteric bacteria reference collections to represent the diversity of enteric bacteria. These well-characterized strains were previously identified by methods, such as phenotypic characterization, gene sequencing, phylogenetic analysis of the rpoB gene, and Accuprobe® (Listeria monocytogenes). All sequences met the standard PulseNet QAQC metrics, including a minimum Q score of 30, and sequencing coverages for downstream analysis: 40× for Escherichia, Vibrio, and Shigella, 30× for Salmonella and Campylobacter, and 20× for Listeria (Tolar et al., 2019).
The RGDv2 (Supplementary Table 1) included all species characterized as part of PulseNet, and the set was minimized for rapid analysis. It comprised 43 genome assemblies representing 32 enteric species, consisting of 10 assemblies representing 6 Campylobacter spp., 3 assemblies representing 3 Escherichia/Shigella spp., 11 assemblies representing 6 Listeria spp., 2 Salmonella assemblies representing 2 species, and 15 Vibrionaceae assemblies representing 11 Vibrio species, 1 Grimontia species, and 1 Photobacterium species. The RGDv2 assemblies were sequenced by Illumina, PacBio, or both instruments. The WGS reads for RGDv2 references were assembled using SPAdes for Illumina data (Bankevich et al., 2012) and HGAP (University M, 2014) for PacBio data. Escherichia and Vibrio genomes are larger and more complex due to phage regions; these assemblies were generated using both Illumina and PacBio sequencers. The NCBI BioSample data include additional information regarding sequencing chemistry and assembly methods for all strains.
The TGDv1 consists of 454 genome assemblies from 42 different enteric bacterial species (Supplementary Table 2), including the RGDv2 genome assemblies, and it is designed to represent all species necessary for querying identification, as well as rare and closely related species, to confirm the accuracy of ANIm for correct identification of species. The TGDv1 genomes were assembled using SPAdes v3.11 with default options (Bankevich et al., 2012).
Development of custom ANI scripts
We developed custom scripts to utilize the dnadiff workflow in MUMmer v3.23 (Kurtz et al., 2004), facilitating pairwise comparisons with references and generating results in a tabular format. These scripts were developed for the command line. These scripts are published on our GitHub site (NCEZID-biome, 2021). The ANIm script runs on dnadiff and parses the field “AvgIdentity” to detect the percent identity. Additionally, to measure the breadth of the alignment, the script parses the AlignedBases field. To ensure consistency, the same ANIm script runs on both the command line (ani-m.pl) and as a plugin for BioNumerics (ani-m-bionumerics.pl).
Determination of ANI metrics
The TGDv1 genomes were supplied as the reference and the query; the genomes were compared in a pairwise, all-vs-all fashion. The RGDv2 genomes, our gold standard set of references, were included in TGDv1 and the threshold analysis.
We used the ggplot2 and dplyr modules in R to analyze and generate a scatter plot of the values for ANI and percent aligned bases for all comparisons. Additionally, a violin plot was created from the ANI values for a subset of species represented in RGDv2. For the violin plot, only ANI comparisons with a minimum of 70% aligned bases were examined to ensure that percent ANI was being calculated over significant portions of the genome and to avoid spurious high percent ANI matches over repetitive regions.
Down sampling for limits of detection
The reads for representative species of RGDv2 including two Campylobacter, three Escherichia, one Listeria, two Salmonella, and three Vibrio were downsampled to various coverage levels: 0.5×, 1×, 5×, 10×, 15×, 20×, 30×, 40×, and 50×. A 1× coverage was calculated as the total assembly size of the original coverage SPAdes assembly. The desired coverage and the total number of bases in the raw reads were used to calculate a percentage of the reads needed for that coverage level. Subsequently, we used the Fasten package (lskatz, 2023) to sample enough reads to meet the expected coverage. The coverage level was verified using the read metrics script in CG-Pipeline (Kislyuk et al., 2010). These downsampled reads were used to assemble each genome as previously described in this study. Most genomes at 0.5× and 1× could not be assembled with SPAdes and could not be used as assemblies for the 0.5× and 1× coverage level analyses.
At each downsampling level of every genome, we recorded the N50, a standard assembly metric. Then, we computed the ANIm method against the reference genome for each coverage level. We noted the change in the ANI value received at the different coverage levels as compared to the 50× downsampled assembly.
Comparison of ANI methods: time trials and method compatibility
Pairwise ANI comparisons were generated using TGDv1 genomes, which were run in an all-vs-all fashion using the ANIm, FastANI, and ANIb algorithms, to evaluate the amount of time each method took from the launch of the script to report of the result. This workflow is encoded on our GitHub site (NCEZID-biome, 2021) as the launch_all_ani shell script. For each algorithm, we computed the ANI value and recorded the duration of each analysis using GNU time. Pairwise scatterplots for each pair of algorithms were plotted using ANI results, and a trend line was computed in Microsoft Excel; only algorithm pairs involving ANIm were included. Additionally, the frequency of the analysis durations for each algorithm were computed and plotted in Microsoft Excel.
Results
Determination of ANI metrics
Computing the ANI of a query genome against a reference genome yields both the ANI value and the percentage of bases aligned. The percent bases aligned metric conveys what percentage of the reference genome is shared with the query. In this study, we compared the 454 TGDv1 genome assemblies in an all-vs-all comparison using ANIm (Supplementary Table 2), which resulted in 206,116 total comparisons. We plotted the percent bases aligned against the ANI for all genera and color-coded the between-species and within-species values (Figure 1). We noted that all the within-species ANI values appeared when the percent bases aligned was above 70%, consistent with our percent bases aligned threshold for excluding spurious high ANI matches.
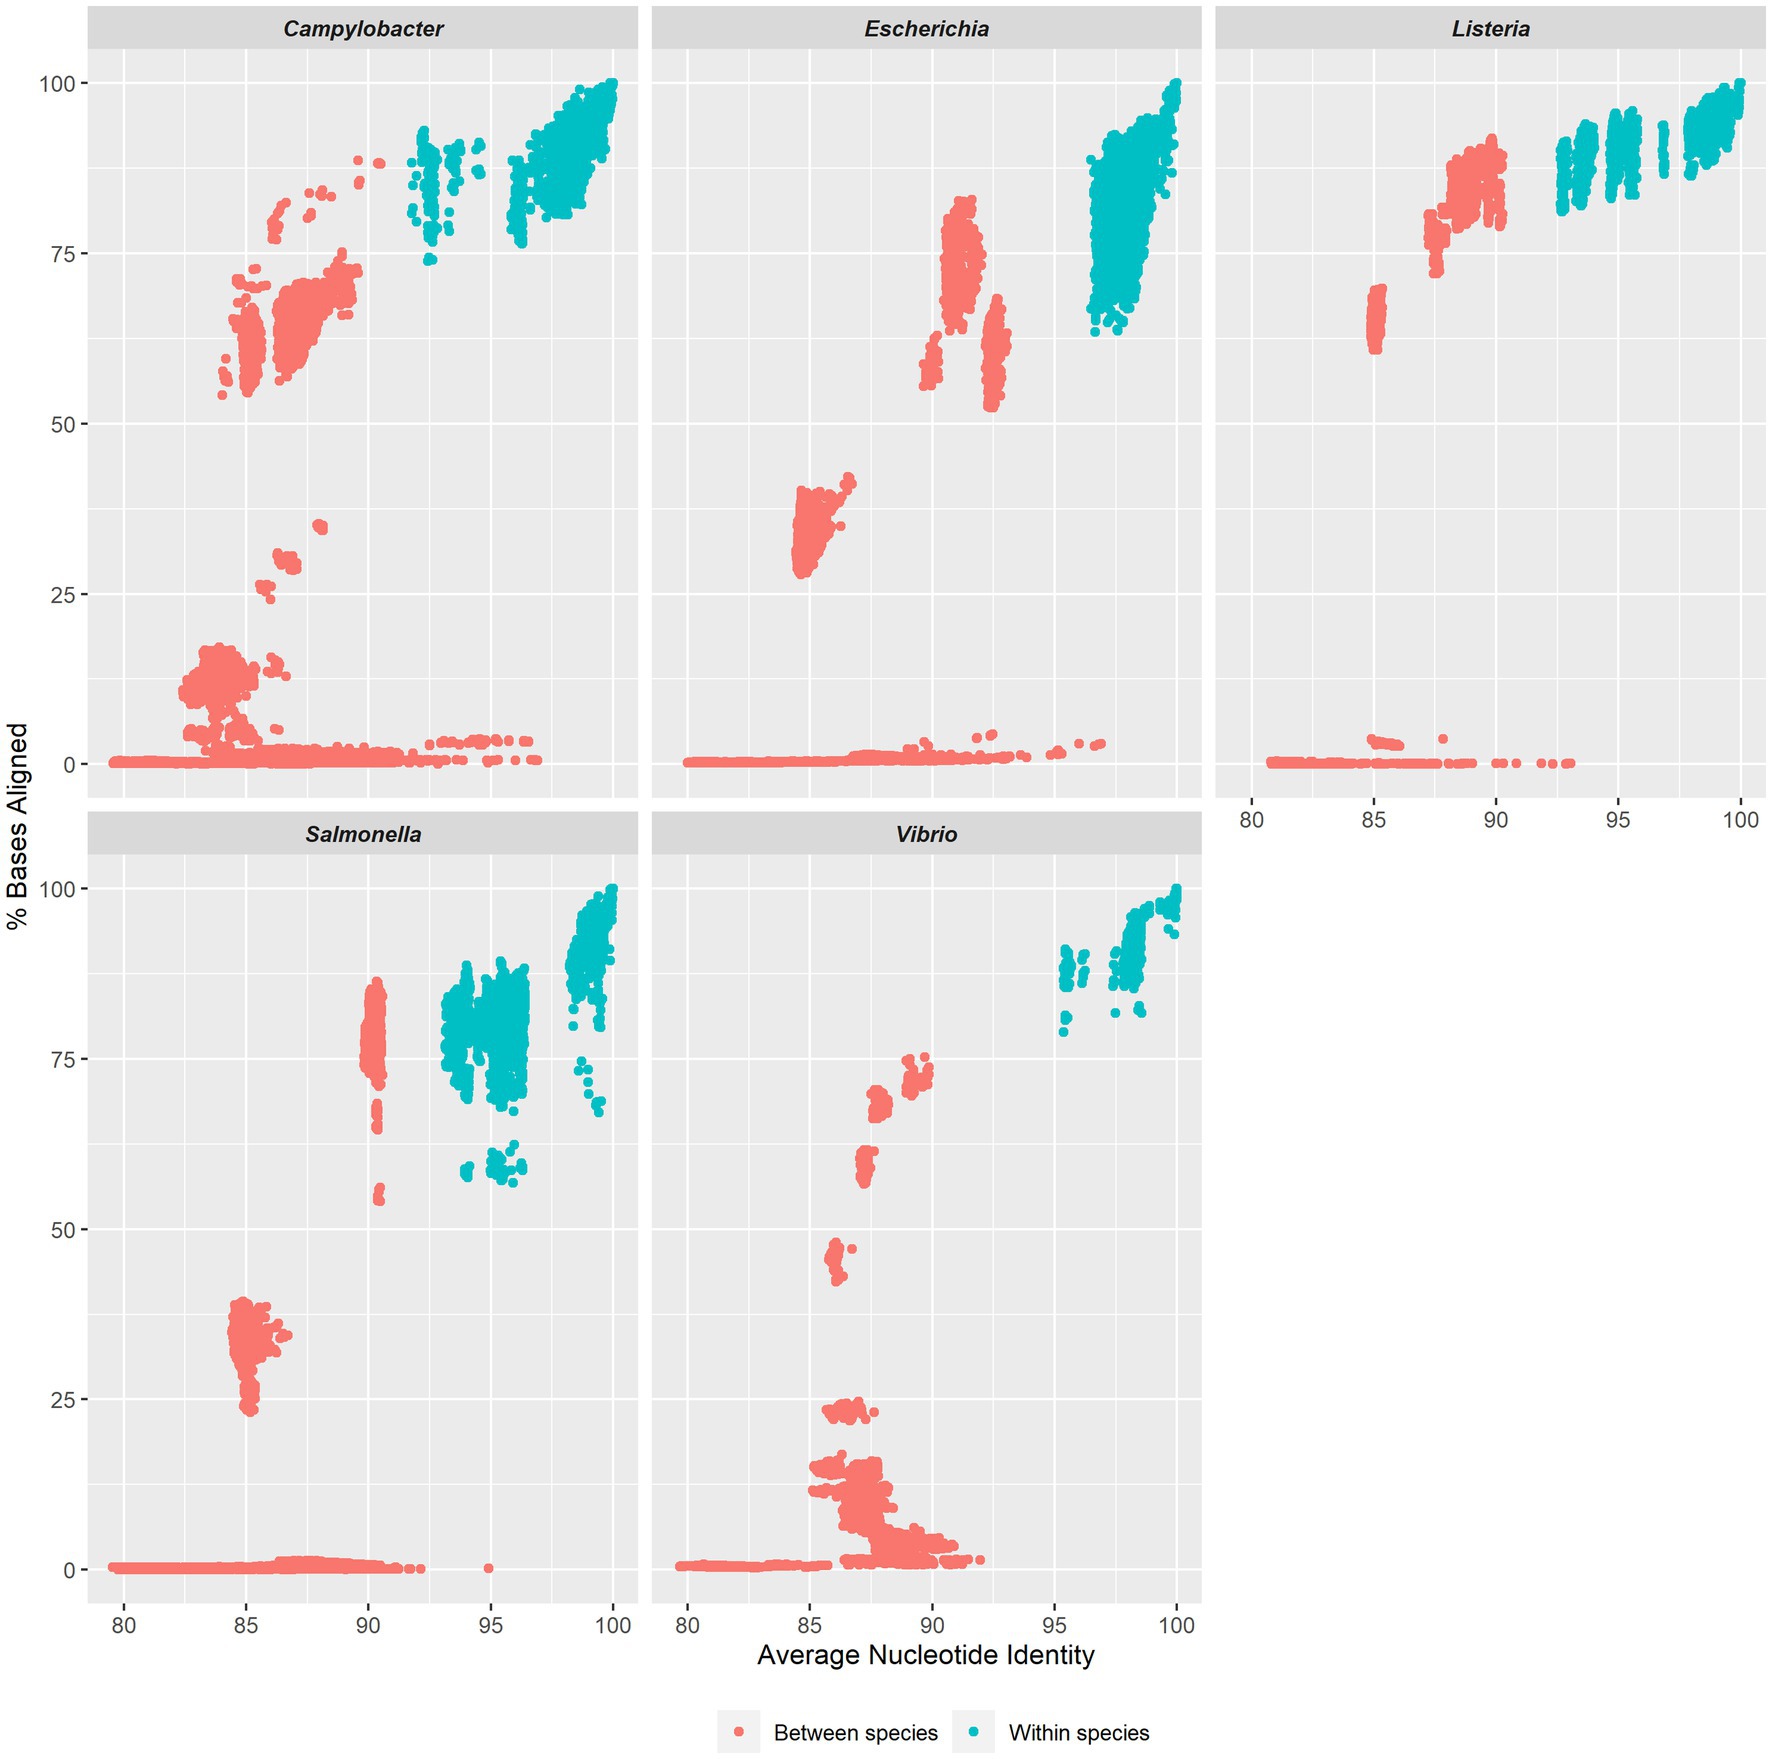
Figure 1. ANI limits for enteric detection. Scatter plots of average nucleotide identity versus percent aligned bases for four genera and one family: Campylobacter, Escherichia, Listeria, Salmonella, and Vibrionaceae. Each plot displays the relationship between ANI and percent aligned bases (e.g., reference genome alignment coverage) for both within-species and between-species in each group.
By plotting all-vs-all ANI, we observed that the ANIm method effectively distinguished within-species comparisons from between-species comparisons, enabling the determination of thresholds for relevant species (Figure 2). The ANI threshold values were ≥ 95% for Escherichia/Shigella and Vibrionaceae species, ≥93% for Salmonella species, and ≥ 92% for Campylobacter and Listeria species; the ANIm method accurately classified all validation strains in the TGDv1 at the species level, when considering comparisons across >70% of bases aligned (Table 1). In this study, we identify an ANI threshold for each genus as shown in Table 1 based on the results of the ANIm analysis. Notably, Vibrionaceae and Escherichia species have a 95% threshold, while species from Salmonella, Campylobacter, and Listeria have a lower ANI threshold for distinguishing within-species from between-species comparisons (92–93%) when a ≥70% alignment threshold is met. We used traditional taxonomic definitions of these species that rely on phenotypic tests to verify these within-species and between-species comparisons (Ciufo et al., 2018). Some of these lower ANI thresholds may be the attributed to the greater diversity that WGS-based methods can capture compared to the conventional naming of Salmonella, Campylobacter, and Listeria species.
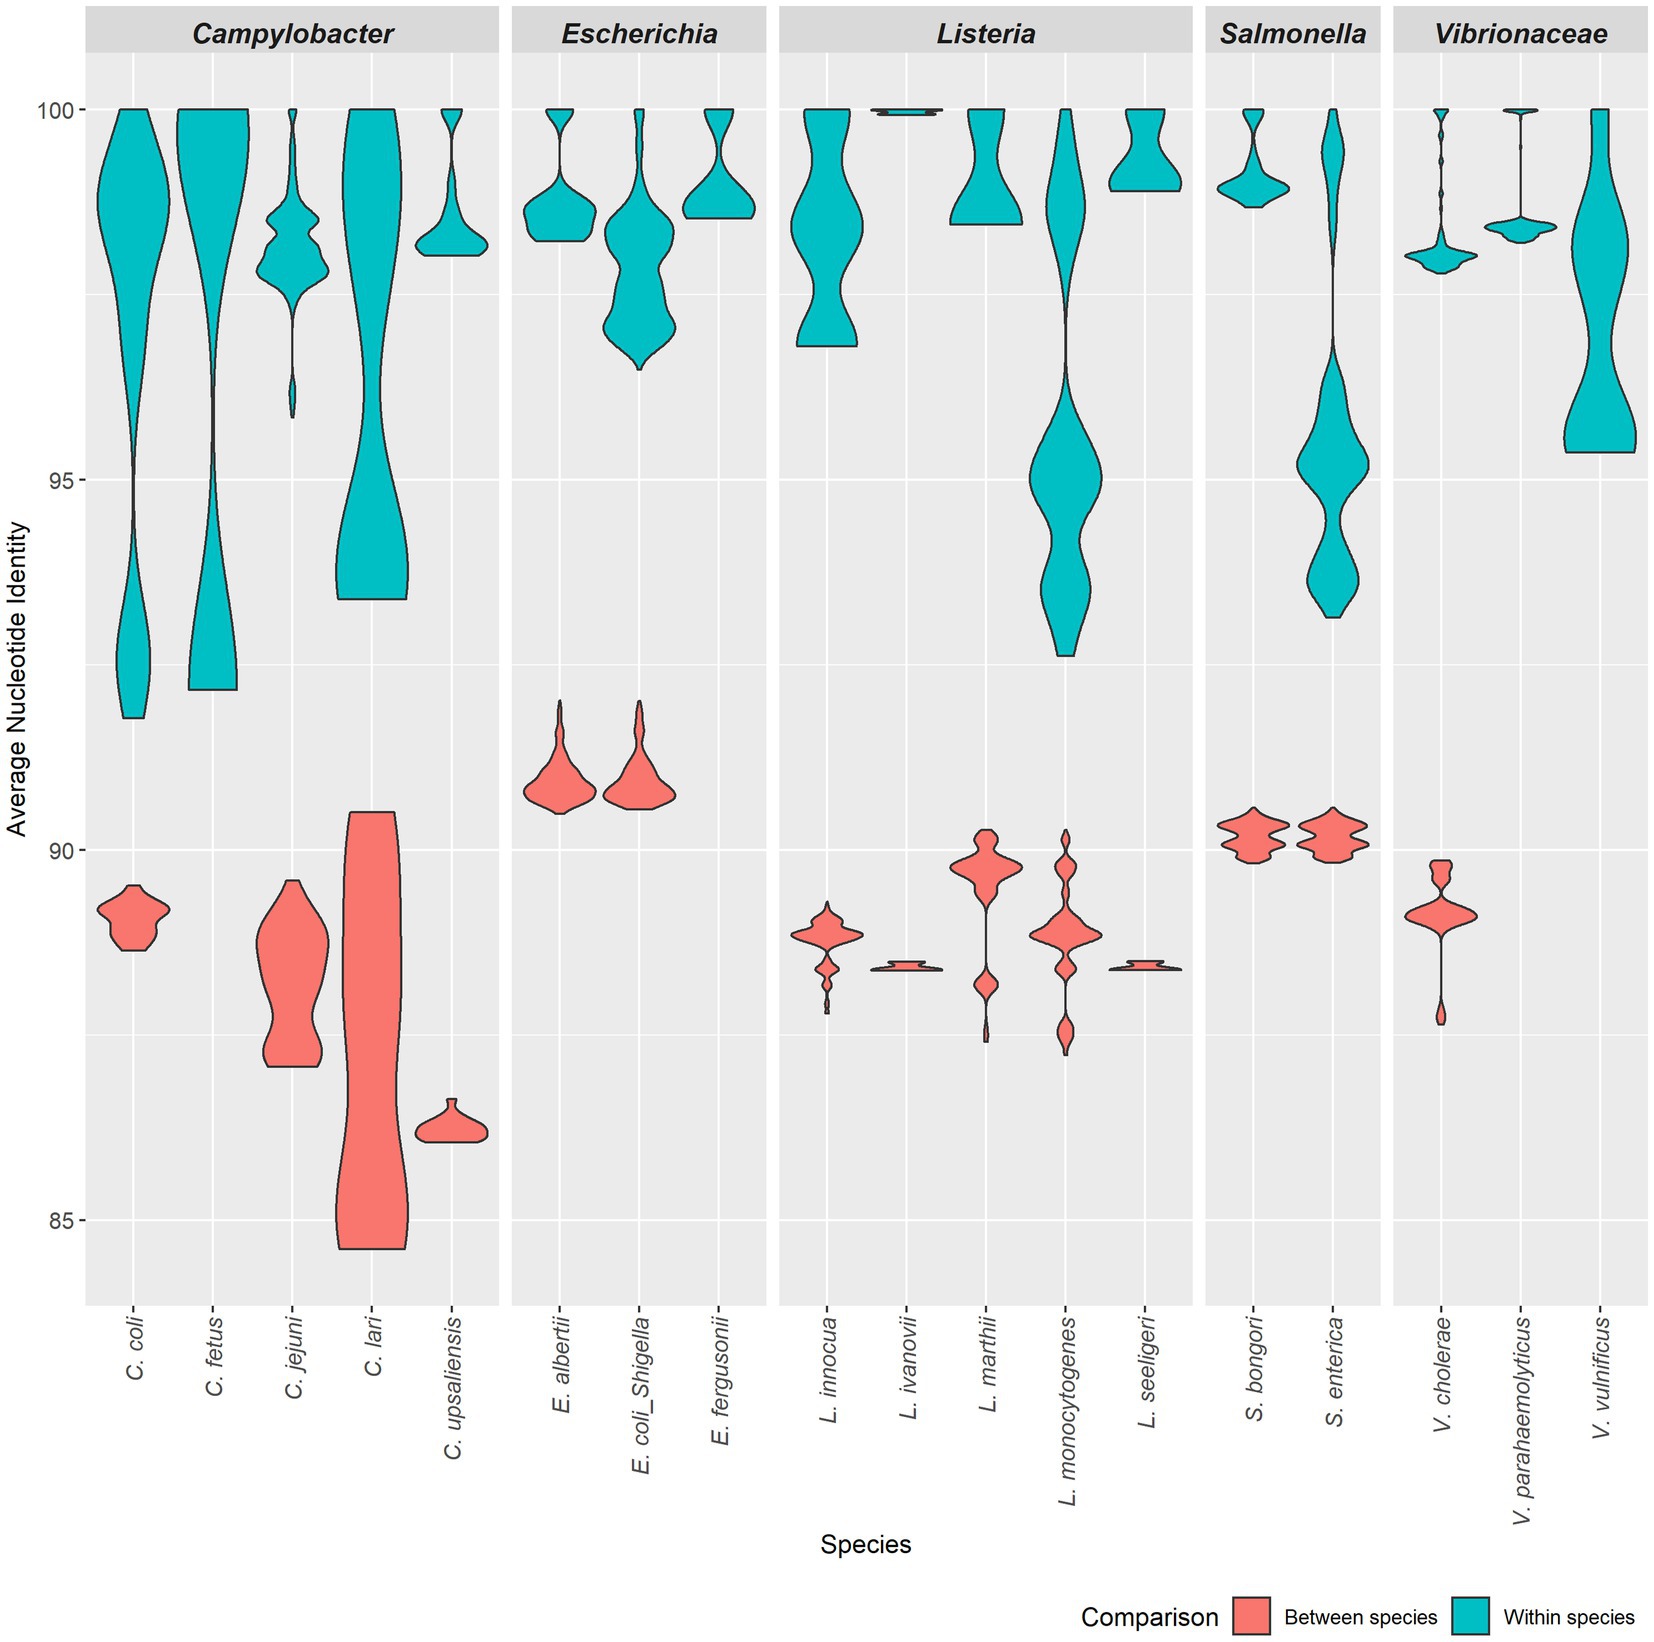
Figure 2. ANI values for five genera. Violin plots show ANI ranges for five genera: Campylobacter, Escherichia, Listeria, Salmonella and Vibrio. Each plot displays the variation in ANI values for both within a species (blue) and between a species (red) in each group.
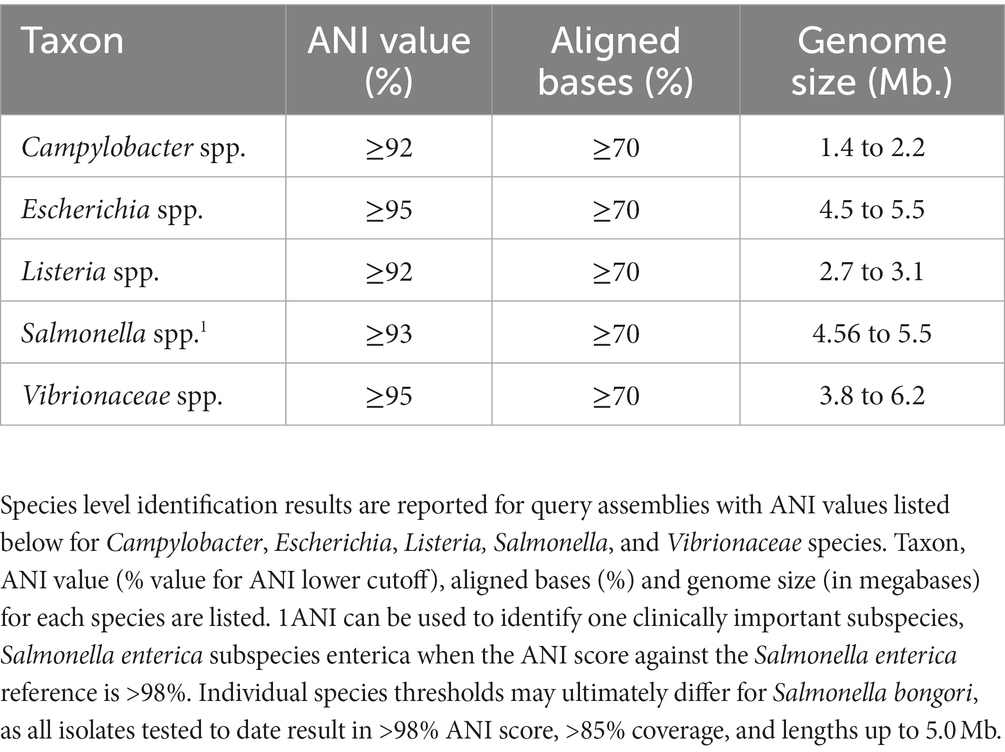
Table 1. Taxon-specific values for identification by ANI.
Down sampling for limits of detection
To determine the robustness of the ANIm method at different coverage levels, an experiment was conducted to determine the lowest depth of coverage of a genome assembly required for accurate species identification. Several assemblies from representative species were assembled from coverage depths of 50× to 0.5× to find where an ANI value starts deviating (Figure 3). After down sampling, most genomes at 0.5× and 1× could not be assembled with SPAdes. In some cases, identification was made at 5× coverage, especially for Salmonella and Listeria genomes. For all enteric species in RGDv2, we determined a minimum of 10× depth-of-coverage for genome assemblies. In the standard bioinformatic analysis for molecular surveillance within PulseNet, the sequencing depth cutoffs are 40× for Escherichia, Vibrionaceae and Shigella, 30× for Salmonella and Campylobacter, and 20× for Listeria, which makes ANIm compatible with this public health usage (Tolar et al., 2019).
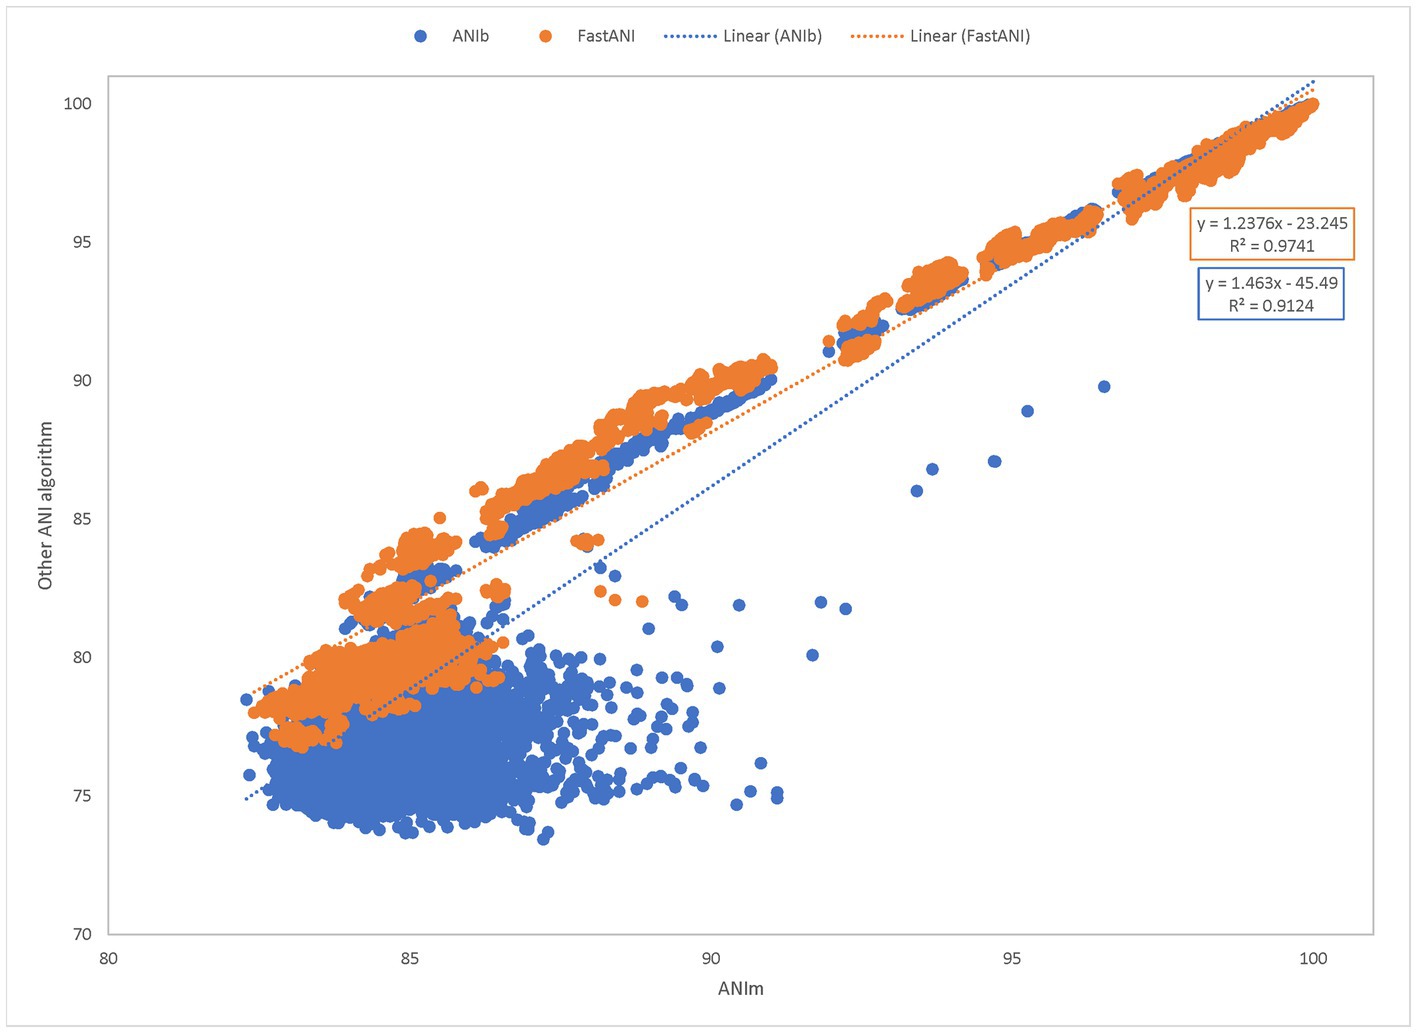
Figure 3. Downsampling for limits of detection. Representative species of Campylobacter, Escherichia, Listeria, Salmonella, and Vibrio were downsampled from 50× to 0.5× and analyzed with the ANIm algorithm. Genome coverage is plotted on the x-axis; the natural log of N50 (lnN50) is plotted on the left y-axis; and percent change from ANI at 50× is plotted on the right y-axis. The dotted blue line shows the average N50 for all the assemblies. The dark green line indicates the aggregate ANI values, or the average percentage that each ANI value deviated from what it was at 50×. Coverage cutoff of 10× was established based on this analysis, as species identification is not reliable below 10×. Additionally, the aggregate ANI begins accruing below 10×, gaining larger standard deviations.
Comparison of ANI methods: time trials and method compatibility
We compared several methods to calculate ANI: ANIb, ANIm, and FastANI. We first compared these three methods in a speed trial (Figure 4), examining the range of ANI runtimes for pairwise comparisons. An all-vs-all comparison of the TGDv1 showed that FastANI trials produced the fastest results, followed by ANIm and ANIb. Peak frequency runtimes for FastANI (approximately 0.75 and 2 s), ANIm (approximately 2 and 4 s), and ANIb (approximately 9 s) were observed; two different frequency peaks were noted for ANIm and FastANI. FastANI, while being an order of magnitude faster than ANIm, lacks an alignment report that includes the number or percentage of aligned bases, similar to ANIb. We selected ANIm as a preferred method due to speed, and it has provided the desired output of ANI score and percent genome alignment.
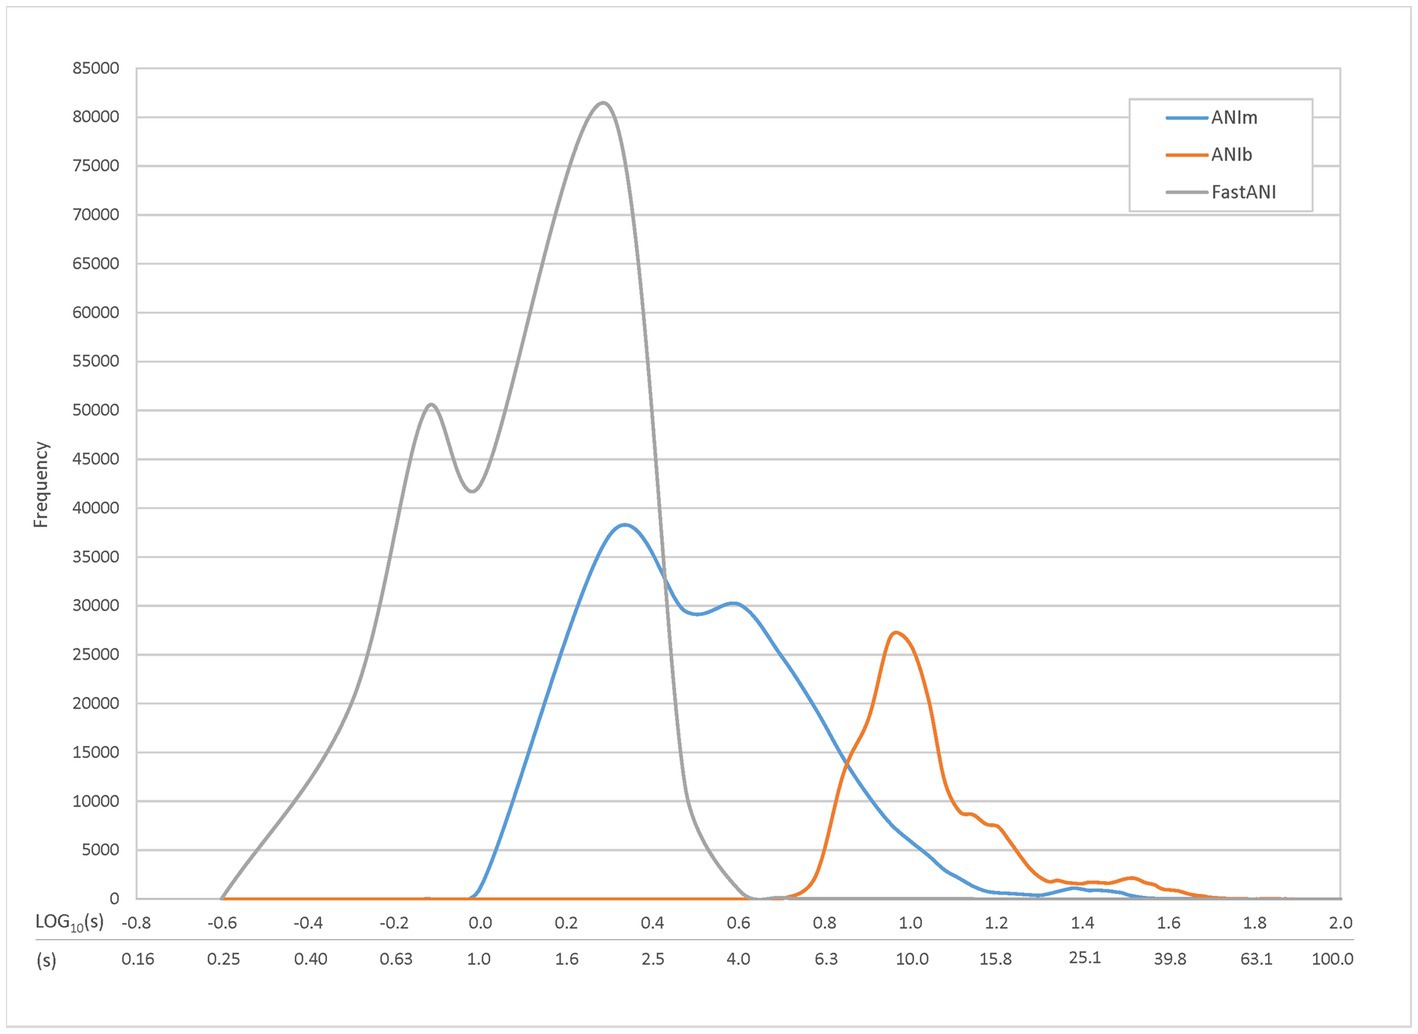
Figure 4. Individual Query Speed by ANI Method. Time trials were conducted to compare the runtime of three different ANI methods: ANIb, ANIm, and FastANI. TGDv1 genomes were compared against each other, and 206,116 total comparisons were generated along with their associated runtimes. Approximately 0.10% (ANIm) and 0.02% (ANIb) of the comparisons were excluded because they exceeded the maximum graphical runtime of 100 s; there were no comparisons excluded for FastANI. The most common runtimes were approximately 9 s for ANIb, 2 and 4 s for ANIm, and 0.75 and 2 s for FastANI; two different frequency peaks were noted for ANIm and FastANI.
Using the same results from the time trials, we next measured the similarity between the results when comparing FastANI to ANIm and ANIb to ANIm (Figure 5). We plotted the percent identity of ANIb and FastANI against ANIm to form a scatterplot. This benchmark shows a trendline with FastANI: y = 1.2376× − 23.245 (R2 = 0.9741) and ANIb: y = 1.463× − 45.49 (R2 = 0.9124). The R2 scores suggest a correlation between ANIb, ANIm, and FastANI. However, ANIb and FastANI often reported ANI scores of 0, a null value, when compared against distantly related species; instances of null ANI scores were excluded in our benchmark analysis. ANIb and FastANI do not consider low identity regions in their calculations, and ANIb and FastANI report these null ANI scores when the scores fall below 60 and 80%, respectively (Konstantinidis and Tiedje, 2005; Jain et al., 2018). Alternatively, ANIm does not have this requirement and null ANI values were never reported for ANIm.
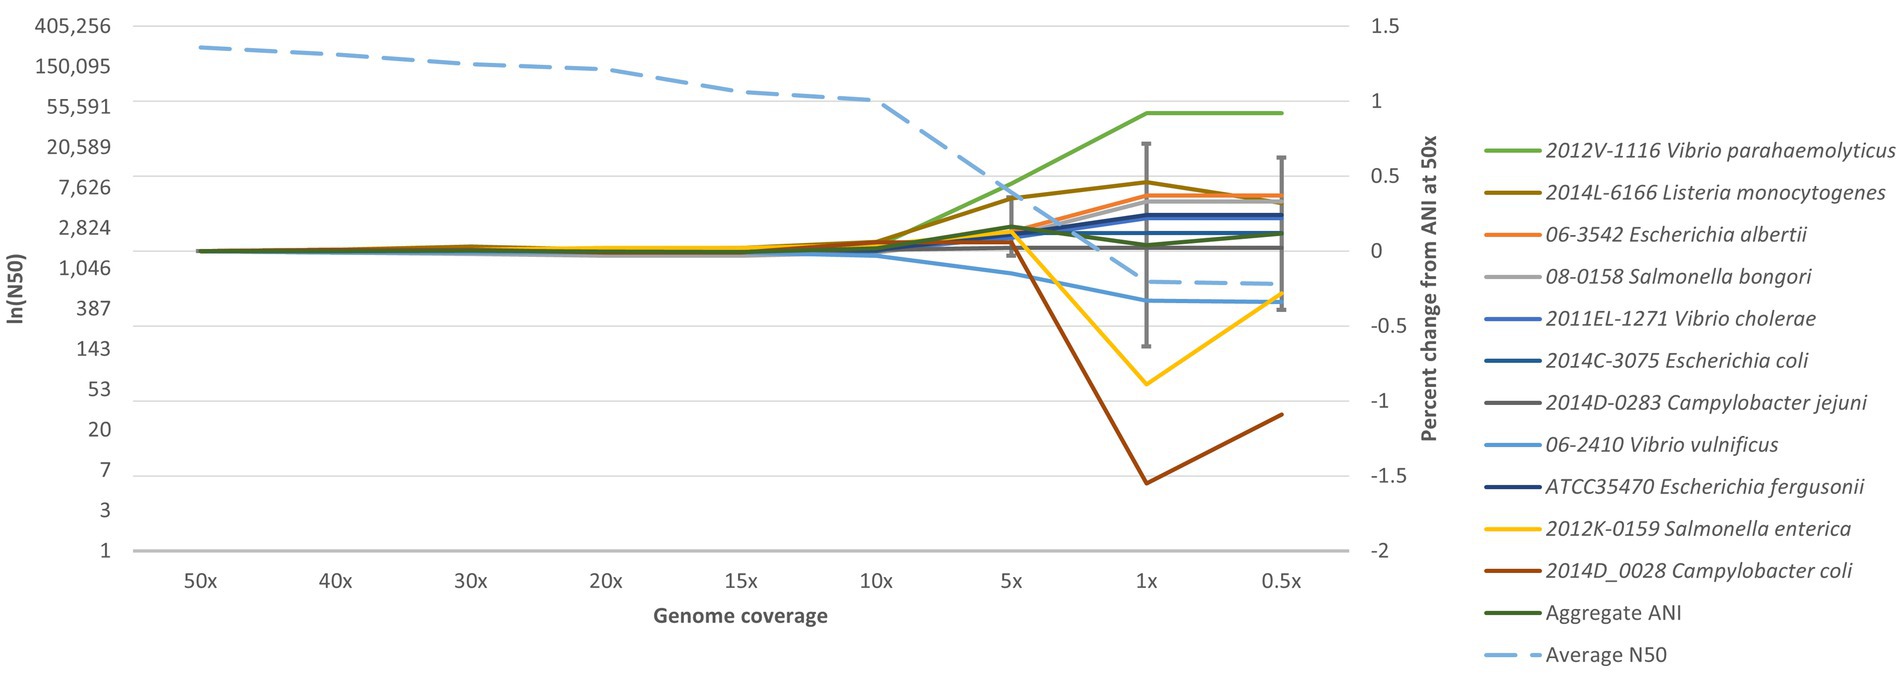
Figure 5. Pairwise comparisons of ANIb and FastANI to ANIm. ANIm is plotted on the x-axis while ANIb and FastANI are plotted on the y-axis. All data satisfied the ANIm metric of greater than 70% aligned bases. A goodness-of-fit was detected for each method. FastANI’s slope is close to one (FastANI: y = 1.2376–23.245with an R2 = 0.9741), while ANIb’s slope is also close to one (ANIb: y = 1.463× − 45.49 with an R2 = 0.9124).
When removing null percentages, ANIb scores ranged from 73.43 to 100.00 with Q1, median, and Q3 being 77.01, 79.55, and 89.00, respectively (Supplemental Table 3). Similarly, FastANI scores ranged from 76.76 to 100.00 with a median of 82.15, Q1 of 81.75, and Q3 of 95.11. Similarly, the associated ANIm scores ranged from 82.42 to 100.00 with a median of 84.98 (Q1 and Q3: 84.47 and 95.23) for the FastANI trendline and ANIm scores from 82.29 to 100.00 with a median of 85.15 (Q1 and Q3: 84.45 and 90.21) for the ANIb trendline. Inclusion of additional ANIm scores, which were associated with null percentages in either ANIb or FastANI, had an adjusted range of 78.51100.00 with a median of 83.48, Q1 of 81.53, and Q3 of 85.6 (Supplemental Table 3).
An outline of the ANIm species identification method is illustrated in Figure 6. For routine identification, ANI values are calculated for genome assemblies that meet or exceed the alignment criteria of 70% aligned bases with an RGDv2 reference(s). If the threshold meets the cutoffs per species (Table 1), then a species identification is reported.
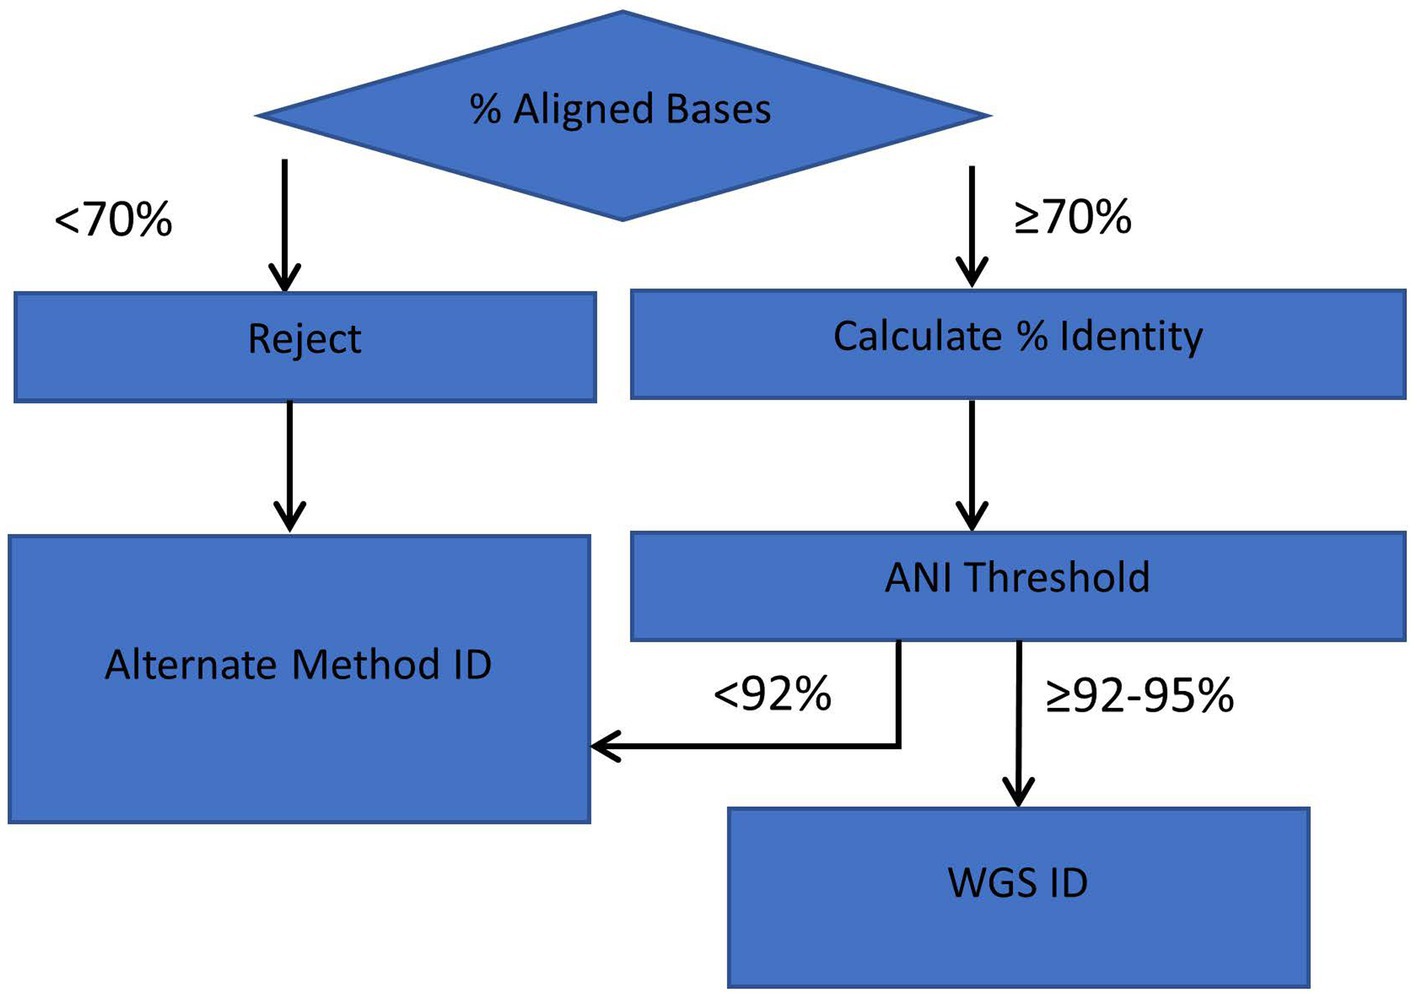
Figure 6. Workflow diagram for ANI method of identification. Genome comparisons with >70% of aligned bases and lower ANI Thresholds (≥92–95%, depending on species) are acceptable for interpretation and reporting with the ANI identification workflow.
Discussion
The ANIm method described here allows for rapid, quantitative, and accurate species identification using the WGS data from enteric bacteria. We have implemented an ANIm methodology on the UNIX command line and in BioNumerics version 7.6 for routine identification of Campylobacter, Escherichia/Shigella, Listeria, Salmonella, and Vibrionaceae species. The ANIm value and percent bases aligned describe the extent to which one genome assembly is identical to another and can be used to determine the species identity of an assembled query genome by comparing it to a database of reference genomes with historically described taxonomy. To generate this reference genome database for ANIm species identification, we assembled the RGDv2, which contains 43 high-quality representative genomes for relevant PulseNet species, whose species identity had been established with previous gold standard methods (Supplementary Table 1). Any genome assembly can be compared against the reference genomes found in the RGDv2 for species identification. This smaller representative set of reference genomes was chosen to make this identification faster. To expand ANI speciation to other species, a representative genome or genomes of the species of interest, after validation, can be added to the RGDv2 (Supplementary Table 1).
We determined the thresholds for species identification with ANIm by comparing the enteric bacterial genomes from TGDv1, which comprised 454 genomes, including the RGDv2 genomes, whose species identity had also been previously established using gold standard methods. The analysis showed that ANI threshold values of ≥95% for Escherichia/Shigella and Vibrionaceae species, ≥93% for Salmonella species, and ≥ 92% for Campylobacter and Listeria species classified all validation strains in TGDv1 accurately at the species level, when considering comparisons across >70% of bases aligned. The ANIm thresholds reported in this study are similar to the previously published species boundaries for ANIb (94%), ANIm (95–96%), and FastANI (95%; Konstantinidis and Tiedje, 2005; Richter and Rossello-Mora, 2009; Jain et al., 2018). The lower ANI boundaries (92–93%) observed in this study for Salmonella, Campylobacter, and Listeria may be due to a wider degree of diversity within the species of those genera. As new species may be identified for these genera, we will re-evaluate our ANI thresholds. Moreover, we performed downsampling experiments to examine how genome coverage levels affect the ability of the ANIm tool to provide a result consistent with gold standard methods, and we found that reliable speciation using ANIm can be achieved with genomes assembled from ≥ sequencing read coverage of 10× or greater.
We compared three different methods for computing ANI: ANI using BLAST (ANIb), ANI using MuMMer (ANIm), and FastANI. We focused our comparison on these ANI methods and evaluated them for speed, accuracy, and easy interpretation. While all three of the ANI methods tested were comparable in speed and accuracy, ANIm was the easiest to standardize and interpret using the ANI and percent bases aligned metrics provided by the dnadiff wrapper script. We compared ANIm to ANIb and FastANI by correlating the ANI values from pairwise comparisons across the TGDv1 genome set. All three methods produced comparable ANI results with correlation coefficients of 1.24 and 1.46 and high R2 scores (>0.9), for both the correlation of FastANI to ANIm and ANIb to ANIm. Additionally, we evaluated the differences in speed of the three distinct tools. All three of the ANI methods had median run times of less than 10 s for a pairwise comparison. To the best of our knowledge, this is the first comparison of the runtime for ANIm and FastANI. FastANI analyses were generally completed faster than ANIm and ANIb, and ANIm was somewhere in the middle from job submission to result. However, overlap was observed in runtimes among all three tools. As all tools demonstrate efficient performance within the range of 10 s or less, the variations in runtimes are likely not significant until a large number of comparisons are being analyzed. While other methods, such as ribosomal MLST, ribosomal MLST nucleotide identity (r-MLST-NI), and k-mer based methods like GAMBIT, hold promise for bacterial species identification, it is important that these methods were not evaluated in this study.
In this study, we have implemented ANI for enteric species identification using MUMmer (ANIm) and demonstrated the utility of ANI for species identification. Furthermore, we simplified ANI-based enteric species identification using a new standard database, RGDv2, built from reference genomes identified with previous gold standard methods and demonstrated its robustness. We also showed that only 10× sequencing coverage is needed to reliably detect species using RDGv2. This low coverage requirement and the speed of the ANIm analysis are advantageous when turnaround time is crucial, as is common in public health settings. For further variant analysis, we have higher coverage requirements in PulseNet. An opportunity for future development may include evaluating the robustness of ANI with additional genome assembly methods compatible with both short-and long-read sequencing methods. The approach here is also generalizable for any situation, where a set of organisms need to be rapidly identified for species by adding and validating reference species genomes to an ANIm database.
Data availability statement
The datasets presented in this study can be found in online repositories. The names of the repository/repositories and accession number(s) can be found in the article/Supplementary material.
Author contributions
LG, TG, AH, LK, and RL: conceptualization, validation, visualization, and writing—review and editing. LG, AH, and LK: software. TG: data curation. LG, AH, LK, and TG: formal analysis. CL, PS, MI, BD, and ZK: investigation. RL: project administration and writing original draft. HC: final review.
Funding
The author(s) declare financial support was received for the research, authorship, and/or publication of this article. This work was made possible through support from the Advanced Molecular Detection (AMD) Initiative grant number AMD-21 at the Centers for Disease Control and Prevention. Apart from the funding, the Office of AMD did not have any further involvement in the study. This project was supported, in part, by an appointment to the Research Participation Program at the Centers for Disease Control and Prevention administered by the Oak Ridge Institute for Science and Education through an interagency agreement between the U.S. Department of Energy and the Centers for Disease Control and Prevention.
Acknowledgments
The authors wish to thank Cheryl Tarr for the original idea of utilizing ANI metrics for species identification.
Conflict of interest
The authors declare that the research was conducted in the absence of any commercial or financial relationships that could be construed as a potential conflict of interest.
Publisher’s note
All claims expressed in this article are solely those of the authors and do not necessarily represent those of their affiliated organizations, or those of the publisher, the editors and the reviewers. Any product that may be evaluated in this article, or claim that may be made by its manufacturer, is not guaranteed or endorsed by the publisher.
Supplementary material
The Supplementary material for this article can be found online at: https://www.frontiersin.org/articles/10.3389/fmicb.2023.1225207/full#supplementary-material
References
Bankevich, A., Nurk, S., Antipov, D., Gurevich, A. A., Dvorkin, M., Kulikov, A. S., et al. (2012). SPAdes: a new genome assembly algorithm and its applications to single-cell sequencing. J. Comput. Biol. 19, 455–477. doi: 10.1089/cmb.2012.0021
Besser, J., Carleton, H. A., Gerner-Smidt, P., Lindsey, R. L., and Trees, E. (2018). Next-generation sequencing technologies and their application to the study and control of bacterial infections. Clin. Microbiol. Infect. 24, 335–341. doi: 10.1016/j.cmi.2017.10.013
Bray, J. E., Correia, A., Varga, M., Jolley, K. A., Maiden, M. C. J., and Rodrigues, C. M. C. (2022). Ribosomal MLST nucleotide identity (rMLST-NI), a rapid bacterial species identification method: application to Klebsiella and Raoultella genomic species validation. Microb. Genom. 8, 1–14. doi: 10.1099/mgen.0.000849
Carleton, HA, and Gerner-Smidt, P. (2016). Public health microbiology is undergoing its biggest change in a generation, replacing traditional methods with whole-genome sequencing. Microbe Magazine. 311–317.
Ciufo, S., Kannan, S., Sharma, S., Badretdin, A., Clark, K., Turner, S., et al. (2018). Using average nucleotide identity to improve taxonomic assignments in prokaryotic genomes at the NCBI. Int. J. Syst. Evol. Microbiol. 68, 2386–2392. doi: 10.1099/ijsem.0.002809
Gerner-Smidt, P., Besser, J., Concepcion-Acevedo, J., Folster, J. P., Huffman, J., Joseph, L. A., et al. (2019a). Whole genome sequencing: bridging one-health surveillance of foodborne diseases. Front. Public Health 7:172. doi: 10.3389/fpubh.2019.00172
Gerner-Smidt, P., Besser, J., Concepcion-Acevedo, J., Folster, J. P., Huffman, J., Joseph, L. A., et al. (2019b). Corrigendum: whole genome sequencing: bridging one-health surveillance of foodborne diseases. Front. Public Health 7:365. doi: 10.3389/fpubh.2019.00365
Goris, J., Konstantinidis, K. T., Klappenbach, J. A., Coenye, T., Vandamme, P., and Tiedje, J. M. (2007). DNA-DNA hybridization values and their relationship to whole-genome sequence similarities. Int. J. Syst. Evol. Microbiol. 57, 81–91. doi: 10.1099/ijs.0.64483-0
Jain, C., Rodriguez, R. L., Phillippy, A. M., Konstantinidis, K. T., and Aluru, S. (2018). High throughput ANI analysis of 90K prokaryotic genomes reveals clear species boundaries. Nat. Commun. 9:5114. doi: 10.1038/s41467-018-07641-9
Jolley, K. A., Bliss, C. M., Bennett, J. S., Bratcher, H. B., Brehony, C., Colles, F. M., et al. (2012). Ribosomal multilocus sequence typing: universal characterization of bacteria from domain to strain. Microbiology 158, 1005–1015. doi: 10.1099/mic.0.055459-0
Kislyuk, A. O., Katz, L. S., Agrawal, S., Hagen, M. S., Conley, A. B., Jayaraman, P., et al. (2010). A computational genomics pipeline for prokaryotic sequencing projects. Bioinformatics 26, 1819–1826. doi: 10.1093/bioinformatics/btq284
Konstantinidis, K. T., and Tiedje, J. M. (2004). Trends between gene content and genome size in prokaryotic species with larger genomes. Proc. Natl. Acad. Sci. U. S. A. 101, 3160–3165. doi: 10.1073/pnas.0308653100
Konstantinidis, K. T., and Tiedje, J. M. (2005). Genomic insights that advance the species definition for prokaryotes. Proc. Natl. Acad. Sci. U. S. A. 102, 2567–2572. doi: 10.1073/pnas.0409727102
Kurtz, S., Phillippy, A., Delcher, A. L., Smoot, M., Shumway, M., Antonescu, C., et al. (2004). Versatile and open software for comparing large genomes. Genome Biol. 5:R12. doi: 10.1186/gb-2004-5-2-r12
lskatz (2023). fasten. Available at: https://github.com/lskatz/fasten (Accessed May 18, 2023).
Lumpe, J., Gumbleton, L., Gorzalski, A., Libuit, K., Varghese, V., Lloyd, T., et al. (2023). GAMBIT (genomic approximation method for bacterial identification and tracking): a methodology to rapidly leverage whole genome sequencing of bacterial isolates for clinical identification. PLoS One 18:e0277575. doi: 10.1371/journal.pone.0277575
National Center for Emerging and Zoonotic Infectious Diseases (NCEZID) (2021). DoF, waterborne, and environmental diseases (DFWED). Pulse Net. Available at: https://www.cdc.gov/pulsenet/ (Accessed May 18, 2023).
NCEZID-biome (2021). ANI-paper. Available at: https://github.com/ncezid-biome/ANI-paper (Accessed May 18, 2023).
Ondov, B. D., Treangen, T. J., Melsted, P., Mallonee, A. B., Bergman, N. H., Koren, S., et al. (2016). Mash: fast genome and metagenome distance estimation using min hash. Genome Biol. 17:132. doi: 10.1186/s13059-016-0997-x
Richter, M., and Rossello-Mora, R. (2009). Shifting the genomic gold standard for the prokaryotic species definition. Proc. Natl. Acad. Sci. U. S. A. 106, 19126–19131. doi: 10.1073/pnas.0906412106
Rodriguez-R, L. M. K. K. (2016). The enveomics collection: a toolbox for specialized analyses of microbial genomes and metagenomes. PeerJ 4:e1900v1. doi: 10.7287/peerj.preprints.1900v1
Rossello-Mora, R., and Amann, R. (2001). The species concept for prokaryotes. FEMS Microbiol. Rev. 25, 39–67. doi: 10.1016/S0168-6445(00)00040-1
Stevens, E. L., Carleton, H. A., Beal, J., Tillman, G. E., Lindsey, R. L., Lauer, A. C., et al. (2022). Use of whole genome sequencing by the Federal Interagency Collaboration for genomics for food and feed safety in the United States. J. Food Prot. 85, 755–772. doi: 10.4315/JFP-21-437
Tolar, B., Joseph, L. A., Schroeder, M. N., Stroika, S., Ribot, E. M., Hise, K. B., et al. (2019). An overview of pulse net USA databases. Foodborne Pathog. Dis. 16, 457–462. doi: 10.1089/fpd.2019.2637
University M (2014). Pac Bio HGAP genome assembly pipeline. Available at: https://jtremblay.github.io/pipelines/2014/05/05/Pac Bio-HGAP3-pipeline. (Accessed May 18, 2023).
Keywords: average nucleotide identity, ANI, species identification, enteric bacteria, WGS
Citation: Lindsey RL, Gladney LM, Huang AD, Griswold T, Katz LS, Dinsmore BA, Im MS, Kucerova Z, Smith PA, Lane C and Carleton HA (2023) Rapid identification of enteric bacteria from whole genome sequences using average nucleotide identity metrics. Front. Microbiol. 14:1225207. doi: 10.3389/fmicb.2023.1225207
Edited by:
Richard Allen White III, University of North Carolina at Charlotte, United StatesReviewed by:
John Phillip Bowman, University of Tasmania, AustraliaChristopher John Grim, United States Food and Drug Administration, United States
Copyright © 2023 Lindsey, Gladney, Huang, Griswold, Katz, Dinsmore, Im, Kucerova, Smith, Lane and Carleton. This is an open-access article distributed under the terms of the Creative Commons Attribution License (CC BY). The use, distribution or reproduction in other forums is permitted, provided the original author(s) and the copyright owner(s) are credited and that the original publication in this journal is cited, in accordance with accepted academic practice. No use, distribution or reproduction is permitted which does not comply with these terms.
*Correspondence: Rebecca L. Lindsey, cmxpbmRzZXkxQGNkYy5nb3Y=