 Feng Liu
 Xin Sun
 Lulu Wang1
 Quansheng Yao
- 1Key Laboratory of Hainan Province for Postharvest Physiology and Technology of Tropical Horticultural Products, Key Laboratory of Tropical Fruit Biology, Ministry of Agriculture, South Subtropical Crops Research Institute, Chinese Academy of Tropical Agricultural Sciences, Zhanjiang, Guangdong, China
- 2College of Horticulture, Hainan University, Haikou, China
Mango is an important tropical fruit with the reputation of “Tropical Fruit King.” It is widely cultivated in tropical and subtropical regions. Mango bacterial leaf spot, which is caused by Xanthomonas critis pv. mangiferaeindicae (Xcm), poses a great threat to the development of mango planting industry. In this study, we used RNA sequencing and data-independent acquisition techniques to compare the transcriptome and proteome of the highly resistant cultivar “Renong No.1” (RN) and the highly susceptible cultivar “Keitt” (KT) in response to Xcm infection at different stages (0, 2, and 6 days). A total of 14,397 differentially expressed genes (DEGs) were identified in the transcriptome of the two varieties, and 4,400 and 8,926 genes were differentially expressed in RN and KT, respectively. Among them, 217 DEGs were related to plant hormone signaling pathway, and 202 were involved in the maintenance of cellular redox homeostasis. A total of 3,438 differentially expressed proteins (DEPs) were identified in the proteome of the two varieties. Exactly 1,542 and 1,700 DEPs were detected in RN and KT, respectively. In addition, 39 DEPs were related to plant hormone signaling pathway, whereas 68 were involved in the maintenance of cellular redox homeostasis. Through cross-validation of the two omics, 1,470 genes were found to be expressed in both groups, and a large number of glutathione metabolism-related genes, such as HSP26-A, G6PD4, and GPX2, were up-regulated in both omics. Peroxisome-related genes, such as LACS6, LACS9, PED1, GLO4, and HACL, were up-regulated or down-regulated in both omics. ABCB11, SAPK2, MYC2, TAG7, PYL1, and other genes related to indole-3-acetic acid and abscisic acid signal transduction and plant-pathogen interaction were up-regulated or down-regulated in both omics. We also used weighted gene co-expression network analysis to combine physiological and biochemical data (superoxide dismutase and catalase activity changes) with transcriptome and proteome data and finally identified three hub genes/proteins (SAG113, SRK2A, and ABCB1) that play an important role in plant hormone signal transduction. This work was the first study of gene/protein changes in resistant and susceptible mango varieties, and its results improved our understanding of the molecular mechanism of mango resistance to Xcm.
Introduction
Mango (Mangifera indica L.) is a kind of evergreen tree, originated in Malaysia, India. It has a long history of planting in China and is an important agricultural industry in tropical regions. Its fruit is not only rich in nutrients such as vitamin A, vitamin C and amino acids, but also its branches, leaves and peels contain a large number of bioactive substances, such as polyphenols, terpenes, carotene and phytosterols, which have certain edible value and medical value (Lebaka et al., 2021). Studies have shown that these active substances in mango have anti-inflammatory, immunomodulatory, antibacterial, anti-diabetic, anti-obesity and anti-cancer effects in medicine (Mirza et al., 2021).
Mango bacterial leaf spot (MBLS), which is caused by Xanthomonas critis pv. mangiferaeindicae (Xcm), can cause serious damage to fruit health, which results in reduced or zero mango yield. At present, disease-resistance breeding is the most economical and effective control method for disease resistance (Zandalinas et al., 2021). Therefore, studying the changes in gene and protein expression in mango during Xcm infection can not only lead to complete understanding of the molecular mechanism of mango resistance to MBLS but also provide valuable genetic resources for the breeding of disease-resistant mango varieties.
Plant hormones, such as ethylene (ETH), jasmonic acid (JA), salicylic acid, auxin, indole-3-acetic acid (IAA), abscisic acid (ABA), and gibberellin (GA), are key regulators of plant immunity (Li et al., 2019). They interact in complex networks to respond to pathogen invasion and thus exhibit resistance to pathogens (Denancé et al., 2013). Anderson et al. (2004) observed that the transcription level of AtMYC2, a positive regulator of ABA signal transduction in Arabidopsis thaliana, was induced in the early stage of soil-borne pathogenic fungus Fusarium oxysporum infection by reverse transcription-quantitative polymerase chain reaction (PCR). Further overexpression of AtMYC2 showed that the levels of ETH and JA were significantly lower than those in the control group, which indicates the antagonistic effect of ABA on JA and ETH. Their interaction regulated the expression of Arabidopsis defense and stress genes in response to biological stress. Li et al. (2013) used Illumina technology to analyze the transcriptome changes of roots of Cavendish banana varieties infected with Fusarium oxysporum f. sp. Cubense (Foc). The two genes encoding ETH biosynthesis enzyme aminocyclopropanecarboxylate oxidase and several ETH-responsive transcription factors were one of the strongly induced genes of Foc, which indicates that ETH synthesis and signaling pathways were activated in response to Foc infection. Djami-Tchatchou et al. (2022) conducted a global transcriptomic analysis of tomato strain DC3000 (PtoDC3000) and observed that IAA inhibited the expression of genes involved in the type III secretion system and exercise; thus, IAA is a signal molecule for gene expression in PtoDC3000.
Under pathogen attack, reactive oxygen species (ROS) will accumulate in plants, and excessive accumulation will cause serious damage to plant proteins, DNA, and other cellular components, thus promoting the invasion of pathogens (Sies, 2018). At this point, the enzymatic systems, including catalase (CAT), superoxide dismutase (SOD), glutathione peroxidase (GPX), and glutathione S-transferase (GST), and non-enzymatic system, such as ascorbic acid, glutathione (GSH), mannitol, and flavonoids, play important roles in plants (Bela et al., 2015; Meitha et al., 2020). Xue et al. (2020) discovered that after phytoplasma caused red date witch broom disease, the genes involved in GSH cycle and thioredoxin synthesis in jujube leaves were up-regulated at the transcriptional and metabolic levels. The activities of GST and GPX in disease-resistant varieties were higher than those in susceptible varieties, which indicates that the antioxidant defense system plays an important role in plant pathogen invasion. Akbar et al. (2020) reported differences in the transcription levels of ROS-related genes between the disease-resistant sugarcane variety (B-48) infected with Sugarcane mosaic virus and the susceptible sugarcane variety (Badila). Compared with Badila, the expression of GST was significantly reduced, whereas those of transcription factors, such as WRKY, AP2, and bHLH, were significantly increased in B-48. Therefore, the genes involved in the ROS detoxification pathway can be used as key indicators for pathogen attack in plants.
Next-generation RNA sequencing (RNA-Seq) and data-independent acquisition (DIA) are currently the most advanced high-throughput technologies, and they can perform global analysis of gene and protein expressions in a large number of biological samples. Joint analysis of transcriptome and proteome is widely used to address plant responses to various biotic stresses. Cucumber fusarium wilt caused by Fusarium oxysporum f. sp. cucumerinum (FOC) is one of the most important diseases in cucumber cultivation. In the exploration of the molecular mechanism of cucumber response to FOC infection, combined transcriptome and proteome analyses of cucumber leaves inoculated with FOC at 2 and 4 days showed that FOC infection activated plant hormone signals and transcription factors and inhibited wax biosynthesis and photosynthesis. The accumulation of redox proteins also plays a key role in cucumber resistance to FOC (Xie et al., 2022). Kiwifruit is an important tropical fruit in China. Kiwifruit bacterial canker caused by Pseudomonas syringae pv. Actinidiae (Psa) is an important disease in the kiwifruit seed industry. The transcriptome and proteome analyses of the resistant variety “Jinkui” and the susceptible variety “Hongtao” showed that the pathways of “phytohormone signal transduction” and “phenylpropanol biosynthesis” were activated at the protein and transcriptional levels after Psa infection. The transient expression of AcMYB16 gene in “Jinkui” induced Psa infection (Wang et al., 2021). However, reports on the response of mango to Xcm are limited.
At present, the research on MBLS mainly focuses on the comprehensive treatment of MBLS and the isolation and identification of MBLS pathogens (Gagnevin and Pruvost, 2001; Sanahuja et al., 2016). The research on the molecular mechanism of mango resistance to MBLS is still in its infancy. This work is the first to study the changes in gene and protein expressions in mango during Xcm infection. Our findings will provide new ideas for MBLS resistance and valuable genetic resources for the breeding of MBLS-resistant mango.
Methods
Preparation of bacterial solution
Single colonies of activated Xcm cultured for 48 h were picked into LB and incubated at 200 rmp at 28°C for 2 days before inoculation. The concentration of pathogen was about 1 × 10⁹ CFU/mL determined by plate colony counting method.
Treatment of plant material
The resistant and susceptible mango varieties “Renong No.1” (RN) and “Keitt” (KT) were used as plant materials. Xcm was identified by pathogenicity determination, morphology, and 16S ribosomal RNA (16S) from the susceptible leaves of KT mango in the mango germplasm resource nursery of the South Subtropical Crops Institute of the Chinese Academy of Tropical Agricultural Sciences. We selected healthy fruits with the same size and maturity, soaked them in 1% sodium hypochlorite for 2 min for disinfection, washed them thrice with sterile water, and then placed them in an alcohol-disinfected plastic box to dry naturally. Plum blossom needles were used for acupuncture inoculation, and 60 μL mixed bacterial solution was added at each inoculation point. The inoculated fruits were placed in a fresh keeping box at 28°C and 100% humidity to be sampled, and the same treatment with LB liquid medium was used for the control. Each fruit was inoculated in three places, seven points were inoculated in each place, and three fruits were inoculated as triplicate. On days 0, 2, and 6 of inoculation with Xcm, the mango epidermis with a thickness of 1–2 mm on the surface of the inoculation point was used as the experimental sample and stored at −80°C for use.
SOD and CAT analyses
For the determination of superoxide dismutase (SOD) and catalase (CAT) activities, based on the ratio of experimental sample weight (g):volume (mL) = 1:9, phosphate buffer solution 9 times the volume of the sample was added (0.1 mol/L, pH 7.0–7.4). Then, the sample was homogenized in an ice water bath and centrifuged at 12,000 rpm for 15 min at 4°C, and the supernatant was collected for measurement. An ultraviolet spectrophotometer or a Tecan Spark microplate reader was used to measure the absorbance value of the reaction solution, and the result was inputted into the formula to calculate the SOD and CAT activities. The analyses at each time point were repeated thrice.
RNA extraction, library construction, and sequencing
Total RNA was extracted using Trizol reagent kit (Invitrogen, Carlsbad, CA, USA), in accordance with the manufacturer’s protocol (Poyraz et al., 2010). RNA quality was assessed on an Agilent 2100 Bioanalyzer (Agilent Technologies, Palo Alto, CA, USA) and checked using RNase-free agarose gel electrophoresis. After the total RNA was extracted, eukaryotic mRNA was enriched by Oligo(dT) beads. Then, the enriched mRNA was broken into short fragments using fragmentation buffer and reverse transcribed into cDNA using NEBNext Ultra RNA Library Prep Kit for Illumina sequencing (NEB #7530, New England Biolabs, Ipswich, MA, USA) (Salmela and Rivals, 2014). The purified double-stranded cDNA fragments were end repaired, added with A base, and ligated to Illumina sequencing adapters. The ligation reaction was purified with AMPure XP Beads (1.0X). The ligated fragments were subjected to size selection by agarose gel electrophoresis and PCR amplification. The resulting cDNA library was sequenced using Illumina Novaseq6000 by Gene Denovo Biotechnology Co. (Guangzhou, China).
Transcriptome data analysis
The raw readings produced by transcriptome sequencing were quality controlled by fastp (version 0.18.0) (Chen et al., 2018), and the comparison tool Bowtie (version 2.2.8) (Langmead and Salzberg, 2012) was used to remove low-quality reads. Then, the clean reads were compared with the mango genome of each sample by HISAT (version 2.2.4) (Kim et al., 2015). No more than three base mismatches were observed. To analyze the gene expression in mango, mango variety “Hong Xiang Ya” was used as the reference genome,1 the total number of valid reads obtained from all samples was 1,456,435,960, and the number of reads that could be mapped to the mango genome was 1,325,116,148. After counting the reads for each gene, the set of genes expressed in each time period was counted for each cultivar, and differences between cultivars were analyzed by Venn diagram. At the same time, the sample cluster diagram was used to cluster the samples in different time periods to ensure the reliability of the subsequent analysis results. Finally we used the fragments per kilobase of transcript per million mapped reads (FPKM) method for normalization (Li and Dewey, 2011). Low-expression genes were filtered (<5 FPKM), and RNA differential expression analysis was performed between two different groups by DESeq2 (Love et al., 2014) (and by edgR between two samples) (Ashburner et al., 2000; Robinson et al., 2010). The genes with false discovery rate (FDR) below 0.05 and absolute fold change (FC) ≥ 2 were considered differentially expressed genes (DEGs).
Protein sample preparation
Sample preparation involved protein denaturation, reduction, alkylation, tryptic digestion, and peptide cleanup. Commercially available iST Sample Preparation kit (PreOmics GmbH, Planegg, Germany) was used following the protocols provided. Briefly, after the samples were ground with liquid nitrogen, 50 μL lysis buffer was added and heated at 95°C for 10 min at 1,000 rpm with agitation. After cooling the sample to room temperature, trypsin digestion buffer was added, and the sample was incubated at 37°C for 2 h at 500 rpm with shaking. The digestion process was stopped with a stop buffer. Sample clean-up and desalting were carried out in the iST cartridge using the recommended wash buffers. Peptides were eluted with elution buffer (2 × 100 μl) and then lyophilized by SpeedVac.
DIA protein detection
Before mass spectrometry detection, Biognosys quality control reagent from the iRT Kit was added to each sample, and calibration was performed based on the retention time of the polypeptide in chromatography. QuiC (Biognosys) software was used to control the original mass spectrometry data to investigate the similarity in the quality control indicators between each sample. If the index results were similar, the detection repeatability was good. Then, Pulsar software was used to build a database of the data obtained from the date-dependent acquisition (DDA) mode, and the date-independent acquisition (DIA) data were analyzed based on the DDA reference database to identify proteins. When at least one sample detected a protein, the qualitative results of the protein and quantitative results in all samples were outputted.
Qualitative analysis of proteins was conducted to detect proteins in the sample and identify their types. To ensure the reliability of results, we checked whether protein qualitative analysis results meet the following identification criteria: precursor threshold of 1.0% FDR and protein threshold of 1.0% FDR at the peptide and protein levels, respectively. The average peak area of the first three MS1 peptides with the FDR of less than 1.0% was screened for protein quantification.
After counting the reads for each protein, the set of genes expressed in each time period was counted for each cultivar, and differences between cultivars were analyzed by Venn diagram. Finally, according to the results of protein quantification, the proteins with significant changes in abundance between the comparison groups were screened. Statistical test FDR value and fold change log2FC were used to screen proteins with significant differences. The default threshold was FDR < 0.05, |log2(fc)| > 0.58. This part can visualize the results of difference analysis in the form of chart interaction.
Functional analysis
Gene Ontology (GO) enrichment analysis provided all GO terms that were significantly enriched in DEGs/differentially expressed proteins (DEPs) compared with the genome background, whereas the DEGs/DEPs that corresponded to biological functions were filtered (Young et al., 2010). First, all DEGs/DEPs were mapped to the GO terms in the GO database,2 and gene and protein numbers were calculated for every term (Chen et al., 2017). Significantly enriched GO terms in DEGs/DEPs compared with the genome background were defined by hypergeometric test. Kyoto Encyclopedia of Genes and Genomes (KEGG)3 is a major public pathway-related database (Kanehisa and Goto, 1999; Fang et al., 2021). Pathway enrichment analysis identified significantly enriched metabolic pathways or signal transduction pathways in DEGs/DEPs compared with the whole genome or proteome background. The formula was the same as that in GO analysis (Kanehisa and Goto, 1999). The calculated p-value was subjected to FDR correction, with FDR ≤ 0.05 as a threshold (Anders and Huber, 2010).
Network construction
To identify genes or proteins related to CAT, and SOD changes, we performed a weighted gene co-expression network analysis (WGCNA) on the genes and proteins. Co-expression networks were constructed using WGCNA (v1.47) package in R (Langfelder and Horvath, 2008). After filtering genes and proteins (<1 reads per kilobase per million mapped reads), gene/protein expression values were imported into WGCNA to construct co-expression modules using the automatic network construction function BlockwiseModules with default settings, except that the power was 13, and minimum module size was 50. Genes/proteins were clustered into 20 correlated modules (Botía et al., 2017).
Module and gene selection
To detect biologically significant modules, we used module eigengenes to calculate the correlation coefficient with samples or sample traits. Correlation analysis was performed using a module eigengene with data for specific traits or phenotypes (Niemira et al., 2019). Pearson correlation between each gene and trait data under the module were also calculated for the most relevant module (positive and negative correlations) corresponding to each phenotype data.
Quantitative RT-PCR analysis
Premier 6 was used to design gene qRT-PCR primers based on the CDS sequence of the differential genes (Supplementary Table 1). The reverse transcribed C-DNA of total RNA (the same sample as transcriptome sequencing) of mango fruit inoculated with the pathogen of mango bacterial keratitis at 0, 2, and 6 days was used as the template. The mango actin gene was used as the reference gene, and the dye kit method was used to verify the results. The entire RNA reverse transcription step was performed according to the reverse transcription kit instructions (Taylor et al., 2019). Expression was calculated using the 2–ΔΔCt method (Livak and Schmittgen, 2001).
Results
Symptoms after LB and Xcm treatments
After inoculation with Xcm and LB liquid medium by needling method, the phenotypic changes of the two varieties were observed at 0, 2 and 6 days (Figure 1). It was found that after inoculation with LB liquid medium, the color of the inoculation point of “Keitt” and “Renong No.1” gradually turned brown over time, but the changes at the inoculation point of the two varieties were not obvious. During the whole experimental period of Xcm inoculation, the changes of symptoms of the two varieties were consistent with their disease resistance. The specific manifestations were as follows: on day 2 after inoculation, black spots began to appear at the inoculation sites of the two varieties, and the symptoms were similar at this time. On the sixth day after inoculation, the symptoms of the two varieties at the indirect seeding sites were obviously different. The black spots of “Renong 1” were deepened and slightly spread. “Kate” was more widespread, showing the typical ‘crisscross volcanic’ pattern of bacterial corner spot in mango orchards. The results suggest that 0, 2, and 6 days after Xcm inoculation may be key sampling time points to explore the mechanisms of resistance to bacterial keratosis in mangoes with different resistance.
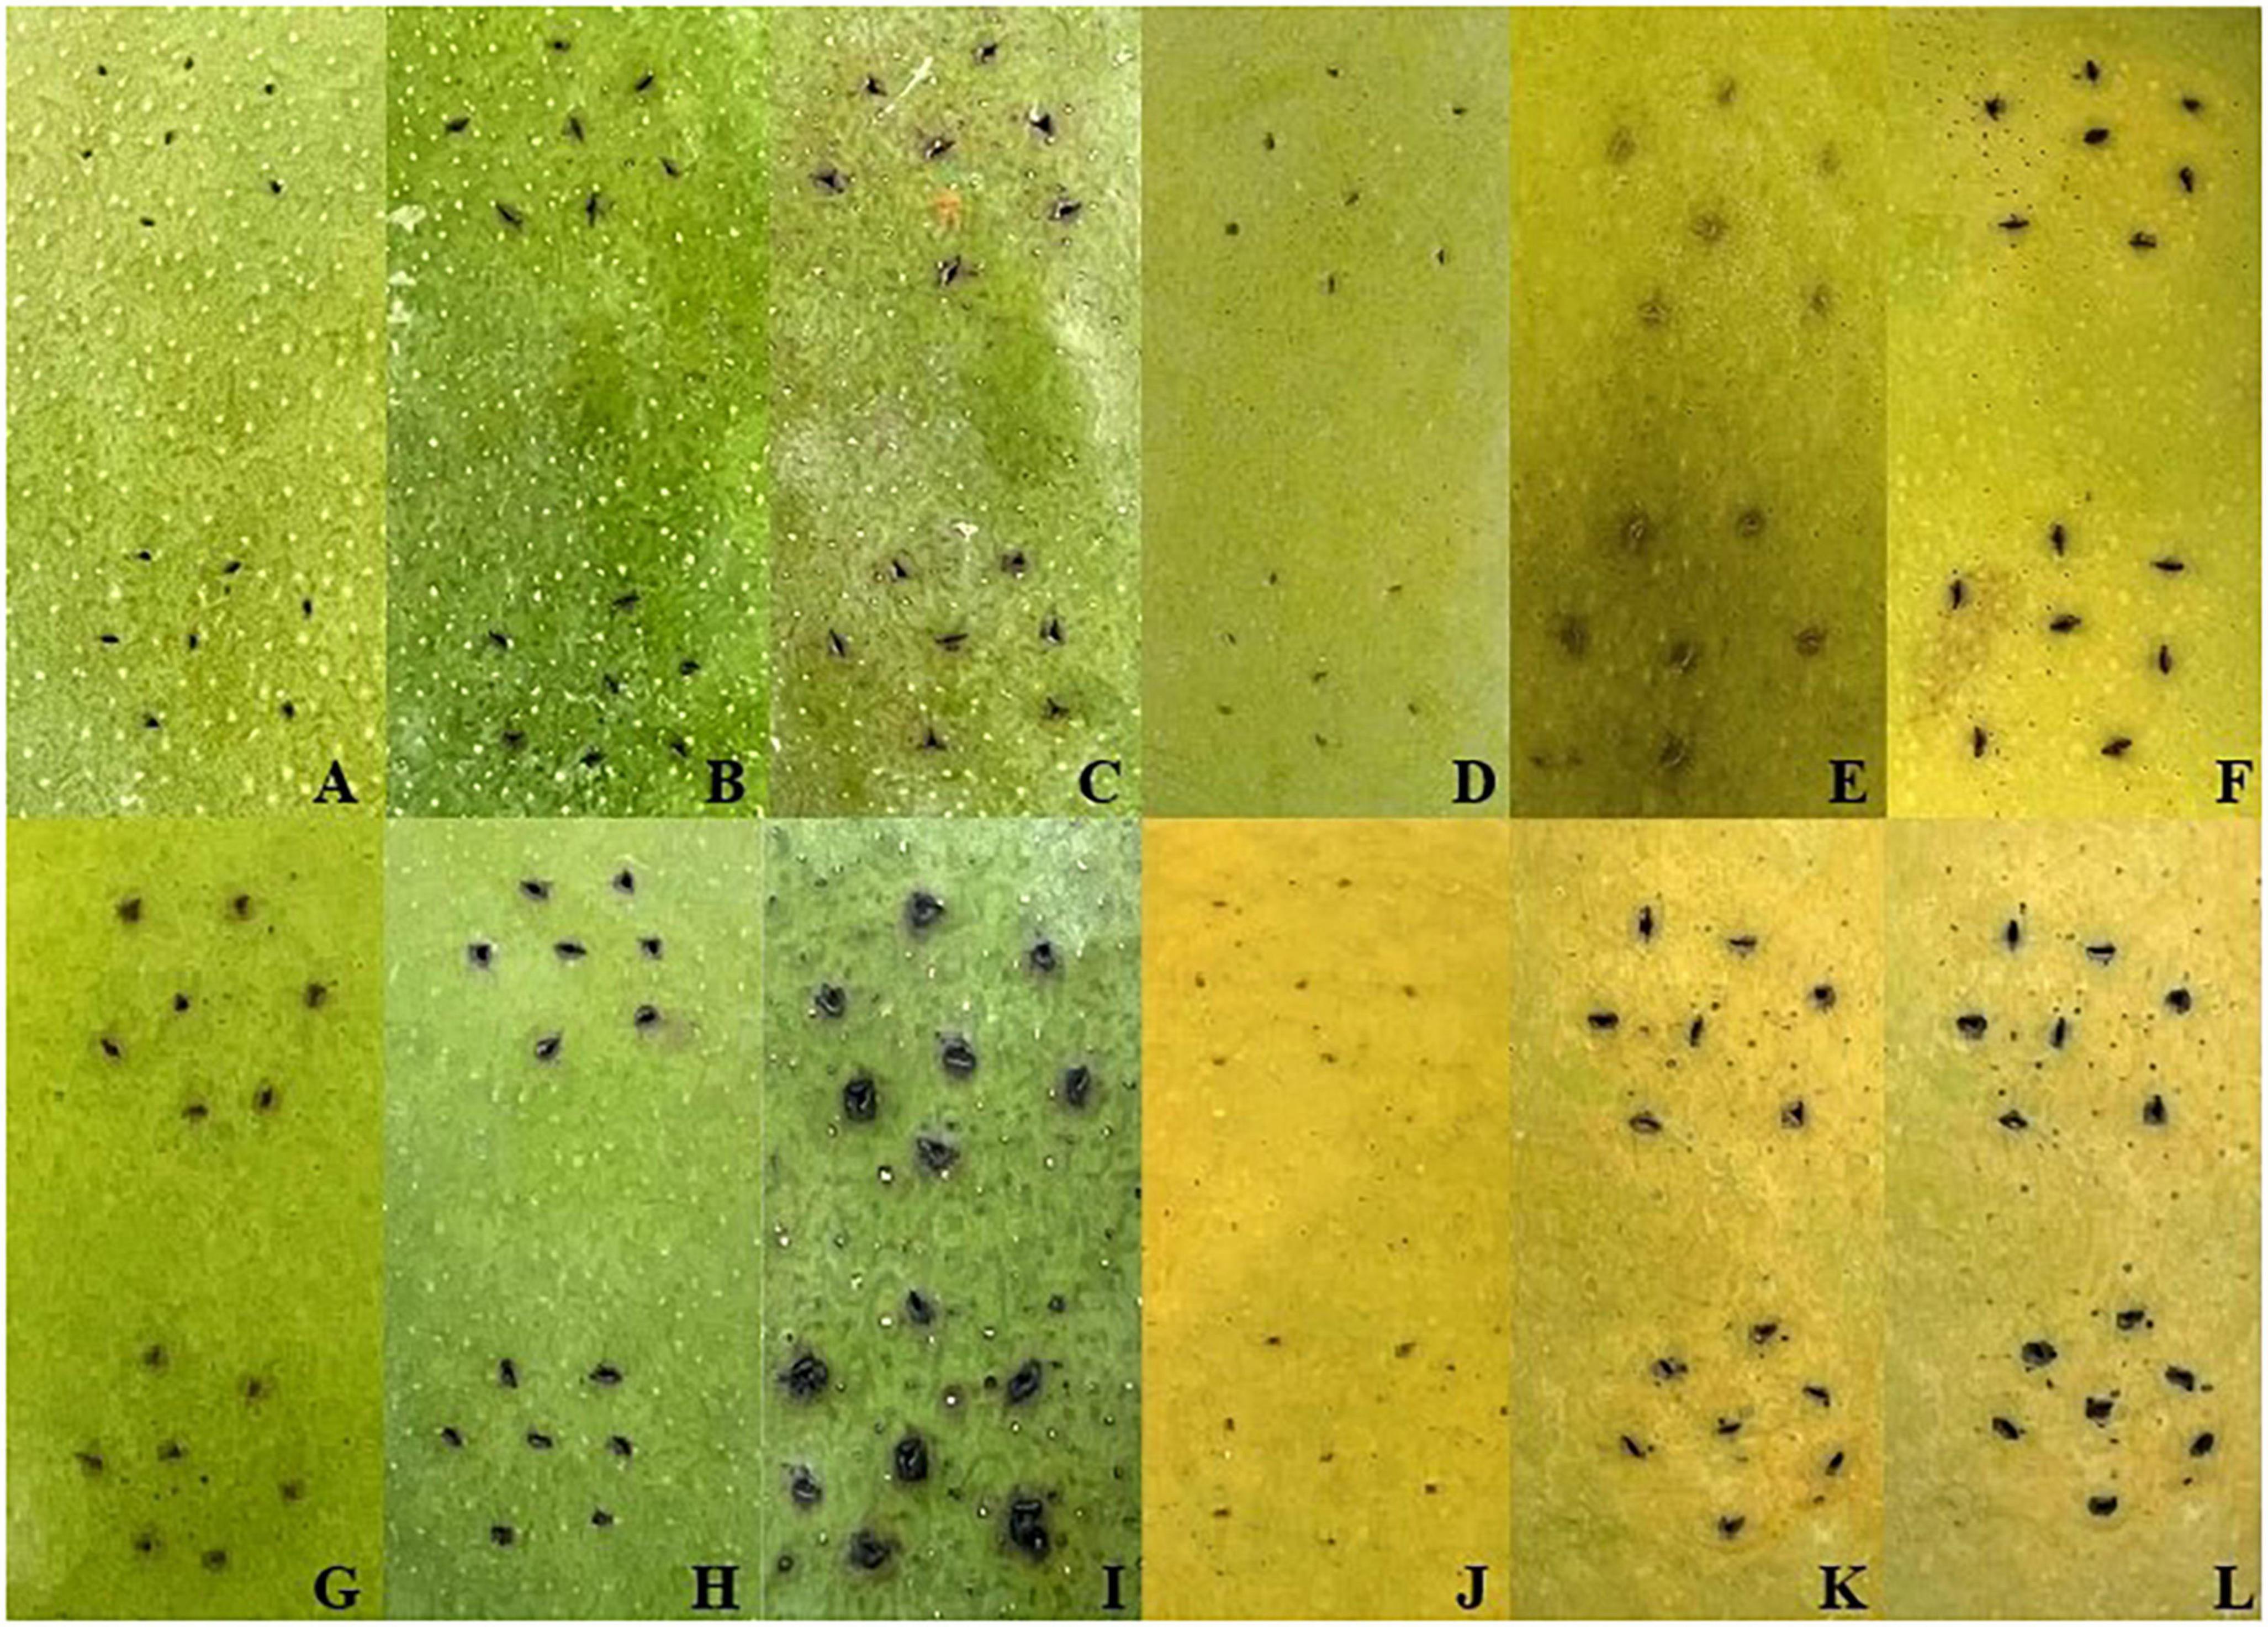
Figure 1. Symptoms after LB and Xcm treatments. Panels (A–C) and (D–F) were the symptoms of “Keitt” and “Renong No.1” after 0 days, 2 days, and 6 days of LB liquid medium treatment, respectively. Panels (G–I) and (J–L) were the symptoms of “Keitt” and “Renong No.1” after 0 days, 2 days, and 6 days of treatment with bacterial solution containing Xcm, respectively.
Overview of mango fruit transcriptome
To study the changes in gene expressions in fruits of KT and RN after inoculation with Xcm, we obtained the pericarp tissues of two resistant and susceptible germplasms at 0, 2, and 6 days after inoculation with pathogens. Then, we used TRIzol reagent to extract the total RNA of each sample and sequenced them by Illumina HiSeq 2000 platform. Initially, transcriptome sequencing generated about 59,160,000 original reads and about 59,040,000 clean reads for all samples. Then, the clean reads were aligned with the mango genome sequence, which resulted in 90.15–92.13% clean reads with no more than three base mismatches. To analyze mango gene expressions, we calculated the number of clean reads aligned with mango gene sequences (36,065 sequences) and normalized them using the FPKM method. After filtering the low-expression genes (<5 FPKM), we identified 28,704 genes (about 79.59% of all mango genes) in all samples.
After counting the readings, to exclude the influence of genetic background differences between KT and RN on subsequent analyses, we analyzed the expression of KT and RN overall genes under LB treatment. A Venn diagram (Supplementary Figure 1) showed that 7,057 genes were expressed, and no genes were detected that were expressed specifically at a single time point. This ruled out the possibility of misinterpretation of gene expression data generated during the natural growth of mango.
DEGs in resistant and susceptible mango fruits
To analyze mango fruit gene expression, we used Deseq2 software to calculate P- and FDR values and the default FDR < 0.05; | log2FC| > 1 indicated differential genes. We identified 14,397 DEGs in the KT and RN. A total of 8,926 DEGs were identified in KT. Compared with KT0d, 5,276 (3,623 up-regulated and 1,653 down-regulated) and 6,809 DEGs (3,583 up-regulated and 3,226 down-regulated) were identified in KT2d and KT6d, respectively. Compared with KT2d, we identified 2,977 DEGs in KT6d (595 up-regulated and 2,382 down-regulated). We identified 4,400 DEGs in RN. Compared with RN0d, we identified 2,045 (1,118 up-regulated and 927 down-regulated) and 3,043 DEGs (1,019 up-regulated and 2,044 down-regulated) in RN2d and RN6d, respectively. Compared with RN2d, we identified 1,996 DEGs (386 up-regulated and 1,610 down-regulated) in RN6d. In the further comparison of RN2d with KT2d and RN6d with KT6d, we identified 7,523 (2,228 up-regulated and 5,295 down-regulated) and 9,380 DEGs (3,120 up-regulated and 6,260 down-regulated) in the RNs, respectively (Figure 2A). Venn diagram (Figure 2B) showed that 626 DEGs were continuously differentially expressed during the whole infection period of KTs, and 242 DEGs were continuously differentially expressed during the whole experimental period of RNs. Furthermore, 5,975 DEGs were shared between KTs and RNs. A total of 3,650 out of 8,926 DEGs identified in KTs (40.89%) and 2,355 out of 4,400 DEGs identified in RNs (53.52%) were specifically expressed on day 6, which indicated that the transcriptome of mango changed significantly on day 6 after Xcm infection.
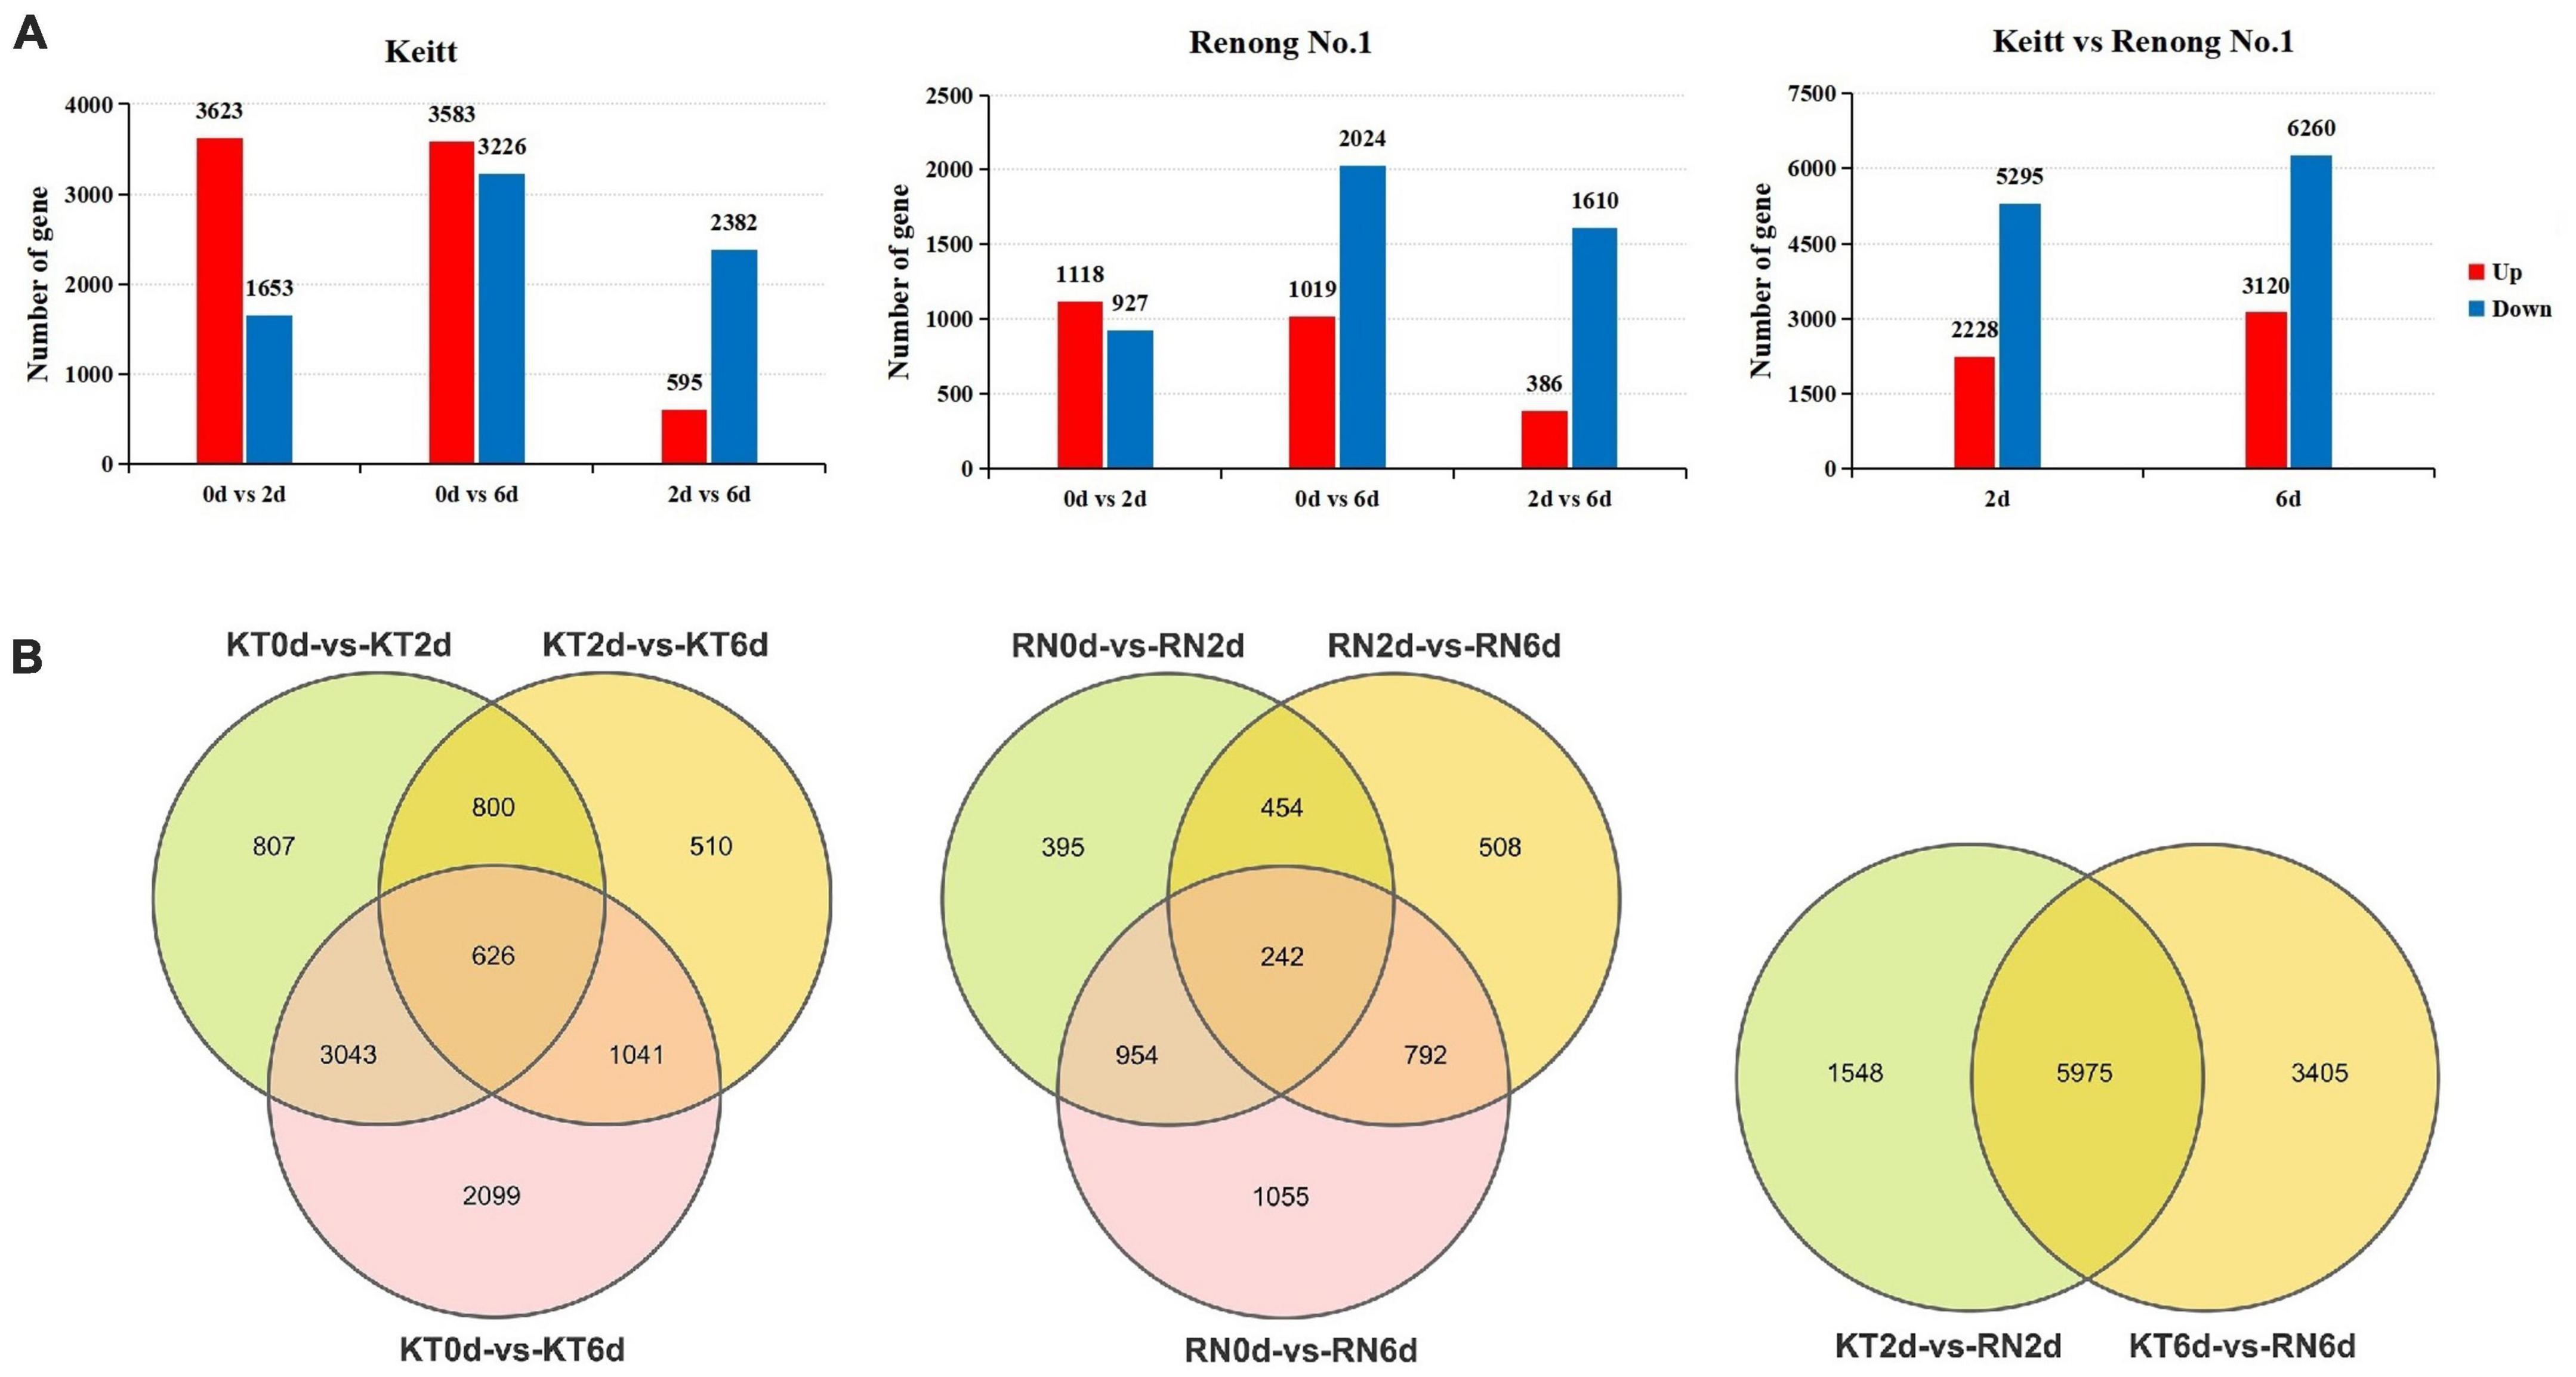
Figure 2. DEGs of RN and KT. Panel (A) is the expression summary of DEGs in RN and KT, red represents upregulation and blue represents downregulation; Panel (B) is the distribution of DEGs in KT and RN, the left is DEGs in KT, the middle is the DEGs in RN, and the right is DEGs in RN at different stages after inoculation (relative to KT).
To understand the possible pathways and functions of these DEGs in mango response to Xcm, we performed GO and KEGG enrichment analyses on the DEGs (Figure 3; Supplementary Tables 2, 3). GO enrichment analysis showed that a large number of DEGs in KTs and RNs were annotated to metabolic process (GO: 0008152), cellular process (GO: 0009987), catalytic activity (GO: 0003824), biological regulation (GO: 0065007), response to stimulus (GO: 0050896), membrane (GO: 0016020), and cell part (GO: 0044464). These significantly enriched GO terms were associated with the symptoms of MBLS, including “cross-shaped volcanic lesions” and black spots. KEGG enrichment analysis revealed that a large number of DEGs of RNs and KTs are involved in GSH metabolism, phenylalanine metabolism, peroxisome, and other important pathways. However, several differences were observed in the pathways involved in certain DEGs enriched by KTs and RNs. Specific pathways were only found in RN enrichment results, and these pathways included plant mitogen-activated protein kinase signaling pathway, plant-pathogen interaction, plant hormone signal transduction, and cutin, suberin, and wax biosynthesis. Thus, the DEGs of RNs and KTs are involved in different pathways in response to Xcm infection.
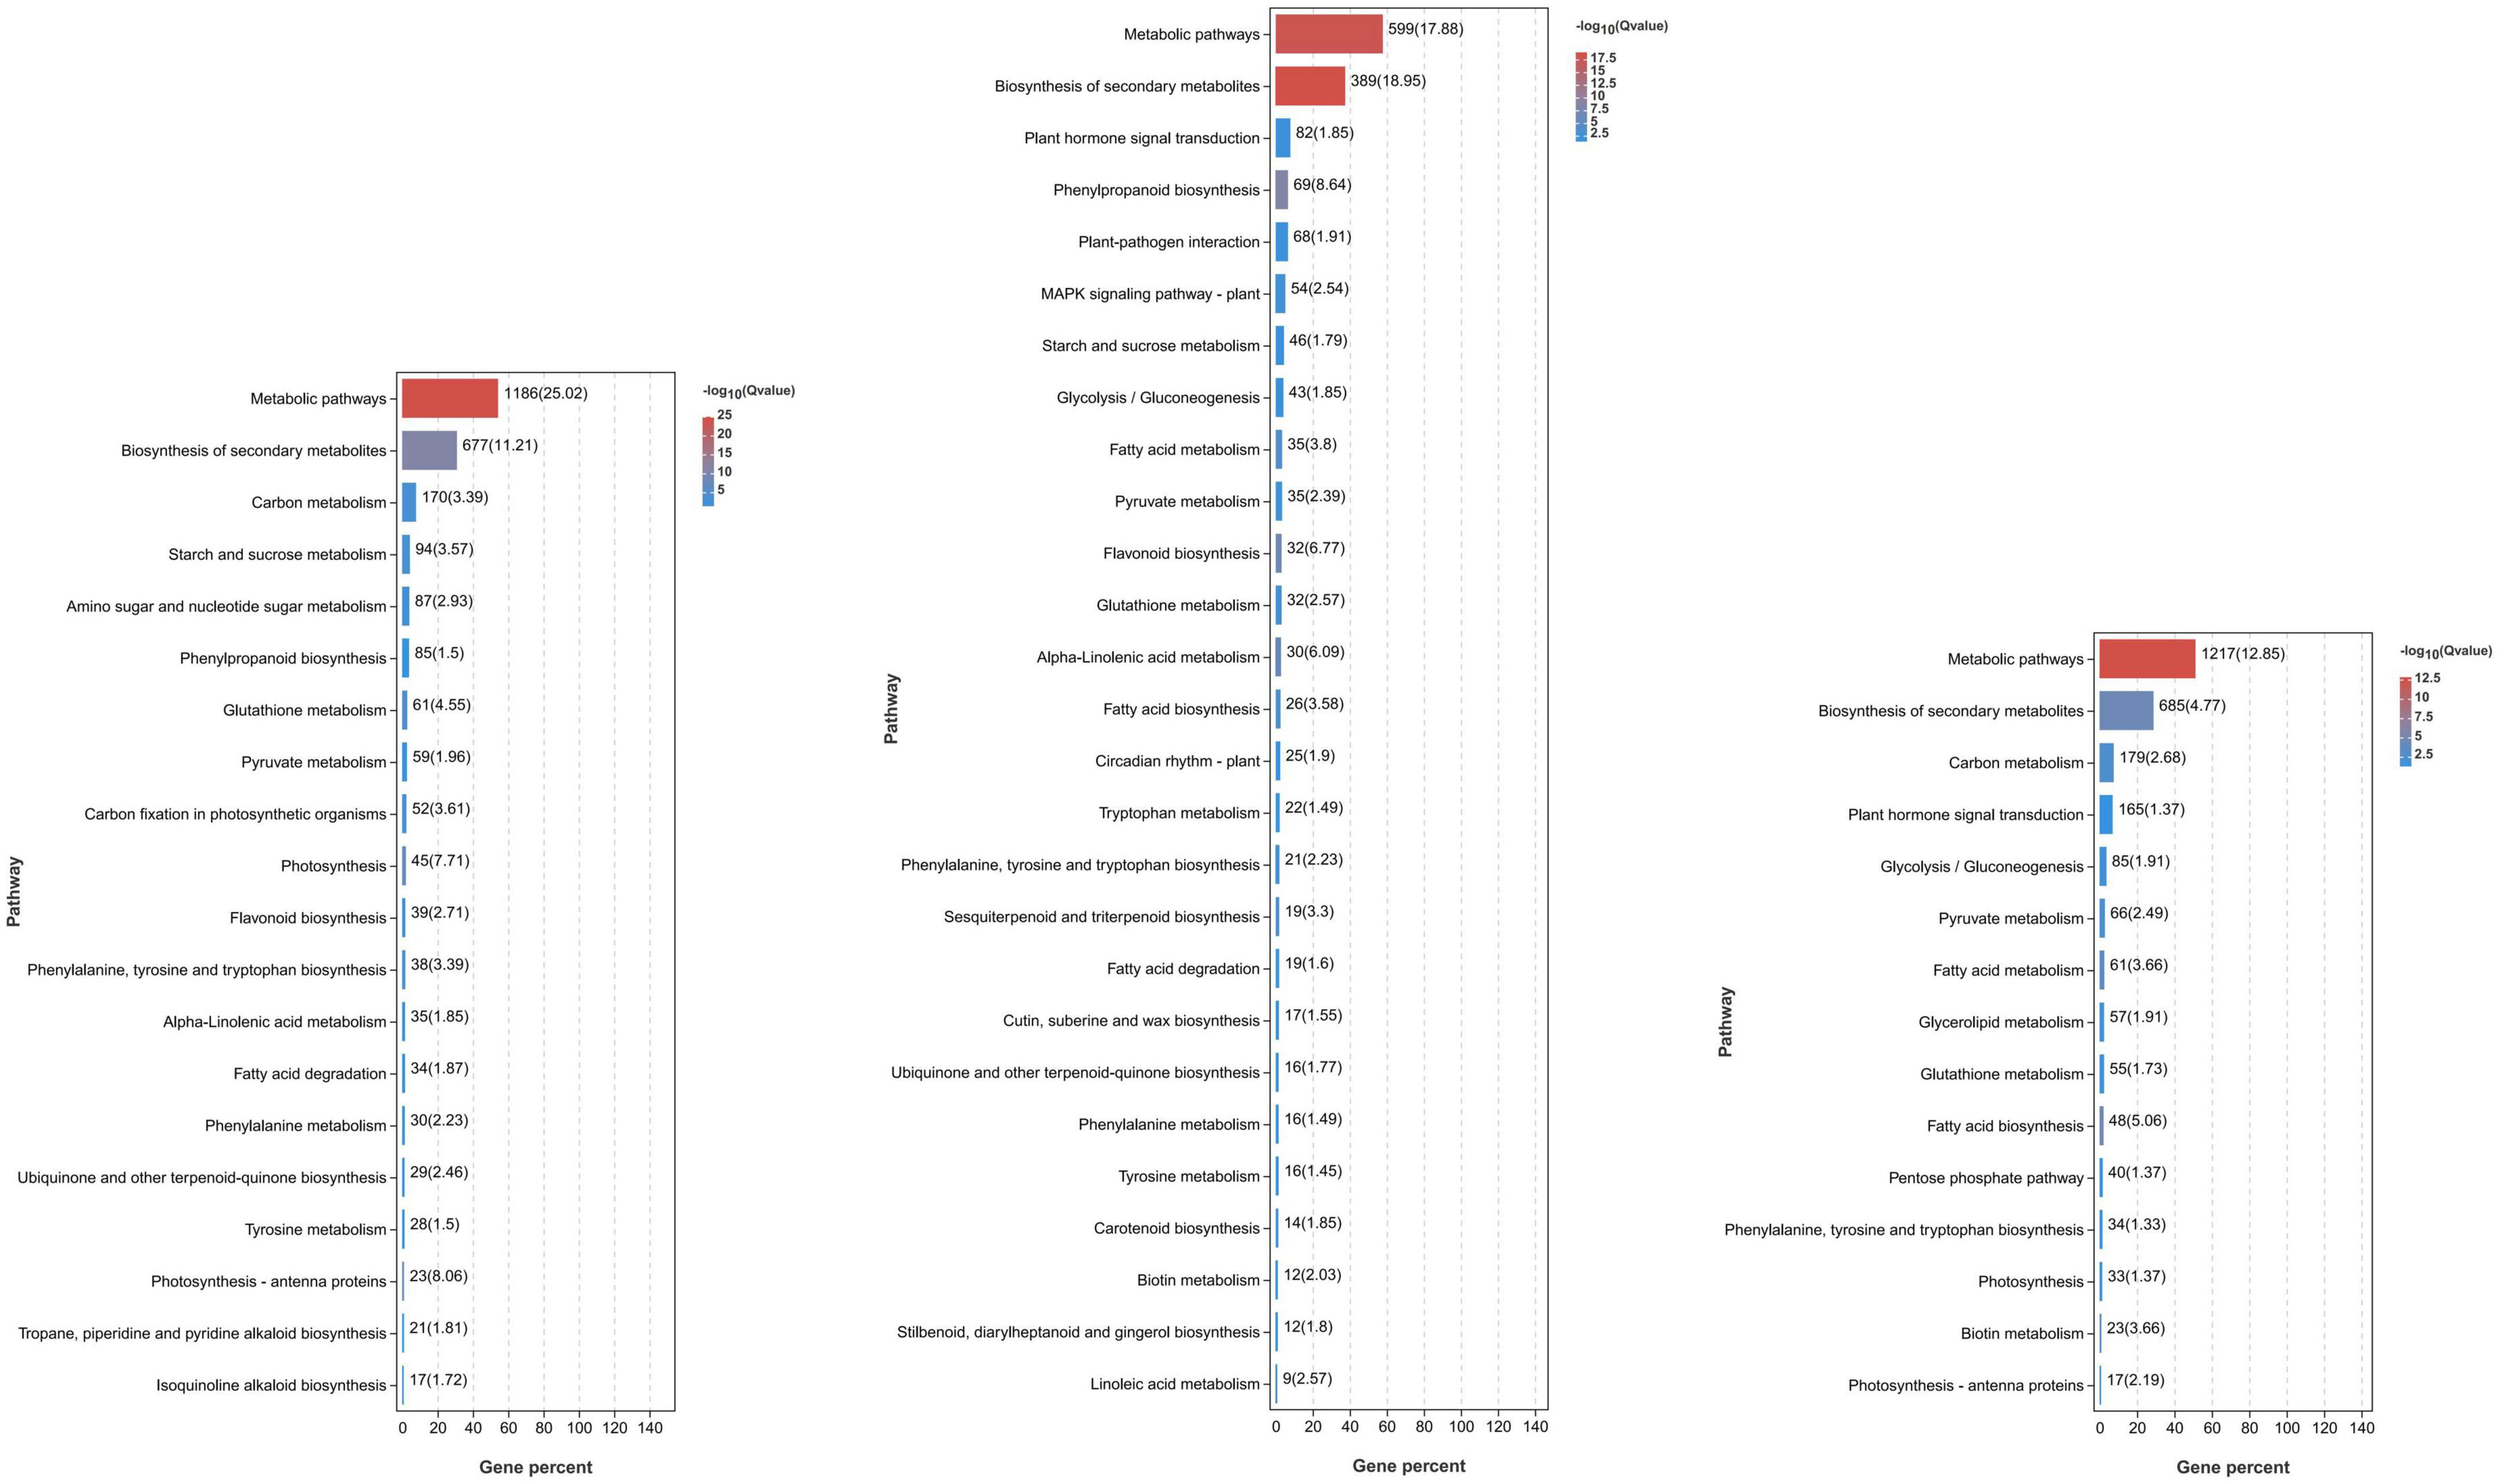
Figure 3. Significant KEGG pathways of DEGs identified in RN and KT. Different pathways and their p-values of the number of genes contained and the degree of enrichment significance were plotted, and only the pathway that met the threshold was selected for plotting. Each column represents a pathway, and the color of the column represents the enrichment significance of that Pathway. The numbers outside the brackets next to the columns represent the number of genes belonging to the pathway in the module. The values in parentheses next to the columns represent the degree of enrichment and are −log10(p-value) and correspond to the color of the columns. In the significance bars, the order “from large to small” was selected according to the number of genes enriched in the pathway.
Genes in the plant hormone signaling pathway
A total of 217 DEGs were found to be related to plant hormone signal transduction pathway (Supplementary Table 4). These DEGs included 63 IAA-related genes, such as auxin-responsive protein (IAA26, LAX2, ARF9, and AUX22D) and IAA amido synthetase (GH3.1, GH3.6, and GH3.10), of which 22 were down-regulated in RN and KT. Twelve genes were associated with ABA; two of them (ABF2 and PYL8) decreased, and three (DPBF2, PYL1, and PYL3) increased in RN and KT. A total of 6 and 14 ETH-related genes (EIL3, EIL1, EIN3, and ETR1) decreased in KT and RN, respectively, and the remaining 8 genes showed different expression trends in various mango varieties. A total of 12 genes were related to GA, 4 (GAIPB, GID1B, GID2, and GAI) were down-regulated in RN and KT, and the remaining 7 genes showed different expression patterns in various mango species. In addition, 10 and 17 TF genes (1 TGA, 2 PIF, 5 MYC, and 1 HBP-1b) were down-regulated in RN and KT, respectively. A total of 7 were down-regulated (4 serine/threonine-protein kinase, 1 MKK, and 2 BAK), and 3 kinases (MKK, serine/threonine-protein kinase, and AHK) were up-regulated. The up-regulation and down-regulation of these genes indicated that hormone signaling was induced by Xcm infection in mango tissues, and the levels of plant hormones may play an important role in this process.
Genes involved in the maintenance of cellular redox homeostasis
Among the 14,397 DEGs, 202 were found to be involved in the redox process or play a regulatory role in cellular redox homeostasis (Supplementary Table 5). A total of 74 genes were annotated to peroxisomes, and 32 genes were up-regulated in RN but down-regulated in KT. CAT isozyme (CAT1), Nudix hydrolase family (NUDT15, NUDT19), and other enzymes were annotated as fatty acyl-CoA reductase, phytanoyl-CoA dioxygenase, and long chain acyl-CoA synthetase. A total of 81 DEGs were involved in GSH metabolism, including those of L-ascorbate peroxidase (APX3, APXS and APXT), glucose-6-phosphate 1-dehydrogenase (G6PD2, G6PD4, and G6PDH), and 20 of them were continuously up-regulated in RN; their expression levels were significantly higher than those in KT. After Xcm infection, 18 redox proteins (3 CAT isozymes, 10 ferredoxin (Fd), and 5 SOD) were induced, among which CAT1, FD3, and Os07g0147900 were up-regulated in RN and down-regulated in KT. The expression levels of 11 photosystem I (PSI) reaction center subunits and 8 PSII proteins generally increased in resistant and susceptible varieties, but the changes in KT were more significant.
Overview of mango fruit proteome
Proteomics technology is widely used in the study of protein differential expression and various post-translational modifications (Haverland et al., 2014; Sidoli et al., 2015). In this study, we used DIA (a new holographic quantitative technique based on electrostatic field orbitrap) to investigate the protein expression changes in KT and RN mango during Xcm infection (0, 2, and 6 days). To ensure the reliability of the results, we checked whether the protein qualitative analysis findings met the identification criteria, namely, precursor threshold of 1.0% FDR and protein threshold of 1.0% FDR, at the peptide and protein levels, respectively. Finally, 12,260 peptides and 12,877 proteins were identified from the two mango varieties.
As with the transcriptome analysis, after counting, we analyzed KT and RN total protein expression under LB treatment. The Venn diagram (Supplementary Figure 2) shows that 11,329 proteins were co-expressed across all tested time points, and no more than 35 proteins were specifically expressed at each tested time point. For reliability of subsequent analysis, 11,329 co-expressed proteins were selected for subsequent analysis.
DEPs in resistant and susceptible mango fruits
We aimed to understand the differences in protein expression levels in response to Xcm in different mango varieties. According to the screening threshold of DEPs, the absolute value of the FC was greater than 1.5 times (| log2(1.5)| ≈0.58 corrected P-value (Q value) < 0.05). The proteins with significant differences between groups (KT0d vs. KT2d, KT0d vs. KT6d, KT2d vs. KT6d, RN0d vs. RN2d, RN0d vs. RN6d, RN2d vs. RN6d, KT2d vs. RN2d, and KT6d vs. RN6d) were screened. A total of 1,700 DEPs were identified in KT. Compared with KT0d, 1,101 (578 up-regulated and 523 down-regulated) and 1,044 (509 up-regulated and 535 down-regulated) DEPs were identified in KT2d and KT6d, respectively. Compared with KT2d, 296 DEPs were identified in KT6d (102 up-regulated and 194 down-regulated). A total of 1,542 DEPs were identified in RNs. Compared with RN0d, 650 (391 up-regulated and 259 down-regulated) and 337 DEPs (206 up-regulated and 131 down-regulated) were identified in RN2d and RN6d, respectively. Compared with RN2d, 1,221 DEPs (635 up-regulated and 586 down-regulated) were identified in RN6d (Figure 4A). The Venn diagram (Figure 4B) showed that 65 and 94 DEPs were significantly differentially expressed after KTs and RNs were infected with Xcm, respectively. A total of 1,800 DEPs were detected between KTs and RNs. Similar to the transcriptome results, the expression of DEPs induced on the 6th day of Xcm infection was higher than that of all DEPs. A total of 1,243 DEPs (50.92%) were observed in KT6d and 1,340 (60.69%) in RN6d. Thus, the 6th day of Xcm infection not only caused great changes in the transcriptome of mango but also the expression of its proteins.
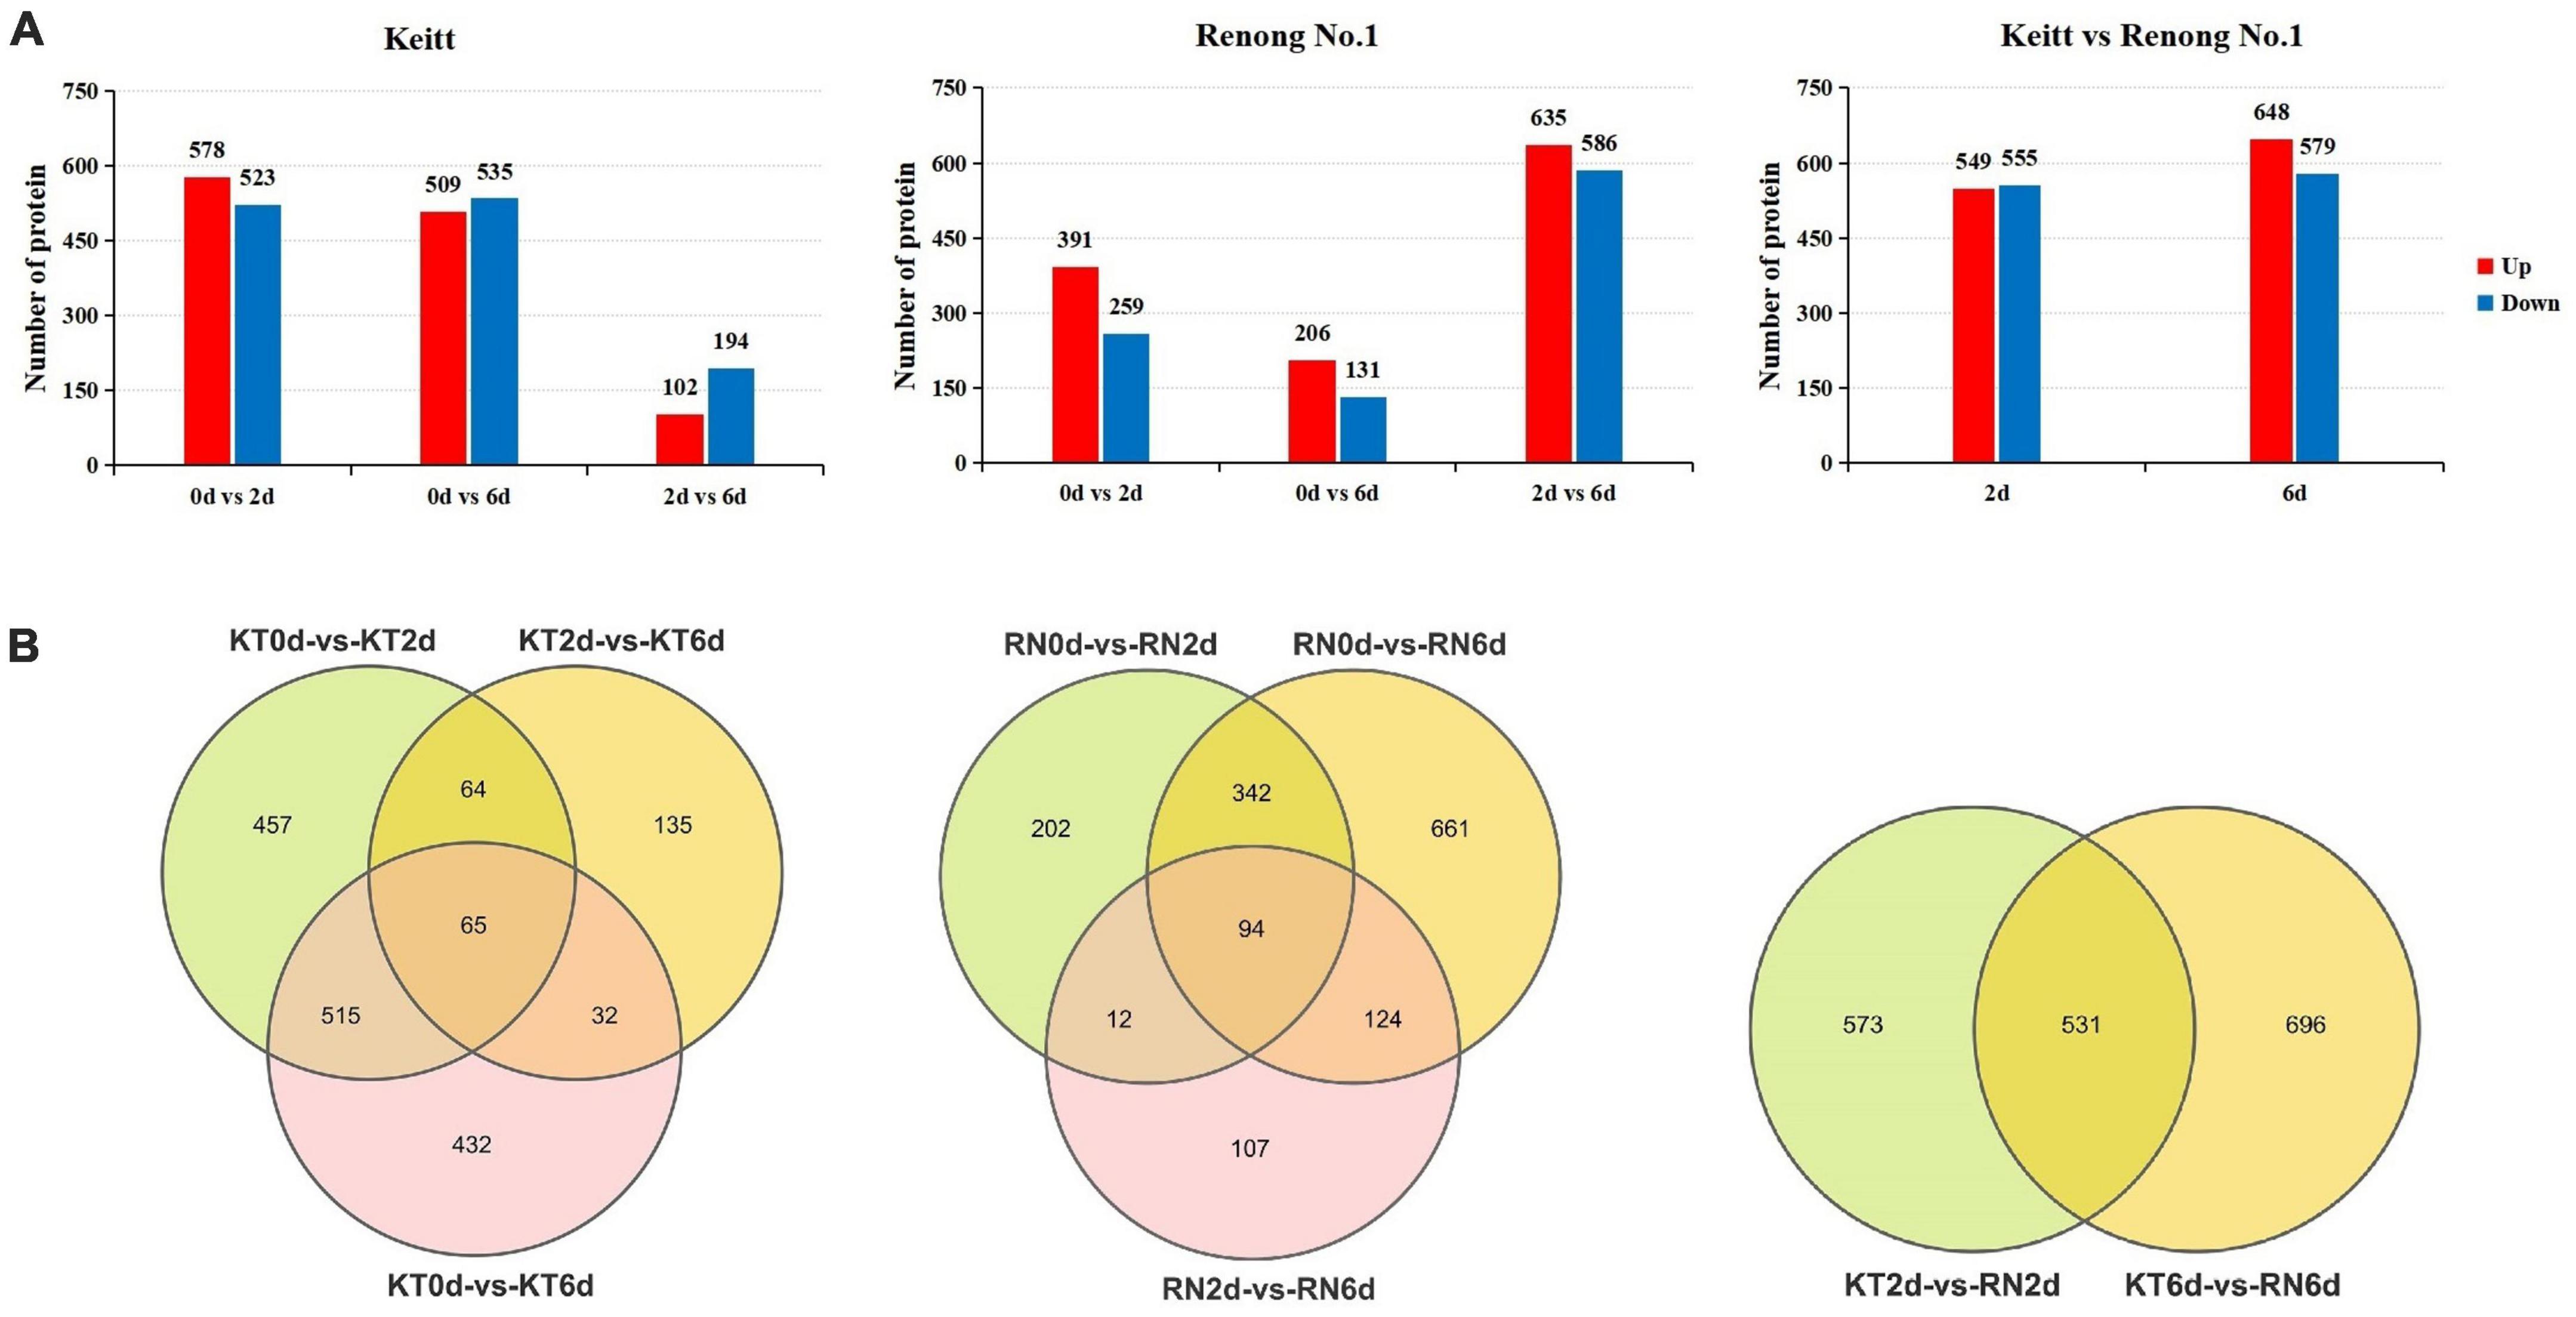
Figure 4. DEPs of RN and KT. Panel (A) is the expression summary of DEPs in RN and KT, red represents upregulation and blue represents downregulation; Panel (B) is the distribution of DEPs in KT and RN, the left is DEPs in KT, the middle is the DEPs in RN, and the right is DEPs in RN at different stages after inoculation (relative to KT).
To understand the function of DEPs in RNs and KTs and the pathways involved in regulation, we also conducted GO and KEGG enrichment analyses on DEPs (Figure 5; Supplementary Tables 6, 7). GO enrichment results showed a large number of organism metabolic process proteins in both cultivars (GO: 0044710), including oxoacid metabolic process (GO: 0043436), cellular homeostasis (GO: 0019725), regulation of hormone levels (GO: 0010817), and other biological processes, such as oxidoreductase activity (GO: 0016491), catalytic activity (GO: 0003824), antioxidant activity (GO: 0016209), and other molecular functions that neutralize cell-cell junction (GO: 0005911); cell periphery (GO: 0071944), cytoplasmic part (GO: 0044444), and other cellular components. We speculate that Xcm may act mainly on the membrane of mango cells or accelerate the process of infection by secreting special substances or degrading normal mango cell structures to bind them to cells. KEGG enrichment analysis showed that a large number of proteins are involved in metabolic pathways, biotin metabolism, carbon metabolism, and other pathways. DEPs in RNs were also significantly enriched in important pathways, such as peroxisome and GSH metabolism. We suggest that mango infection may trigger a series of physiological and chemical reactions, such as the synthesis of plant hormones and lignin, antioxidant production, and changes in ROS.
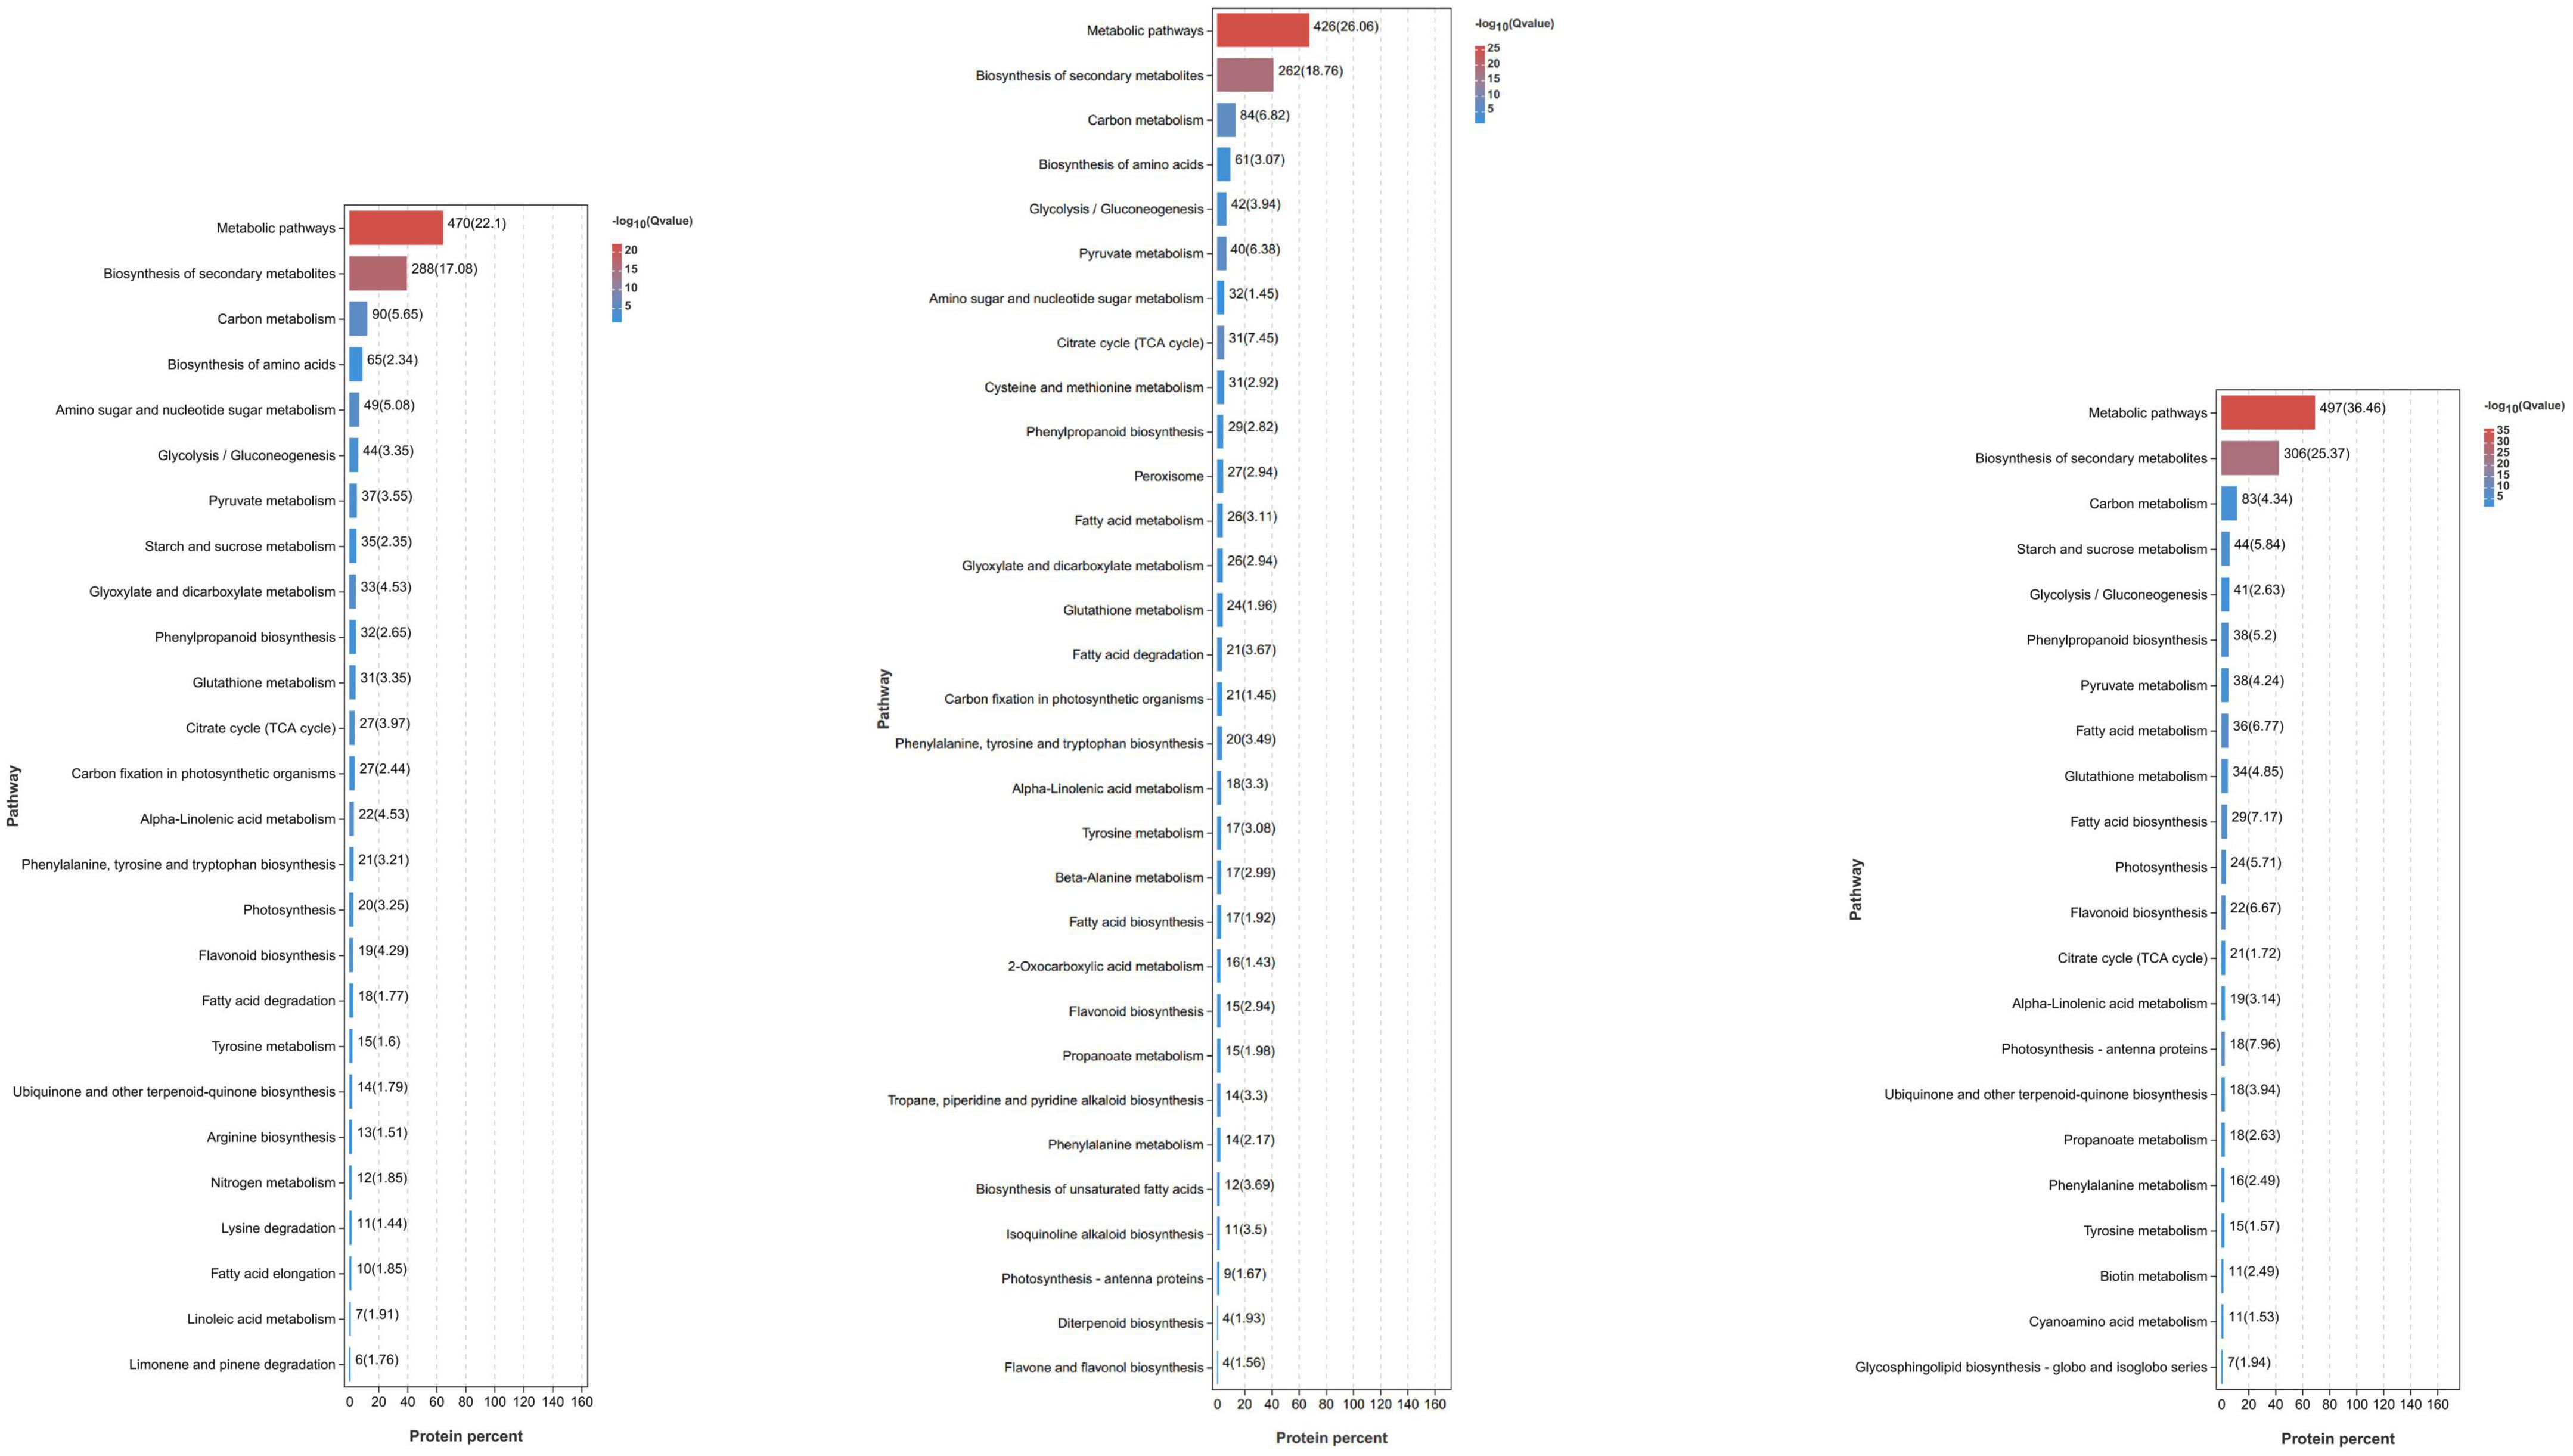
Figure 5. Significant KEGG pathways of DEPs identified in RN and KT. Different pathways and their p-values of the number of proteins contained and the degree of enrichment significance were plotted, and only the pathway that met the threshold was selected for plotting. Each column represents a pathway, and the color of the column represents the enrichment significance of that pathway. The numbers outside the brackets next to the columns represent the number of proteins belonging to the pathway in the module. The values in parentheses next to the columns represent the degree of enrichment and are −log10(p-value) and correspond to the color of the columns. In the significance bar, the order “from large to small” was selected according to the number of enriched proteins in the pathway.
Proteins in the plant hormone signaling pathway
Similar to the transcriptome analysis, we identified 39 DEPs associated with plant hormone signaling pathway (Supplementary Table 8). Among these DEPs, several were identified together with their transcriptomes, two were associated with IAA (IAA26 and LAX2 were up-regulated in RN and down-regulated in KT), seven were associated with ABA, and six (PYL1, PYL2, 2 PYL9, and 2 ABF2) were generally down-regulated in KT and RN. One DEP (PYL8) was up-regulated in RN but down-regulated in KT. Several transcription factors (TGA7, TGA21, and MYC2) were down-regulated in RN and KT, and the proteome-specific protein TGAL1 was identified (down-regulated in RN and up-regulated in KT). In addition, we observed that eight classes of kinases (BSK7, SAPK3, SRK2A, SRK2E, BSK2, SAPK2, ASK7, and BSK1) (BSK1 and ASK7 were up-regulated in RN and down-regulated in KT, and the others were down-regulated in KT and RN). The pathogenesis-related protein PRB1 was up-regulated in KT and RN but was more evident in RN. The findings indicate that the regulatory pathways involving several transcription factors and kinases and IAA and ABA signaling pathways are the keys to mango response to Xcm.
Proteins involved in the maintenance of cellular redox homeostasis
A total of 68 DEPs were identified to be related to the maintenance of cellular redox homeostasis (Supplementary Table 9). These DEPs included 5 redox proteins (3 FD3 and 2 CAT1 were up-regulated in RN but down-regulated in KT; FSD2 was down-regulated in KT and RN), of which 38 are involved in the production of peroxisomes, including PED1, PMP22, ACX3, ACX4, and ACX2, and were up-regulated in KT and RN, with a stronger response observed in RN. A total of 49 genes are related to GSH metabolism, and 29 genes, such as GST (HSP26-A, GSTU7 and PARC), 6-phosphogluconate dehydrogenase (PGD3), and phospholipid hydroperoxide GSH (GPX1 and GPX2), were up-regulated in RN and KT. Nine PSI- and three PSII-related proteins, such as PSAA, PSAH2, and PSB27-1, were continuously down-regulated in RN but were significantly increased in KT on day 6 after Xcm stress. Proteins involved in the regulation of antioxidant enzymes and peroxisome biosynthesis were also identified in the transcriptome, and the expression patterns of PS-related proteins differed between KT and RN. These results indicate that proteins from these three pathways may play important roles in the resistance of mango to Xcm invasion.
Cross-validation of transcriptomics and proteomics
To screen the gene set with the same or opposite expression trend in the two groups, based on the results of transcriptome and proteome difference analyses, we selected the common genes in the two omics for nine-quadrant analysis (Figure 6). The results showed that 1,470 genes were detected in the differential analysis of the two omics (Supplementary Table 10), and the expression patterns of 663 DEGs and DEPs were consistent (306 up-regulated and 357 down-regulated). The expression patterns of 95 DEGs were opposite those of DEPs (24 were up-regulated at the transcriptional level and down-regulated at the protein level; 71 were up-regulated at the protein level and down-regulated at the transcriptional level). A total of 580 genes were differentially expressed only at the protein level (271 up-regulated and 309 down-regulated). In addition, 132 genes were only differentially expressed at the transcriptional level (34 up-regulated and 98 down-regulated). Notably, a large number of DEGs/DEPs, including GST (HSP26-A and PARC), glucose-6-phosphate 1-dehydrogenase (G6PD2 and G6PD4) and GPX (GPX2), were found to be associated with GSH metabolism. Some DEGs/DEPs were also found to be associated with peroxisomes, including co-upregulated (LACS6, LACS9, and PED1) and co-downregulated (GLO4 and HACL) genes, which are involved in the regulation of cellular redox homeostasis and protect cells from stress-induced oxidative damage. Four ABC transporter families, including ABCB11, ABCB26, and ABCB28, were up-regulated in both omics. MYC2 and TGA7 transcription factors related to plant IAA and ABA signal transduction were down-regulated in both omics. PYL1 and PYL9 were down-regulated, and SAPK2 was up-regulated in both omics; these genes are related to plant ABA signaling and plant-pathogen interaction.
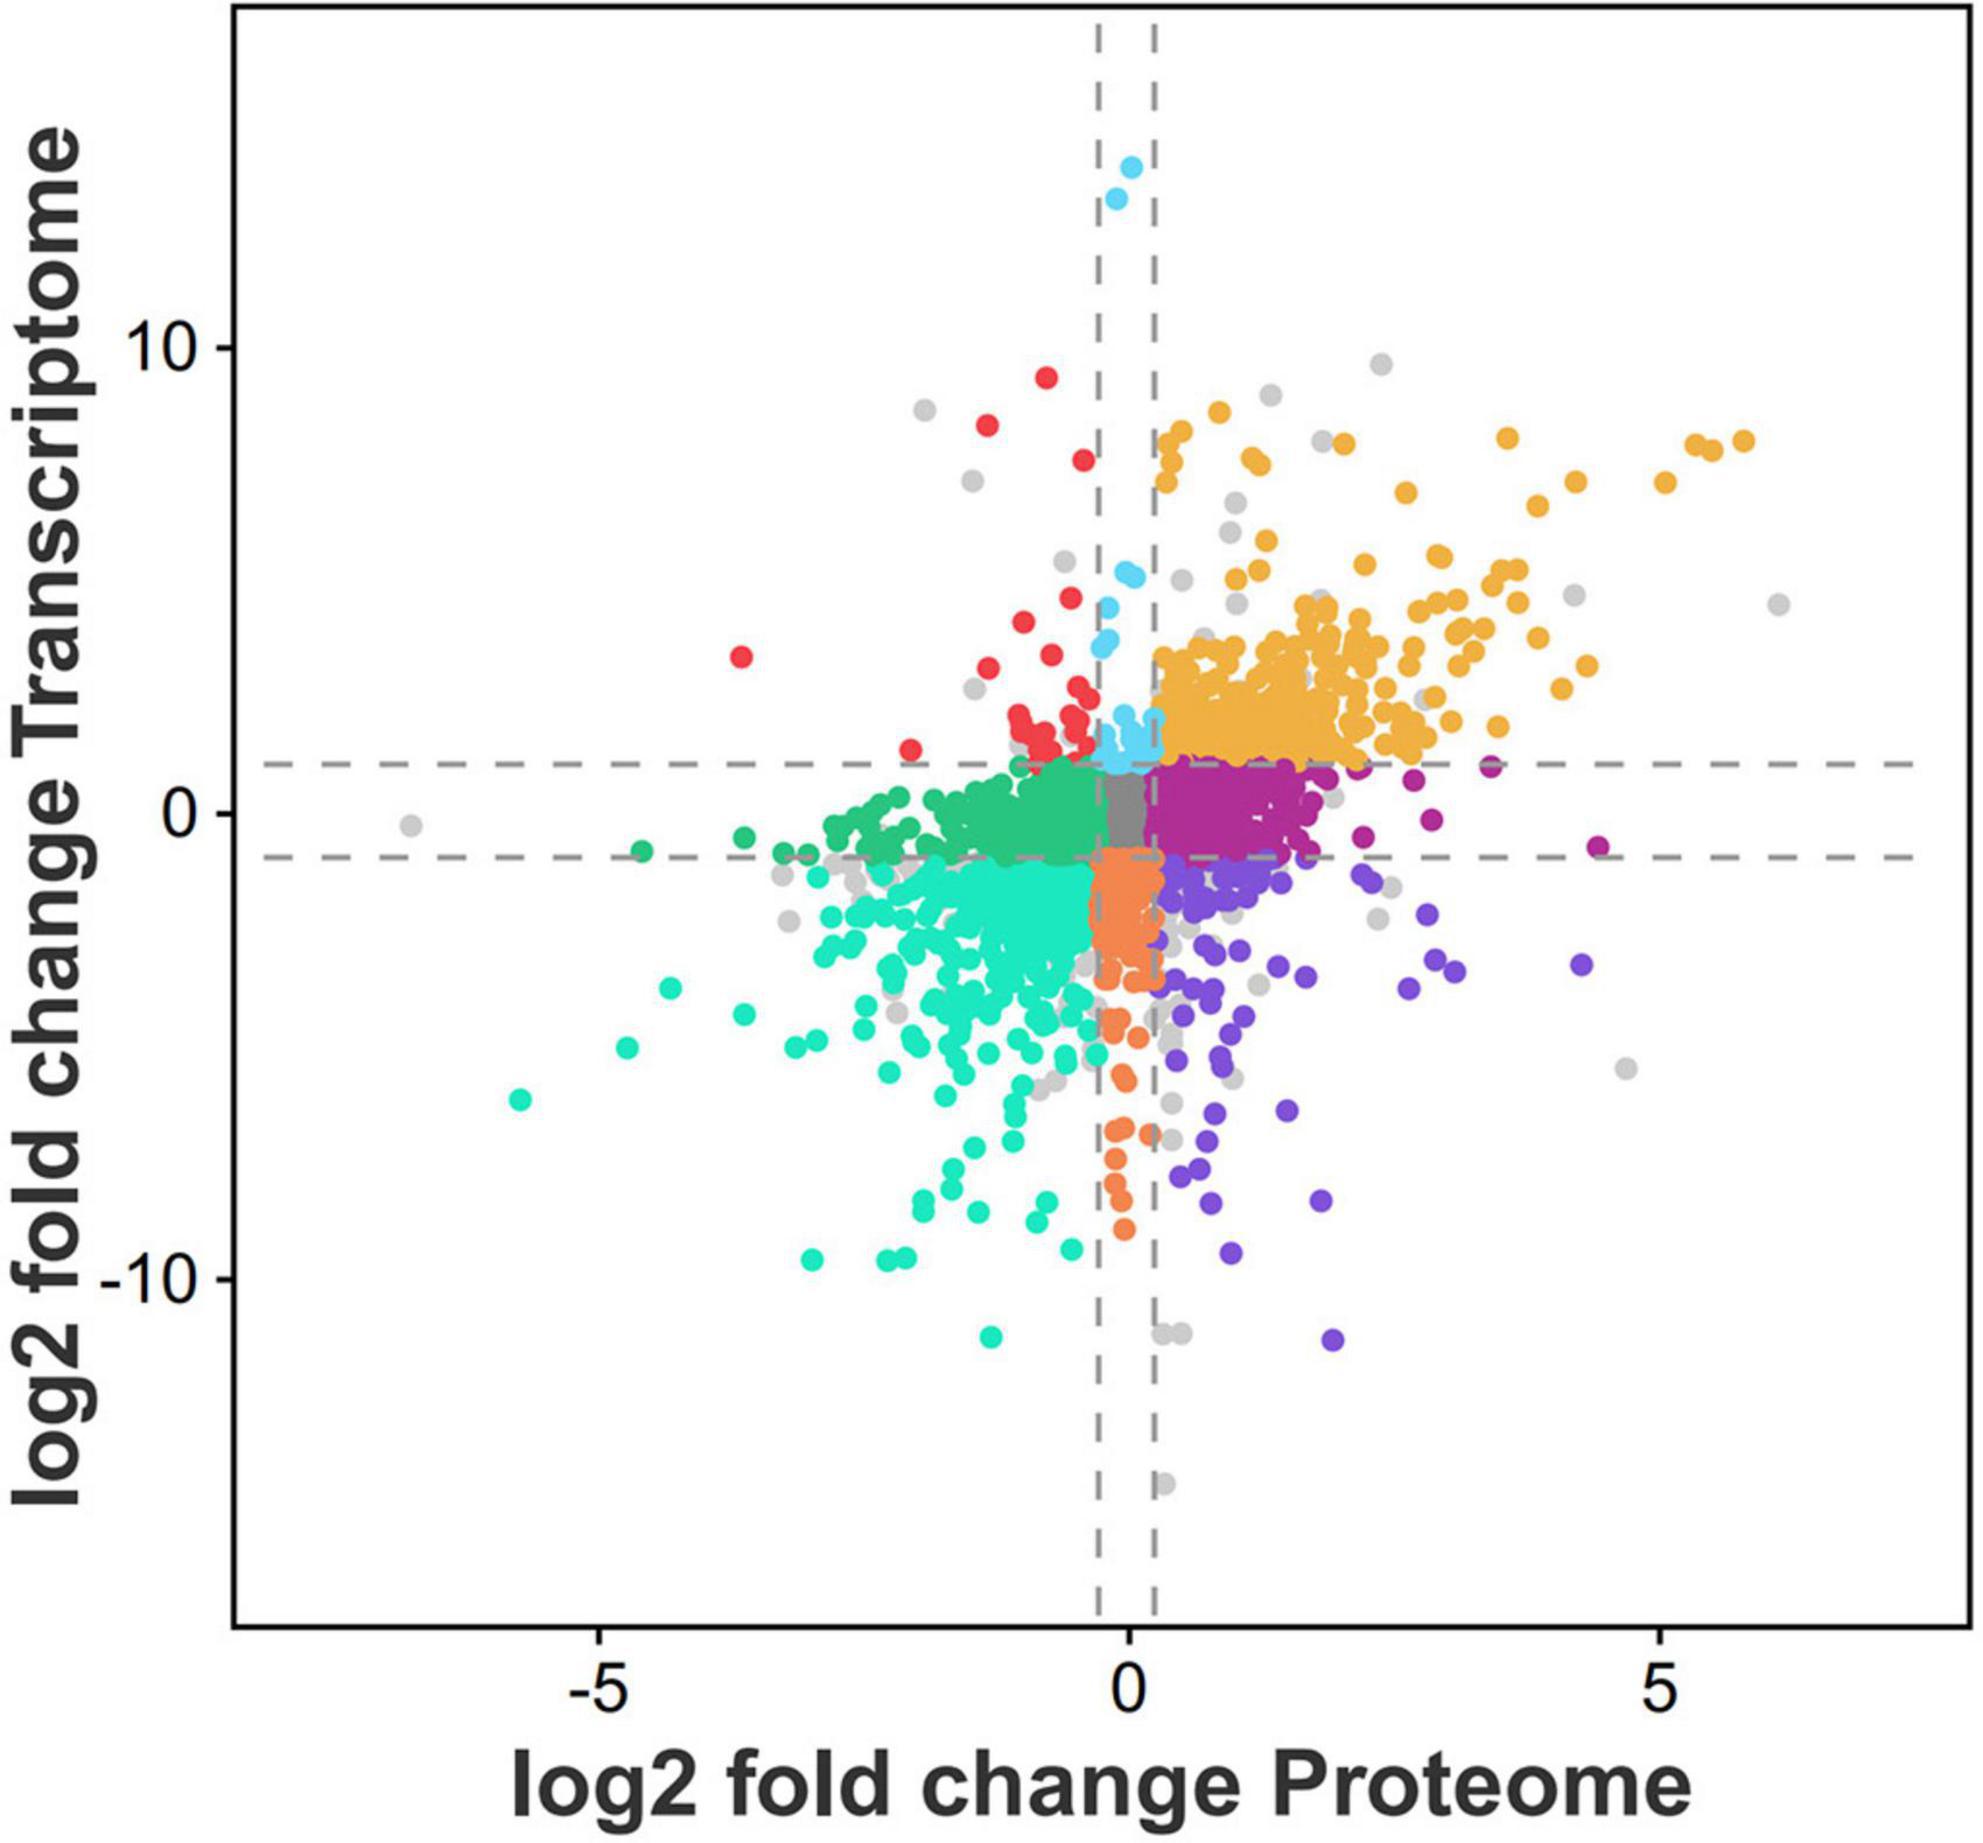
Figure 6. Nine quadrant map of common differential genes between transcriptome and proteome. The abscission is the log2 value of protein fold change, and the ordinate is the log2 value of transcriptome fold change. The dashed line represents the log2 value of the difference multiple specified in the difference analysis. In the figure, each colored point represents the collection of a class of genes, in which the colored points represent genes that meet the differential analysis threshold range (that is, meet the screening conditions for differential mRNA and differential protein), and the gray points represent genes that do not meet the analysis threshold.
Differential accumulation of SOD and CAT in two mango cultivars after Xcm inoculation
Transcriptome and proteome analyses showed that SOD and CAT constantly run through them. Thus, these antioxidant enzymes are significant for mango response to Xcm. Therefore, the activities of SOD and CAT in diseased mango fruits were determined at different time points (0, 2, and 6 days) (Table 1).
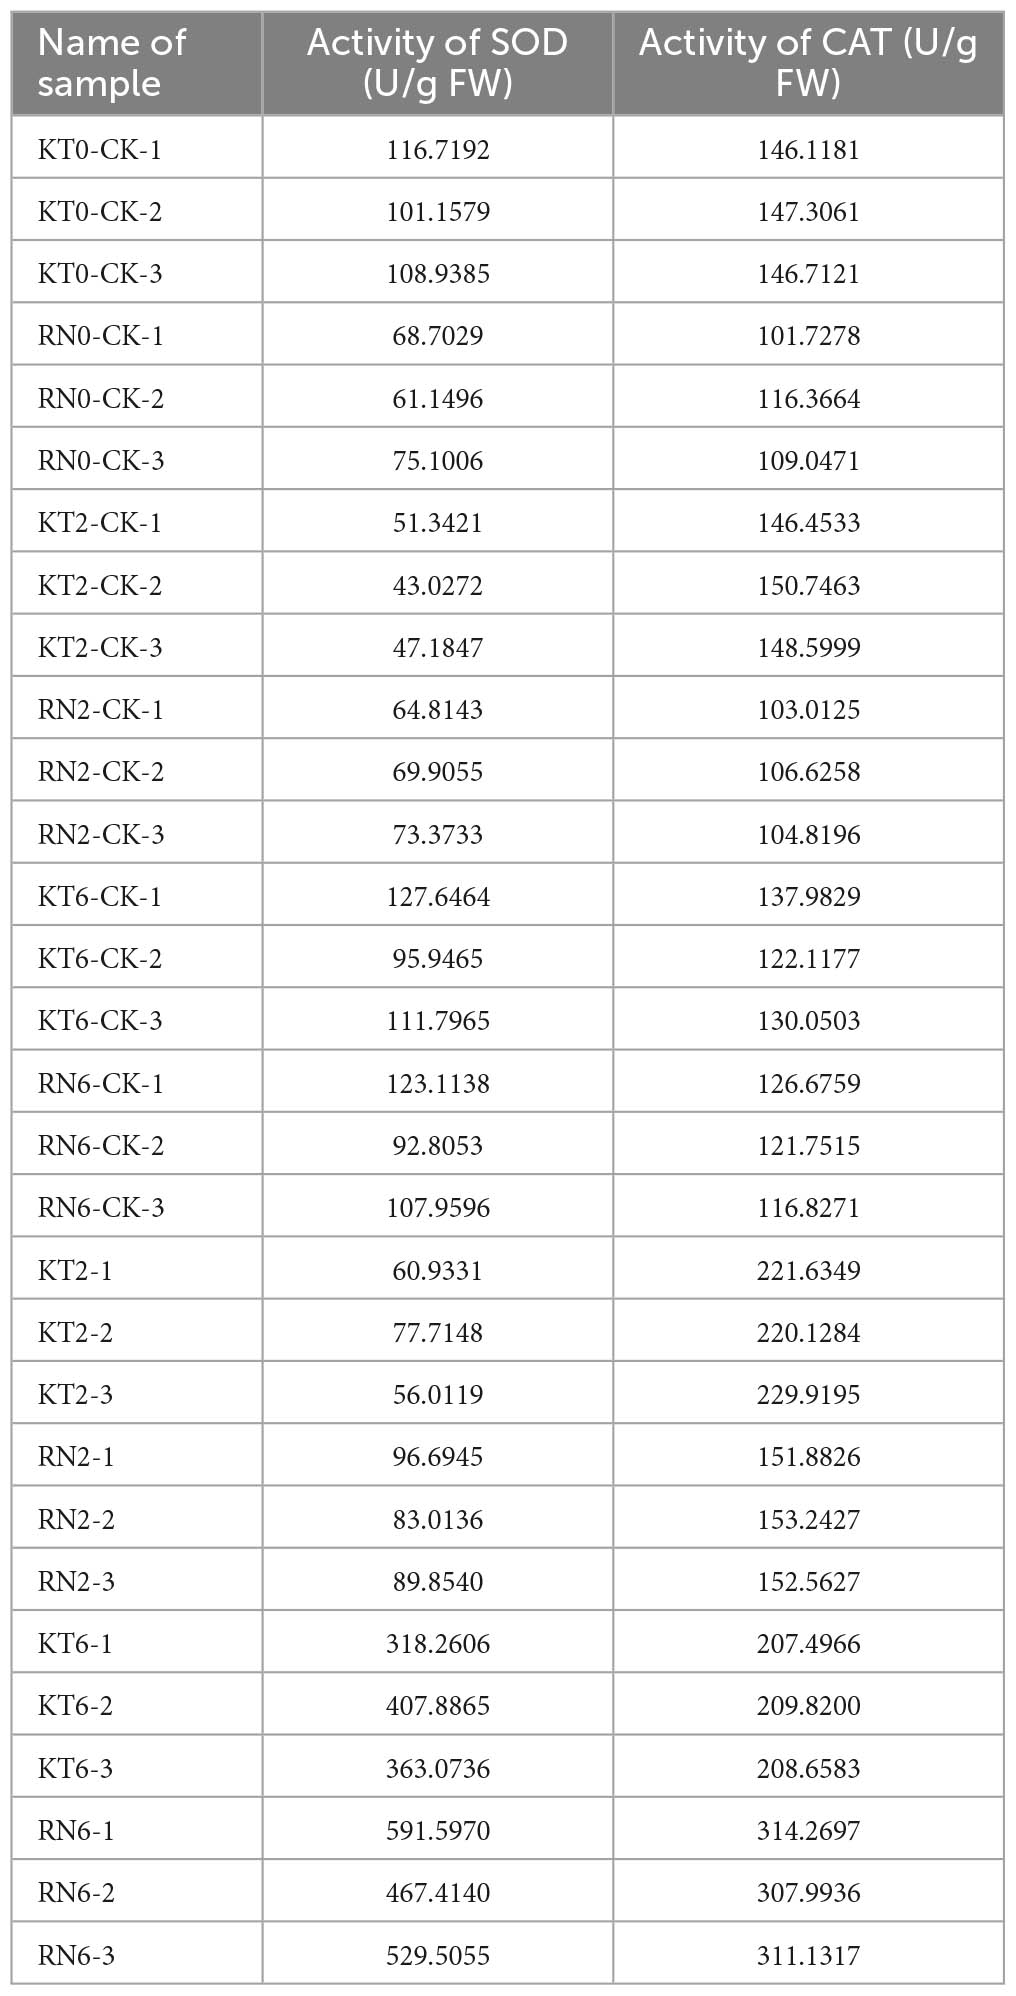
Table 1. Data statistics for CAT and SOD.
The results showed that SOD and CAT activities increased in both cultivars after Xcm inoculation at different times. In addition, significant differences (P-value < 0.0001) were observed in the changes of the same index among different varieties (Supplementary Figure 3). The results indicated that the two varieties may have different response mechanisms to Xcm stress.
Co-expressed genes/proteins by WGCNA
The interaction between plants and pathogens usually leads to the rapid accumulation of ROS in plants (Fichman and Mittler, 2021; Mittler et al., 2022). Several antioxidant enzymes play a key role in detoxification of ROS produced by plant stress response (Czarnocka and Karpiński, 2018). Therefore, we used WGCNA to screen the genes and proteins with the strongest correlation with SOD and CAT activity changes to further understand the co-expression relationship between KT and RN genes/proteins related to antioxidant enzymes. We selected the module with the highest Pearson r between the module and physiological and biochemical data as the key module. Removing the outlier grey module, in the gene co-expression network analysis, we observed that the brown and dark orange gene modules were most positively/negatively correlated with the SOD activity change pattern (brown: cor = 0.31, P-value = 0.1; dark orange: cor = −0.41; P-value = 0.02), containing 2,062 and 259 genes, respectively. The dark-orange and dark-turquoise gene modules were most positively/negatively correlated with CAT activity change patterns (dark orange: cor = 0.55, P-value = 0.001; dark-turquoise: cor = −0.45, P-value = 0.01). The dark-turquoise gene module contained 176 genes (Figure 7). In the protein co-expression network analysis, the dark-orange and grey60 modules exhibited the most positive/negative correlation with the change pattern of SOD activity (dark orange: cor = 0.28, P-value = 0.1; grey60 module: cor = −0.65, P-value = 9e-05), containing 217 and 180 proteins, respectively. The green-yellow and dark-gray modules had the most positive/negative correlation with CAT activity change pattern (green-yellow: cor = 0.28, P-value = 0.1; darkgray: cor = −0.56, P-value = 0.001), containing 261 and 131 proteins, respectively (Figure 8). KEGG pathway analysis showed that all three co-expressed gene modules were involved in “Glutathione metabolism,” which plays an important role in plant antioxidant and integrated detoxification functions (Bela et al., 2015). We also found 17 genes involved in “Peroxisome,” which is an important component of the plant antioxidant system, in the brown module (Yun and Kim, 2018). Next, we analyzed the co-expressed protein modules. The dark-orange module was annotated to “Metabolic pathways” and “Carbon metabolism,” grey60 to “Spliceosome” and “RNA degradation,” and green-yellow to “Flavonoid biosynthesis.” The dark-gray module was annotated to “Phenylpropanoid biosynthesis,” “Biotin metabolism,” and “Diterpenoid biosynthesis.” These findings indicate that the gene/protein modules are involved in different pathways to respond to Xcm invasion and may play an important role in maintaining cellular oxidative balance and biological regulation through these pathways.
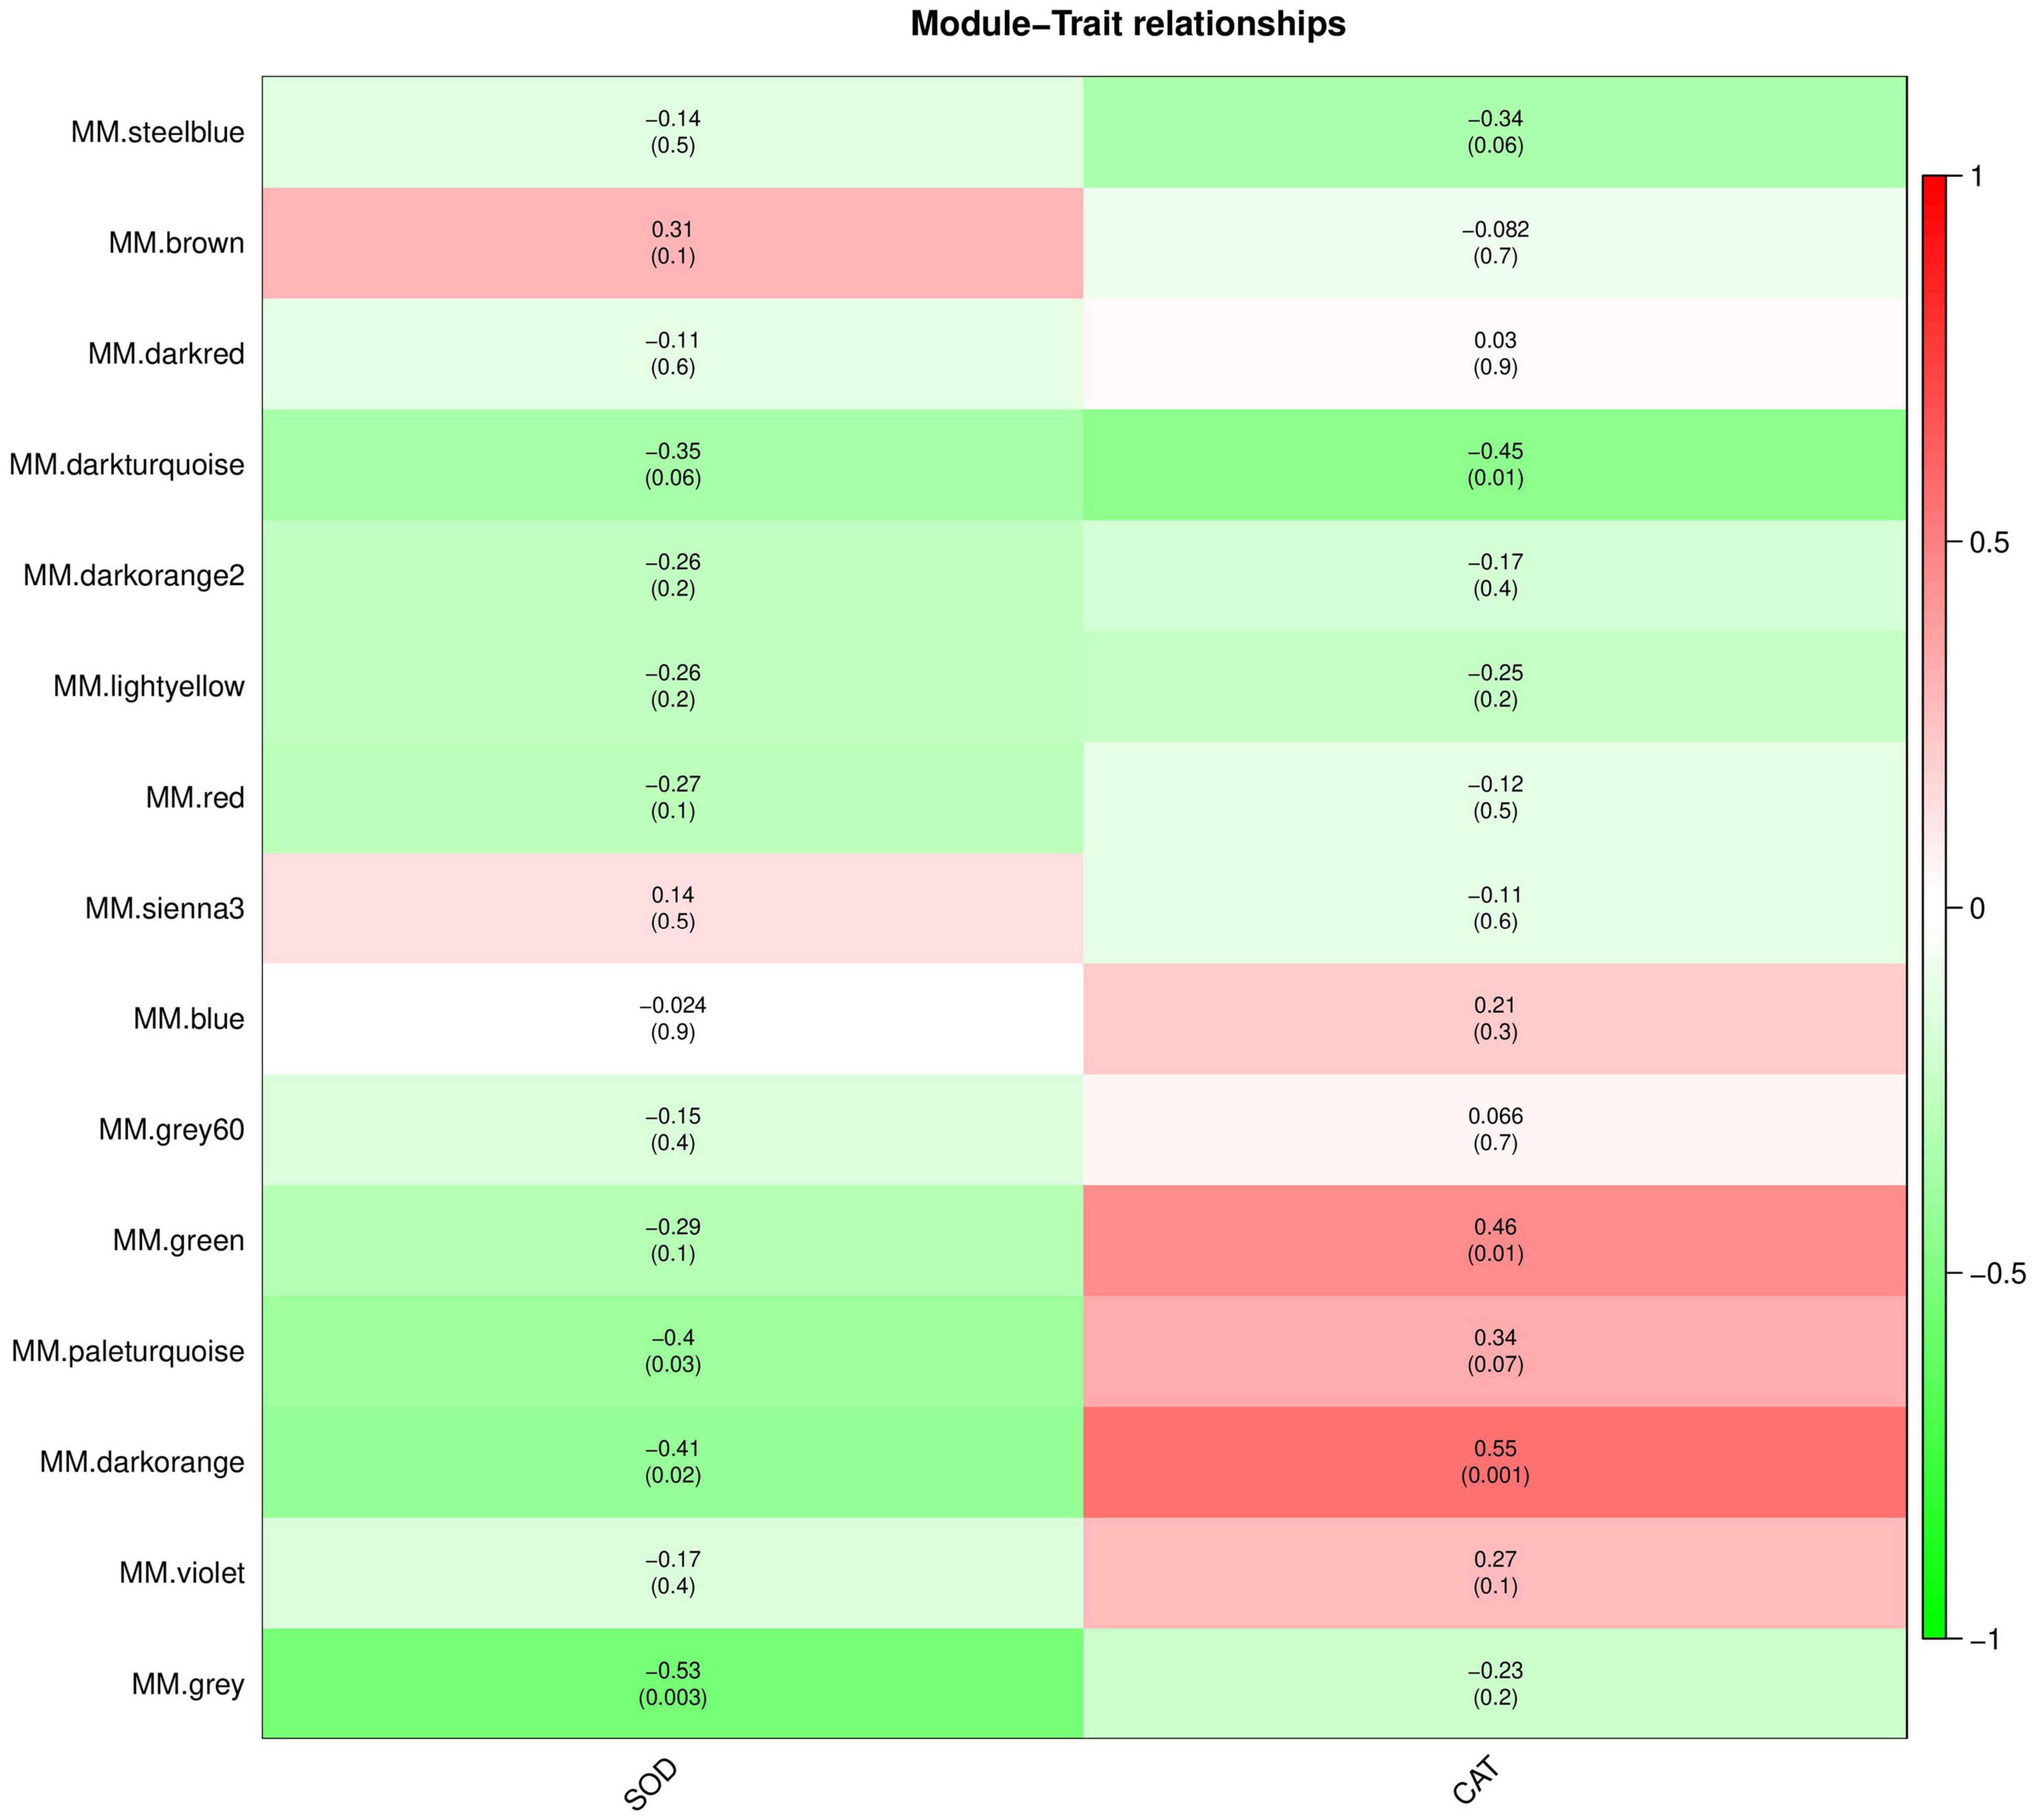
Figure 7. Module-trait relationships of co-expressed genes. The abscissa is the trait, the ordinate is the module, and the module eigenvalues and trait data are plotted using Pearson correlation coefficients. In the figure, red represents positive correlation, green represents negative correlation, and darker colors indicate stronger correlation.
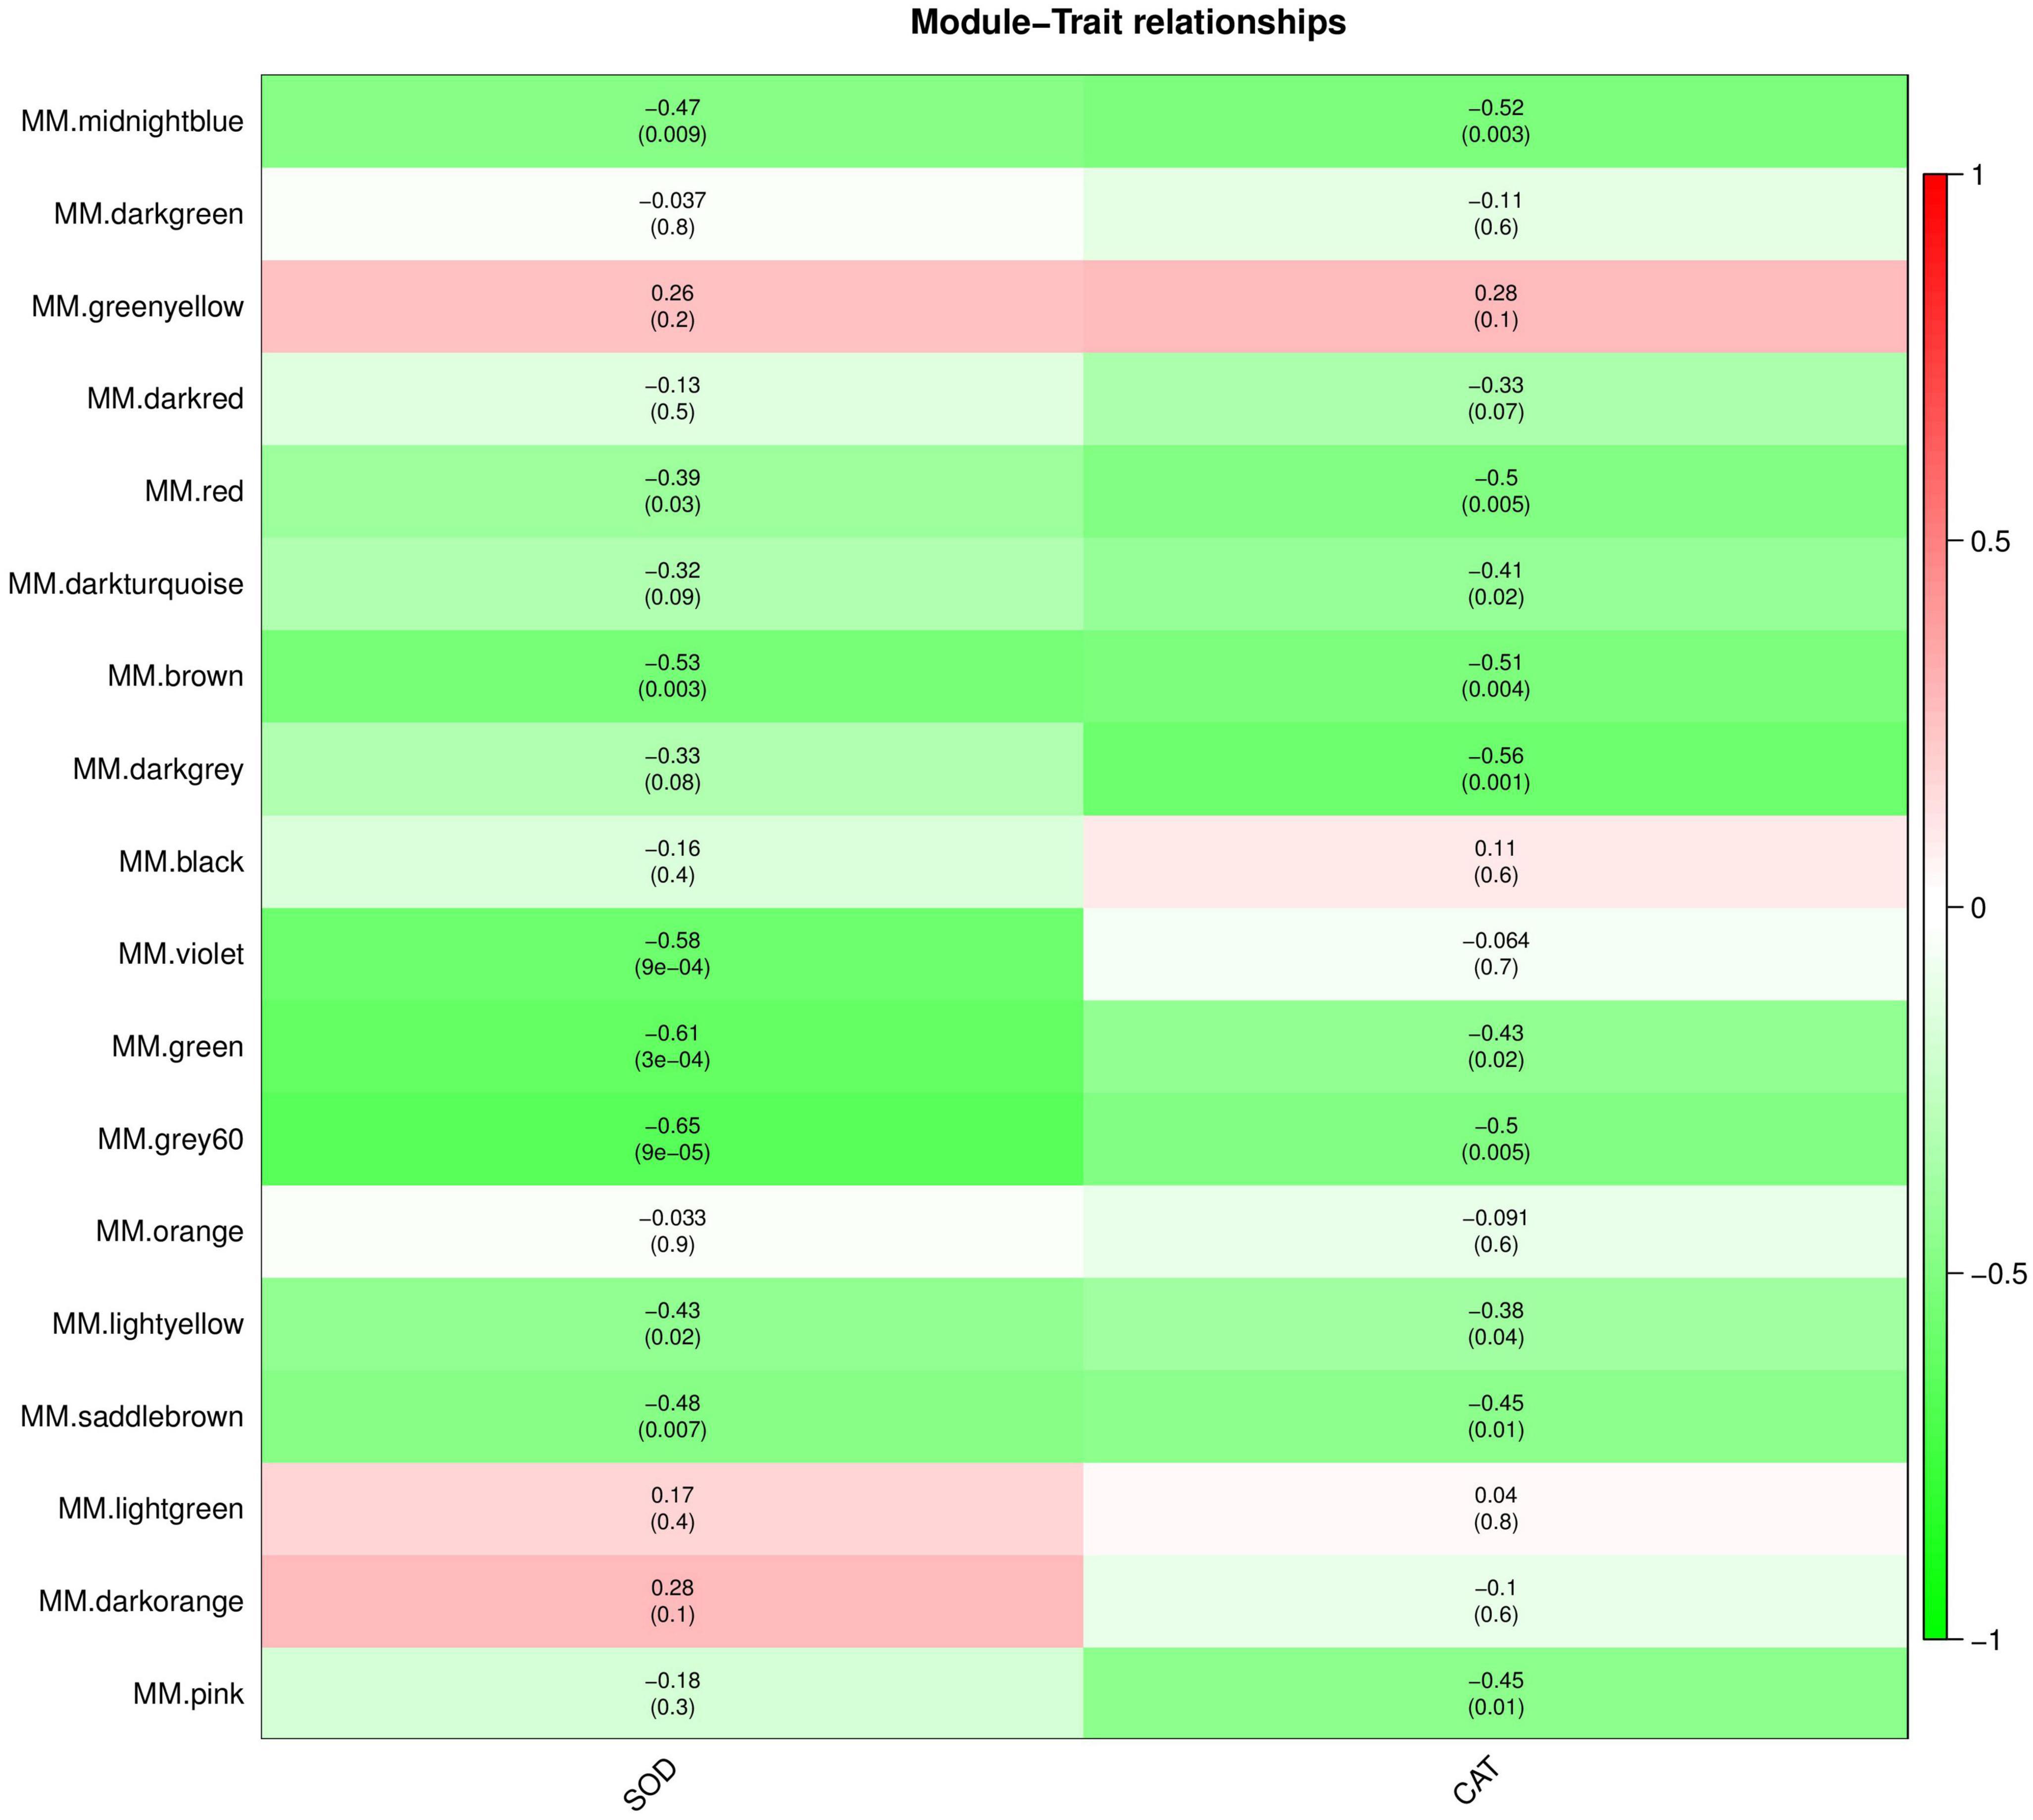
Figure 8. Module-trait relationships of co-expressed proteins. The abscissa is the trait, the ordinate is the module, and the module eigenvalues and trait data are plotted using Pearson correlation coefficients. In the figure, red represents positive correlation, green represents negative correlation, and darker colors indicate stronger correlation.
Comparison of WGCNA results identified 58 co-expressed genes/proteins at the mRNA and protein levels. A total of 58 genes were compared with the DEGs identified in this study (Table 2). Exactly 20 and 19 DEGs were detected in KT and RN, respectively, of which 8 were dysregulated in RN (Table 3). Compared with DEPs, 31 proteins were differentially expressed in two mango cultivars; 13 and 11 of these proteins were differentially expressed in KT and RN, respectively, and 5 were dysregulated in RN (Table 4). These results indicate that differential genes/proteins may interact with non-differential ones. These proteins are not only related to mango antioxidant and certain biosynthesis but also may be related to mango disease resistance.
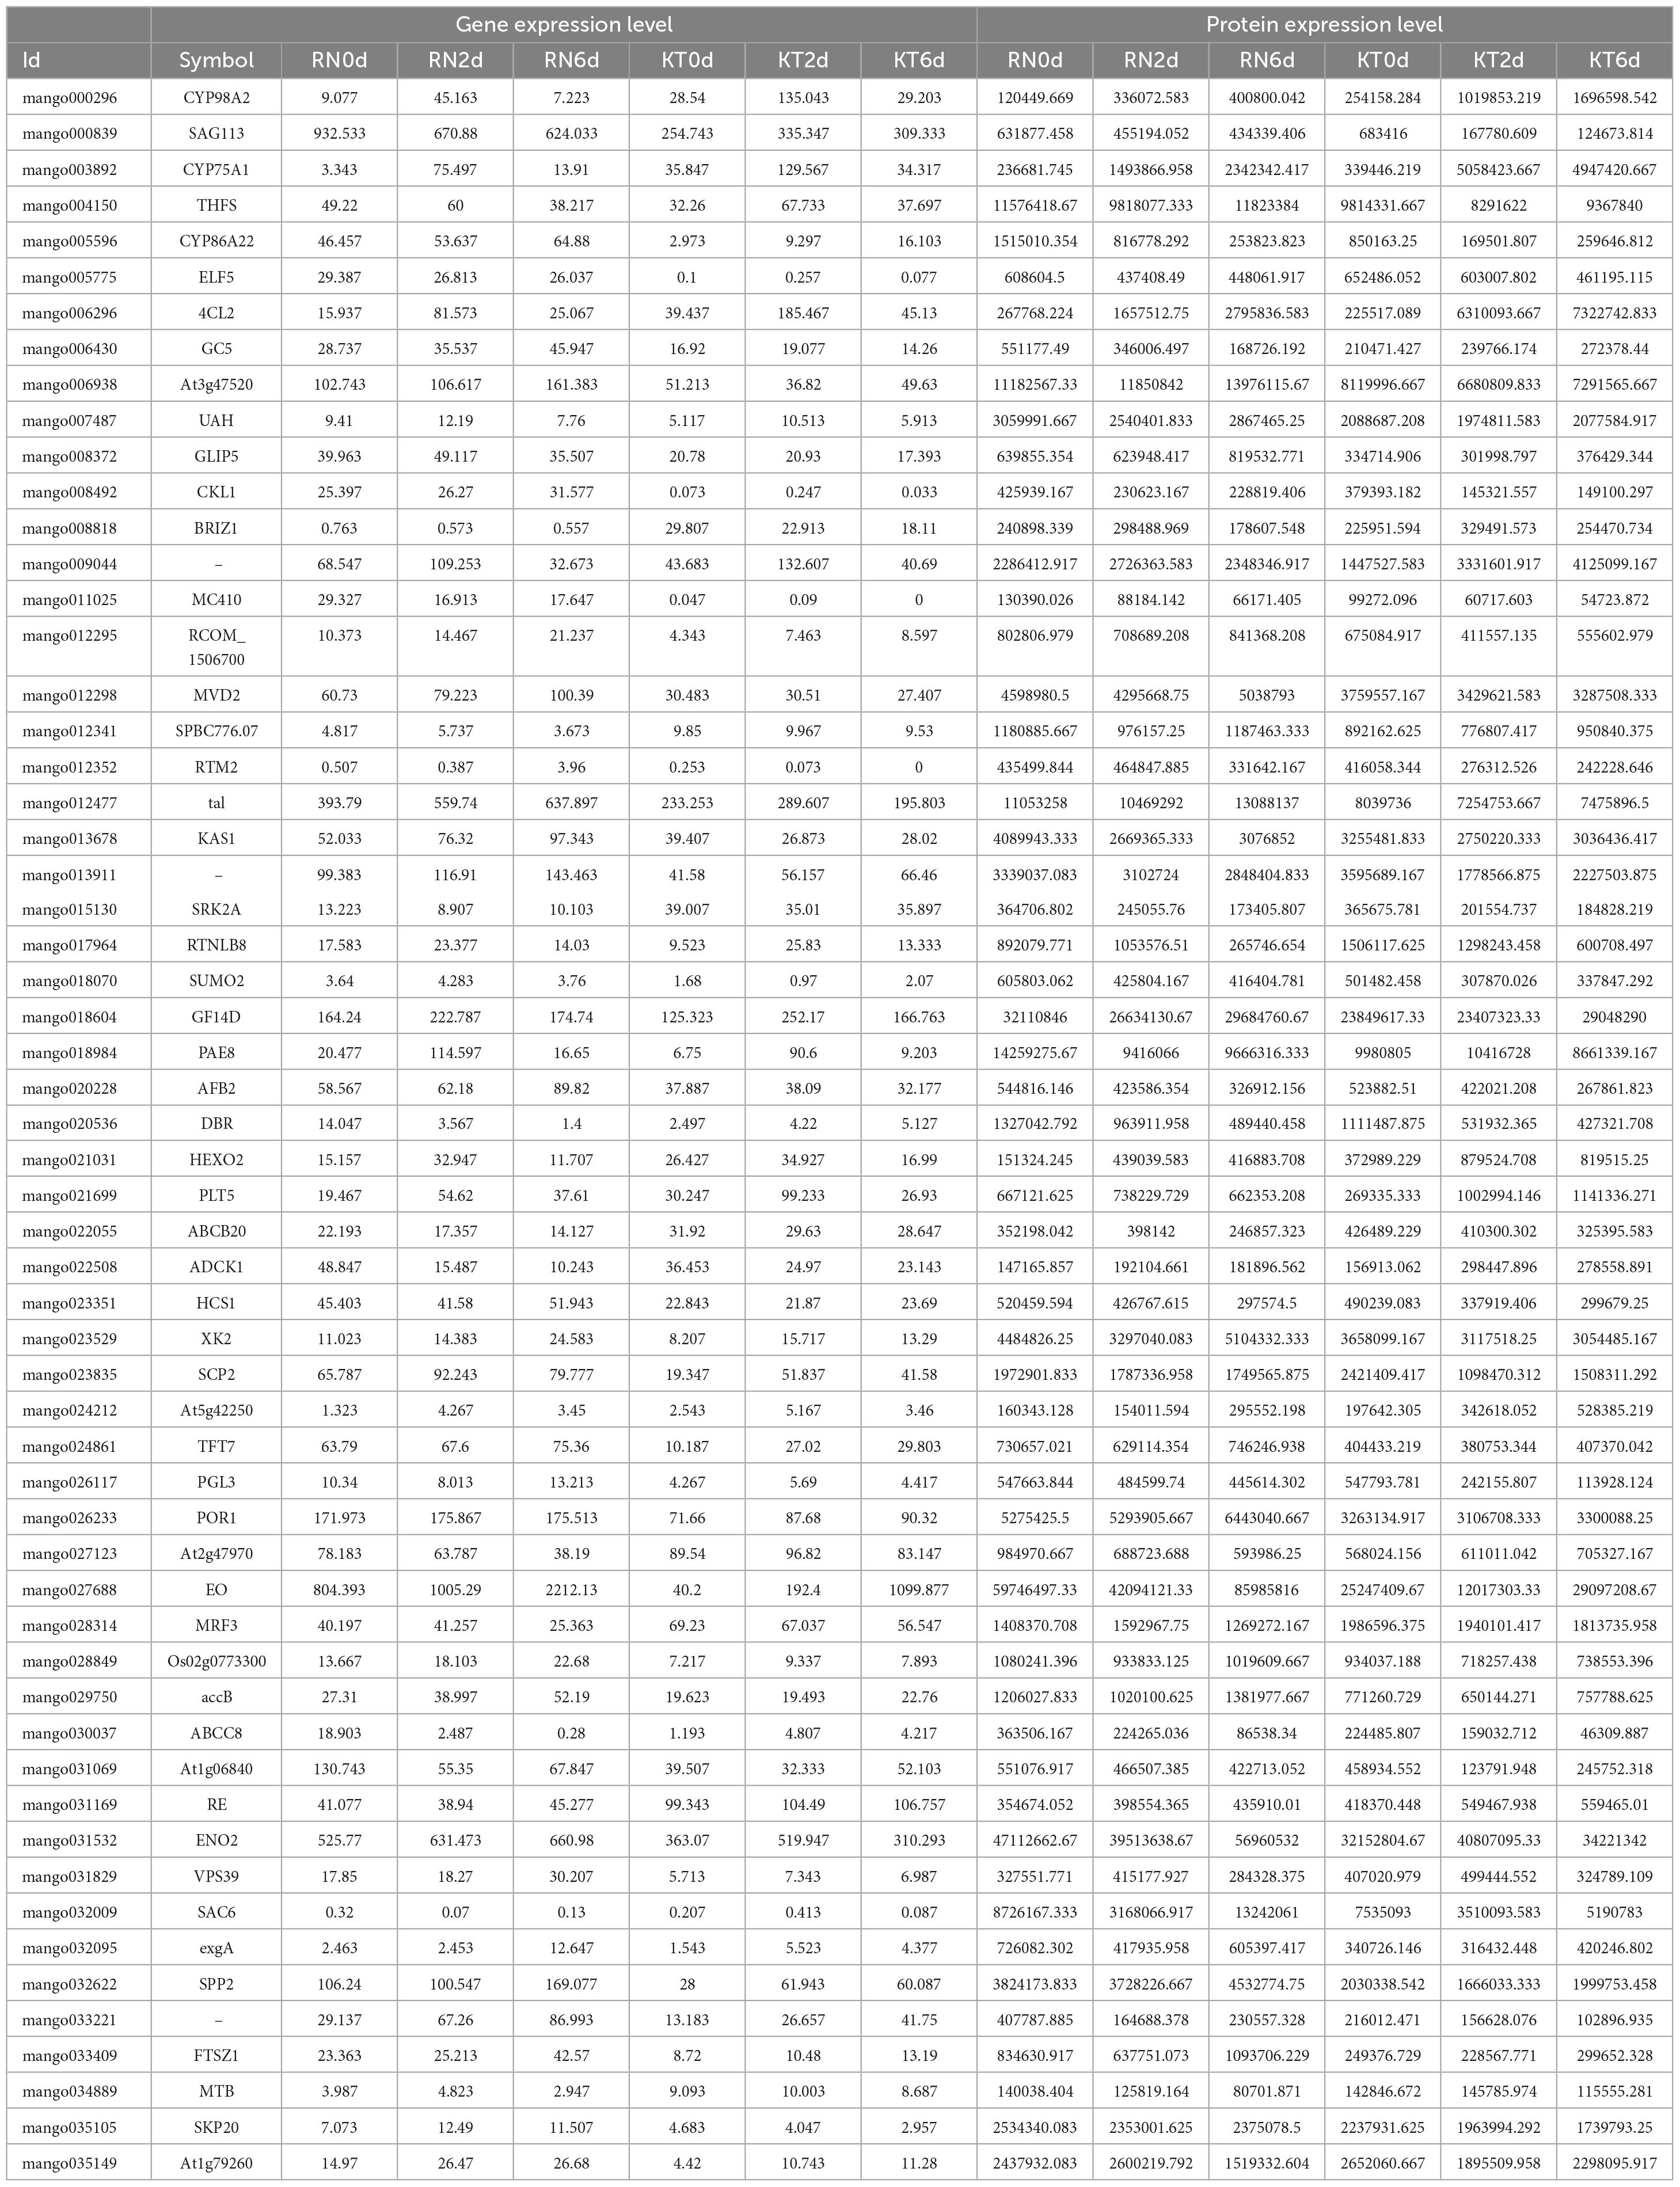
Table 2. A total of 58 co-expressed genes and proteins were identified by WGCNA results.
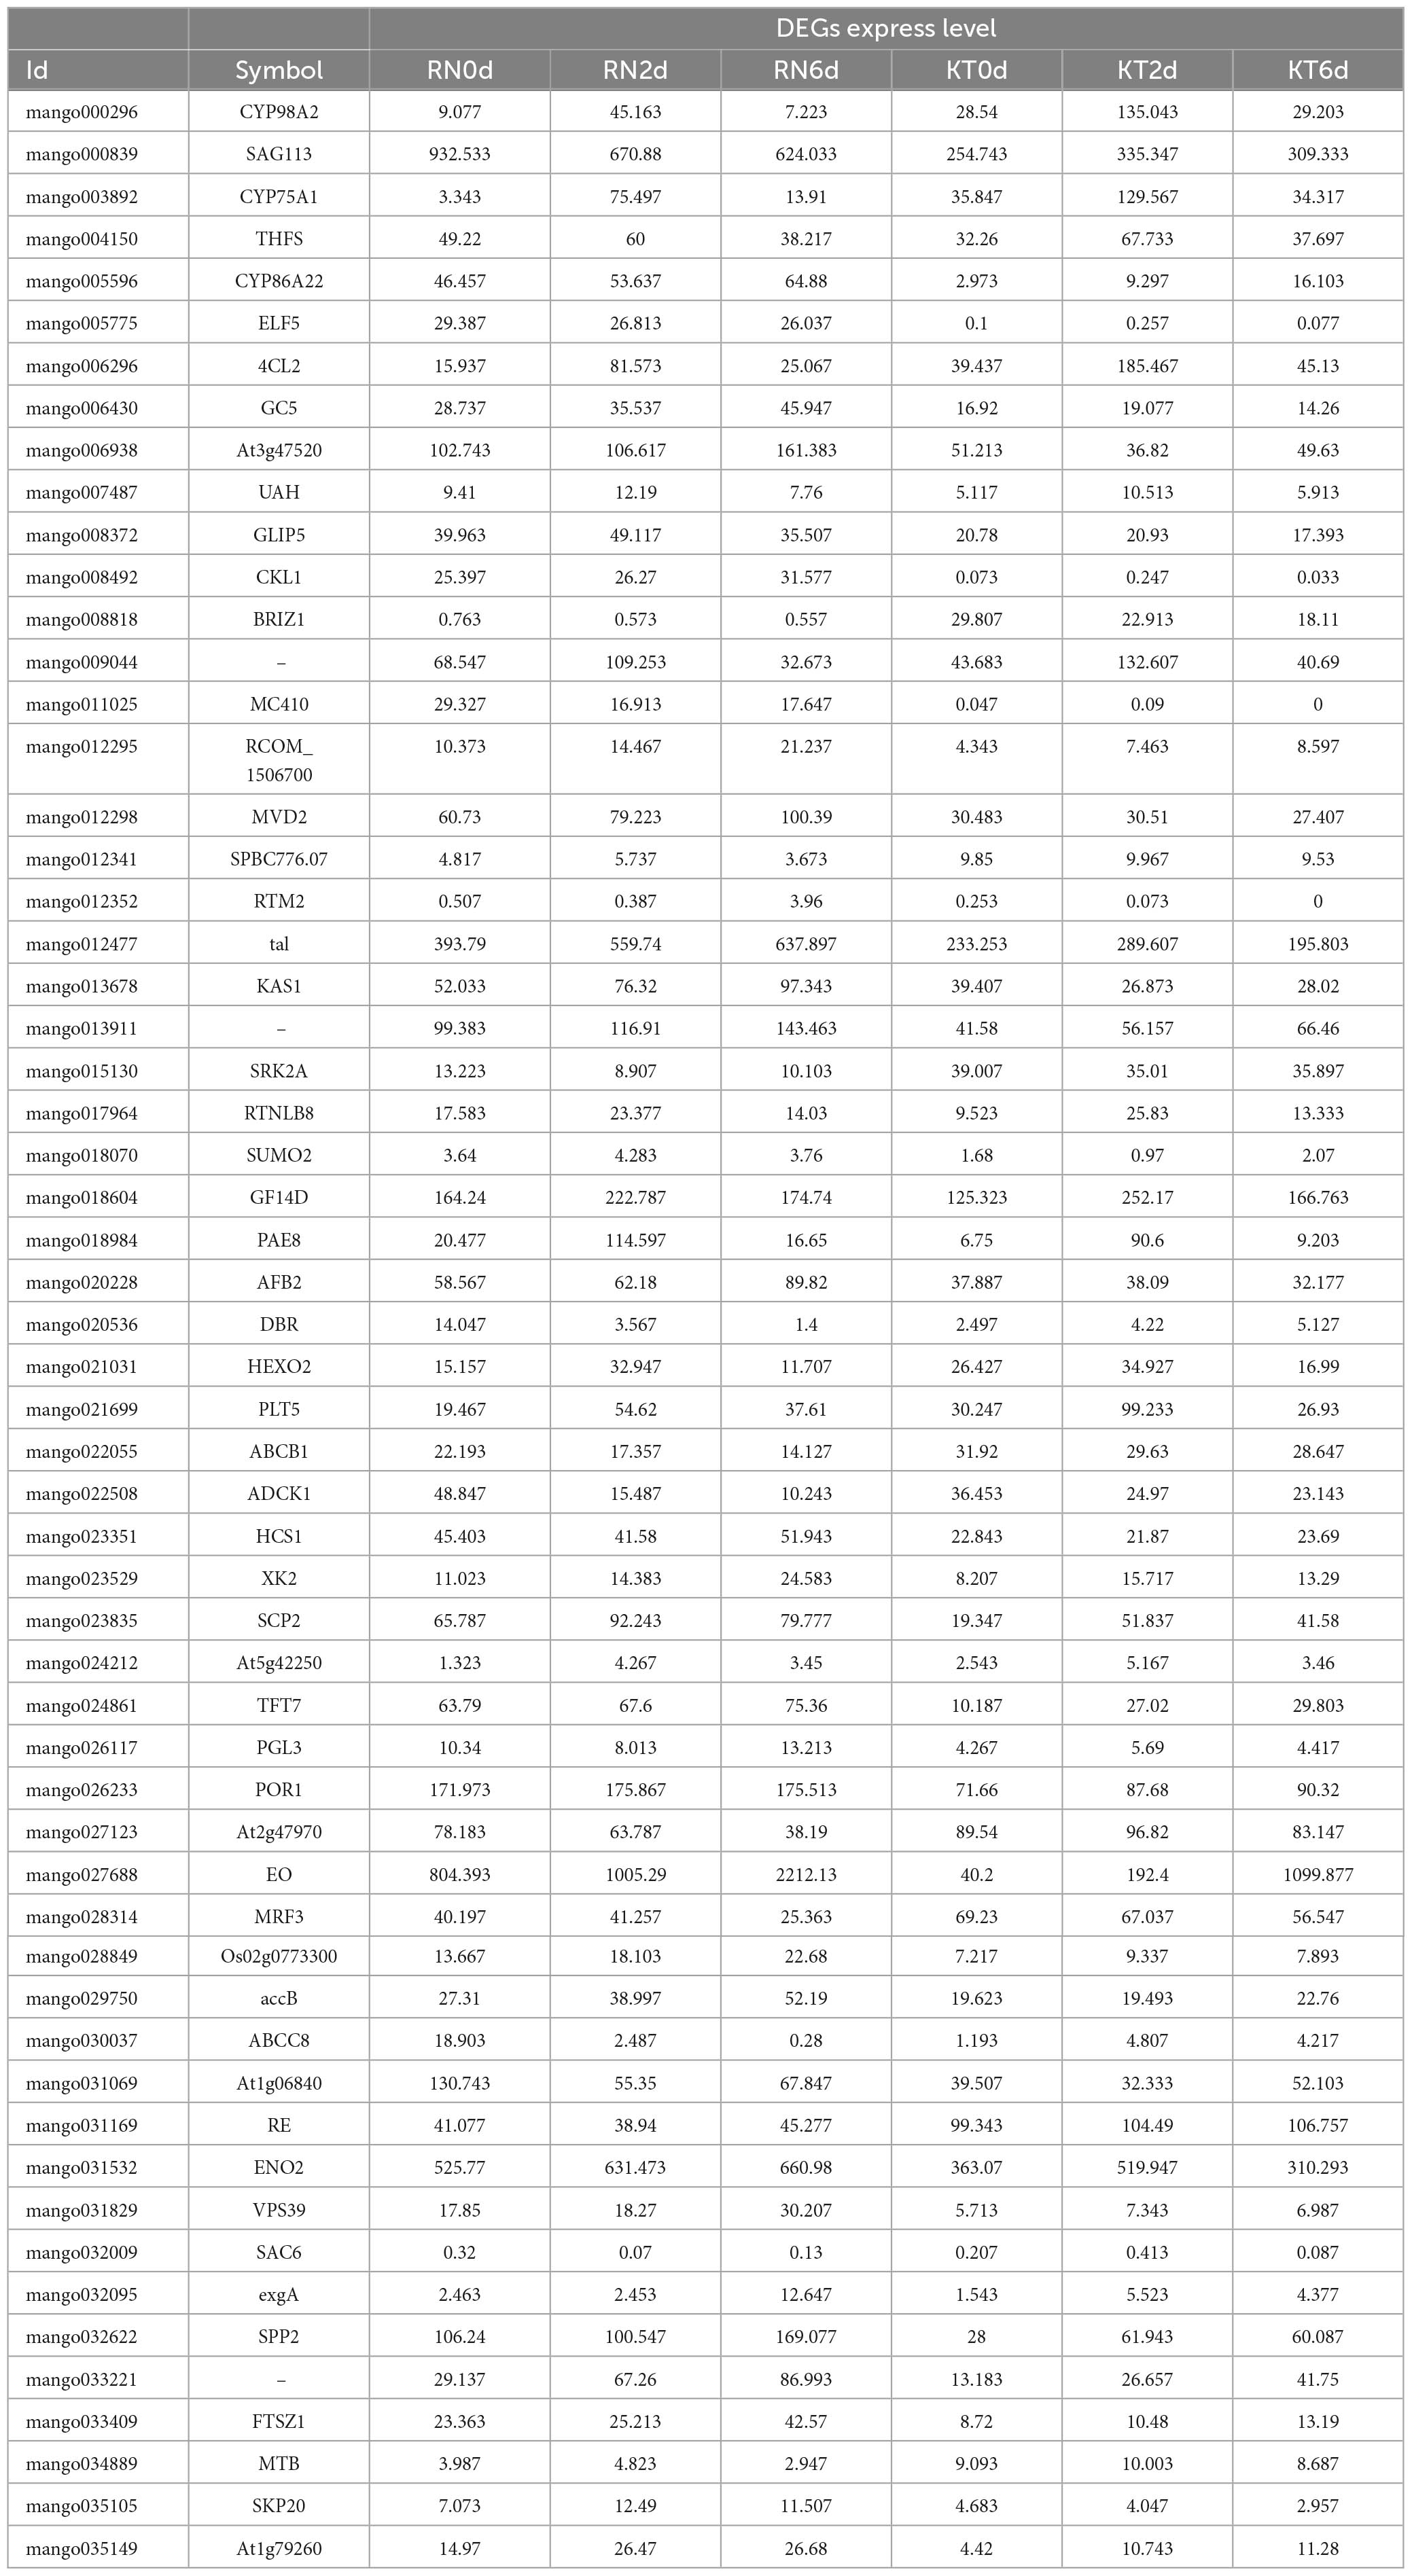
Table 3. A total of 58 DEGs screened by WGCNA.
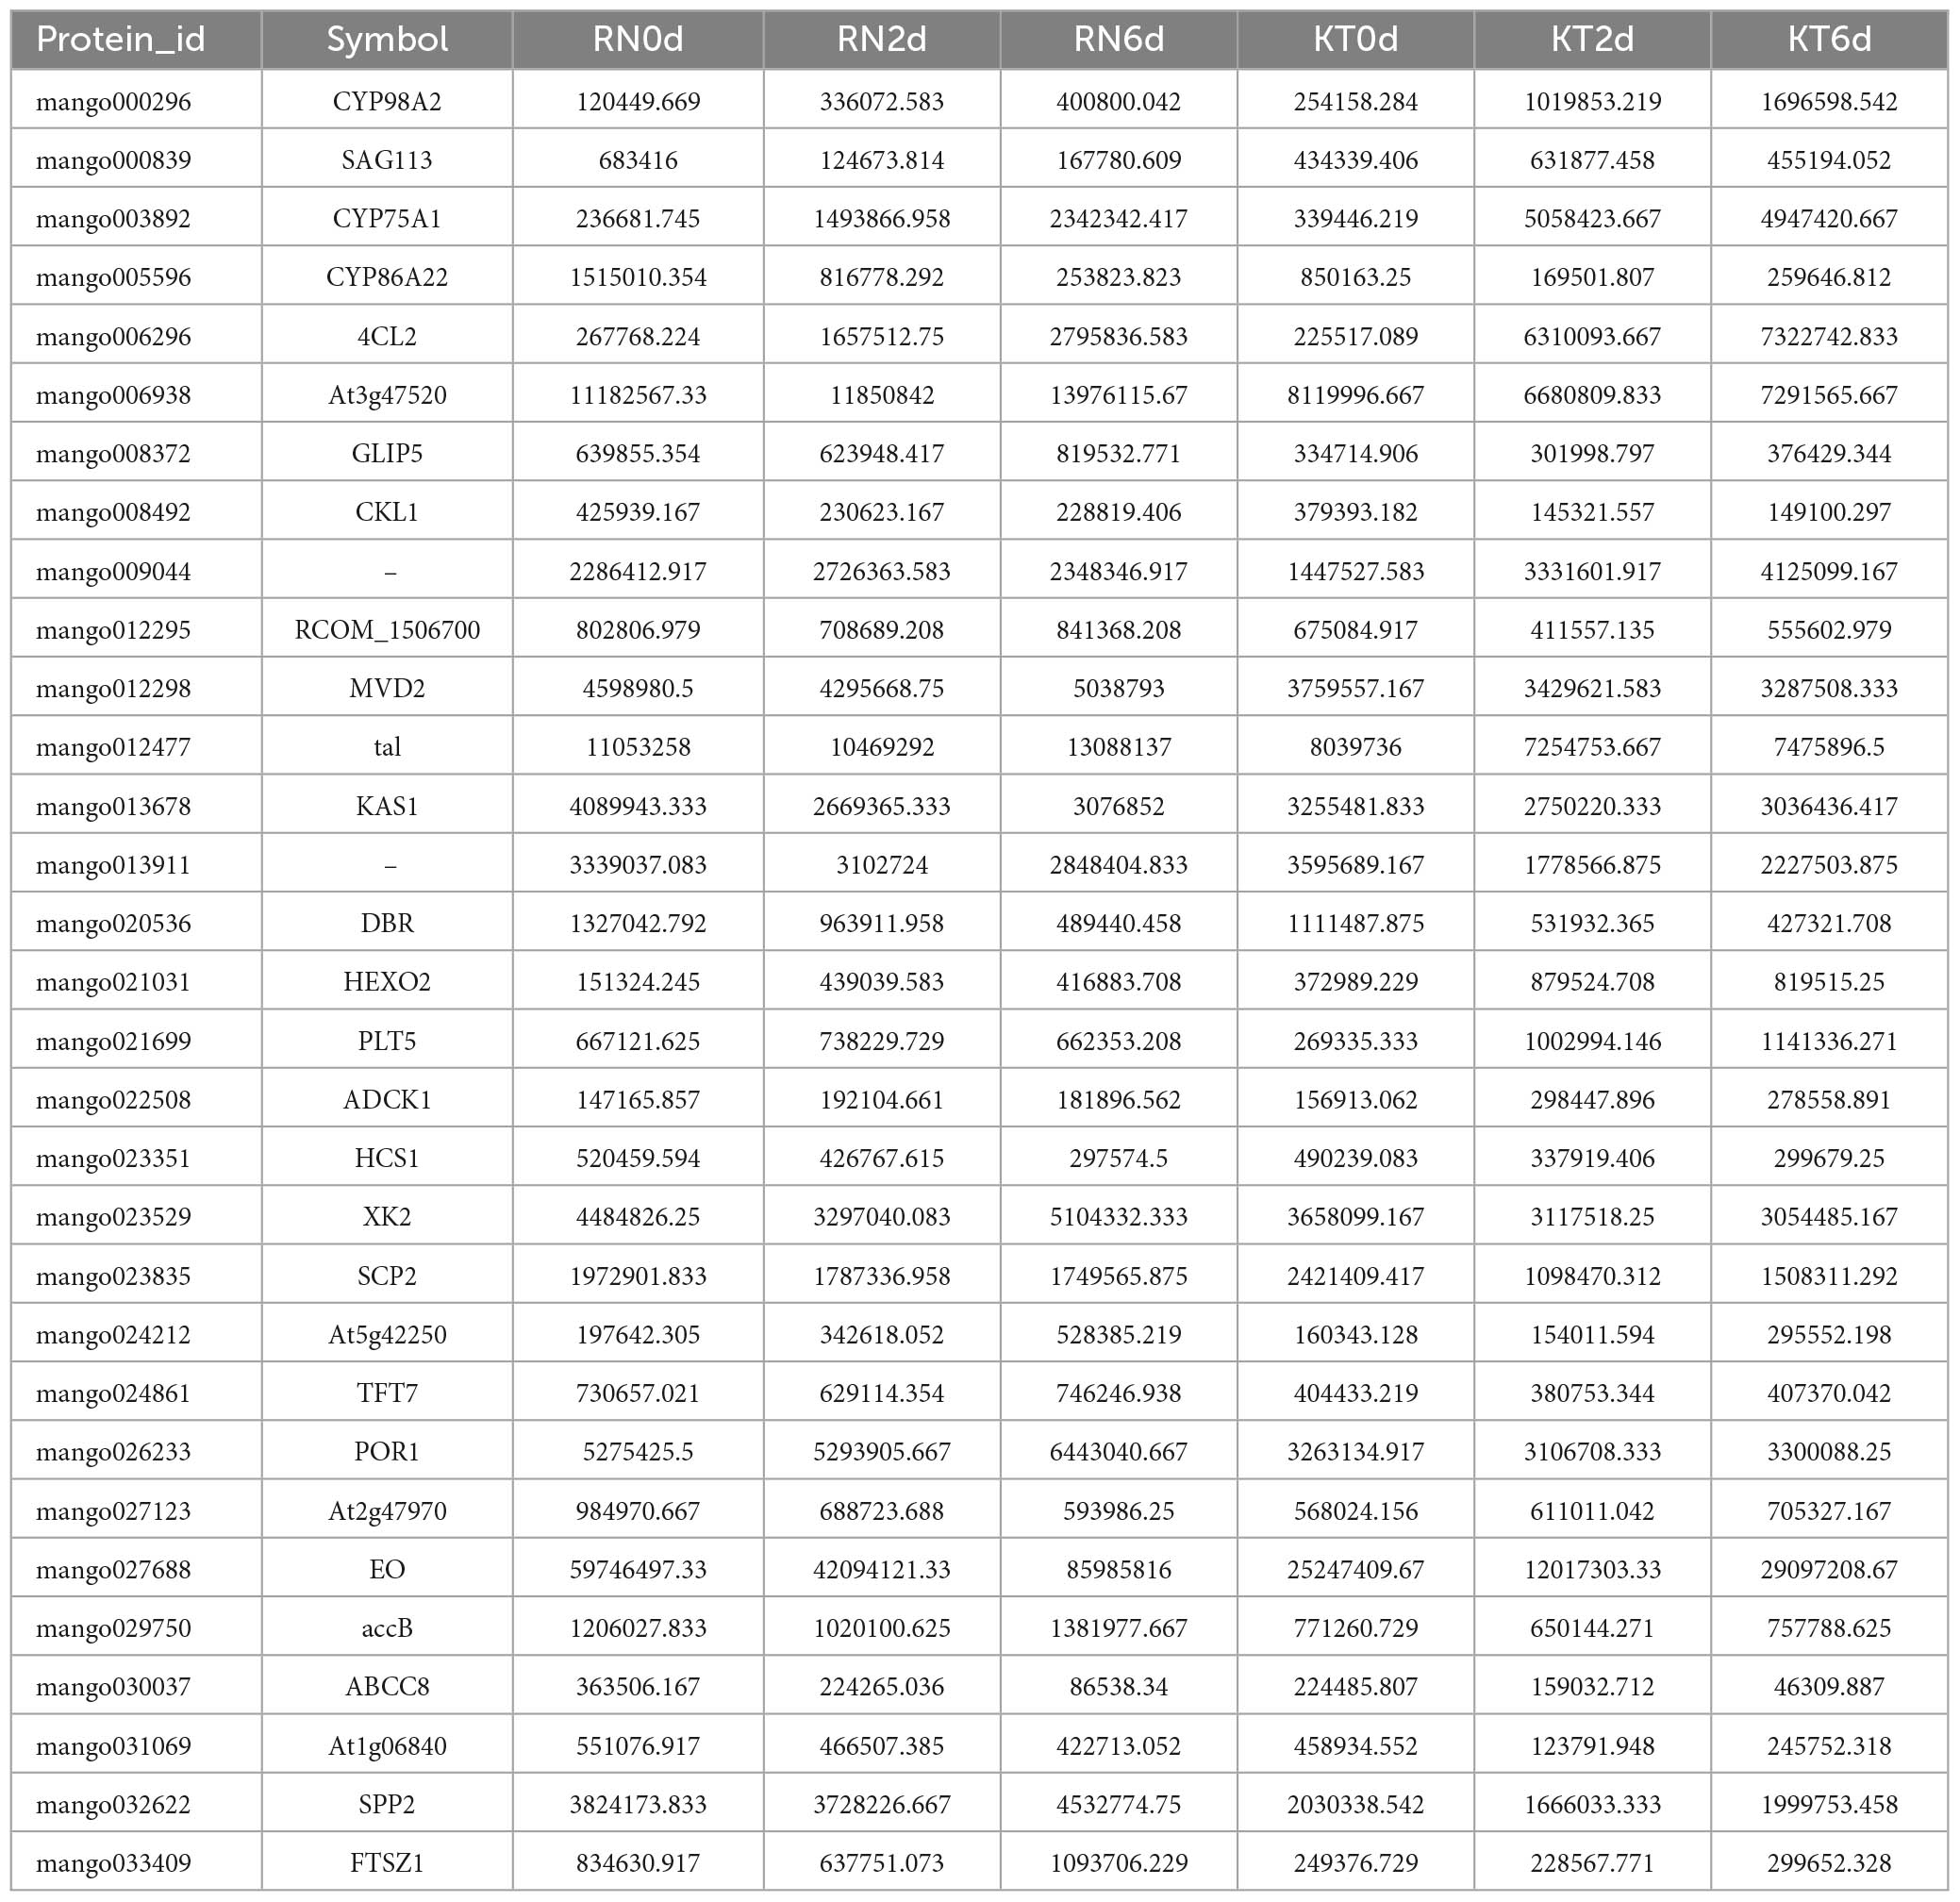
Table 4. A total of 31 DEPs screened by WGCNA.
Among the DEGs obtained in WGCNA, three are related to plant hormone signal transduction (SAG113, SRK2A, and ABCB1). One gene, which was annotated as GSH dehydrogenase (At5g42250), is related to the regulation of redox homeostasis in plant cells and involved in GSH metabolism. One protein (SAG113) related to plant hormone signal transduction and one (At5g42250) regulating cell redox homeostasis were also found in the 31 DEPs obtained in WGCNA. Notably, two DEPs, namely, SAG113 and At5g42250, ran through the transcriptome and proteome of the study and were annotated to GSH metabolism and plant hormone signal transduction. Thus, these pathways may be important means for mango resistance to Xcm.
Real-time polymerase chain reaction validation
We performed real-time polymerase chain reaction analysis of three plant hormone-related DEGs/DEPs obtained by WGCNA to validate the RNA-seq results, and these genes showed different expression patterns at 0, 2, and 6d. The expression patterns of these genes obtained by qRT-PCR largely confirmed the transcriptome data (Supplementary Figure 4).
Discussion
In our study, RNA-seq and DIA techniques were used to holographically identify the changes in mRNA and protein levels in mango at different stages of Xcm infection. A total of 28,704 RNA data and 12,877 protein information were obtained. After differential analysis, 14,397 DEGs and 3,438 DEPs were obtained, and a large number of differential genes were shared between the two varieties of mango. This paper focused on DEGs/DEPs involved in redox homeostasis regulation and plant hormone signal transduction in mango cells. Given the great contribution of SOD and CAT in plant oxidative stress, we analyzed the correlation between the changes in SOD and CAT levels and changes in transcriptome and proteome in mango to explore the important genes related to trait indicators.
Photosynthesis, GSH metabolism, and peroxisomes play important regulatory roles in plant cell redox homeostasis during plant resistance to pathogens. Photosynthesis is an important source of ATP and carbohydrates in plants. A series of genes involved in photosynthesis can participate in the production and signal transduction of plant hormone signaling molecules, such as ABA, ETH, IAA, GA, etc., and the production and signal transduction of non-hormone signaling molecules. PSI and PSII are the main sources of ROS production and play a crucial role in the balanced synthesis of ROS and NO (Apel and Hirt, 2004; Asada, 2006; Del Río, 2015; Lu and Yao, 2018). In mango, more than 80% of DEGs and DEPs involved in PSI and PSII were generally up-regulated in KT and RN. However, the change in RN was always negligible, and that of related genes in KT continuously increased (Table 5). The general imbalance of photosynthetic genes may hinder the stability of photosynthesis in susceptible plants; it was also encountered in chickpeas infected with F. oxysporum f. sp. ciceri race 1 (Bhar et al., 2017) and Cucurbita ficifolia Bouché infected with Fusarium oxysporum f. sp. cucumerinum. In addition, DEGs FD3 and Os07g0147900, which were annotated as Fd, were up-regulated in RN and down-regulated in KT, and DEPs, including FD3, SIR1, and FTRC, were annotated as Fd and up-regulated in RN and KT. However, the change in RN was more significant.
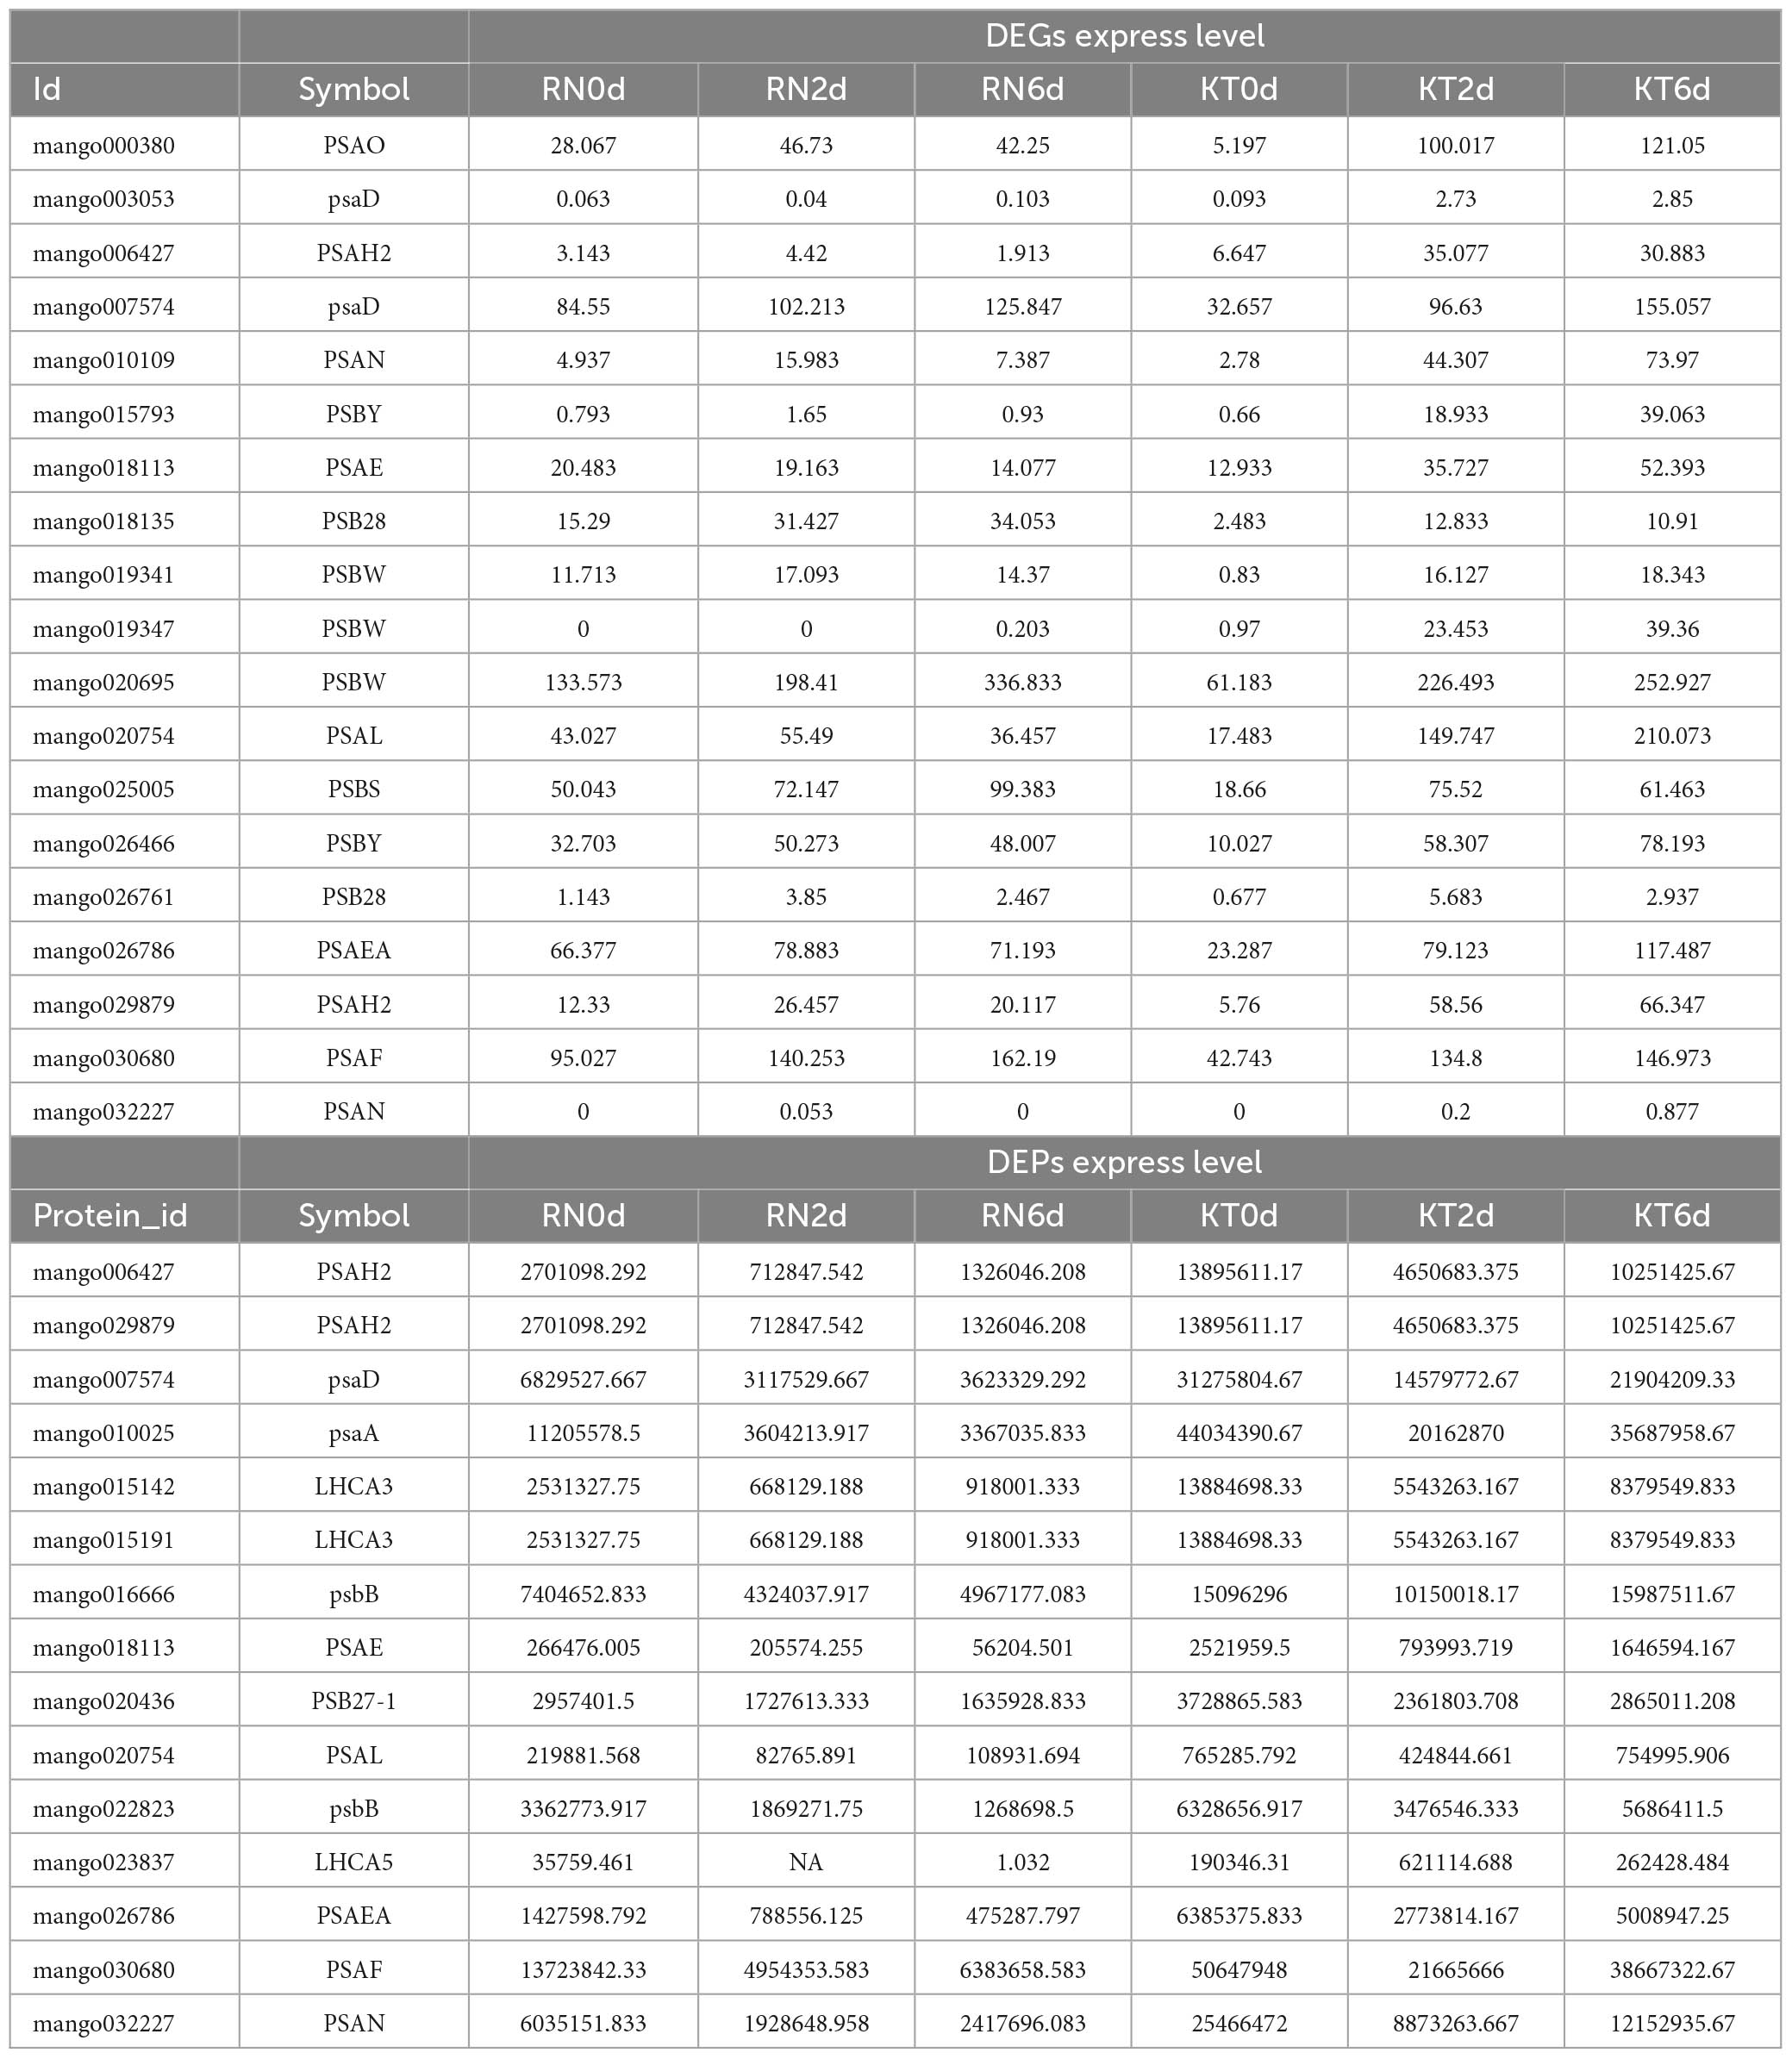
Table 5. DEGs and DEPs in photosystem 1 and photosystem 2.
The plant-type redox system composed of Fd-NADP (+) reductase and its redox partner Fd can play an important role in plant-pathogen interaction (Iyanagi, 2022). Fd can interact with the HC-Pro protein of sugar cane mosaic virus (SCMV) in maize infected with SCMV and may interfere with the post-translational modification of Fd in the chloroplast of maize sheath cells, which will disturb chloroplast structure and function (Cheng et al., 2008). Fd may activate hypersensitivity related events, such as H2O2 accumulation, through the recognition of interacting proteins in mango to enhance the plant’s resistance. Overexpression of Fd also enhances the resistance of Arabidopsis (Ger et al., 2014), sweet pepper (Dayakar et al., 2003), and tobacco (Huang et al., 2007).
Glutathione metabolism is the metabolic process of gamma-glutamyl-cysteinyl-glycine (GSH) in plants. GSH is an antioxidant that can resist free radical damage, support the dynamic relationship with ROS, redox regulation, and signal transduction, and protect cells from external factors (Diaz-Vivancos et al., 2015; Noctor et al., 2023). GSH activates the potato defense system by reducing potential damage to host cells in Potato virus Y NTN medical record system, which results in reduced virus concentration and limits systemic infection of potatoes caused by oxidative stress (Otulak-Kozieł et al., 2022). In our study, 81 genes were involved in GSH metabolism, of which 20 genes, such as L-ascorbate peroxidase (APX1), were consistently expressed at mRNA and protein levels. GST (HSP26-A, PARC, GSTU8, and GSTL3) and GSH dehydrogenase/transferase (DHAR2) were down-regulated in resistant and susceptible mango cultivars. Glucose-6-phosphate 1-dehydrogenase (G6PD2 and G6PD4) and GPX (GPX2) were up-regulated, and the expression trends of the three genes in the two omics were opposite. Gamma-glutamyltranspeptidase (GGT2) was down-regulated in the transcriptome and up-regulated at the protein level. Two GSTs (GSTF11 and GSTU17) showed the opposite result, and one GSH dehydrogenase (At5g42250) was found in WGCNA and differentially expressed in the two omics. Thus, the metabolic process of GSH is very important for mango to resist Xcm invasion, and its related genes regulate its metabolic process at different levels, thus protecting mango cells from the oxidative stress caused by Xcm infection.
Peroxisome is an important organelle in ROS metabolism, mainly producing superoxide anion (O2–) and hydrogen peroxide (H2O2) (Corpas et al., 2020). Peroxisome is involved in a series of ROS generation and scavenging mechanisms, and participates in programmed cell death of plant cells to resist environmental stresses (Huang et al., 2022). In our study, at the transcriptome level, nearly half of the peroxisome-related DEGs changed more significantly in RN, whereas at the proteome level, 30 out of 38 DEPs, including POD (CAT1) and SOD (FSD2), were up-regulated in RN, and the change range was more than that observed KT. Thus, several multifunctional genes can regulate the balance of ROS in mango by positively regulating the biosynthesis of peroxisomes.
Hormones play a vital role in plant disease resistance. The signaling pathways of multiple hormones are not independent of each other in the disease resistance response; however, the interaction between hormones forms a complex regulatory network that enables plants to efficiently coordinate different hormones in the body to improve plant resistance, which is an effective method to resist pathogen invasion (Verma et al., 2016). In this study, a large number of genes were found to be involved in the signal transduction of plant hormones, such as IAA, ABA, GA, ETH, and so on, at the transcriptional and protein levels. The expression levels of these plant hormone-related DEGs in RN were relatively low and generally down-regulated. The related proteins with large differences in expression in the proteome were similar to the transcriptome, mainly that of KT. Through cross-validation of transcriptome and proteomics and WGCNA, three key genes (SAG113, SRK2A, and ABCB1) that were co-expressed in two groups were finally screened out, and they were related to the changes in SOD and CAT activities. SAG113 was also identified in WGCNA of the proteome. Thus, these three genes are not only involved in the signal transduction of plant hormones but may also regulate the redox homeostasis of mango cells during stress response through signal transduction.
Conclusion
The response of mango fruit to Xcm is a complex process, and our understanding of MBLS pathology is limited. The symptoms of disease-resistant varieties and susceptible varieties appeared on the 2nd day and differentiated on the 6th day of the experiment. To determine the positively or negatively affected genes, we mainly analyzed the significantly DEGs that maintained a consistent trend from day 0 to day 6. The genes and proteins identified in this study provide valuable resources for mango resistance to MBLS breeding and can benefit researchers in this field.
Data availability statement
The authors acknowledge that the data presented in this study must be deposited and made publicly available in an acceptable repository, prior to publication. Frontiers cannot accept a manuscript that does not adhere to our open data policies.
Author contributions
FL and R-LZ contributed to the conception and design of the study. XS wrote the first draft of the manuscript. QY and KZ provided scientific advice. LW performed the statistical analysis. All authors contributed to the manuscript revision and read and approved the submitted version.
Funding
This research was supported by the Key-Area Research and Development Program of Guangdong Province (2022B0202070002), the Yunnan Innovation Guidance and Technological Enterprise Cultivation Plan Project (202104BI090012), and the Chinese Special Fund of Basic Scientific Research Projects for State Level and Public Welfare-Scientific Research Institutes (1630062021014).
Acknowledgments
We thank Gene Denovo at Guangzhou for its assistance in original data processing and related bioinformatics analysis.
Conflict of interest
The authors declare that the research was conducted in the absence of any commercial or financial relationships that could be construed as a potential conflict of interest.
Publisher’s note
All claims expressed in this article are solely those of the authors and do not necessarily represent those of their affiliated organizations, or those of the publisher, the editors and the reviewers. Any product that may be evaluated in this article, or claim that may be made by its manufacturer, is not guaranteed or endorsed by the publisher.
Supplementary material
The Supplementary Material for this article can be found online at: https://www.frontiersin.org/articles/10.3389/fmicb.2023.1220101/full#supplementary-material
Supplementary Figure 1 | Venn diagram of transcriptome sample abundance. Each set in the figure is filled with different colors and labeled with the number of genes contained in each set. The overlapping parts of the set represent the number of genes shared between groups, while the non-overlapping parts represent the unique genes of each group.
Supplementary Figure 2 | Venn diagram of proteome sample abundance. Each group in the figure is filled with a different color and marked with the number of proteins each group contains. The overlapping part of the set represents the number of proteins shared between groups, and the non-overlapping part represents the genes unique to each group.
Supplementary Figure 3 | Changes of SOD and CAT activity in fruits of different mango varieties under Xcm stress. The mark above the error line is the difference analysis result between the treatment group and the control group.
Supplementary Figure 4 | Validation of the transcriptome data. The ordinate in the figure represents the relative expression of differentially expressed genes in qRT-PCR. The abscissa represents the different treatment groups; Error bars are standard deviations.
Supplementary Table 1 | Primer sequences used for qRT-PCR.
Supplementary Table 2 | GO annotation results of DEGs.
Supplementary Table 3 | Results of KEGG enrichment analysis of DEGs.
Supplementary Table 4 | Genes involved in plant hormone signaling.
Supplementary Table 5 | Redox-related genes.
Supplementary Table 6 | GO annotation results of DEPs.
Supplementary Table 7 | Results of KEGG enrichment analysis of DEPs.
Supplementary Table 8 | Proteins involved in plant hormone signaling.
Supplementary Table 9 | Redox-related proteins.
Supplementary Table 10 | Cross-validation of transcriptomics and proteomics.
Abbreviations
ABA, abscisic acid; CAT, catalase; DDA, data dependent acquisition; DEGs, differentially expressed genes; DEPs, differentially expressed proteins; DIA, data independent acquisition; ETH, ethylene; Foc, Fusarium oxysporum f. sp. Cubense; GA, gibberellin; GPX, glutathione peroxidase; GSH, glutathione; GST, glutathione S-transferase; IAA, indoleacetic acid; JA, jasmonic acid; KT, mango varieties of “Keitt”; LB, lysogeny broth; PCD, programmed cell death; ROS, reactive oxygen species; RN, mango varieties of “Renong No.1”; SOD, superoxide dismutase; Trx, thioredoxin; WGCNA, weighted gene co-expression network analysis; Xcm, Xanthomonas critis pv. Mangiferaeindicae.
Footnotes
- ^ https://ngdc.cncb.ac.cn/search/?dbld=gwh&q=PRJCA002248
- ^ http://www.geneontology.org/
- ^ https://www.kegg.jp
References
Akbar, S., Wei, Y., Yuan, Y., Khan, M. T., Qin, L., Powell, C. A., et al. (2020). Gene expression profiling of reactive oxygen species (ROS) and antioxidant defense system following Sugarcane mosaic virus (SCMV) infection. BMC Plant Biol. 20:532. doi: 10.1186/s12870-020-02737-1
Anders, S., and Huber, W. (2010). Differential expression analysis for sequence count data. Genome Biol. 11:R106.
Anderson, J. P., Badruzsaufari, E., Schenk, P. M., Manners, J. M., Desmond, O. J., Ehlert, C., et al. (2004). Antagonistic interaction between abscisic acid and jasmonate-ethylene signaling pathways modulates defense gene expression and disease resistance in Arabidopsis. Plant Cell 16, 3460–3479. doi: 10.1105/tpc.104.025833
Apel, K., and Hirt, H. (2004). Reactive oxygen species: Metabolism, oxidative stress, and signal transduction. Annu. Rev. Plant Biol. 55, 373–399. doi: 10.1146/annurev.arplant.55.031903.141701
Asada, K. (2006). Production and scavenging of reactive oxygen species in chloroplasts and their functions. Plant Physiol. 141, 391–396. doi: 10.1104/pp.106.082040
Ashburner, M., Ball, C. A., Blake, J. A., Botstein, D., Butler, H., Cherry, J. M., et al. (2000). Gene ontology: Tool for the unification of biology. The gene ontology consortium. Nat. Genet. 25, 25–29. doi: 10.1038/75556
Bela, K., Horváth, E., Gallé, Á, Szabados, L., Tari, I., and Csiszár, J. (2015). Plant glutathione peroxidases: Emerging role of the antioxidant enzymes in plant development and stress responses. J. Plant Physiol. 176, 192–201. doi: 10.1016/j.jplph.2014.12.014
Bhar, A., Gupta, S., Chatterjee, M., Sen, S., and Das, S. (2017). Differential expressions of photosynthetic genes provide clues to the resistance mechanism during Fusarium oxysporum, fsp ciceri, race 1 (Foc1) infection in chickpea (Cicer arietinum L). Eur. J. Plant Pathol. 148, 533–549. doi: 10.1007/s10658-016-1109-1
Botía, J. A., Vandrovcova, J., Forabosco, P., Guelfi, S., D’Sa, K., United Kingdom Brain Expression Consortium, et al. (2017). An additional k-means clustering step improves the biological features of WGCNA gene co-expression networks. BMC Syst. Biol. 11:47. doi: 10.1186/s12918-017-0420-6
Chen, L., Zhang, Y. H., Wang, S., Zhang, Y., Huang, T., and Cai, Y. D. (2017). Prediction and analysis of essential genes using the enrichments of gene ontology and KEGG pathways. PLoS One 12:e0184129. doi: 10.1371/journal.pone.0184129
Chen, S., Zhou, Y., Chen, Y., and Gu, J. (2018). fastp:an ultra-fast all-in-one FASTQ preprocessor. Bioinformatics 34, i884–i890. doi: 10.1093/bioinformatics/bty560
Cheng, Y. Q., Liu, Z. M., Xu, J., Zhou, T., Wang, M., Chen, Y. T., et al. (2008). HC-Pro protein of sugar cane mosaic virus interacts specifically with maize ferredoxin-5 in vitro and in planta. J. Gen. Virol. 89, 2046–2054. doi: 10.1099/vir.0.2008/001271-0
Corpas, F. J., González-Gordo, S., and Palma, J. M. (2020). Plant peroxisomes: Afactory of reactive species. Front. Plant Sci. 11:853. doi: 10.3389/fpls.2020.00853
Czarnocka, W., and Karpiński, S. (2018). Friend or foe? Reactive oxygen species production, scavenging and signaling in plant response to environmental stresses. Free Radic. Biol. Med. 122, 4–20. doi: 10.1016/j.freeradbiomed.2018.01.011
Dayakar, B. V., Lin, H. J., Chen, C. H., Ger, M. J., Lee, B. H., Pai, C. H., et al. (2003). Ferredoxin from sweet pepper (Capsicum annuum L.) intensifying harpin(pss)-mediated hypersensitive response shows an enhanced production of active oxygen species (AOS). Plant Mol. Biol. 51, 913–924. doi: 10.1023/a:1023061303755
Del Río, L. A. (2015). ROS and RNS in plant physiology: An overview. J. Exp. Bot. 66, 2827–2837. doi: 10.1093/jxb/erv099
Denancé, N., Sánchez-Vallet, A., Goffner, D., and Molina, A. (2013). Disease resistance or growth: The role of plant hormones in balancing immune responses and fitness costs. Front. Plant Sci. 4:155. doi: 10.3389/fpls.2013.00155
Diaz-Vivancos, P., de Simone, A., Kiddle, G., and Foyer, C. H. (2015). Glutathione-linking cell proliferation to oxidative stress. Free Radic. Biol. Med. 89, 1154–1164. doi: 10.1016/j.freeradbiomed.2015.09.023
Djami-Tchatchou, A. T., Li, Z. A., Stodghill, P., Filiatrault, M. J., and Kunkel, B. N. (2022). Identification of Indole-3-Acetic Acid-Regulated Genes in Pseudomonas syringae pv. tomato strain DC3000. J. Bacteriol. 204:e0038021. doi: 10.1128/JB.00380-21
Fang, X., Zeng, X., Wang, M., Qin, L., Tan, C., and Wu, J. (2021). Enrichment analysis of differentially expressed genes in chronic heart failure. Ann. Palliat. Med. 10, 9049–9056. doi: 10.21037/apm-21-1854
Fichman, Y., and Mittler, R. (2021). A systemic whole-plant change in redox levels accompanies the rapid systemic response to wounding. J. Plant Physiol. 186, 4–8. doi: 10.1093/plphys/kiab022
Gagnevin, L., and Pruvost, O. (2001). Epidemiology and control of mango bacterial black spot. Plant Dis. 85, 928–935. doi: 10.1094/PDIS.2001.85.9.928
Ger, M. J., Louh, G. Y., Lin, Y. H., Feng, T. Y., and Huang, H. E. (2014). Ectopically expressed sweet pepper ferredoxin PFLP enhances disease resistance to Pectobacterium carotovorum subsp. carotovorum affected by harpin and protease-mediated hypersensitive response in Arabidopsis. Mol. Plant Pathol. 15, 892–906. doi: 10.1111/mpp.12150
Haverland, N. A., Fox, H. S., and Ciborowski, P. (2014). Quantitative proteomics by SWATH-MS reveals altered expression of nucleic acid binding and regulatory proteins in HIV-1-infected macrophages. J. Proteome Res. 13, 2109–2119. doi: 10.1021/pr4012602
Huang, H. E., Ger, M. J., Chen, C. Y., Pandey, A. K., Yip, M. K., Chou, H. W., et al. (2007). Disease resistance to bacterial pathogens affected by the amount of ferredoxin-I protein in plants. Mol. Plant Pathol. 8, 129–137. doi: 10.1111/j.1364-3703.2006.00378.x
Huang, L., Liu, Y., Wang, X., Jiang, C., Zhao, Y., Lu, M., et al. (2022). Peroxisome-mediated reactive oxygen species signals modulate programmed cell death in plants. Int. J. Mol. Sci. 23:10087. doi: 10.3390/ijms231710087
Iyanagi, T. (2022). Roles of ferredoxin-NADP+ oxidoreductase and flavodoxin in NAD(P)H-dependent electron transfer systems. Antioxidants (Basel) 11:2143. doi: 10.3390/antiox11112143
Kanehisa, M., and Goto, S. (1999). KEGG: Kyoto encyclopedia of genes and genomes. Nucleic Acids Res. 27, 29–34. doi: 10.1093/nar/27.1.29
Kim, D., Langmead, B., and Salzberg, S. L. (2015). HISAT: A fast spliced aligner with low memory requirements. Nat. Methods 12:357. doi: 10.1038/nmeth.3317
Langfelder, P., and Horvath, S. (2008). WGCNA: An R package for weighted correlation network analysis. BMC Bioinformatics 9:559. doi: 10.1186/1471-2105-9-559
Langmead, B., and Salzberg, S. L. (2012). Fast gapped-read alignment with Bowtie 2. Nat. Methods 9, 357–359. doi: 10.1038/nmeth.1923
Lebaka, V. R., Wee, Y.-J., Ye, W., and Korivi, M. (2021). Nutritional composition and bioactive compounds in three different parts of mango fruit. Int. J. Environ. Res. Public Health 18:741. doi: 10.3390/ijerph18020741
Li, B., and Dewey, C. N. (2011). RSEM: Accurate transcript quantification from RNA-Seq data with or without a reference genome. BMC Bioinformatics 12:323. doi: 10.1186/1471-2105-12-323
Li, C., Shao, J., Wang, Y., Li, W., Guo, D., Yan, B., et al. (2013). Analysis of banana transcriptome and global gene expression profiles in banana roots in response to infection by race 1 and tropical race 4 of Fusarium oxysporum f. sp. cubense. BMC Genomics 14:851. doi: 10.1186/1471-2164-14-851
Li, N., Han, X., Feng, D., Yuan, D., and Huang, L. J. (2019). Signaling crosstalk between salicylic acid and ethylene/jasmonate in plant defense: Do we understand what they are whispering? Int. J. Mol. Sci. 20:671. doi: 10.3390/ijms20030671
Livak, K. J., and Schmittgen, T. D. (2001). Analysis of relative gene expression data using real-time quantitative PCR and the 2(-Delta Delta C(T)) Method. Methods 25, 402–408. doi: 10.1006/meth.2001.1262
Love, M. I., Huber, W., and Anders, S. (2014). Moderated estimation of fold change and dispersion for RNA-seq data with DESeq2. Genome Biol. 15:550. doi: 10.1186/s13059-014-0550-8
Lu, Y., and Yao, J. (2018). Chloroplasts at the crossroad of photosynthesis, pathogen infection and plant defense. Int. J. Mol. Sci. 19:3900. doi: 10.3390/ijms19123900
Meitha, K., Pramesti, Y., and Suhandono, S. (2020). Reactive oxygen species and antioxidants in postharvest vegetables and fruits. Int. J. Food Sci. 2020:8817778. doi: 10.1155/2020/8817778
Mirza, B., Croley, C. R., Ahmad, M., Pumarol, J., Das, N., Sethi, G., et al. (2021). Mango (Mangifera indica L.): A magnificent plant with cancer preventive and anticancer therapeutic potential. Crit. Rev. Food Sci. Nutr. 61, 2125–2151. doi: 10.1080/10408398.2020.1771678
Mittler, R., Zandalinas, S. I., Fichman, Y., and Van Breusegem, F. (2022). Reactive oxygen species signalling in plant stress responses. Nat. Rev. Mol. Cell Biol. 23, 663–679. doi: 10.1038/s41580-022-00499-2
Niemira, M., Collin, F., Szalkowska, A., Bielska, A., Chwialkowska, K., Reszec, J., et al. (2019). Molecular signature of subtypes of non-small-cell lung cancer by large-scale transcriptional profiling: Identification of key modules and genes by weighted gene co-expression network analysis (WGCNA). Cancers (Basel) 12:37. doi: 10.3390/cancers12010037
Noctor, G., Cohen, M., Trémulot, L., Van Breusegem, F., and Mhamdi, A. (2023). Quantitative measurements of biochemical and molecular markers of oxidative stress signaling and responses. Methods Mol. Biol. 2642, 197–214. doi: 10.1007/978-1-0716-3044-0_11
Otulak-Kozieł, K., Kozieł, E., Przewodowski, W., Ciacka, K., and Przewodowska, A. (2022). Glutathione modulation in PVYNTN susceptible and resistant potato plant interactions. Int. J. Mol. Sci. 23:3797. doi: 10.3390/ijms23073797
Poyraz, I., Sözen, E., and Arslanyolub, M. (2010). Isolation of quality total RNA from the aromatic plant Origanum onites. Z. Naturforsch. C J. Biosci. 65, 266–270. doi: 10.1515/znc-2010-3-415
Robinson, M. D., McCarthy, D. J., and Smyth, G. K. (2010). edgeR: A bioconductor package for differential expression analysis of digital gene expression data. Bioinformatics 26, 139–140. doi: 10.1093/bioinformatics/btp616
Salmela, L., and Rivals, E. (2014). LoRDEC:accurate and efficient long read error correction. Bioinformatics 30, 3506–3514. doi: 10.1093/bioinformatics/btu538
Sanahuja, G., Ploetz, R. C., Lopez, P., Konkol, J. L., Palmateer, A. J., and Pruvost, O. (2016). Mangifera indica, caused by Xanthomonas citri pv. mangiferaeindicae, confirmed for the first time in the Americas. Plant Dis. 100:2520. doi: 10.1094/PDIS-03-16-0412-PDN
Sidoli, S., Lin, S., Xiong, L., Bhanu, N., Karch, K., Johansen, E., et al. (2015). Sequential window acquisition of all theoretical mass spectra (swath) analysis for characterization and quantification of histone post-translational modifications. Mol. Cell. Proteomics 14, 2420–2428. doi: 10.1074/mcp.O114.046102
Sies, H. (2018). On the history of oxidative stress: Concept and some aspects of current development. Curr. Opin. Toxicol. 7, 122–126. doi: 10.1016/j.cotox.2018.01.002
Taylor, S. C., Nadeau, K., Abbasi, M., Lachance, C., Nguyen, M., and Fenrich, J. (2019). The Ultimate qPCR experiment: Producing publication quality, reproducible data the first time. Trends Biotechnol. 37, 761–774. doi: 10.1016/j.tibtech.2018.12.002
Verma, V., Ravindran, P., and Kumar, P. P. (2016). Plant hormone-mediated regulation of stress responses. BMC Plant Biol. 16:86. doi: 10.1186/s12870-016-0771-y
Wang, X., Li, Y., Liu, Y., Zhang, D., Ni, M., Jia, B., et al. (2021). Transcriptomic and proteomic profiling reveal the key role of AcMYB16 in the response of Pseudomonas syringae pv. actinidiae in Kiwifruit. Front. Plant Sci. 10:756330. doi: 10.3389/fpls.2021.756330
Xie, J., Ding, Y., Gao, T., He, S., Zhao, K., Yang, X., et al. (2022). Transcriptomic and proteomic analyses of Cucurbita ficifolia Bouché (Cucurbitaceae) response to Fusarium oxysporum f.sp. cucumerium. BMC Genomics 23:436. doi: 10.1186/s12864-022-08674-7
Xue, C., Liu, Z., Wang, L., Li, H., Gao, W., Liu, M., et al. (2020). The antioxidant defense system in Chinese jujube is triggered to cope with phytoplasma invasion. Tree Physiol. 40, 1437–1449. doi: 10.1093/treephys/tpaa067
Young, M. D., Wakefield, M. J., Smyth, G. K., and Oshlack, A. (2010). Gene ontology analysis for RNA-seq: Accounting for selection bias. Genome Biol. 11:R14. doi: 10.1186/gb-2010-11-2-r14
Yun, T. K., and Kim, L. (2018). Gonzalez, Bonnie bartel, peroxisome function, biogenesisand dynamics in plants. J. Plant Physiol. 176, 162–177. doi: 10.1104/pp.17.01050
Keywords: mango bacterial leaf spot, proteomics, transcriptomics, plant hormone signaling, cellular redox homeostasis
Citation: Liu F, Sun X, Wang L, Zhou K, Yao Q and Zhan R-l (2023) Transcriptomic and proteomic analyses of Mangifera indica in response to Xanthomonas critis pv. mangiferaeindicae. Front. Microbiol. 14:1220101. doi: 10.3389/fmicb.2023.1220101
Received: 10 May 2023; Accepted: 21 June 2023;
Published: 04 July 2023.
Edited by:
Jian-Wei Guo, Chinese Academy of Sciences (CAS), ChinaCopyright © 2023 Liu, Sun, Wang, Zhou, Yao and Zhan. This is an open-access article distributed under the terms of the Creative Commons Attribution License (CC BY). The use, distribution or reproduction in other forums is permitted, provided the original author(s) and the copyright owner(s) are credited and that the original publication in this journal is cited, in accordance with accepted academic practice. No use, distribution or reproduction is permitted which does not comply with these terms.
*Correspondence: Quansheng Yao, eXFzaDEwMjhAMTYzLmNvbQ==; Ru-lin Zhan, emhhbnJ1bGluNTU1QDE2My5jb20=
†These authors have contributed equally to this work