 Qingquan Liao
 Yuxiang Ye2
 Zihang Li
 Hao Chen
 Linlin Zhuo
- 1College of Computer Science and Electronic Engineering, Hunan University, Changsha, China
- 2School of Data Science and Artificial Intelligence, Wenzhou University of Technology, Wenzhou, China
- 3School of Computing and Data Science, Xiamen University Malaysia, Sepang, Selangor, Malaysia
MicroRNAs (miRNAs) are short RNA molecular fragments that regulate gene expression by targeting and inhibiting the expression of specific RNAs. Due to the fact that microRNAs affect many diseases in microbial ecology, it is necessary to predict microRNAs' association with diseases at the microbial level. To this end, we propose a novel model, termed as GCNA-MDA, where dual-autoencoder and graph convolutional network (GCN) are integrated to predict miRNA-disease association. The proposed method leverages autoencoders to extract robust representations of miRNAs and diseases and meantime exploits GCN to capture the topological information of miRNA-disease networks. To alleviate the impact of insufficient information for the original data, the association similarity and feature similarity data are combined to calculate a more complete initial basic vector of nodes. The experimental results on the benchmark datasets demonstrate that compared with the existing representative methods, the proposed method has achieved the superior performance and its precision reaches up to 0.8982. These results demonstrate that the proposed method can serve as a tool for exploring miRNA-disease associations in microbial environments.
1. Introduction
MiRNAs are a class of endogenous short RNAs that have multiple important regulatory functions in the microbial environment. MiRNAs exert a significant influence in microbial ecology such as metabolism (Karp and Ambros, 2005), cell growth (Ambros, 2003), immune response (Jung et al., 2006), proliferation (Miska, 2005), cell cycle regulation (Liu et al., 2022a) and tumor invasion (Meng et al., 2007). Moreover, miRNAs completes the process of regulating gene expression by base-pairing with target RNA (Jopling et al., 2005; Vasudevan et al., 2007). As a result, miRNAs can effectively predict the occurrence of diseases in microbial ecology and contribute in prevention and diagnosis. HMDD and Human Cancer Differentially Expressed miRNA Database (dbDEMC) contains miRNA-disease related information (Li et al., 2014). However, the data available for research are relatively scarce, and the choice of wet assays to determine miRNA-disease associations is expensive. Thus, it is crucial to design an effective model to handle the experimental testing process (Chen et al., 2019a, 2021; Wang et al., 2019; Zhu et al., 2021).
In the field of biocomputing, correlation studies between various molecules have been conducted. For example, researchers predict the interaction between circRNA and disease (Wang et al., 2021), miRNA and lncRNA (Zhang et al., 2021), lncRNA and protein (Hu et al., 2018), etc. The aforementioned methods are necessary to predict miRNA-diseases, and most of them are based on complex networks. This line of research works builds one or multi networks on the original interaction datasets, and predicts disease-related miRNAs by integrating multi-level data. In general, these approaches can make reasonable predications about miRNA relatedness based on similar disease phenotypes and similar functions, and vice versa (You et al., 2017; Chen et al., 2018a,d, 2019b). For instance, Jiang et al. established a scoring mechanism for predicting disease-miRNA correlations based on miRNA-disease heterogeneous networks, and applied hypergeometric distribution to predict the strength of miRNA-disease associations (Jiang et al., 2010). Guided by global information of the data, Chen et al. proposed a strategy based on random walk to predict the association between diseases and miRNAs (Chen et al., 2012). Considering the fact that most of models cannot accurately predict miRNAs associated with isolated disease individuals, Zeng et al. added some perturbations to the network to train the predictor (Zeng et al., 2018). Recently, researchers have explored a wide range of miRNA functions, which increases the complexity of analyzing gene expression and regulatory networks in common diseases today (Vickers et al., 2014). Moreover, studies have shown that miRNAs participate in the regulation of many cardiovascular-related diseases. These studies demonstrate new aspects of miRNAs in the field of life sciences, and analyzing the regulation of these miRNAs on cardiovascular-related diseases is extremely valuable for proposing new diagnostic and preventive strategies.
Some studies based on statistical methods to predict miRNA-disease associations are attracting more and more attention from the researchers. For example, Li et al. constructed an SVM classifier based on miRNAs associated with specific tumor phenotypes (Li et al., 2012). This model is only for the prediction of diseases such as tumors and may not be suitable for other diseases. Considering the shortage of negative samples in supervised learning models, Yan et al. proposed a model that can reveal the interaction between diseases and miRNAs based on the principle of regularized least squares (Chen and Yan, 2014). This model can predict the associated miRNAs of emerging diseases, thanking to its semi-supervised learning strategy. Chen et al. demonstrated a computational model of matrix decomposition and heterogeneity network inference for predicting miRNA-disease associations (Chen et al., 2018c). In this model, similarities in disease signatures and disease-miRNA associations are integrated into a unified network. However, model parameters are relatively large, and how to reasonably set the parameters is a very challenging task. Xu et al. developed a novel model based on probabilistic matrix factorization (Xu et al., 2019). This model firstly integrates the similarity in the miRNA-disease network; And then performs a probability matrix factorization operation based on the interaction matrix and the similarity matrix.
However, the aforementioned models cannot still achieve promising performance in predicting miRNA-disease associations. Note that deep learning technology has recently been applied to the field of biological computing (Fu et al., 2020; Cai et al., 2021a,b; Liu et al., 2022c; Peng et al., 2022a,b,c; Tian et al., 2022; Xu et al., 2023; Zhang et al., 2023). For instance, Chen et al. constructed a restricted Boltzmann model that can predict associations in different domains (Chen et al., 2015). Because the variability among multiple types cannot be fully modeled, the prediction accuracy is not promising. Chen et al. pre-trained all miRNA-disease pairs on a restricted Boltzmann model and fine-tuned on DBN on the same proportion of positive and negative samples to obtain prediction scores (Chen, 2021). Peng et al. extract features based on a three-autoencoder and then apply a convolutional network to predict the final label (Peng et al., 2019).
Recently, graph neural networks have received much attention from the researchers. For instance, Chen et al. developed a method for miRNA disease association determination based on heterogeneous graphs (Vickers et al., 2014). Furthermore, Chen et al. proposed a network-integrated miRNA-disease-associated internal and external score prediction method (Chen and Zhang, 2014). Chen et al. proposed a predictive model integrating matrix deconstruction and heterogeneous graph aggregation (Chen et al., 2016). Chen et al. utilized matrix factorization to alleviate the influence of noise in adjacent matrices, and then perform node aggregation operations on heterogeneous networks. Mugunga proposed a predictive model based on path features and random walk to obtain correlation scores for miRNA-associated diseases, and potential miRNA-disease associations would be associated with high prediction scores (Mugunga et al., 2017). Guo et al. used a decision fusion strategy to prioritize the results of existing methods, and then verified the effectiveness of the decision fusion strategy (Guang, 2018). Zeng et al. constructed a heterogeneous network to predict potential associations between miRNAs and disease, while also accounting for dataset imbalance (Zeng, 2017). The model also uses a multi-layer perceptron-based approach to predict miRNA-disease pairs, integrating a variety of biological data resources.
Although the aforementioned methods are outstanding in predicting miRNA-disease associations, few studies consider the similarity and topological information comprehensively. Generally speaking, when the topological structure is very sparse, feature information becomes more important in association prediction; when feature information is incomplete, topological information can also play an auxiliary role. Inspired by this guidance, we propose a GCN and autoencoder-based approach that can comprehensively consider both feature and topological information in miRNA-disease networks. Our contributions can be summarized as follows:
1. We develop a GCNA-MDA model to predict miRNA-disease association based on GCN and autoencoders, which achieves the excellent performance. We employ dual-autoencoders to extract disease and miRNA features, which improves the robustness of node presentation. At the same time, we apply a 2-layer GCN to further aggregate disease and miRNA node features by fully considering the topological information.
2. We propose a robust strategy for constructing miRNA and disease basic feature matrix. Combining feature similarity and Gaussian similarity, a unified similarity matrix is constructed. Adding association information to the disease and miRNA nodes respectively make the feature representation more abundant, thus alleviate the negative impact of insufficient data.
3. We conduct multiple comparison experiments on the HMDD dataset to verify that the GCNA-MDA model can accurately perform the prediction task. Moreover, we construct case studies to verify that the GCNA-MDA model can indeed be applied to examine the specific miRNA-disease associations.
2. Materials and methods
2.1. Dataset
The dataset used in the experiment could be downloaded from the HMDD v2.0 database (Li et al., 2014). The dataset includes 5430 validated associations generated by 495 miRNAs and 383 diseases. It can be abbreviated as adjacency matrix A, in which there are 495 × 383 miRNA disease associations. If disease d is associated with miRNA m, the association relationship is satisfied, that is, A(m, d) = 1, otherwise its value is 0.
2.2. Constructing miRNA and disease basic feature matrix
In this section, we describe in detail the process of constructing robust initial feature for miRNAs and diseases. These similarity matrices can be used as the input matrices for the autoencoder in the next stage. The main process will be introduced below.
2.2.1. Disease feature similarly
Based on the collected disease original feature information, its feature similarity network can be constructed (Schriml et al., 2012). Specifically, we apply the strategy of DAG to denote these diseases. For a disease node d, it is denoted by DAG(d) = (d, v(d), e(d)). v(d) represents the set of nodes reached to d, and e(d) represents all edges linked to d. In the DAG graph, the feature contribution weight W of the upper node x to d is calculated as follows:
where ▽ represents the adjustment parameter of W, which is empirically set to 0.5 (Chen and Yan, 2013). Based on d and its upper nodes, the feature representation value of d can be calculated as follows:
We hypothesize that the greater the number of DAGs shared between two disease nodes, the smaller the difference between the two nodes may be. Thus, the feature similarity of two disease nodes A and B can be calculated as:
For disease node d, if two nodes involve approximately the same DAG(d) level, then two nodes should have different occurrence ratios and their contribution to the feature weight of disease d should be different. Thus, we propose the following equation to compute the influence of disease x on d:
where D denotes the disease set, and |·| denotes the operation of calculating the number of elements in the set. Similarly, the feature representation value of d and the feature similarity of two disease nodes A and B can be calculated as Equations 5 and 6, respectively:
Combining the two measure methods to obtain a more reasonable feature similarity, the calculation equation is as follows:
2.2.2. Similarity based on Gaussian
We hypothesize that two miRNAs with small functional differences should be associated with diseases with similar properties (Van Laarhoven et al., 2011). Based on this assumption, we apply the Gaussian kernel distance calculation equation to calculate the similarity between disease nodes Da and Db:
where
and γd represents the Gaussian kernel parameter, and represents the index function, which can index the row vector of the matrix. Similarly, the Gaussian kernel distance formula between miRNA nodes miRa and miRb is as follows:
where
and M represents the miRNA node set, and γd and γm are often set to 1 empirically (Chen and Yan, 2013).
2.2.3. Similarity integration
Due to missing data, some disease pairs may not exist in the feature similarity. For this case, using Gaussian kernel distance to measure the distance between diseases can robustly reflect the differences between diseases. Therefore, the calculation formula of the overall similarity between disease nodes A and B is formulated as
Similarly, the calculation equation of the overall similarity between miRNA nodes X and Y is representated as follows:
where FM(·, ·) denotes the functional similarity score between two miRNA nodes.
2.3. Model design
In this section, we propose GCNA-MDA model for predicting miRNA-disease associations based on GCNs and dual-autoencoders. It mainly consists of three parts: firstly, a new similarity calculation strategy is used to obtain the initial basic feature matrix of miRNA (or disease); secondly, a dual-autoencoder is applied to extract the robust expression of miRNA and disease respectively; finally, a 2-layer GCN is applied to predict miRNA-disease associations. Next, the GCNA-MDA model architecture will be introduced in detail, and its overall framework is shown in Figure 1.
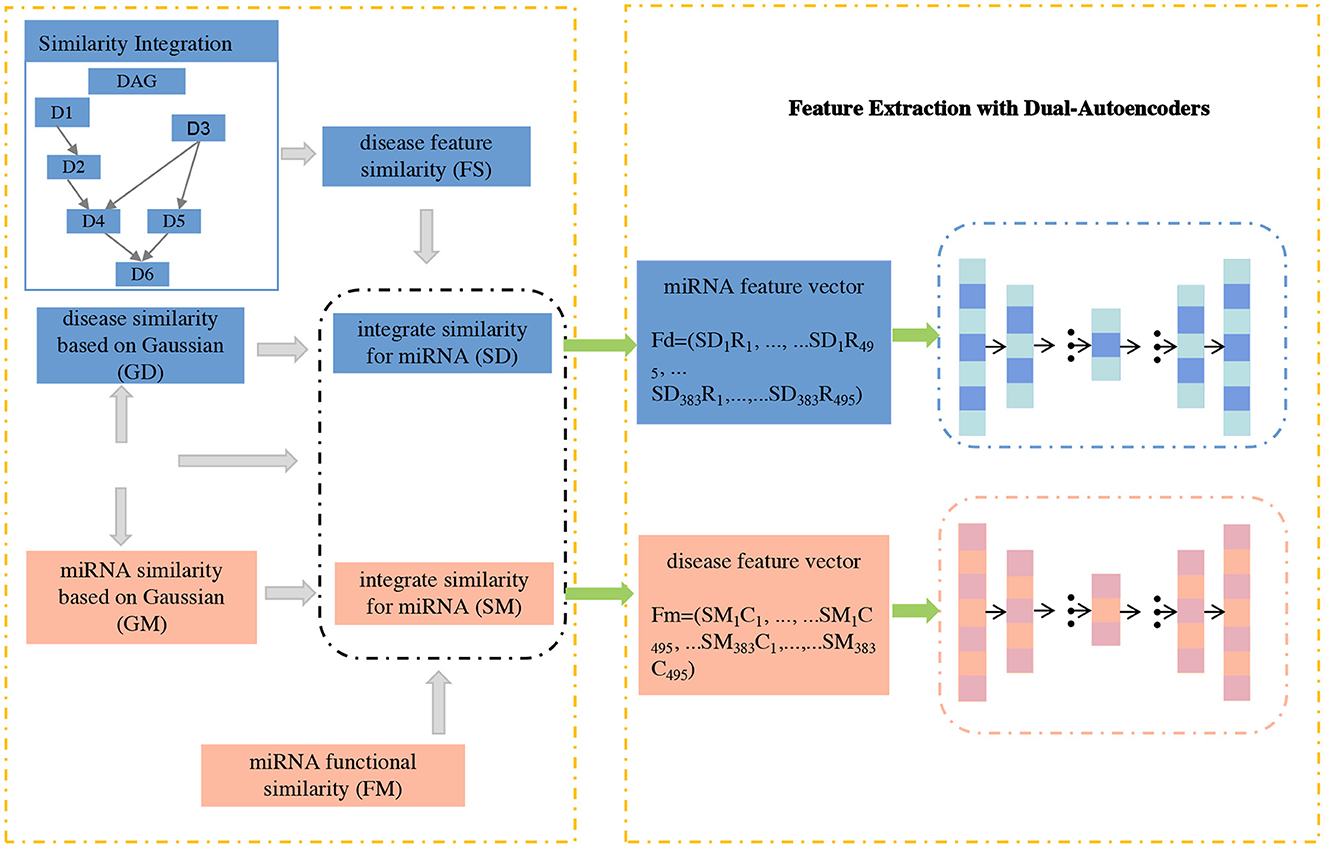
Figure 1. The concatenated feature representations are input to dual-autoencoders.
2.3.1. Node representation
In this subsection, a novel signature expression for miRNA (or disease) nodes is proposed. Considering that the direct interaction information between miRNA and disease is very important, we add disease-related information to the features of miRNA nodes. Similarly, we also add the corresponding miRNA information to the disease node. Specifically, according to formulas (13) and (12), we calculate the respective feature vectors based on miRNAs and diseases, respectively. Based on the above formula, the fusion with the miRNA-disease association matrix can be obtained:
where Ri and Cj represent the i−th row and j−th column vectors of the miRNA-disease association matrix, respectively. Subsequently, the matrices Fm and Fd of miRNAs and diseases were fed into a dual-autoencoder, respectively.
2.3.2. Feature extraction with dual-autoencoders
Based on the above presentation, the node expression of the miRNA (or disease) node fused with the correlation relationship can be obtained. Obviously, the number of nodes is small (383 and 495), but the vector length of each node is high (equal to twice the number of nodes of each type). In this case, the deep neural network may suffer from insufficient samples. Fortunately, autoencoders can play their unique role in this situation. With the strategy of unsupervised learning, the automatic encoding machine no longer needs a large number of samples for its training. This is convenient for us to extract more robust features for the next stage of association prediction tasks.
We extract features of miRNAs and disease nodes separately based on a symmetric dual-autoencoder. The process is mainly divided into two stages of encoding and decoding. During the encoding phase, the basis vectors of the nodes obtained in the previous section is fed into the encoder network. By setting a reasonable number of dimensions, low-rank feature vectors of miRNAs and diseases can be obtained. The calculation method in the encoder is:
where σe() represents the sigmod activation function. We and be represent the weight and bias matrices in the encoder, respectively. Both matrices can be efficiently trained in the encoder. Thus, the low-rank vectors obtained from the encoding stage are fed into the decoder network. By setting a reasonable number of dimensions, robust feature vectors for miRNAs and diseases can be obtained. The calculation method in the decoder is:
where σd(·) represents the sigmod activation function. Wd and bd represent the weight and bias matrices in the decoder, respectively. F is stored as the final feature vector and is fed to the GCN in the next stage for association prediction tasks. To minimize the final feature distribution and the node's initial basic feature distribution, an optimization objective of the dual-autoencoder can be set as:
In our research, we apply the common square loss function as the optimization objective. The X matrix covers all miRNA and disease nodes, and x is a row vector in the X matrix, which can be regarded as a certain node. In the last layer of the decoder, the node vector length is empirically set to 128.
2.3.3. Predict miRNA–Disease association by GCN
Through the aforementioned process, we can obtain robust features of miRNAs and disease nodes. It is well known that graph neural networks can well aggregate node features and fully consider the topological information of miRNA-disease networks. Therefore, this study uses GCN to predict whether there is an association between miRNA nodes and disease nodes. Since GCN is suitable for tasks on graphs with only one type of nodes and one type of links. Therefore, in order to obtain a unified node adjacency matrix, it is necessary to splice miRNA nodes and disease nodes. For adjacency matrix A, the first 495 indexes of its row (or column) represent miRNA, and the last 383 indexes represent disease. For the elements in the matrix, the sub-matrix composed of elements from 1 to 495 rows and 496 to 878 columns represents miRNA-disease association. The specific calculation is as follows:
In the above equation, the size of the adjacency matrix A is 878 × 878. NMD and NDM represent miRNA-disease association, and NDD and NMM are set to 0. In GCN, the feature matrix F obtained in the previous section is fed into the GCN network as the initial node embedding matrix. Along with it, matrix A participates in GCN. GCN can aggregate nodes based on topology information to obtain more effective node embedding. The node embedding aggregation calculation is as follows:
where Hi represents the node embedding of the i-th layer, H0 comes from Fd or Fm. Â represents the adjacency matrix with self-loops, and represents the degree matrix of Â, Wi represents the trainable matrix. In this study, we design a 2-layer GCN to predict miRNA-disease associations as shown in Figure 2.
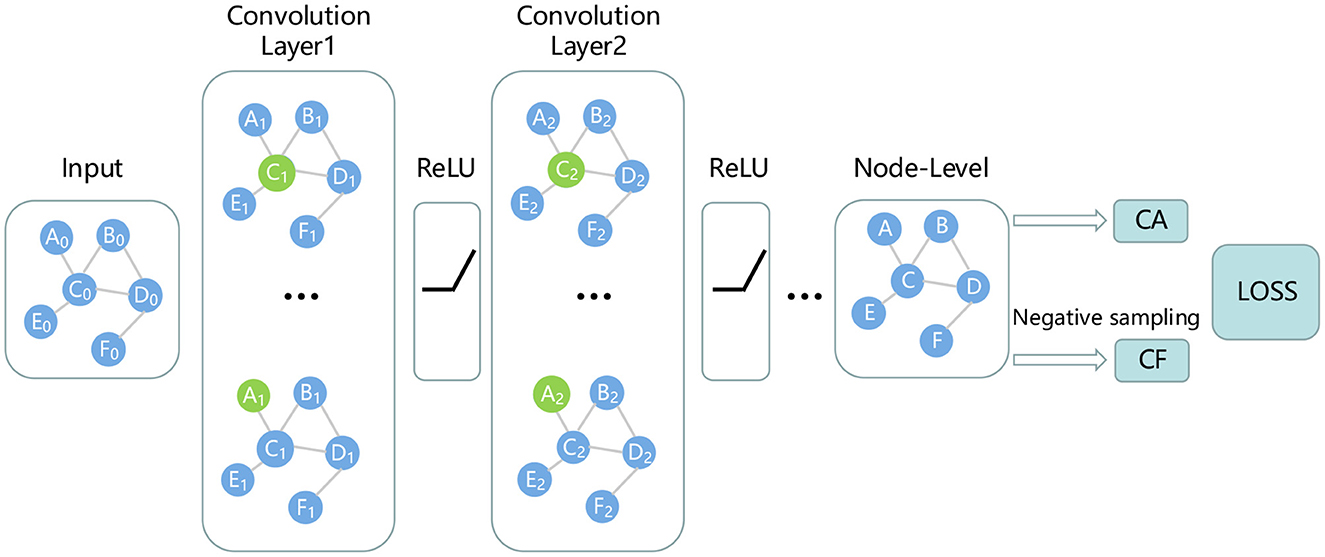
Figure 2. Prediction of miRNA-disease associations using GCN.
3. Results
In this section, our model compares the performance of several typical models on the HMDD dataset. In order to verify the reliability of the model, we also conducted 5-fold and 10-fold cross-validation experiments. At the same time, to demonstrate that the proposed model has certain practical significance, such as preliminary prevention and guidance for diseases, we also constructed corresponding case studies for certain diseases.
3.1. Evaluation strategy
We used common AUC and precision metrics to validate the performance of our model. Among them, AUC is a comprehensive indicator, which can reflect the comprehensive performance of the model. Since the sparse rate in the dataset is ((495X383) − 5430) ÷ (495X383) ≈ 97.14%, in other words, the number of negative samples is far more than that of positive samples. However, from a practical point of view, we need to pay more attention to the performance of the model in the positive sample. Therefore, we use Precision to evaluate the performance of the model. Its calculation formula is as follows:
Furthermore, in N-fold cross-validation experiments, we perform N-fold cross-validation by randomly splitting the sample into N equal parts. N − 1 parts are used as the training set, and the rest are used as the test set. According to this strategy, N parts are used in turn as test sets, and the remaining parts are used as training sets to complete all cross-validation experiments. In the experiment, we consider the AUC metric to measure the performance of the model.
3.2. Comparative evaluation
We compare the GCNA-MDA model with GAEMDA (Li et al., 2021), GBDT_LR (Zhou et al., 2020), ABMDA (Zhao et al., 2019), LMTRDA (Wang et al., 2019), RFMDA (Chen et al., 2018b) models. The GAEMDA (Li et al., 2021) model fuses similarity information and topological neighborhood information in the miRNA-disease network, and integrates GCN and autoencoder for prediction tasks. GBDT_LR (Zhou et al., 2020), ABMDA (Zhao et al., 2019) and RFMDA (Chen et al., 2018b) use ensemble learning strategies to obtain high-quality features and then make corresponding predictions. Besides, GBDT_LR (Zhou et al., 2020), ABMDA (Zhao et al., 2019) used a new negative sample collection strategy to weaken the impact of negative sample coverage. LMTRDA (Wang et al., 2019) combined multi-way data for prediction tasks. Table 1 lists the results of performance comparison, indicating that the GCNA-MDA model obtains the highest Precision value of 89.82%. Our model fully incorporates multi-level information, while applying a dual-autoencoder to further refine the features. Meanwhile, we applies GCN to predict miRNA-disease associations, making the good use of topological information. Combining the above two reasons, our model has achieved the best accuracy results.
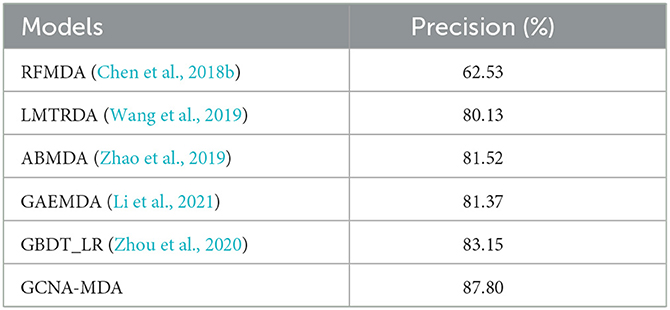
Table 1. Precision of six methods in miRNA-disease classification task.
For the compared models, RFMDA (Chen et al., 2018b) achieves the worst performance. The main reason is attributed that although the model adopts the strategy of integrated learning, RFMDA (Chen et al., 2018b) does not consider the skew caused by excessive negative samples and it does not synthesize information from multiple sources. While the rest of the models employing multiple information significantly outperform the RFMDA (Chen et al., 2018b) model, which exhibits the importance of integrating multiple information. In addition, GBDT_LR (Zhou et al., 2020) combined with ABMDA (Zhao et al., 2019) applied the strategy of ensemble learning and weakening negative samples, resulting in a significant performance improvement.
3.3. Scalability evaluation
To measure the scalability of the GCNA-MDA model, we perform 5- and 10-fold cross-validation on the HMDD dataset. The results of 5-fold cross-validation are shown in Figure 3. The GCNA-MDA model achieved AUC values of 0.867, 0.878, 0.875, 0.878, and 0.867 in five experiments. The average of 5 AUCs is 0.8730, and the standard deviation is 0.00526. This shows that our model has good scalability and its performance is not easily affected by random factors. In order to further eliminate the interference of other factors, our GCNA-MDA model was subjected to a 10-fold cross-validation experiment on the HMDD dataset. Figure 4 shows the AUC performance of 10-fold cross-validation. The GCNA-MDA model achieved AUC values of 0.860, 0.863, 0.877, 0.889, 0.873, 0.879, 0.881, 0.882, 0.875, and 0.876 in 10 experiments. It can be calculated that the average value of the AUC indicator is 0.8755, and the standard deviation is 0.00561. We can find that there is only a difference of 0.0003 between the means of the two groups of experiments, and a difference of 0.00338 between the standard deviations of the two groups. Such variance is perfectly acceptable because random sampling is not controllable. It shows that the performance of the GCNA-MDA model is very stable, and it also shows that its accuracy will not be affected by random sampling. In addition, this may also be due to the local sampling strategy adopted in our research, so that the distribution and ratio of positive and negative samples tend to be similar at the same time.
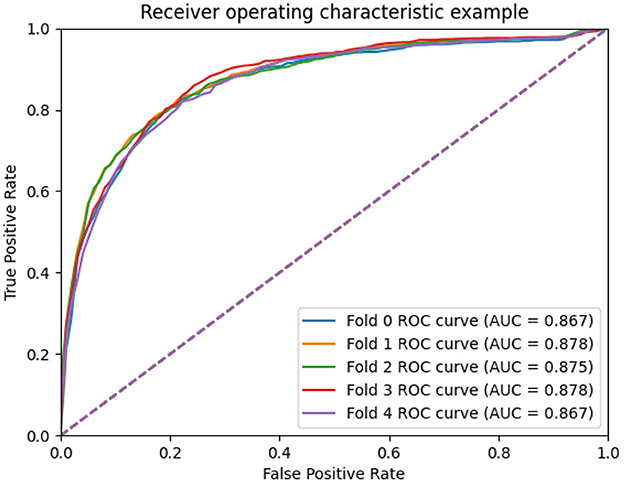
Figure 3. AUC performance of GCNA-MDA model on 5-fold cross-validation.
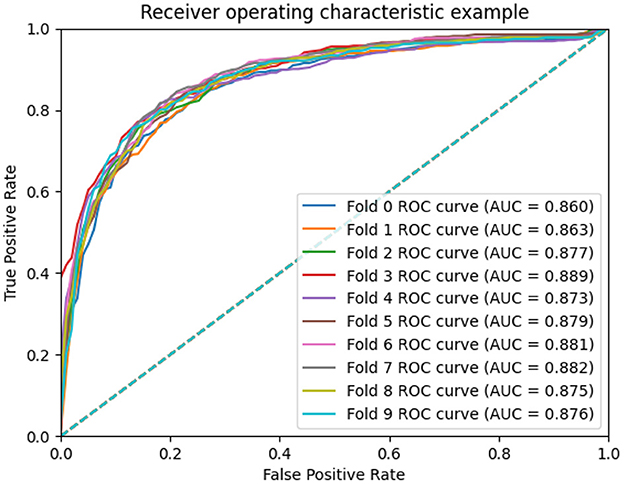
Figure 4. AUC performance of GCNA-MDA model on 10-fold cross-validation.
3.4. Evaluation of different forecasting methods
Table 2 compares the performance of two autoencoder-based methods. The DFELMDA model (Liu et al., 2022b) employs autoencoders for feature extraction and random forests for miRNA-disease association prediction. While it performs well on the AUC indicator, its performance on other indicators is unsatisfactory, possibly due to overfitting caused by random forests. Moreover, the extreme imbalance of positive and negative samples further contributes to the low indicators. In contrast, the GCNA-MDA model performs consistently across all indicators, likely because it utilizes GCN in the prediction module, which effectively incorporates topological information. Additionally, we address the issue of imbalanced samples by maintaining a 1:1 ratio of positive and negative samples.
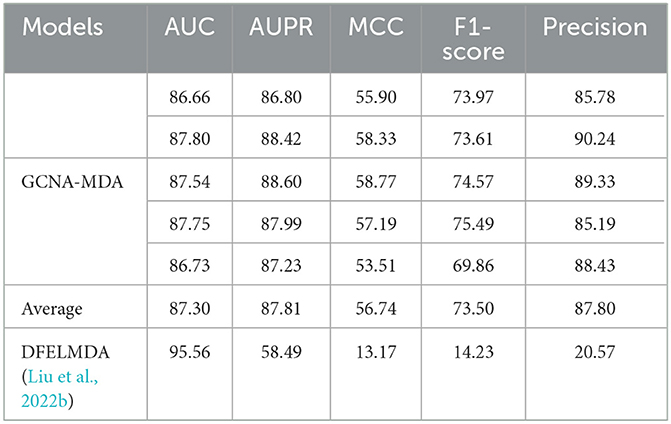
Table 2. Performance comparison of two models using autoencoders (%).
3.5. Case analysis
In order to verify the validity of our model, we conduct case analysis of 10 related diseases on the miRNA numbered hsa-mir-29a. In a more detailed operation, we selected the best model parameters in a 5-fold cross-validation experiment, and then selected these diseases in Table 3 as an external test set to predict the association with hsa-mir-29a. We picked 7 positive samples associated with hsa-mir-29a and 3 negative samples not associated with hsa-mir-29a. Table 3 presents the results of the case analysis. By comparing the results in the original database, the GCNA-MDA model correctly predicted all associations in the case analysis. This shows that the GCNA-MDA model does have certain reliability and can be further used as a reference for disease prediction.
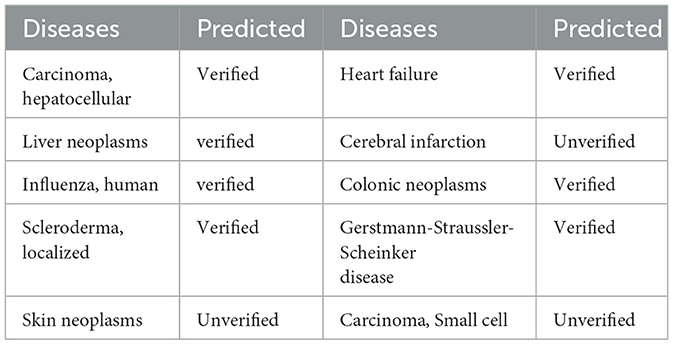
Table 3. A case study of the association of miRNA named hsa-mir-29a with various diseases.
We also performed a case analysis of the model on the disease side. For instance, we analyzed miRNAs potentially associated with Renal Cell-related cancer. Table 4 presents the analysis results, indicating that the GCNA-MDA model accurately identifies miRNAs associated with the disease by comparing databases. Thus, our model is effective for case studies involving both miRNAs and diseases.
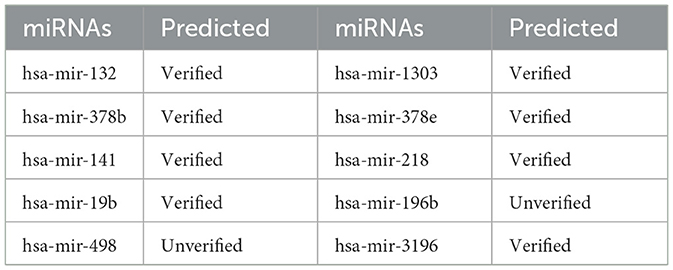
Table 4. A case study of the association of disease named Carcinoma, Renal Cell with various miRNAs.
4. Conclusion
In this paper, a GCNA-MDA model that accurately predicts miRNA-disease associations is proposed based on dual autoencoders and GCN. We proposed a novel feature integration strategy based on the combination of multi-way data such as association similarity and feature similarity. This allows for a more complete initial representation of the node. Furthermore, we further perform feature extraction on these initial node representations with higher dimensions based on the dual-autoencoder. The self-supervised learning strategy alleviates the problem of insufficient positively correlated data, resulting in a more robust initial node embedding matrix. Finally, based on GCN, we perform corresponding aggregation operations on all miRNAs and disease nodes, and perform association prediction tasks. We constructed comparative experiments and scalability experiments to verify the effectiveness and scalability of our model. The case analysis of hsa-mir-29a shows that the GCNA-MDA model has certain practical significance.
Data availability statement
The original contributions presented in the study are included in the article/supplementary material, further inquiries can be directed to the corresponding authors. Our data and code are available at https://github.com/Lqingquan/GCNA-MDA.
Author contributions
All authors listed have made a substantial, direct, and intellectual contribution to the work and approved it for publication.
Conflict of interest
The authors declare that the research was conducted in the absence of any commercial or financial relationships that could be construed as a potential conflict of interest.
Publisher's note
All claims expressed in this article are solely those of the authors and do not necessarily represent those of their affiliated organizations, or those of the publisher, the editors and the reviewers. Any product that may be evaluated in this article, or claim that may be made by its manufacturer, is not guaranteed or endorsed by the publisher.
References
Ambros, V. (2003). Microrna pathways in flies and worms: growth, death, fat, stress, and timing. Cell 113, 673–676. doi: 10.1016/S0092-8674(03)00428-8
Cai, L., Ren, X., Fu, X., Peng, L., Gao, M., and Zeng, X. (2021a). ienhancer-xg: interpretable sequence-based enhancers and their strength predictor. Bioinformatics 37, 1060–1067. doi: 10.1093/bioinformatics/btaa914
Cai, L., Wang, L., Fu, X., Xia, C., Zeng, X., and Zou, Q. (2021b). Itp-pred: an interpretable method for predicting, therapeutic peptides with fused features low-dimension representation. Briefings Bioinformat. 22, bbaa367. doi: 10.1093/bib/bbaa367
Chen, X. (2021). Deep-belief network for predicting potential mirna-disease associations. Briefing Bioinformat. 22, bbaa186. doi: 10.1093/bib/bbaa186
Chen, X., Clarence Yan, C., Zhang, X., Li, Z., Deng, L., Zhang, Y., et al. (2015). Rbmmmda: predicting multiple types of disease-microrna associations. Sci. Rep. 5, 13877. doi: 10.1038/srep13877
Chen, X., Huang, L., Xie, D., and Zhao, Q. (2018a). Egbmmda: extreme gradient boosting machine for mirna-disease association prediction. Cell Death Dis. 9, 3. doi: 10.1038/s41419-017-0003-x
Chen, X., Liu, M.-X., and Yan, G.-Y. (2012). Rwrmda: predicting novel human microrna–disease associations. Mol. Biosyst. 8, 2792–2798. doi: 10.1039/c2mb25180a
Chen, X., Sun, L.-G., and Zhao, Y. (2021). Ncmcmda: mirna–disease association prediction through neighborhood constraint matrix completion. Briefings Bioinformat. 22, 485–496. doi: 10.1093/bib/bbz159
Chen, X., Wang, C.-C., Yin, J., and You, Z.-H. (2018b). Novel human mirna-disease association inference based on random forest. Mol. Ther. Nucleic Acids 13:568–579. doi: 10.1016/j.omtn.2018.10.005
Chen, X., Xie, D., Zhao, Q., and You, Z.-H. (2019a). Micrornas and complex diseases: from experimental results to computational models. Briefings Bioinformat. 20, 515–539. doi: 10.1093/bib/bbx130
Chen, X., Yan, C. C., Zhang, X., You, Z.-H., Deng, L., Liu, Y., et al. (2016). Wbsmda: within and between score for mirna-disease association prediction. Sci. Rep. 6, 1–9. doi: 10.1038/srep21106
Chen, X., and Yan, G.-Y. (2013). Novel human lncrna–disease association inference based on lncrna expression profiles. Bioinformatics 29, 2617–2624. doi: 10.1093/bioinformatics/btt426
Chen, X., and Yan, G.-Y. (2014). Semi-supervised learning for potential human microrna-disease associations inference. Sci. Rep. 4, 5501. doi: 10.1038/srep05501
Chen, X., Yin, J., Qu, J., and Huang, L. (2018c). Mdhgi: matrix decomposition and heterogeneous graph inference for mirna-disease association prediction. PLoS Comput. Biol. 14, e1006418. doi: 10.1371/journal.pcbi.1006418
Chen, X., Zhu, C.-C., and Yin, J. (2018d). Predicting mirna-diseaseassociation based on inductive matrix completion. Bioinformatics 34, 4256–4265. doi: 10.1093/bioinformatics/bty503
Chen, X., Zhu, C.-C., and Yin, J. (2019b). Ensemble of decision tree reveals potential mirna-disease associations. PLoS Comput. Biol. 15, e1007209. doi: 10.1371/journal.pcbi.1007209
Chen, X. Y. C., and Zhang, X. (2014). Hgimda: heterogeneous graphinference for mirna-disease association prediction. Oncotarget 7(10):65257–65269. doi: 10.18632/oncotarget.11251
Fu, X., Cai, L., Zeng, X., and Zou, Q. (2020). Stackcppred: a stacking and pairwise energy content-based prediction of cell-penetrating peptides and their uptake efficiency. Bioinformatics 36, 3028–3034. doi: 10.1093/bioinformatics/btaa131
Guang, H. (2018). Predicting microrna-disease associations using label propagation based on linear neighborhood similarity. J. Biomed. Informat. 82, 169–177. doi: 10.1016/j.jbi.2018.05.005
Hu, H., Zhang, L., Ai, H., Zhang, H., Fan, Y., Zhao, Q., et al. (2018). Hlpi-ensemble: prediction of human lncrna-protein interactions based on ensemble strategy. RNA Biol. 15, 797–806. doi: 10.1080/15476286.2018.1457935
Jiang, Q., Hao, Y., Wang, G., Juan, L., Zhang, T., Teng, M., et al. (2010). Prioritization of disease micrornas through a human phenome-micrornaome network. BMC Syst. Biol. 4, 1–9. doi: 10.1186/1752-0509-4-S1-S2
Jopling, C. L., Yi, M., Lancaster, A. M., Lemon, S. M., and Sarnow, P. (2005). Modulation of hepatitis c virus rna abundance by a liver-specific microrna. Science 309, 1577–1581. doi: 10.1126/science.1113329
Jung, Baltimore David, T. K. D., P, B. M., and Kuang, C. (2006). NF-KappaB-Dependent Induction of microRNA miR-146, an Inhibitor Targeted to Signaling Proteins of Innate Immune Responses (Thesis).
Karp, X., and Ambros, V. (2005). Encountering micrornas in cell fate signaling. Science 310, 1288–1289. doi: 10.1126/science.1121566
Li, X., Xu, J., and Li, Y. (2012). Prioritizing candidate disease mirnas by topological features in the mirna-target dysregulated network. Syst. Biol. Cancer Res. Drug Discov. 2012, 289–306. doi: 10.1007/978-94-007-4819-4_12
Li, Y., Qiu, C., Tu, J., Geng, B., Yang, J., Jiang, T., et al. (2014). Hmdd v2. 0: a database for experimentally supported human microrna and disease associations. Nucleic Acids Res. 42, D1070–D1074. doi: 10.1093/nar/gkt1023
Li, Z., Li, J., Nie, R., You, Z.-H., and Bao, W. (2021). A graph auto-encoder model for mirna-disease associations prediction. Briefings Bioinformat. 22, bbaa240. doi: 10.1093/bib/bbaa240
Liu, W., Jiang, Y., Peng, L., Sun, X., Gan, W., Zhao, Q., et al. (2022a). Inferring gene regulatory networks using the improved markov blanket discovery algorithm. Interdiscipl. Sci. Computat. Life Sci. 2022, 1–14. doi: 10.1007/s12539-021-00478-9
Liu, W., Lin, H., Huang, L., Peng, L., Tang, T., Zhao, Q., et al. (2022b). Identification of mirna–disease associations via deep forest ensemble learning based on autoencoder. Briefings Bioinformat. 23, bbac104. doi: 10.1093/bib/bbac104
Liu, W., Sun, X., Yang, L., Li, K., Yang, Y., and Fu, X. (2022c). Nscgrn: a network structure control method for gene regulatory network inference. Briefings Bioinformat. 23,bbac156. doi: 10.1093/bib/bbac156
Meng, F., Henson, R., Wehbe–Janek, H., Ghoshal, K., Jacob, S. T., and Patel, T. (2007). Microrna-21 regulates expression of the pten tumor suppressor gene in human hepatocellular cancer. Gastroenterology 133, 647–658. doi: 10.1053/j.gastro.2007.05.022
Miska, E. A. (2005). How micrornas control cell division, differentiation and death. Curr. Opin. Genet. Dev. 15, 563–568. doi: 10.1016/j.gde.2005.08.005
Mugunga, I., Ju, Y., Liu, X., and Huang, X. (2017). Computational prediction of human disease-related micrornas by path-based random walk. Oncotarget 8, 58526. doi: 10.18632/oncotarget.17226
Peng, J., Hui, W., Li, Q., Chen, B., Hao, J., Jiang, Q., et al. (2019). A learning-based framework for mirna-disease association identification using neural networks. Bioinformatics 35, 4364–4371. doi: 10.1093/bioinformatics/btz254
Peng, L., Wang, C., Tian, G., Liu, G., Li, G., Lu, Y., et al. (2022a). Analysis of ct scan images for covid-19 pneumonia based on a deep ensemble framework with densenet, swin transformer, and regnet. Front. Microbiol. 13, 995323. doi: 10.3389/fmicb.2022.995323
Peng, L., Wang, F., Wang, Z., Tan, J., Huang, L., Tian, X., et al. (2022b). Cell–cell communication inference and analysis in the tumour microenvironments from single-cell transcriptomics: data resources and computational strategies. Briefings Bioinformat. 23, bbac234. doi: 10.1093/bib/bbac234
Peng, L., Yang, C., Huang, L., Chen, X., Fu, X., and Liu, W. (2022c). Rnmflp: predicting circrna–disease associations based on robust nonnegative matrix factorization and label propagation. Briefings Bioinformat. 23, bbac155. doi: 10.1093/bib/bbac155
Schriml, L. M., Arze, C., Nadendla, S., Chang, Y.-W. W., Mazaitis, M., Felix, V., et al. (2012). Disease ontology: a backbone for disease semantic integration. Nucleic Acids Res. 40, D940–D946. doi: 10.1093/nar/gkr972
Tian, G., Wang, Z., Wang, C., Chen, J., Liu, G., Xu, H., et al. (2022). A deep ensemble learning-based automated detection of covid-19 using lung ct images and vision transformer and convnext. Front. Microbiol. 13, 1024104. doi: 10.3389/fmicb.2022.1024104
Van Laarhoven, T., Nabuurs, S. B., and Marchiori, E. (2011). Gaussian interaction profile kernels for predicting drug–target interaction. Bioinformatics 27, 3036–3043. doi: 10.1093/bioinformatics/btr500
Vasudevan, S., Tong, Y., and Steitz, J. A. (2007). Switching from repression to activation: micrornas can up-regulate translation. Science 318, 1931–1934. doi: 10.1126/science.1149460
Vickers, K. C., Rye, K.-A., and Tabet, F. (2014). Micrornas in the onset and development of cardiovascular disease. Clin. Sci. 126, 183–194. doi: 10.1042/CS20130203
Wang, C.-C., Han, C.-D., Zhao, Q., and Chen, X. (2021). Circular rnas and complex diseases: from experimental results to computational models. Briefings Bioinformat. 22, bbab286. doi: 10.1093/bib/bbab286
Wang, L., You, Z.-H., Chen, X., Li, Y.-M., Dong, Y.-N., Li, L.-P., et al. (2019). Lmtrda: Using logistic model tree to predict mirna-disease associations by fusing multi-source information of sequences and similarities. PLoS Comput. Biol. 15, e1006865. doi: 10.1371/journal.pcbi.1006865
Xu, J., Cai, L., Liao, B., Zhu, W., Wang, P., Meng, Y., et al. (2019). Identifying potential mirnas–disease associations with probability matrix factorization. Front. Genet. 10, 1234. doi: 10.3389/fgene.2019.01234
Xu, J., Xu, J., Meng, Y., Lu, C., Cai, L., Zeng, X., et al. (2023). Graph embedding and gaussian mixture variational autoencoder network for end-to-end analysis of single-cell rna sequencing data. Cell Rep. Methods 2023, 100382. doi: 10.1016/j.crmeth.2022.100382
You, Z.-H., Huang, Z.-A., Zhu, Z., Yan, G.-Y., Li, Z.-W., Wen, Z., et al. (2017). Pbmda: A novel and effective path-based computational model for mirna-disease association prediction. PLoS Computat. Biol. 13, e1005455. doi: 10.1371/journal.pcbi.1005455
Zeng, X. (2017). Inferring microrna-disease associations by random walk on a heterogeneous network with multiple data sources. IEEE-ACM Transact. Comput. Biol. Bioinformat. 14, 905–915. doi: 10.1109/TCBB.2016.2550432
Zeng, X., Liu, L., Lü, L., and Zou, Q. (2018). Prediction of potential disease-associated micrornas using structural perturbation method. Bioinformatics 34, 2425–2432. doi: 10.1101/223693
Zhang, L., Yang, P., Feng, H., Zhao, Q., and Liu, H. (2021). Using network distance analysis to predict lncrna–mirna interactions. Interdiscipl. Sci. Comput. Life Sci. 13, 535–545. doi: 10.1007/s12539-021-00458-z
Zhang, Z., Xu, J., Wu, Y., Liu, N., Wang, Y., and Liang, Y. (2023). Capsnet-lda: predicting lncrna-disease associations using attention mechanism and capsule network based on multi-view data. Briefings Bioinformat. 24, bbac531. doi: 10.1093/bib/bbac531
Zhao, Y., Chen, X., and Yin, J. (2019). Adaptive boosting-based computational model for predicting potential mirna-disease associations. Bioinformatics 35, 4730–4738. doi: 10.1093/bioinformatics/btz297
Zhou, S., Wang, S., Wu, Q., Azim, R., and Li, W. (2020). Predicting potential mirna-disease associations by combining gradient boosting decision tree with logistic regression. Comput. Biol. Chem. 85, 107200. doi: 10.1016/j.compbiolchem.2020.107200
Keywords: miRNA-disease association, microbial ecology, dual-autoencoder, graph convolutional network, insufficient information, topological information, robust representations
Citation: Liao Q, Ye Y, Li Z, Chen H and Zhuo L (2023) Prediction of miRNA-disease associations in microbes based on graph convolutional networks and autoencoders. Front. Microbiol. 14:1170559. doi: 10.3389/fmicb.2023.1170559
Received: 21 February 2023; Accepted: 21 March 2023;
Published: 28 April 2023.
Edited by:
Lihong Peng, Hunan University of Technology, ChinaReviewed by:
Sha Tian, Macau University of Science and Technology, ChinaChenxing Xia, Anhui University of Science and Technology, China
Copyright © 2023 Liao, Ye, Li, Chen and Zhuo. This is an open-access article distributed under the terms of the Creative Commons Attribution License (CC BY). The use, distribution or reproduction in other forums is permitted, provided the original author(s) and the copyright owner(s) are credited and that the original publication in this journal is cited, in accordance with accepted academic practice. No use, distribution or reproduction is permitted which does not comply with these terms.
*Correspondence: Hao Chen, Y2hlbmhhb0BobnUuZWR1LmNu; Linlin Zhuo, emh1b25pbm5pbkAxNjMuY29t