 Fanfan Wang
 Tao Tang1,3
 Yuanyuan Duan
 Jingmao You
- 1Key Laboratory of Biology and Cultivation of Chinese Herbal Medicines, Ministry of Agriculture and Rural Affairs, Institute of Chinese Herbal Medicines, Hubei Academy of Agricultural Sciences, Enshi, China
- 2Hubei Engineering Research Center of Under-forest Economy, Hubei Academy of Agricultural Sciences, Wuhan, China
- 3Hubei Engineering Research Center of Good Agricultural Practices (GAP) Production for Chinese Herbal Medicines, Institute of Chinese Herbal Medicines, Hubei Academy of Agricultural Sciences, Enshi, China
Introduction: Sclerotium rolfsii Sacc. is a globally dispersed pathogenic fungus that causes southern blight disease in many crops and Chinese herbal medicine. The high degree of variation and diversity in the fungi altered population genetic structure. Therefore, the important factors of variation within the pathogen population should be considered during the development of management strategies for the disease.
Methods: In this study, S. rolfsii isolates from 13 hosts in 7 provinces of China were collected and analyzed to identify their morphological features and perform molecular characterization. To develop EST-SSR primers, transcriptome sequencing was performed on isolated CB1, and its SSR loci were comprehensively analyzed. In addition, we analyzed the polymorphisms among different populations based on screened EST-SSR primers.
Results: The results showed that all of these clean reads with total 36,165,475 assembled bases were clustered into 28,158 unigenes, ranged from 201 bp to 16,402 bp on the length, of which the average length was 1,284 bp. Of these, the SSR sequence appeared at an average interval of 15.43 kB, and the frequency of SSR was 0.0648 SSR/kB. Polymorphism of 9 primers was observed among 22 populations, and was verified by the Shannon’s index (average = 1.414) and polymorphic information index (> 0.50). The genetic diversity analysis revealed diversity in all host populations and geographical populations. Further, molecular variance analysis (AMOVA) showed that the differences between groups were mainly related to geographical location. Based on cluster analysis, the 7 populations were roughly divided into 3 groups, and the results were highly consistent with those based on the geographical location, ultimately aligning with the results of STRUCTURE analysis.
Discussion: The findings build on current knowledge of the distribution of S. rolfsii in the southwest area of China, adding value to current knowledge base on the population structure and genetic diversity of S. rolfsii, specifically in the context of Chinese herbal medicine cultivation in China. Overall, our findings may provide valuable information for breeding of crops with enhanced resistance toward S. rolfsii.
1. Introduction
The occurrence of southern blight on plants is caused by Sclerotium rolfsii Sacc. (Teleomorph: Athelia rolfsii (Cruzi) Tu & Kimbrough) worldwide (Dwivedi and Prasad, 2016). The soil-borne fungus can infect crop, vegetables, fruits, Chinese medicinal plant, and other 500 types of plant species, and was first described by Rolfs in 1892 on tomato (Dwivedi and Prasad, 2016). Southern blight is very severe and among one of the main significant diseases worldwide in terms of economic losses in temperate regions with cool and moist climate during spring. The yield loss of in peanut production owing to S. rolfsii infection was found to range from 10 to 80% all over the world (Khatri et al., 2017; Song et al., 2018). The initial symptoms in plant were brown to black rot of the root or stem and colonization of the lesions by the fast-growing mycelium. Once the disease continues to progress, the infected strain dies and its mycelium spreads in all directions (Mehri et al., 2020). The pathogen overwinters as sclerotia in soil, and as mycelium in seedlings and plant survival (Ünal et al., 2019). In early spring, when temperature and moisture are suitable, the sclerotium germinates to produce mycelium, which is spread through rainwater, irrigation water, etc., directly invading plants and causing disease (Li et al., 2021).
The disease is difficult to handle due to its extensive presence, high variation, and ability to produce persistent sclerotia (Remesal et al., 2012; Xie et al., 2014; Jebaraj et al., 2017). During the development of management strategies for the disease, variation within the pathogen population, which is an important factor, should be considered (Khatri et al., 2017). Currently, the control measures for this disease mainly depend on chemical fungicides, which not only lead to fungicide resistance, but also pollute the environment (Sultana and Hossain, 2022). An improved understanding of S. rolfsii populations in plants could provide more information on approaches to manage this devastating pathogen while improving control efficiency and reducing the use of fungicides. Therefore, the genetic diversity of the pathogen, and their correlation with host and geographical distribution are research hotspots.
Previous studies revealed the variability among the isolates of S. rolsfii from different hosts and geographical locations in terms of phenotypic traits (Sarma et al., 2002; Remesal et al., 2012; Xie et al., 2014). However, the methods used to obtain these results are laborious, time-consuming, and subject to environmental influences; hence, they are not generally preferred. Molecular markers are more effective for evaluating the genetic diversity of fungal pathogens than conventional methods, and are widely used in plant pathology, such as in the analysis of the origin, migration pathways, and genetic structure of wheat stripe rust, and population genetic analysis of Sclerotinia sclerotiorum in Northeast China (Rathour et al., 2004; Luo et al., 2015; Liu et al., 2018). Currently used molecular markers include restriction fragment length polymorphism (RFLP), random amplified polymorphic DNA (RAPD), amplified fragment length polymorphism (AFLP), and inter simple sequence repeat (ISSR); however, these markers have various deficiencies, such as poor stability, poor repeatability, heavy workload, and high sample quality requirements (Clarkson et al., 2013; Tok et al., 2016; Song et al., 2021). Microsatellite loci or simple sequence repeats (SSRs) are PCR-based molecular markers that may be more desirable for population genetic analysis as they enable simpler retrieval of accurate polymorphic data due to codominance, high polymorphism and high information content (Li et al., 2008). SSRs have been employed to characterize plant pathogen population from a spectrum of hosts in different geographical areas. For example, Luo et al. (2015) developed SSR markers to assess the genetic variation among the wheat stripe rust fungus population. Similarly, the genetic variation of S. sclerotiorum isolates from sunflower in Northeast China was analyzed using SSRs (Liu et al., 2018). According to the different original sequences of SSR, it can be divided into genomic-SSRs (gSSRs) and expressed sequence tag-SSRs (EST-SSRs). Compared with gSSR, EST-SSR has the advantages of simple steps, low cost, and more evolved. Therefore, EST-SSR is an economical and effective DNA molecular marker. However, EST-SSRs have not been used to examine the populations S. rolfsii adapted to different hosts.
In this study, we comprehensively analyzed the genetic diversity of 120 strains from various hosts and diverse geographical locations in China based on genotyping with EST-SSR markers. Using the transcriptome data of S. rolfsii, the EST-SSRs markers were developed, and the polymorphisms among different populations were analyzed. The findings of this study improve current knowledge on the population structure and genetic diversity of S. rolfsii, specifically in Chinese herbal medicine from China, and may provide valuable information for the prevention and control of the disease and the breeding of resistant varieties.
2. Materials and methods
2.1. Fungal isolation
Plants with southern blight disease were collected from 13 hosts in 7 provinces from 2017–2021 (Supplementary Table S1; Supplementary Figure S1). The fungus from the infected sample was obtained and purified via hyphal tip isolation on PDA (Potato Dextrose Agar) plates supplemented with 50 μg/mL teracycline antibiotics to prevent bacterial contamination. The isolates were stored at 4°C for a future study. Morphological identification of the isolates was based on the cultural characteristics of S. rolfsii and morphology of the mycelial mat and sclerotium formation traits.
2.2. DNA extraction
S. rolfsii isolates on PDA medium were stored in a BOD incubator at 28°C for 7 days. The mycelial mat was harvested via scraping with a sterile spatula and immediately frozen in liquid nitrogen. After freeze-drying, fungal mycelia were ground under liquid nitrogen using a mortar and pestle. Genomic DNA was extracted using a Fungal DNA isolation kit (Tsingke Biotechnology Co. Ltd) according to the producer’s protocol. The DNA was quantitatively and qualitatively determined using NanoDrop (Themo Scientific), diluted to a working concentration of 20 ng/μl, and stored in aliquots at −20°C until further use.
2.3. PCR amplification
To verify the species identity of some of the newly collected isolates, universal ITS primers with ITS1 as forward and ITS4 as reverse primer and LSU primers with NL1 as forward and NL4 as reverse primer were used for PCR amplification of the 120 isolates (White et al., 1990; Table 1). The reaction volume of 25 μL comprised 12.5 μL of 10× PCR buffer, 10 μM forward and reverse primers, 1 μL of genomic DNA, and 9.5 μL ddH2O and PCR was performed in a thermal cycler (Biometra, ILS, United States). The cycling program was as follows: initial denaturation at 95°C for 4 min followed by 35 cycles of denaturation at 94°C for 45 s, optimized annealing temperature for 45 s and extension at 72°C for 1 min, and a final extension at 72°C for 10 min. The PCR amplicons were electrophoresed on 1% agarose gel in 1× TBE buffer (89 mM Tris–HCl, 89 mM boric acid, 2 mM EDTA and pH 8.35) and visualized in a UV transilluminator.
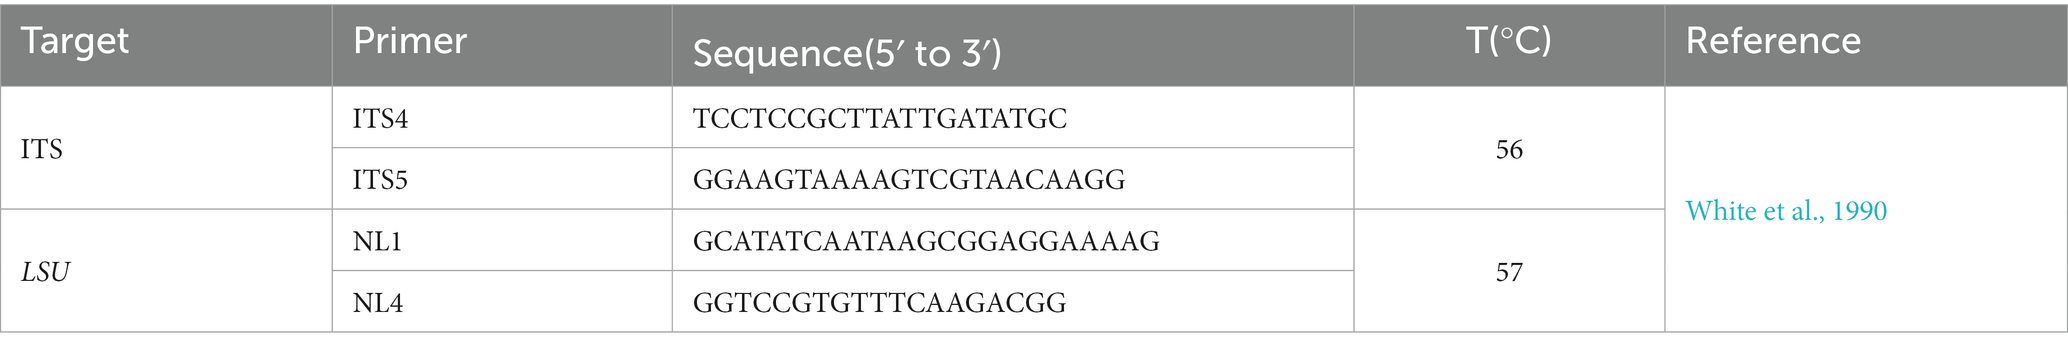
Table 1. Information of the primers used for ITS and LSU amplification.
2.4. RNA extraction, library construction, and sequencing
Samples from three periods, namely the mycelium stage (S1), sclerotia of early development stage (S2) and mature sclerotia (S3) stage, were collected from strain CB1 of Macleaya cordata in Hunan Province. The collected samples were immediately frozen in liquid nitrogen and stored at −80°C for further use. Total RNA was extracted according to the manufacturer’s instructions for the Trizol reagent kit (Life Technologies inc, United States). The mRNA of each sample that met the quality requirements was enriched by Oligo (dT) beads. Then the enriched mRNA was fragmented into short fragments using fragmentation buffer and reverse transcript into cDNA with random primers. Second-strand cDNA were synthesized by DNA polymerase I, RNase H, dNTP and buffer. Then the cDNA fragments were purified with 1.8X Agencourt AMPure XP Beads, end repaired, poly(A) added, and ligated to Illumina sequencing adapters. The ligation products were size selected by agarose gel electrophoresis, PCR amplified, and sequenced using Illumina HiSeq™ 4,000 by Gene Denovo Biotechnology Co (Guangzhou, China). Transcriptome de novo assembly was carried out with short reads assembling program – Trinity (Grabherr et al., 2011).
All raw sequencing data were submitted to the Genome Sequence Archive (GSA) database under the BioProject accession number CRA009668 at the BIG Sub website.1
2.5. Detection of The EST-SSRs loci and primer design
The detection and localization of potential SSRs were searched and implemented from 25,185 unigenes using the MISA tool.2 The number, frequency, maximum repeat motif, and percentage of different repeat types of SSR were identified in the S. rolfsii transcriptome. Primer 6.0 software was used to design the primers for the SSR locus. The main selection parameters for screening the primers were as follows: I. sites with repetition units of 2, 3, 4, and 5 bases with only one repetition type; II. fragment length greater than 150 bp and less than 300 bp; III. location of genes not markedly concentrated, preferential selection of the loci with polymorphism, and even selection of the duplicate units of different combinations; IV. primers with length between 20 and 23 bp and TM value of approximately 60°C; V. primers with base repeats less than or equal to 4; VI. 5′ and 3′ ends do not contain two consecutive A/T bases; and VII. no repeat sequence in the primer.
2.6. Primer validation and polymorphism detection
To validate the quality of the primer, 200 primer pair sequences were randomly selected and synthesized by Tsingke Biotechnology Co., Ltd. (Beijing, China) and used for PCR amplification. The reaction volume of 20 μL comprised 10 μL 2 × TSINGKE Master mix (Tsingke Biotechnology Co., Ltd. Beijing, China), 1 μL forward primer (connector “CAG,” 10 mM), 1 μL reverse primer (10 mM), 1 μL genomic DAN (20 ng/μL), and 7 μL ddH2O. The PCR amplification conditions were as follows: 94°C for 5 min, followed by 35 cycles at 94°C for 30 s, 60°C for 30 s, 72°C for 30 s, and then a final extension at 72°C for 5 min, using a Thermal Cycler (Hangzhou Bioer Technology Co., Ltd., Hangzhou, China). All primer pairs were used for amplification of 8 samples with obvious morphological differences to select the primers that resulted in clear amplification bands. Then 16 samples from different hosts and different geographical sources were used as templates, and primers with good polymorphism were screened by capillary electrophoresis.
The obtained PCR products were detected by capillary electrophoresis with 3,730 XL sequencer (ABI 3730xl Genetic analysis instrument). Primers with high specificity, good polymorphism, and good repeatability were screened by analyzing the locus peak and data information. To clarify the polymorphism of EST-SSR primers and populations, the number of alleles (Na), effective number of alleles (Ne), Shannon index (I), polymorphism information content (PIC), and observed (Ho) and expected (He) heterozygosity were calculated using Popgene 1.32 and GenAlEx 6.501 (Peakall and Smouse, 2012).
2.7. Population genetic diversity
The obtained EST-SSR primers were used to analyze the population genetic diversity of 120 strains from 22 populations. To determine the genetic variation between geographic populations and host populations, including within populations, among populations, within groups, and among groups, the analysis of molecular variance (AMOVA) function in Gene AlEx 6.501 was applied. The genetic structure of 7 geographic populations was analyzed using Structure 2.3.4 based on Bayesian analysis. Twenty independent runs were performed for each K value (Evanno et al., 2005). The burn-in period iterations and Markov chain Monte Carlo repetitions for each run (K ranged from 2 to 10) were 100,000 each. The results obtained from Structure were further analyzed using the software of Structure Harvest3 to obtain the best K value. Unweighted pair group (UPGMA) in Populations-1_2_30 was used to cluster the populations of S. rolfsii, and a dendrogram was generated from this clustering.
3. Results
3.1. Illumina sequencing and de novo assembly
The whole RNA was, respectively, extracted from the samples as following: S. rolfsii mycelium stage (S1), sclerotia of early development stage (S2) and mature sclerotia (S3) stage, and then sequenced by Illumina technology. After filtering, 27,173,090, 26,896,318 and 22,913,500 clean reads were obtained from S1 stage, 24,936,756, 23,481,220 and 27,038,696 clean reads were obtained from S2 stage, 27,164,438, 28,988,848 and 25,025,724 clean reads were obtained from S3 stage, respectively. All of these clean reads with total 36,165,475 assembled bases were clustered into 28,158 unigenes, ranged from 201 bp to 16,402 bp on the length, of which the average length was 1,284 bp. The GC percentage was 48.29% and the N50 was 2,379. Of these, 3,299 SSR sequences were detected, including 579 unigenes containing multiple SSRs (Table 2). In general, the SSR sequence appeared at an average interval of 15.43 kB, and the frequency of SSR was 0.0648 SSR/kB.
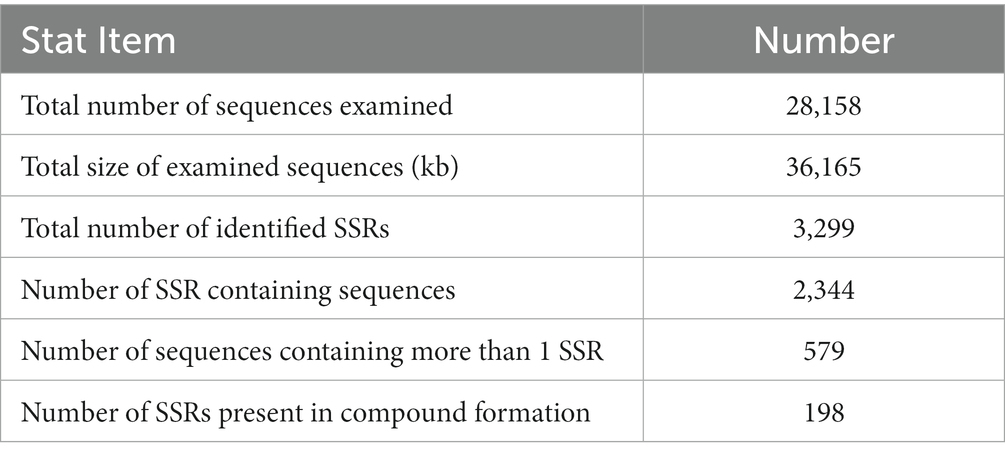
Table 2. SSR type statistics of Sclerotium rolfsii.
3.2. Frequency and distribution of SSRs in the unigenes
The proportions of five different SSR unit types were not evenly distributed across all SSRs. The frequency of the occurrence of different repeat types was as follows: 52.53% for tri-repeats and 31.56% for di-repeats, ultimately accounting for the highest proportions. In addition, the frequencies of tetra-repeats, penta-repeats, and hexa-repeats were 10.28, 2.67, and 2.97%, respectively. Of the 1,041 di-repeats motifs, the (AG/CT)n di-repeats motifs were the most abundant. The other four major unit types included (ATC/ATG)n in tri-repeats, (AAAG/CTTT)n in tetra-repeats, (AAAAG/CTTTT)n in penta-repeats, and (AAGGAG/CCTTCT)n and (ACCAGC/CTGGTG)n in hexa-repeats, with frequencies of 11.91, 3.27, 0.61, and 0.15%, respectively (Table 3).
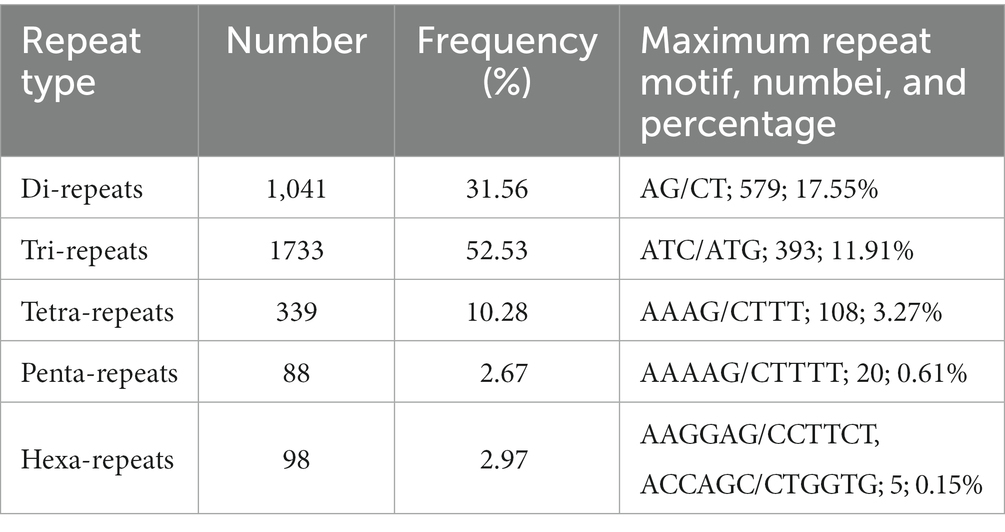
Table 3. Frequencies of the different repeat types of SSR in the Sclerotium rolfsii transcriptom.
The SSR length of strain CB1 ranged from 12 to 212 bp, with an average length of 72.78 bp. Most microsatellite sequences were 12–36 bp in length, accounting for 39.46% of the total microsatellite length distribution. There were 175 microsatellite sequences longer than 36 bp. The number of microsatellite sequences of 15 bp was the largest, accounting for 15.96% of the total number, followed by 14 bp and 20 bp microsatellite sequences, accounting for 12.96 and 13.58%, respectively (Figure 1).
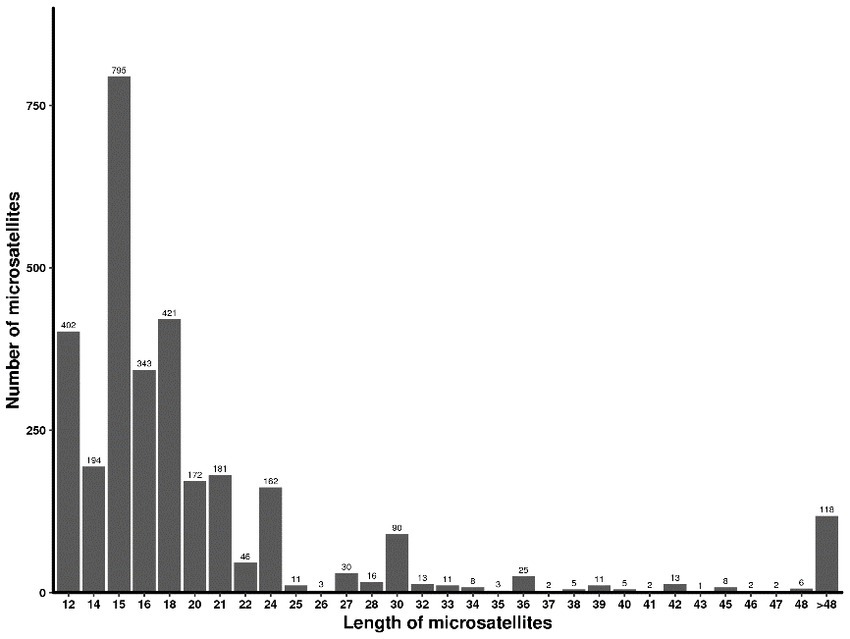
Figure 1. Length distribution and number of SSR in the Sclerotium rolfsii transcriptome.
3.3. Development and validation of novel EST-SSRs
Primer 6.0 software was used to design primer pairs that meet the required criteria. Briefly, we randomly selected and synthesized 200 primer pairs, and initially tested the polymorphism of SSR primers (Supplementary Table S2). Thirty-six primer pairs with polymorphism were separated via agarose gel electrophoresis. The results of polymorphism analysis of loci detected by capillary electrophoresis showed that 9 primer pairs had good polymorphism for genetic diversity, including BJ015, BJ071, BJ082, BJ112, BJ130, BJ152, BJ156, BJ157, and BJ184 (Table 4; Supplementary Figures S2, S3).
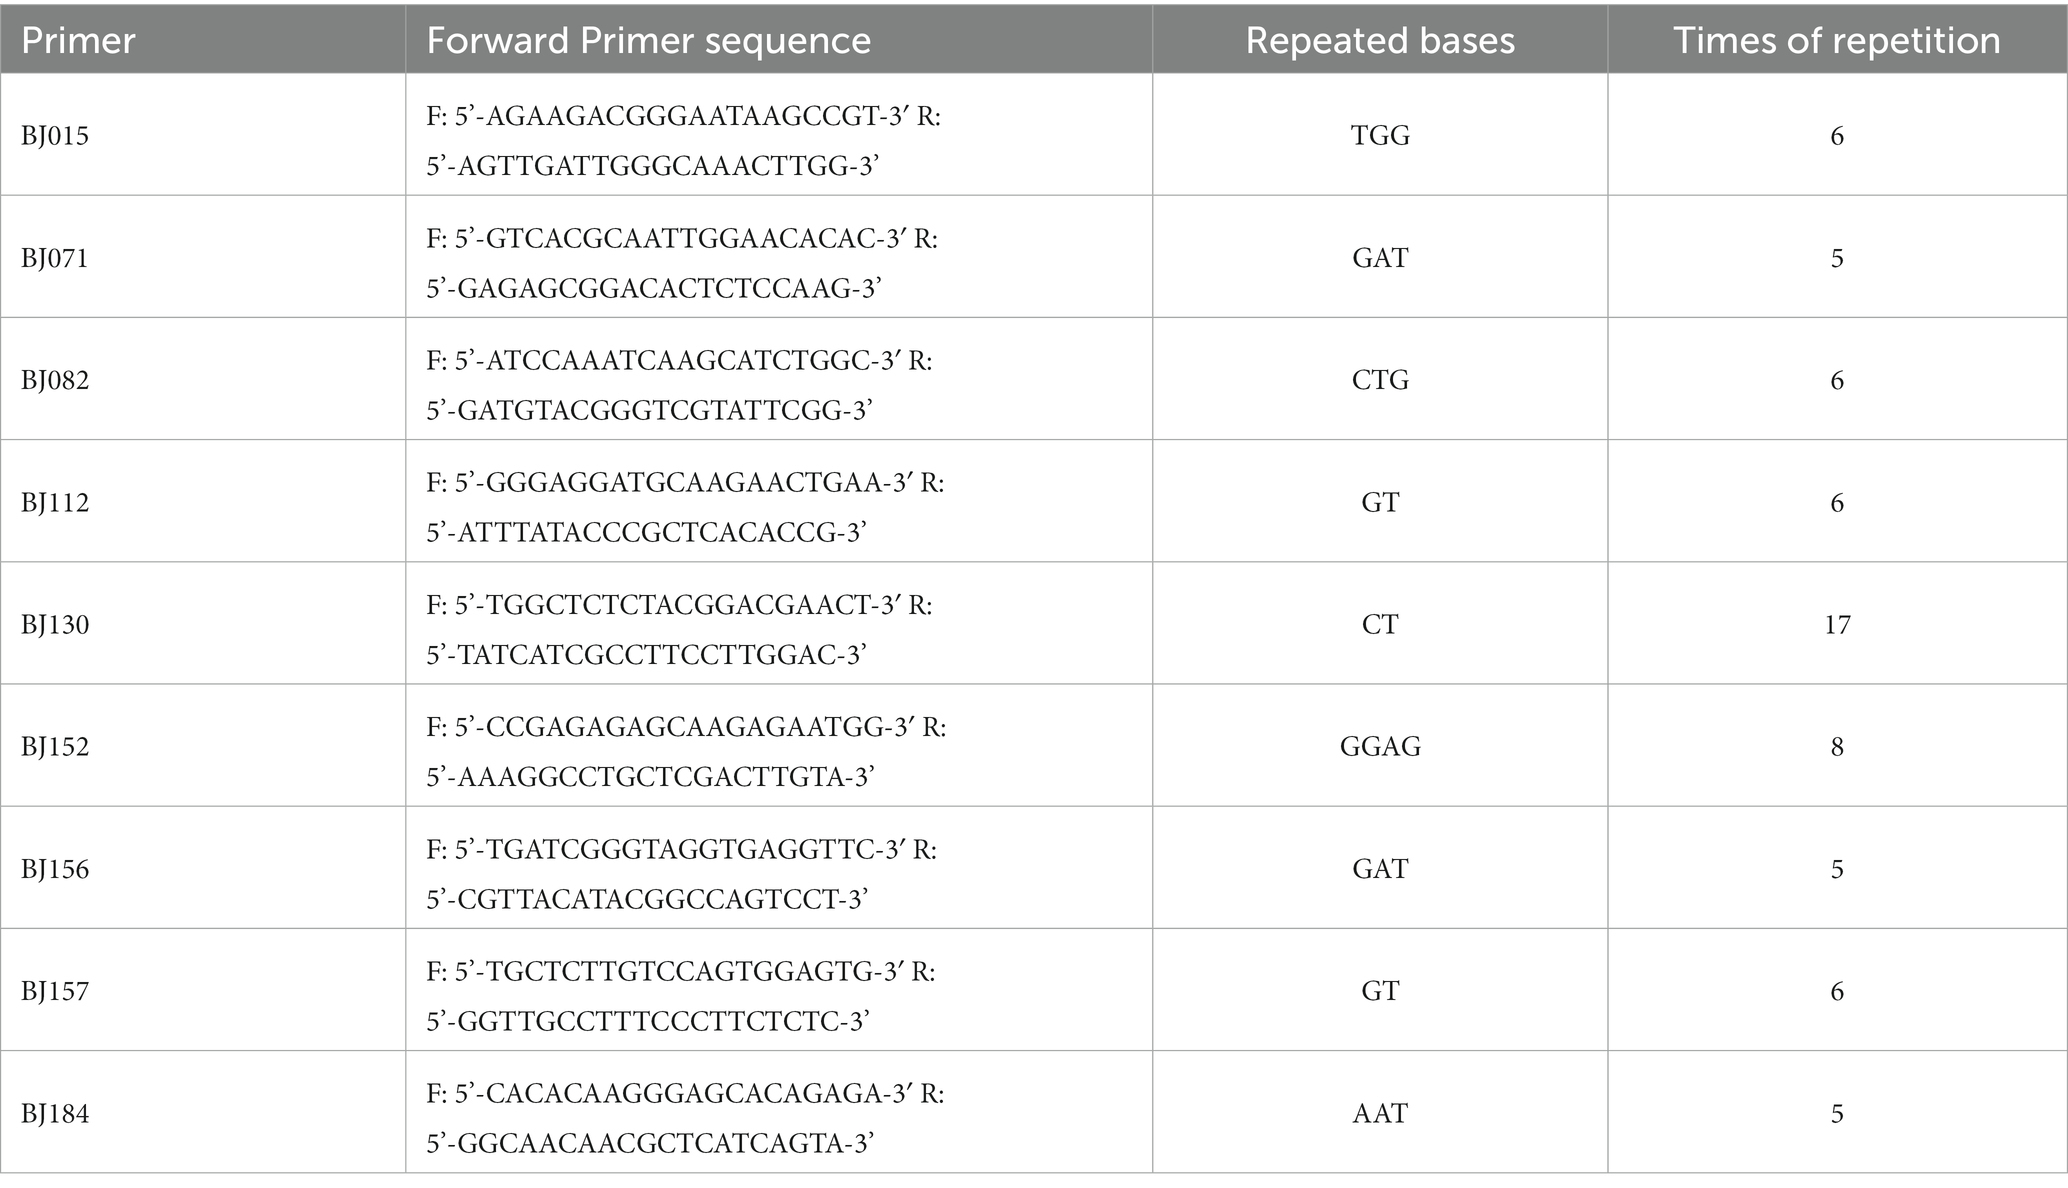
Table 4. Information for the nine pairs of SSR primers.
3.4. Polymorphism of the SSR loci
Sixty-six alleles (Na) were detected in the 22 populations at an average of 7.333 alleles/locus. BJ184 was the locus with the largest number of alleles (11). The values for Ne, He, and PIC were 1.963, 0.493, and 0.477, respectively. The value of Ne was in the range of 1.963 and 5.993, with an average of 3.370. BJ112 had the highest value of I (1.981) and BJ071 had the lowest value of I (1.044), with an average value of 1.414. The value of He ranged from 0.493 to 0.837, with a mean of 0.671. The value of PIC varied from 0.477 to 0.814, with an average of 0.630. For the overall PIC, one locus had values between 0.25 and 0.50 (moderately informative), while BJ015, BJ071, BJ082, BJ112, BJ130, BJ152, BJ156, and BJ157 had values >0.50 (highly informative, Table 5). Overall, the 9 pairs of SSR primers developed in this study had high polymorphisms, and can be used to analyze the genetic diversity of S. rolfsii.
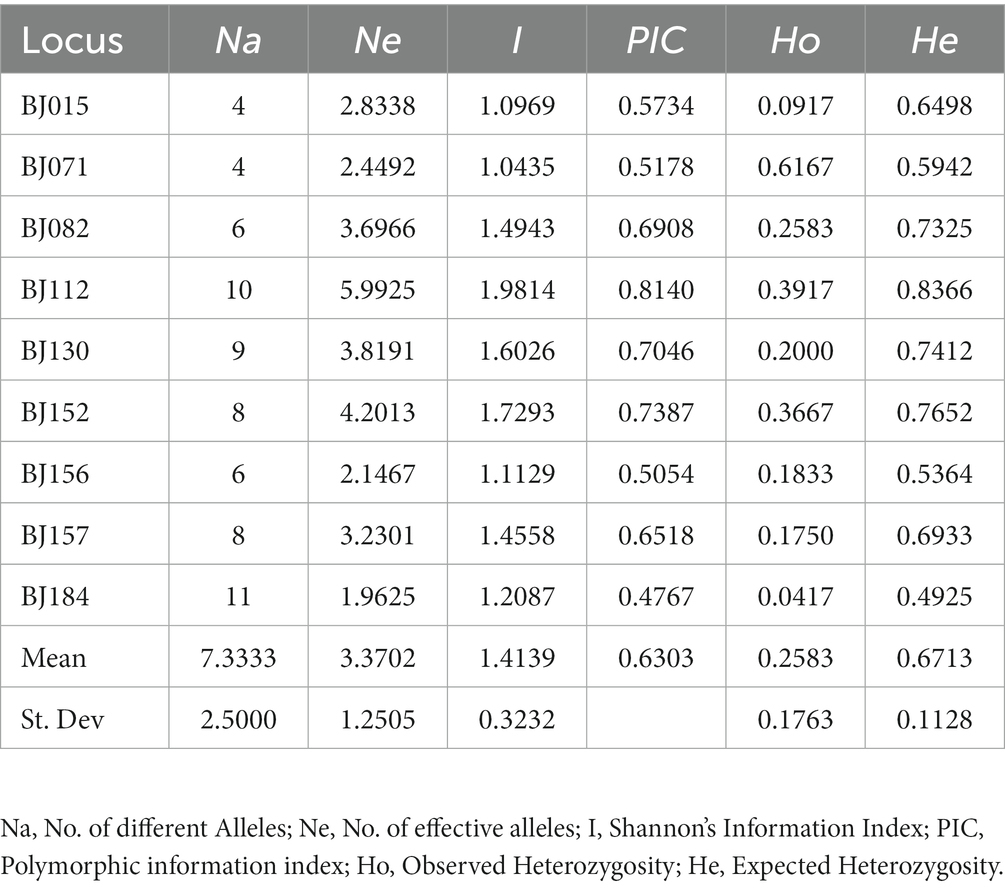
Table 5. Polymorphism of the 9 pairs of SSR primers.
3.5. Genetic diversity analysis
The genetic diversity of the S. rolfsii population was assessed based on the geographical origin, i.e., Anhui group, Guangxi group, Henan group, Hubei group, Hunan group, Sichuan group, and Shandong group (Table 6). The diversity indices, including Na (average number of alleles), Ne (number of effective alleles), I (Shannon’s Information Index), Ho (Observed Heterozygosity), He (Expected Heterozygosity), and F (Fixation Index), were calculated. The Ne value among 7 populations ranged from 1.231 to 3.281, and the highest and lowest levels of the Ne value were found in Henan and Hunan, respectively. The ranking was the same with the Shannon diversity index (I). Comprehensive analysis of the genetic diversity index revealed that the genetic diversity index of the Henan and Shandong populations was low. The low diversity within the Shandong group is most likely attributable to the smaller population size (four isolates). More significant diversity was observed in larger populations from Hunan (49 isolates) province.
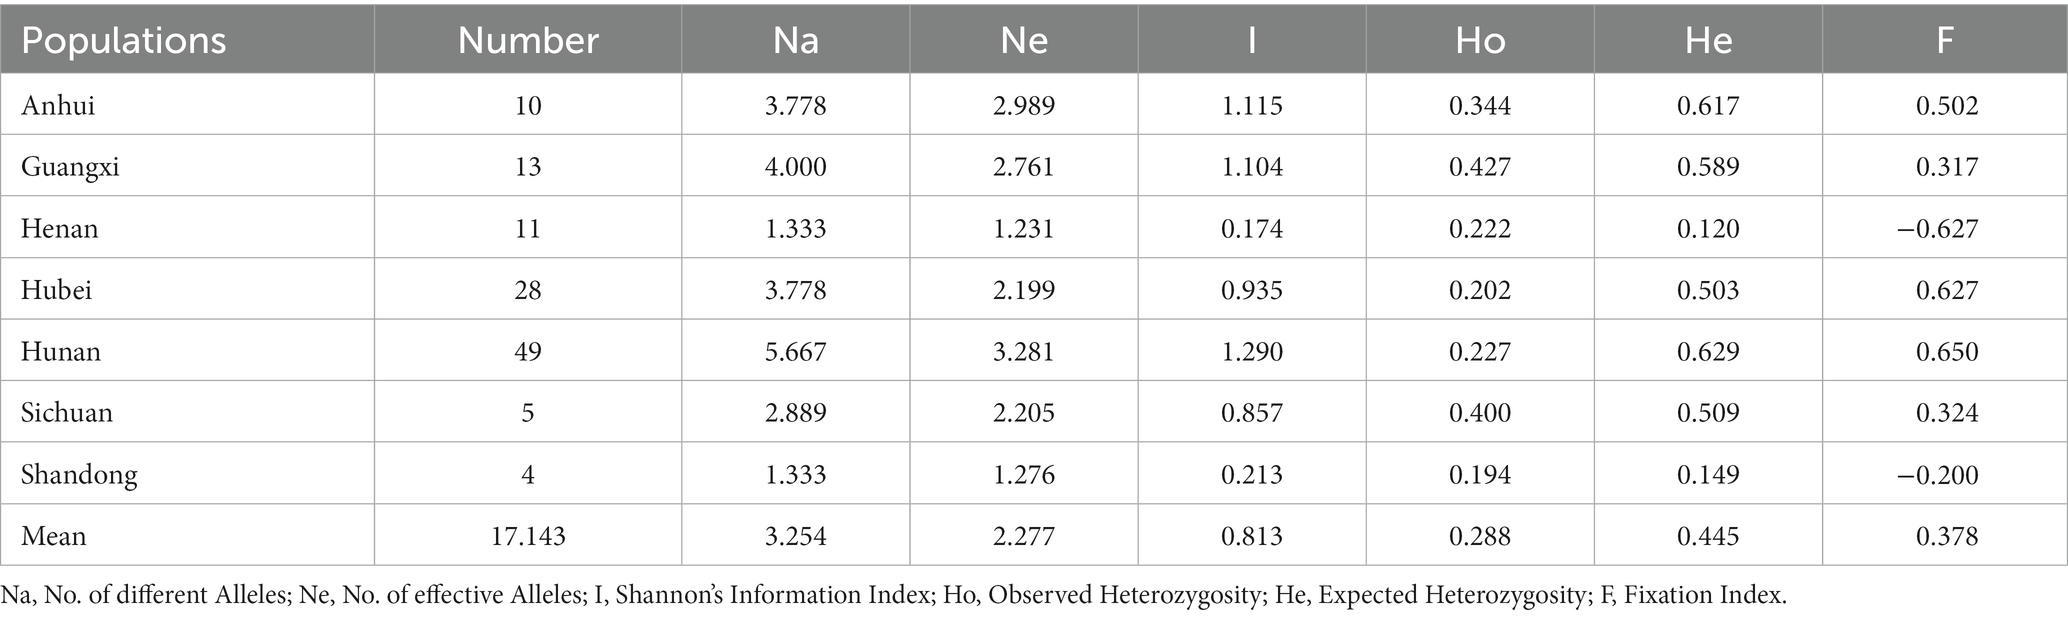
Table 6. The genetic diversity of Sclerotium rolfsii in different regions.
The genetic diversity of the S. rolfsii population was also assessed based on the host (Table 7). The estimate of the Ne value was lowest for the Amorphophallus rivieri group and highest for the Dendrobium nobile group. The ranking was the same with the Shannon diversity index (I). The highest and lowest levels of diversity were found in D. nobile and A. rivieri, respectively. The fixation index (F) of the geographical population and host population were significantly greater than or less than 0, indicating the absence of heterozygotes or homozygotes.
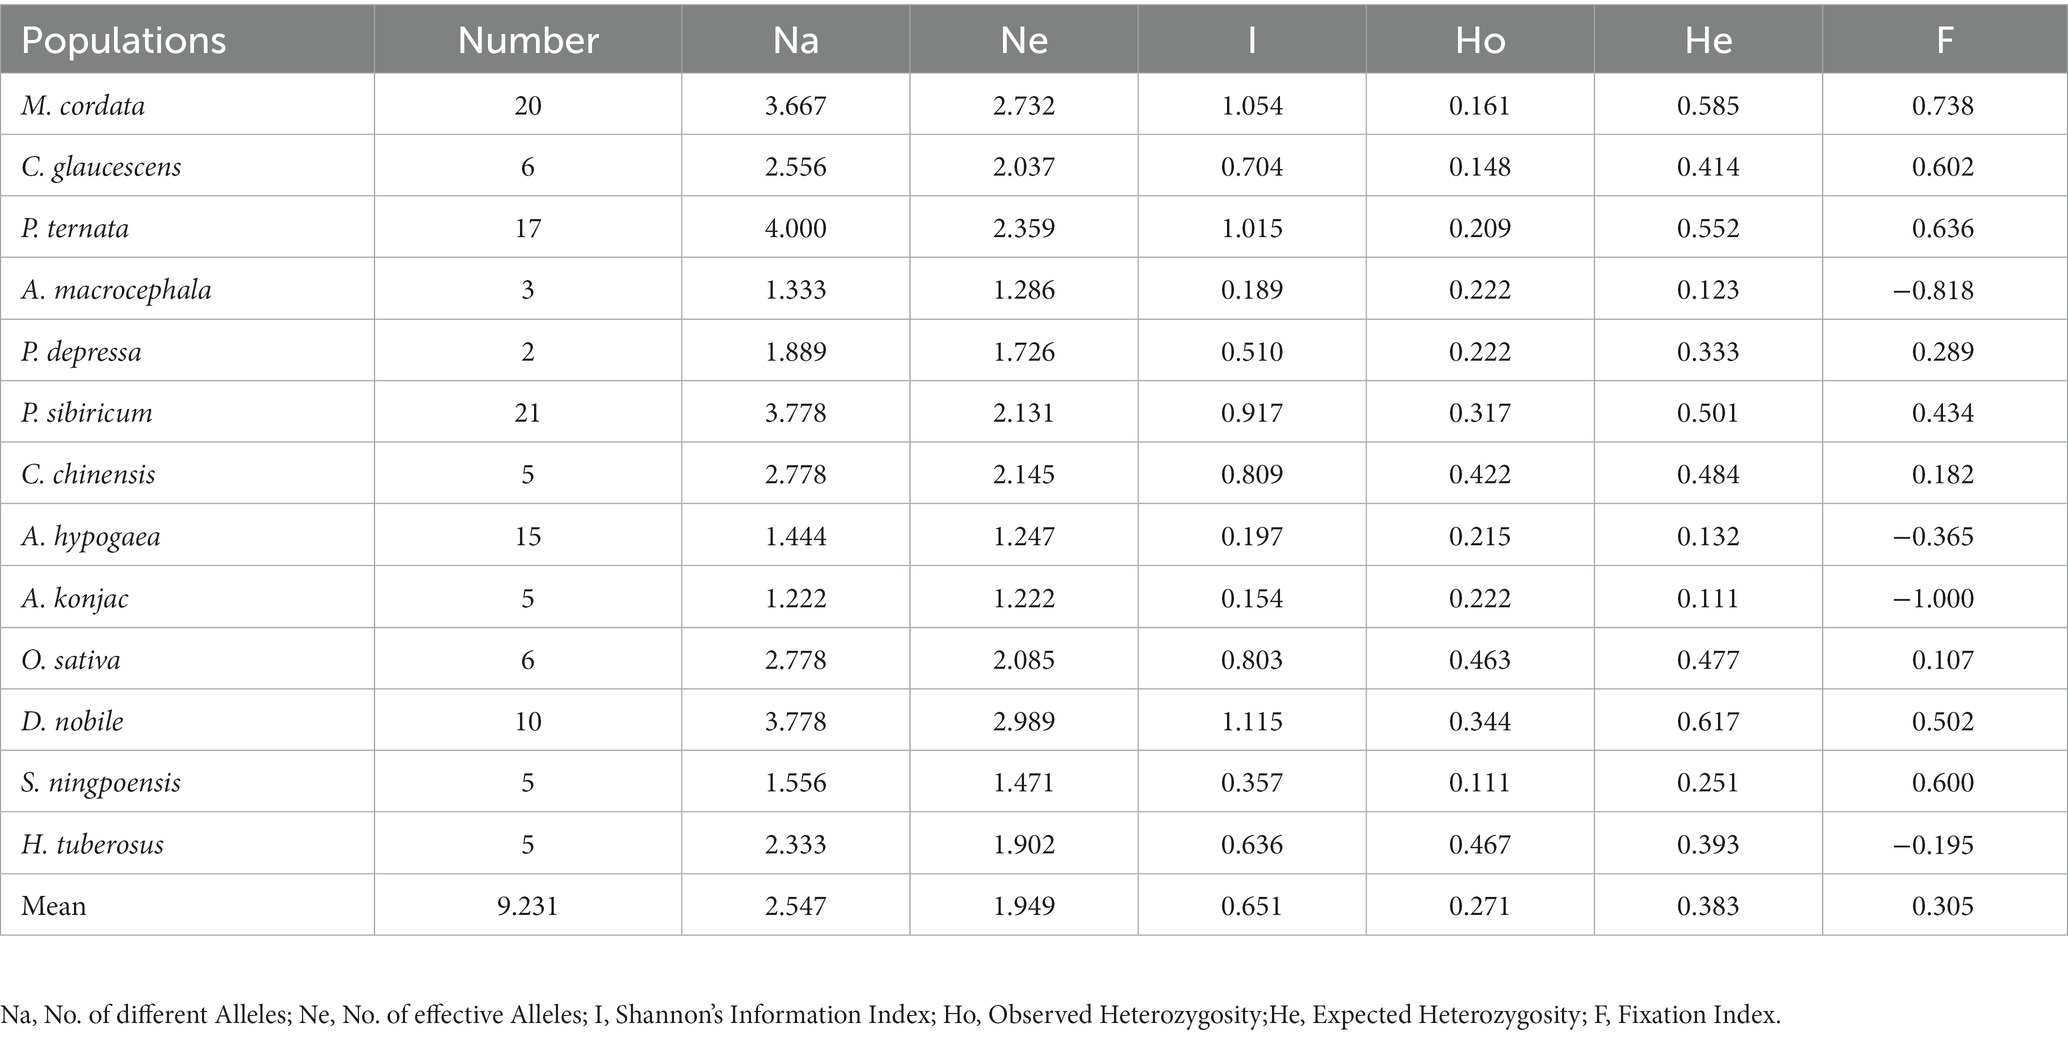
Table 7. The genetic diversity of different host populations.
3.6. Analysis of molecular variance (AMOVA)
The seven populations were analyzed to determine the genetic variation among and within populations using AMOVA (Table 8). Based on the analysis, 28% variation was observed among the population and 72% was observed within the population. A variation was observed among geographical populations and within populations, and the variation within populations was 2.5-fold that between populations. The genetic variation was mainly derived from within populations. The analysis of gene flow and genetic differentiation between the two populations showed that the gene flow value ranged from 0.055 (Sichuan/Henan) to 10.254 (Hunan/Anhui), and the genetic differentiation value ranged from 0.024 (Anhui/Hunan) to 0.819 (Henan/Sichuan; Table 9). Overall, gene flow was frequent and the variation was not obvious in Anhui Province and Hunan Province, while the gene flow value was small and genetic variation was large in Sichuan Province and Henan Province, which might be related to the geographical difference.
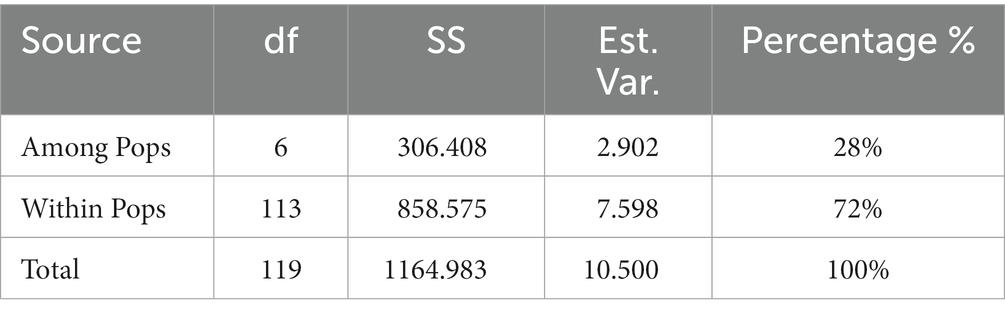
Table 8. AMOVA of the populations in different regions.
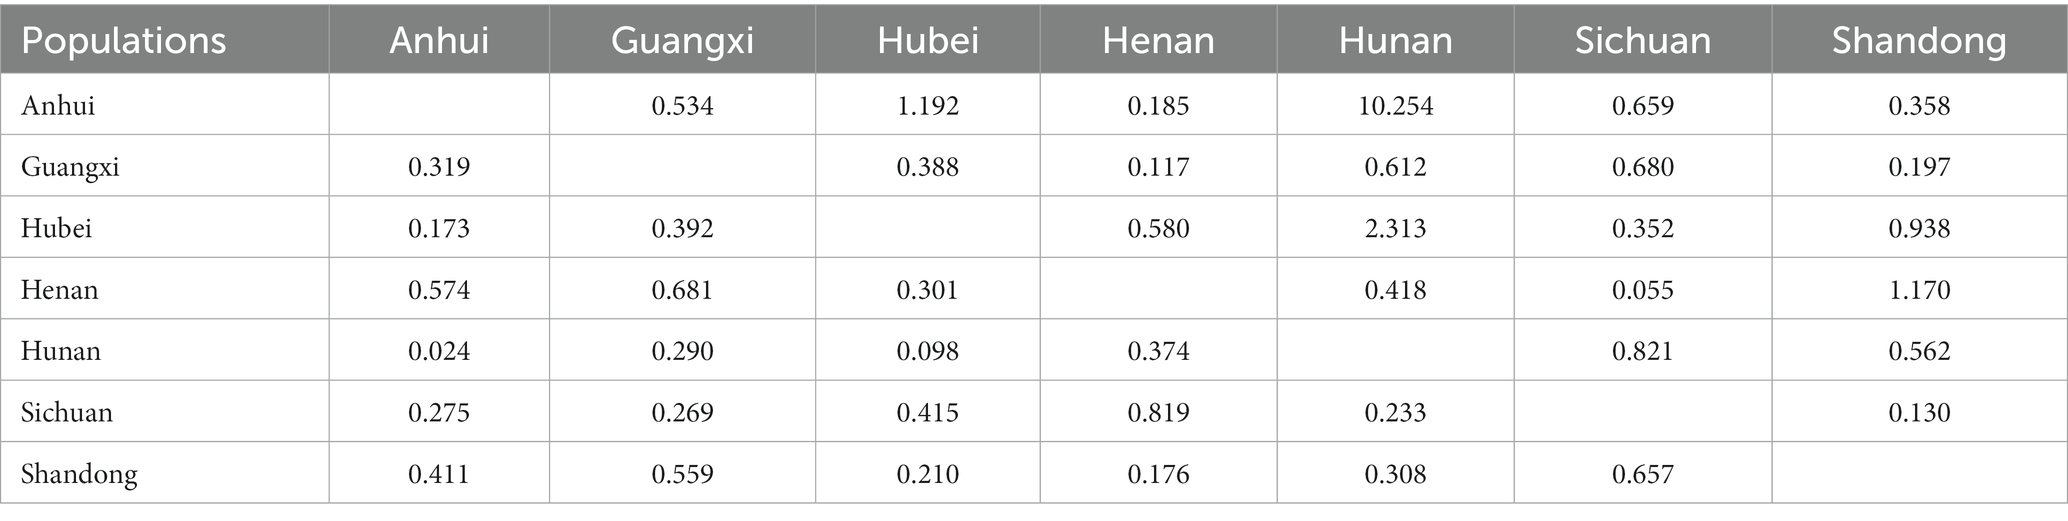
Table 9. Gene flow (above the diagonal) and genetic differentiation (below the diagonal) results of populations in different regions.
The 13 S. rolfsii clusters were further analyzed using hierarchical AMOVA and pairwise genetic differentiation. In the AMOVA test, total genetic variation was partitioned at two levels: among clusters and among isolates within clusters. This partition revealed that 39% of the total genetic variation was due to genetic differences among clusters, while the remnant and larger source of diversity (61%) was located among isolates within clusters (Table 10). Further analysis of gene flow and genetic differentiation between the two populations revealed that the gene flow values ranged from 0.003 (A. rivieri/A. macrocephala) to 17.531 (S. ningpoensis/P. ternata), and the genetic differentiation values ranged from 0.014 (S. ningpoensis/P. ternata) to 0.990 (A. rivieri/A. macrocephala), except for the A. rivieri/A. hypogaea and P. ternata/C. glaucescens groups (Table 11). No genetic differentiation existed between A. rivieri and Arachis hypogaea, and Pinellia ternata and Cynanchum stauntonii. In contrast, the genetic differentiation between Scrophularia ningpoensis and P. ternata was relatively low, and that between A. rivieri and Atractylodes macrocephala was relatively obvious. The results were not obviously related to the host, but were related to the geographical origin of the host population.
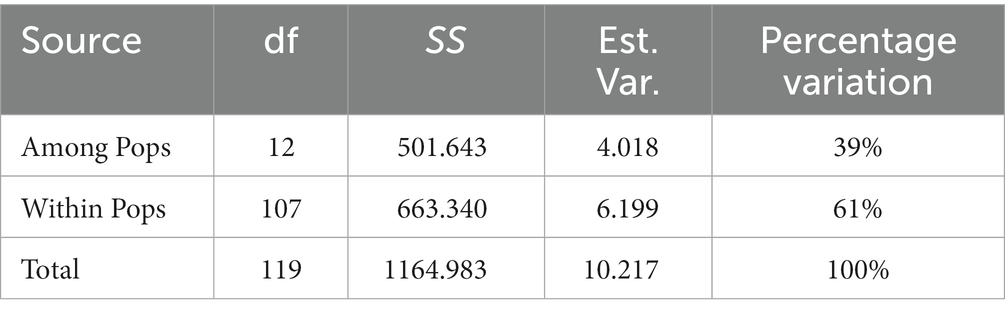
Table 10. AMOVA of the populations of different host populations.
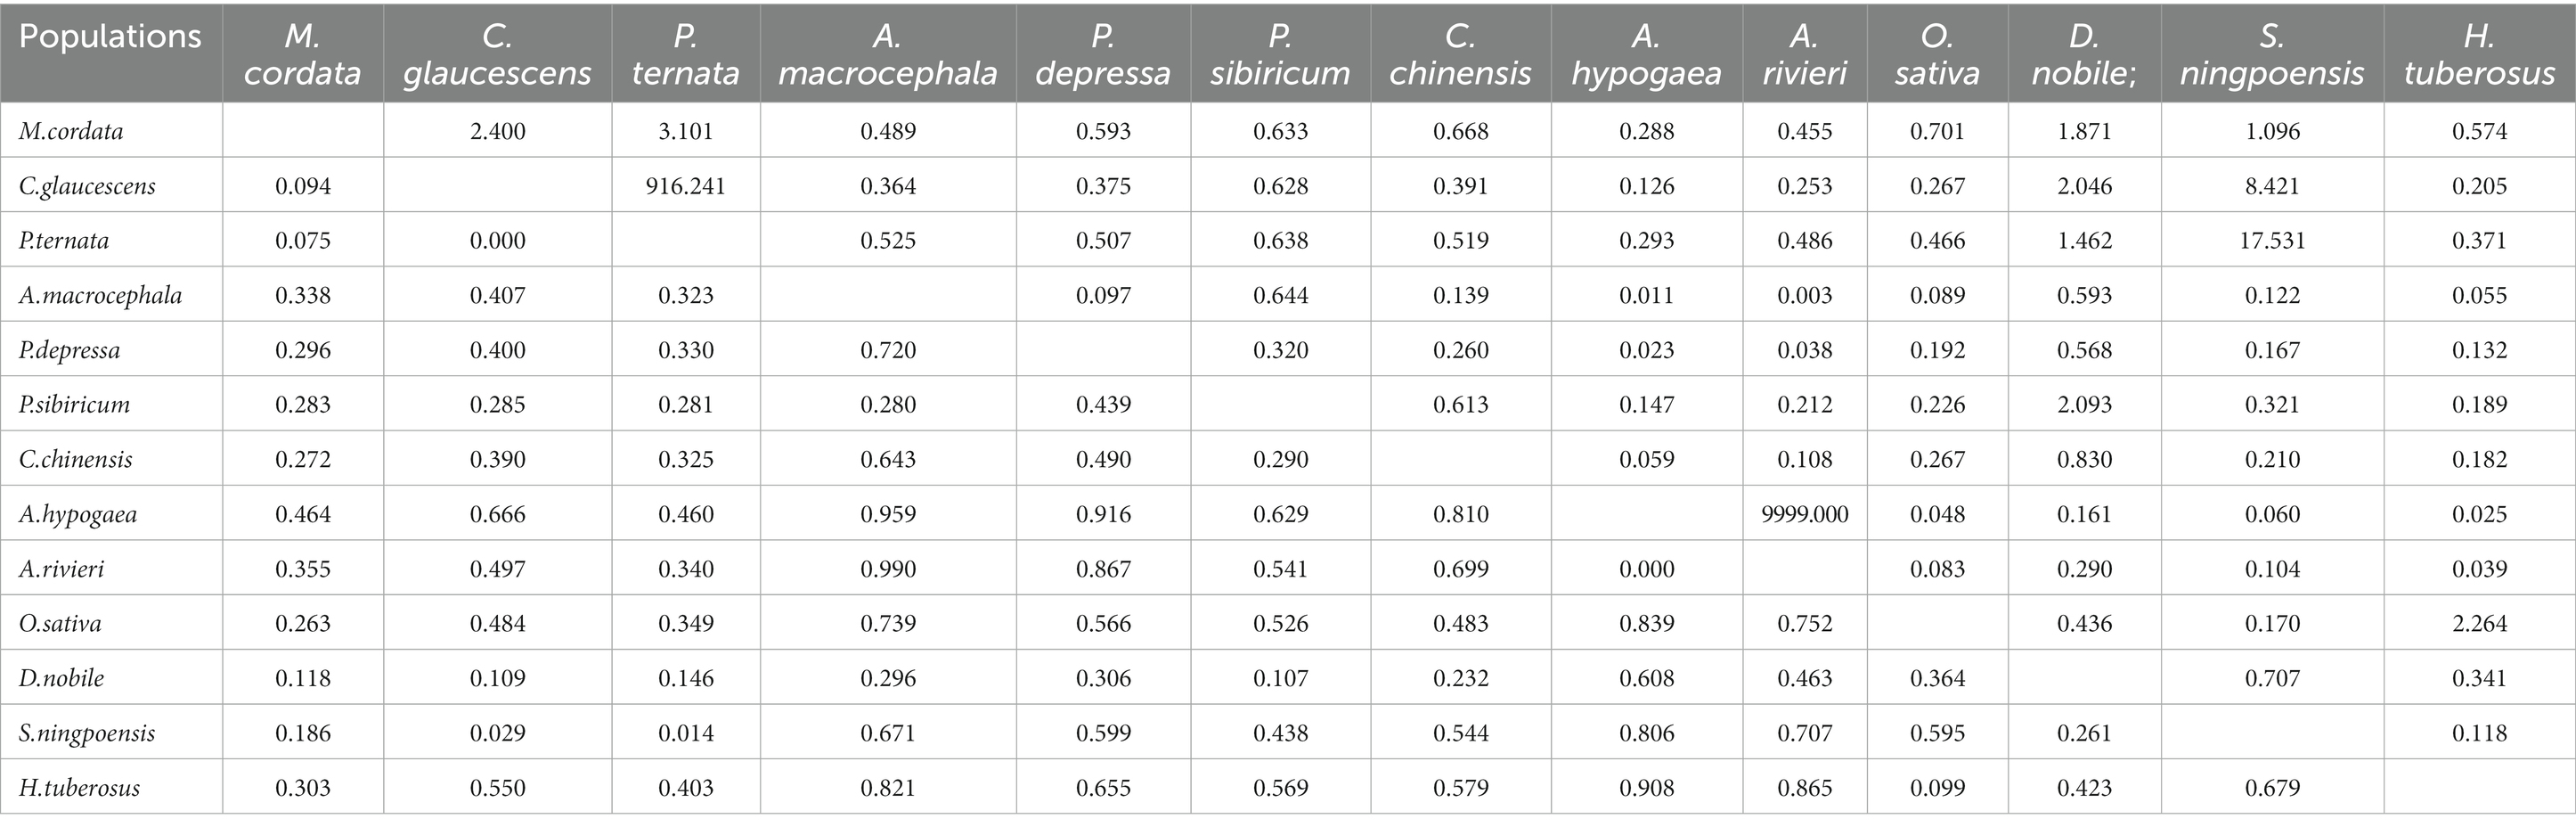
Table 11. Gene flow (above the diagonal) and genetic differentiation (below the diagonal) results of different host populations.
3.7. Population structure
Based on AMOVA, the differences between groups were mainly related to geographical location. The population structure of 7 geographical populations was analyzed. A clustering pattern was identified via STRUCTURE analysis. Using △K, which is an ad hoc statistic based on the rate of change in the log probability of data between successive K values (Evanno et al., 2005), a K value of 3 was identified, which suggested that the isolates were broadly divided into three populations (Figures 2, 3). Population 1 mainly comprised isolates from Henan, Shandong, and Hubei; population 2 mainly comprised isolates from Sichuan and Guangxi; and population 3 mainly comprised isolates from Anhui. The distribution of gene in each region is consistent with the geographical location.
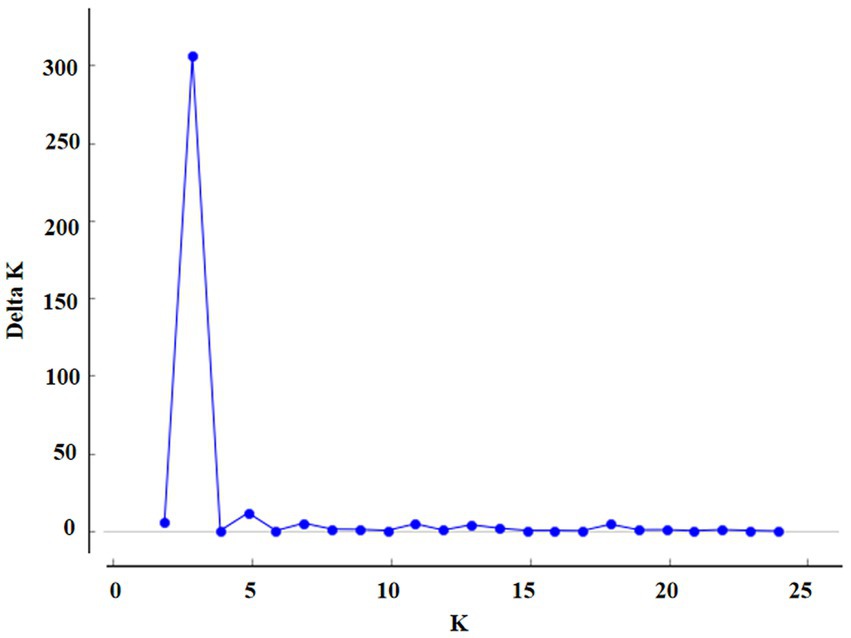
Figure 2. The magnitude of Delta K at each level of K.
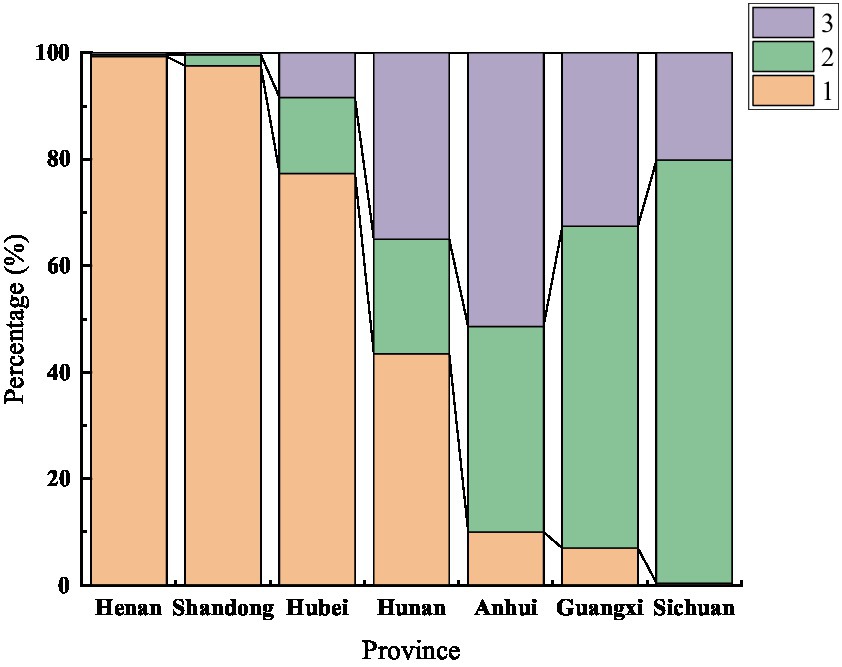
Figure 3. Structure results of the 7 populations (K = 3).
Based on the genetic distance of Nei, cluster analysis of the 7 populations were performed. Using UPGMA cluster analysis, the populations were grouped into two main clusters (Figure 4). Cluster A contained 5 populations, viz. Anhui, Hunan, Hubei, Henan, and Shandong, of which the first two and last three formed two separate sub-clusters. Cluster B contained two populations, viz. Guangxi and Sichuan.
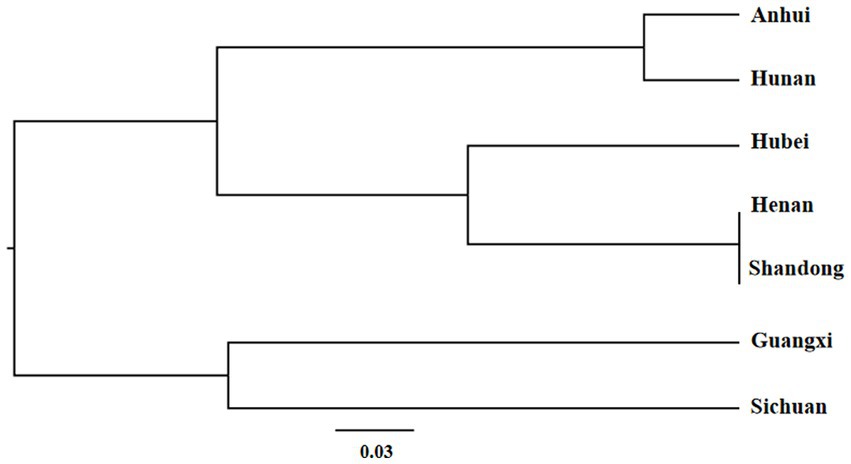
Figure 4. The UPGMA tree of the 7 populations.
4. Discussion
S. rolfsii, which causes root rot disease, is considered a serious problem affecting crop cultivation in contaminated areas due to its wide host range, genetic population diversity, and its ability to produce abundant resistant sclerotia. This disease causes severe damage during all stages of crop growth. Further, significant yield reduction caused by S. rolfsii infection has been reported in areas that grow various Chinese medicinal materials, such as in Hubei, Hunan, and Anhui provinces in China, with infection rates ranging from 5–42% (You et al., 2016; Nie et al., 2020; Zhang et al., 2020; Cheng et al., 2022). To our knowledge, the presence of S. rolfsii as a causal agent of southern blight disease on some Chinese medicinal materials was first revealed in this study. Owing to the high occurrence in these areas and lack of information on S. rolfsii population in this circumscribed area, we aimed to examine the S. rolfsii population from different hosts in China and locations, such as Hubei, Huan, Henan, Shandong, Anhiu, Guangxi, and Sichuan provinces. The present investigation revealed the molecular variability among the 120 isolates of S. rolfsii collected from 13 host crops belonging to various locations in 2017–2021.
The genetic diversity of fungal pathogens is essential for assessing the characteristics and diversity of fungal pathogens and would be helpful for the development of an effective integrated disease management strategy. Molecular markers play a major role in analyzing the genetic variation of fungal pathogens (Zhang et al., 2014). In some studies, the molecular genetic diversity of the S. rolfsii isolates obtained from different hosts and/or geographical regions was tested using RAPD, ISSR, and other molecular means. Almeida et al. (2010) collected 30 S. rolfsii isolates from different hosts in Brazil and found significant genetic variability among isolates using RAPD analysis. During same period, Punja and Sun (2001) collected 132 S. rolfsii isolates from 13 countries and found high level of variations among samples based on RAPD analysis. Jebaraj et al. (2017) used RAPD and ISSR to assess the genetic diversity and population structure of 22 S. rolfsii isolates. Recent advances in large-scale RNA-seq have provided a fast, cost-effective, and reliable approach to generate large expression datasets in non-model species, thereby markedly accelerating the development of microsatellites (Bhandawat et al., 2016; Lei et al., 2017). Currently, RNA-seq has been used in the SSR development of G. yamadae and G. asiaticum (Tao et al., 2018). EST-SSR can detect numerous alleles, with high repeatability and inter-species transferability due to the presence of microsatellites regions throughout the transcriptome (Weng et al., 2020). In addition, EST-SSR can display the functional information of the sample genome, and the sequences identified in the homologous genes are more conserved, so it has the characteristics of large amount of information, good universality and simple development (Wu et al., 2014). EST-SSR is also an effective alternative for studying genetic variability, bio-effective populations, genome identification, kinship, etc. (Clauss et al., 2002; Hisano et al., 2007). To our knowledge, a study of S. rolfsii on different hosts and geographical regions using EST-SSR has not been previously performed. In the present study, 9 pairs of polymorphic primers were screened from 200 pairs of primers for S. rolfsii based on RNA-seq data and capillary electrophoresis detection technique. These methods were effective and cost saving, indicating the effective and feasible screening of EST-SSR primers using the sequencing method.
To obtain suitable EST-SSR primers for S. rolfsii with different morphological characteristics, such as mycelia growth rate and sclerotia, we collected and combined mycelia from three growth stages of the strain CB1 for RNA extraction. Transcriptomic SSR locus analysis revealed that tri-nucleotide repeats had the highest occurrence frequency, accounting for 52.53% of the repeats, which aligns with the results of previous reports on other fungi (Qian et al., 2013). However, tetra-nucleotide repeats tend to stutter less than tri-nucleotide and di-nucleotide repeats and are markedly more accurate and reliable (Weng et al., 2020). Therefore, one of the principles in selecting EST-SSR primers of S. rolfsii involved the selection of a sequence with a repeat unit of di- to penta-nucleotides to increase diversification. Among the nine selected primers, the tri-nucleotide repeat type accounted for the highest proportion of 55.56%, followed by di-nucleotides and tetra-nucleotides, which accounted for 33.33 and 11.11%, respectively. Therefore, EST-SSRs primers containing tri-nucleotide and di-nucleotide repeats are more suitable for this study, possibly due to species. Broquet et al. (2007) proposed that the number of microsatellite markers has an important implication for all subsequent analyses. Too many markers may increase genotyping errors and false genotypes, and overestimate the population size; however, too few or insufficient markers may lead to underestimation. In the nine EST-SSRs primers, 5–6 repetitions accounted for the majority (77.78%).
A total of 66 allelic loci were detected by the 9 primers in the 120 strains. The mean value of the Shannon index (I) was 1.4139, while that of the polymorphic information index (PIC) was 0.6303, indicating good polymorphism with S. rolfsii. Due to the large number of S. rolfsii isolates and the confusion of host and geographical origin in this study, we divided the isolates into 7 geographic populations and 13 host populations for genetic diversity analysis. Comprehensive analysis of the genetic diversity index revealed that the genetic diversity of the Henan populations was low, and the Hunan population had the highest diversity. This result might be due to the incomparability of host species and population size among these groups (n = 49 for Hunan, n = 11 for Henan, and 4 hosts for Hunan, 1 host for Henan). Comprehensive analysis of the genetic diversity index of the host populations revealed that A. rivieri had the lowest genetic diversity index and D. nobile had the highest genetic diversity index. The results of the present study align with those of Gupta et al. (1994), Rathour et al. (2004), and Mishra et al. (2006) where a significant level of genetic variations among fungal pathogens was found. Genetic variation and the stability of genetic diversity are crucial to the evolutionary potential and long-term interest of any species, whose estimates are a major component of conservation studies (Lozier, 2014).
AMOVA analysis showed that genetic differentiation was more related to geographical location than to the host. A variability study of S. rolfsii based on mycelial compatibility, rDNA, RAPD, and AFLP is commonly used to understand the distribution pattern of populations within and between different geographical regions (Punja and Sun, 2001; Adandonon et al., 2005). Early studies involving MCG analysis of S. rolfsii suggested a correlation between MCG and the geographical source of isolates, which is relatively similar to the results of this study (Remesal et al., 2012). Akram et al. (2015) collected 20 isolates of S. rolfsii from different host plants and various geographical locations to carry out genetic diversity analysis based on RAPD. Their results revealed no correlation between cultural, morphological characters, origin of hosts, and geographical location with molecular diversity. In a similar study, Song et al. (2021) found no significant correlation between genetic diversity and geographical origin using 39 S. rolfsii strains from 12 provinces in China based on ISSR and ITS-RFLP genetic analysis. Jebaraj et al. (2017) also showed that the nature and type of host may influence genetic variation between the isolates using nuclear (RAPD & ISSR) markers. Of note, all diversity indices are affected by sample size (Barrantes and Sandoval, 2009; Weng et al., 2020). Thus, the above results will be affected by the low sample size of each group. More detailed studies must be performed to confirm this relationship and its overall significance.
Based on AMOVA, STRUCTURE analysis of the seven geographic populations revealed that they can be divided into three groups. STRUCTURE analysis revealed three gene banks in the seven populations. The distribution of gene banks in each population was related to the geographical location. Cluster analysis showed that the closely spaced populations grouped in one cluster (sub-cluster A2 and cluster B), suggesting a correlation between the genetic and geographical location of the population. The sampling point of Anhui is located at the junction of Anhui and Hubei, and Hubei and Hunan are adjacent to each other with frequent exchanges. As a result, Anhui and Hunan belonged to one branch in the clustering results. The limited number of specimens may also be the reason for the results. The sample size should be sufficiently large to ensure the results reflect the true ecological patterns that could otherwise lead to contingencies.
5. Conclusion
In this study, 120 S. rolfsii isolates from 13 hosts in 7 provinces of China were isolated, purified, and identified. Based on the transcriptional sequencing of strain CB1, the SSR loci were analyzed and nine EST-SSR primers with good polymorphism were developed. To our knowledge, this is the first use of the EST-SSR method to analyze the genetic diversity of S. rolfsii, especially from areas that grow Chinese medicinal materials in China, which revealed the existence of broader genetic variations among the pathogen. Such finding will facilitate the development of effective disease management strategies based on molecular breeding and other advanced approaches. The results of population STRUCTURE analysis were consistent with those of geographical location, which preliminarily proved that geographical location had a certain correlation with the genetic diversity of pathogen. In future studies, we will collect more S. rolfsii specimens from more regions and hosts. Using larger datasets should better reflect the distribution and genetic status of S. rolfsii.
Data availability statement
The datasets presented in this study can be found in online repositories. The names of the repository/repositories and accession number(s) can be found in the article/Supplementary material.
Author contributions
FW designed and performed the research, analyzed transcriptomic data, developed EST-SSR primers, and wrote the manuscript. TT and TM collected the experimental samples. YD and XG participated in the genetic diversity analysis, participated in the revision of the manuscript. JY conceived this work, revised, and approved the final version of the manuscript. All authors contributed to the article and approved the submitted version.
Funding
This work was supported by the Science and Technology Planning Project of Enshi Tujia and Miao Autonomous Prefecture (XYJ2022000027), the Science Funds for Young Scholar of Hubei Academy of Agricultural Sciences (2023NKYJJ30), Central government guides local science and technology development fund projects (2022BGE256), China Agriculture Research System (CARS-21), and the Forestry Science and Technology Project of Central Finance (2021TG16).
Conflict of interest
The authors declare that the research was conducted in the absence of any commercial or financial relationships that could be construed as a potential conflict of interest.
Publisher’s note
All claims expressed in this article are solely those of the authors and do not necessarily represent those of their affiliated organizations, or those of the publisher, the editors and the reviewers. Any product that may be evaluated in this article, or claim that may be made by its manufacturer, is not guaranteed or endorsed by the publisher.
Supplementary material
The Supplementary material for this article can be found online at: https://www.frontiersin.org/articles/10.3389/fmicb.2023.1152865/full#supplementary-material
Footnotes
References
Adandonon, A., Aveling, T. A., van der Merwe, N. A., and Sanders, G. (2005). Genetic variation among Sclerotium isolates from Benin and South Africa, determined using mycelial compatibility and ITS rDNA sequence data. Australas. Plant Pathol. 34, 19–25. doi: 10.1071/ap04071
Akram, M., Saabale, P. R., Kumar, A., and Chattopadhyay, C. (2015). Morphological, cultural and genetic variability among Indian populations of Sclerotium rolfsii. J. Food Legum. 28, 330–334. https://indianjournals.com/ijor.aspx?target=ijor:jfl&volume=28&issue=4&article=011
Almeida, A., Abdelnoor, R. V., Calvo, E. S., Tessnman, D., and Yorinori, J. T. (2010). Genotypic diversity among brazilian isolates of Sclerotium rolfsii. J. Phytopathol. 149, 493–502. doi: 10.1046/j.1439-0434.2001.00651.x
Barrantes, G., and Sandoval, L. (2009). Conceptual and statistical problems associated with the use of diversity indices in ecology. Rev. Biol. Trop. 57, 451–460. doi: 10.15517/rbt.v57i3.5467
Bhandawat, A., Singh, G., Raina, A. S., Kaur, J., and Sharma, R. K. (2016). Development of genic SSR marker resource from RNA-Seq data in Dendrocalamus latiflorus. J. Plant Biochem. Biotechnol. 25, 179–190. doi: 10.1007/s13562-015-0323-9
Broquet, T., Ménard, N., and Petit, E. (2007). Noninvasive population genetics: a review of sample source, diet, fragment length and microsatellite motif effects on amplification success and genotyping error rates. Conserv. Genet. 8, 249–260. doi: 10.1007/s10592-006-9146-5
Cheng, A., Li, P., and Liu, D. (2022). First report of southern blight of Dendrobium huoshanense caused by Sclerotium rolfsii in Lu’an, China. Plant Dis. 107:560. doi: 10.1094/pdis-03-22-0586-pdn
Clarkson, J. P., Coventry, E., Kitchen, J., Carter, H. E., and Whipps, J. M. (2013). Population structure of Sclerotinia sclerotiorum in crop and wild hosts in the UK. Plant Pathol. 62, 309–324. doi: 10.1111/j.1365-3059.2012.02635.x
Clauss, M. J., Cobban, H., and Mitchell-Olds, T. (2002). Cross-species microsatellite markers for elucidating population genetic structure in Arabidopsis and Arabis (Brassicaeae). Mol. Ecol. 11, 591–601. doi: 10.1046/j.0962-1083.2002.01465.x
Dwivedi, S. K., and Prasad, G. (2016). Integrated management of Sclerotium rolfsii: an overview. Eur. J. Biomed. Pharm. Sci. 3, 137–146. https://www.researchgate.net/publication/326519037_INTEGRATED_MANAGEMEMA_OF_SCLEROTIUM_ROLFSII_AN_OVERVIEW
Evanno, G., Regnaut, S., and Goudet, J. (2005). Detecting the number of clusters of individuals using the software STRUCTURE: a simulation study. Mol. Ecol. 14, 2611–2620. doi: 10.1111/j.1365-294x.2005.02553.x
Grabherr, M. G., Haas, B. J., Yassour, M., Levin, J. Z., Thompson, D. A., Amit, I., et al. (2011). Full-length transcriptome assembly from RNA-Seq data without a reference genome. Nat. Biotechnol. 29, 644–652. doi: 10.1038/nbt.1883
Gupta, M., Chyi, Y. S., Romero-Severson, J., and Owen, J. L. (1994). Amplification of DNA markers from evolutionarily diverse genomes using single primers of simple-sequence repeats. Theor. Appl. Genet. 89-89, 998–1006. doi: 10.1007/bf00224530
Hisano, H., Sato, S., Isobe, S., Sasamoto, S., Wada, T., Matsuno, A., et al. (2007). Characterization of the soybean genome using EST-derived microsatellite markers. DNA Res. 14, 271–281. doi: 10.1093/dnares/dsm025
Jebaraj, M. D., Aiyanathan, K. E. A., and Nakkeeran, S. (2017). Virulence and genetic diversity of Sclerotium rolfsii Sacc., infecting groundnut using nuclear (RAPD and ISSR) markers. J. Environ. Biol. 38, 147–159. doi: 10.22438/jeb/38/1/ms-274
Khatri, K., Kunwar, S., Barocco, R. L., and Dufault, N. S. (2017). Monitoring fungicide sensitivity levels and mycelial compatibility groupings of Sclerotium rolfsii isolates from Florida peanut fields. Peanut Sci. 44, 83–92. doi: 10.3146/PS17-7.1
Lei, C., Bei, W., Wang, X., du, X., Jiao, Y., Huang, R., et al. (2017). Development of SSR marker by RNA-seq and its application in genotyping pearl sac in pearl oyster Pinctada fucata martensii. Electron. J. Biotechnol. 25, 70–74. doi: 10.1016/j.ejbt.2016.11.004
Li, M., Li, S., Zhang, Z. X., Du, P. Q., Zhou, L., and Dong, W. S. (2021). Sensitivity to carboxin and population diversity of Sclerotium rolfsii from peanut in Henan province. J. Henan Agric. Sci. 50, 64–73. doi: 10.15933/j.cnki.1004-3268.2021.05.009
Li, Z., Zhang, M., Wang, Y., Li, R., and Fernando, W. D. (2008). Mycelial compatibility group and pathogenicity variation of Sclerotinia sclerotiorum populations in sunflower from China, Canada and England. Plant Pathol. J. 7, 131–139. doi: 10.3923/ppj.2008.131.139
Liu, J., Meng, Q., Zhang, Y., Xiang, H., Li, Y., Shi, F., et al. (2018). Mycelial compatibility group and genetic variation of sunflower Sclerotinia sclerotiorum in Northeast China. Physiol. Mol. Plant Pathol. 102, 185–192. doi: 10.1016/j.pmpp.2018.03.006
Lozier, J. D. (2014). Revisiting comparisons of genetic diversity in stable and declining species: assessing genome-wide polymorphism in N orth a merican bumble bees using RAD sequencing. Mol. Ecol. 23, 788–801. doi: 10.1111/mec.12636
Luo, H., Wang, X., Zhan, G., Wei, G., Zhou, X., Zhao, J., et al. (2015). Genome-wide analysis of simple sequence repeats and efficient development of polymorphic SSR markers based on whole genome re-sequencing of multiple isolates of the wheat stripe rust fungus. PLoS One 10:e0130362. doi: 10.1371/journal.pone.0130362
Mehri, Z., Khodaparast, S. A., Aalami, A., Mousanejad, S., Masigol, H., and Grossart, H. P. (2020). Population genetics and gene sequence analysis of Athelia rolfsii collected from northern Iran. Mycol. Iran. 7, 195–203. doi: 10.22043/MI.2021.124012
Mishra, D., Singh, U. D., Dash, A. B., Reddy, J. N., Sridhar, R., George, M. L. C., et al. (2006). Analysis of Pyricularia grisea populations from three different blast epidemics. Int. Rice Res. Notes 31, 22–24. doi: 10.3860/irrn.v31i1.1186
Nie, Q. W., Zheng, T. W., Liu, L., Jiang, J. W., Cheng, S., Hsiang, T., et al. (2020). First report of southern blight on Pinellia ternata caused by Athelia rolfsii in China. Plant Dis. 104:1539. doi: 10.1094/pdis-11-19-2386-pdn
Peakall, R. O. D., and Smouse, P. E. (2012). GenAlEx 6.5: genetic analysis in excel. population genetic software for teaching and research - an update. Bioinformatics 28, 2537–2539. doi: 10.1093/bioinformatics/bts460
Punja, Z. K., and Sun, L. J. (2001). Genetic diversity among mycelial compatibility groups of Sclerotium rolfsii (teleomorph athelia rolfsii) and S. delphinii. Mycol. Res. 105, 537–546. doi: 10.1017/S0953756201004002
Qian, J., Xu, H., Song, J., Xu, J., Zhu, Y., and Chen, S. (2013). Genome-wide analysis of simple sequence repeats in the model medicinal mushroom Ganoderma lucidum. Gene 512, 331–336. doi: 10.1016/j.gene.2012.09.127
Rathour, R., Singh, B. M., Sharma, T. R., and Chauhan, R. S. (2004). Population structure of Magnaporthe grisea from North-Western Himalayas and its implications for blast resistance breeding of rice. J. Phytopathol. 152, 304–312. doi: 10.1111/j.1439-0434.2004.00846.x
Remesal, E., Jordán-Ramírez, R., Jiménez-Díaz, R. M., and Navas-Cortés, J. A. (2012). Mycelial compatibility groups and pathogenic diversity in Sclerotium rolfsii populations from sugar beet crops in Mediterranean-type climate regions. Plant Pathol. 61, 739–753. doi: 10.1111/j.1365-3059.2011.02552.x
Sarma, B. K., Singh, U. P., and Singh, K. P. (2002). Variability in Indian isolates of Sclerotium rolfsii. Mycologia 94, 1051–1058. doi: 10.1080/15572536.2003.11833160
Song, W. D., Yan, L. Y., Lei, Y., Huai, D. X., Kang, Y. P., Wang, Z. H., et al. (2021). Genetic diversity of Sclerotium rolfsii infecting groundnut based on ISSR and ITS-RFLP. Chin. J. Oil Crop Sci. 43, 724–730. doi: 10.19802/j.issn.1007-9084.2020096
Song, W. D., Yan, L. Y., Lei, Y., Wan, L. Y., Huai, D. X., Kang, Y. P., et al. (2018). Analysis of genetic variation among Sclerotium rolfsii isolates from China based on mycelial compatibility groups, ITS sequence and biological characteristics. Acta Phytopathol. Sin. 48, 305–312. doi: 10.13926/j.cnki.apps.000132
Sultana, F., and Hossain, M. M. (2022). Assessing the potentials of bacterial antagonists for plant growth promotion, nutrient acquisition, and biological control of southern blight disease in tomato. PLoS One 17:e0267253. doi: 10.1371/journal.pone.0267253
Tao, S. Q., Cao, B., Tian, C. M., and Liang, Y. M. (2018). Development and characterization of novel genic-ssr markers in apple-juniper rust pathogen Gymnosporangium yamadae (pucciniales: pucciniaceae) using next-generation sequencing. Int. J. Mol. Sci. 19:1178. doi: 10.3390/ijms19041178
Tok, F. M., Derviş, S., and Arslan, M. (2016). Analysis of genetic diversity of Sclerotinia sclerotiorum from eggplant by mycelial compatibility, random amplification of polymorphic DNA (RAPD) and simple sequence repeat (SSR) analyses. Biotechnol. Biotechnol. Equip. 30, 921–928. doi: 10.1080/13102818.2016.1208059
Ünal, F., Aşkın, A., Koca, E., Yıldırır, M., and Bingöl, M. Ü. (2019). Mycelial compatibility groups, pathogenic diversity and biological control of Sclerotium rolfsii on turfgrass. Egypt. J. Biol. Pest Control 29, 1–7. doi: 10.1186/S41938-019-0144-6
Weng, H., Tao, S. Q., and Liang, Y. M. (2020). Development of SSR markers from transcriptome data for the pear rust pathogen Gymnosporangium asiaticum. J. Phytopathol. 168, 559–570. doi: 10.1111/jph.12934
White, T. J., Bruns, T., Lee, S. J. W. T., and Taylor, J. (1990). Amplification and direct sequencing of fungal ribosomal RNA genes for phylogenetics. PCR Protocols Guide Methods Appl. 18, 315–322. doi: 10.1016/B978-0-12-372180-8.50042-1
Wu, J., Cai, C., Cheng, F., Cui, H., and Zhou, H. (2014). Characterisation and development of EST-SSR markers in tree peony using transcriptome sequences. Mol. Breed. 34, 1853–1866. doi: 10.1007/s11032-014-0144-x
Xie, C., Huang, C. H., and Vallad, G. E. (2014). Mycelial compatibility and pathogenic diversity among Sclerotium rolfsii isolates in the southern United States. Plant Dis. 98, 1685–1694. doi: 10.1094/pdis-08-13-0861-re
You, J. M., Liu, H., and Huang, B. J. (2016). First report of southern blight caused by Sclerotium rolfsii on Macleaya cordata in China. Plant Dis. 100:530. doi: 10.1094/pdis-06-15-0675-pdn
Zhang, Z., Hou, J. M., and Liu, T. (2020). First report of Sclerotium rolfsii causing southern blight in Artemisia argyi in China. Plant Dis. 104:980. doi: 10.1094/pdis-08-19-1810-pdn
Keywords: southern blight, Sclerotium rolfsii, molecular markers, genetic diversity, transcriptome
Citation: Wang F, Tang T, Mao T, Duan Y, Guo X and You J (2023) Development of EST-SSR primers and genetic diversity analysis of the southern blight pathogen Sclerotium rolfsii using transcriptome data. Front. Microbiol. 14:1152865. doi: 10.3389/fmicb.2023.1152865
Edited by:
Abhishek Walia, Chaudhary Sarwan Kumar Himachal Pradesh Krishi Vishvavidyalaya, IndiaReviewed by:
Vinay Kumar, ICAR-National Institute of Biotic Stress Management, IndiaRufeng Wang, Shanghai University of Traditional Chinese Medicine, China
Qi Tang, Hunan Agricultural University, China
Shaopeng Zhang, Wuhan Polytechnic University, China
Copyright © 2023 Wang, Tang, Mao, Duan, Guo and You. This is an open-access article distributed under the terms of the Creative Commons Attribution License (CC BY). The use, distribution or reproduction in other forums is permitted, provided the original author(s) and the copyright owner(s) are credited and that the original publication in this journal is cited, in accordance with accepted academic practice. No use, distribution or reproduction is permitted which does not comply with these terms.
*Correspondence: Jingmao You, amluZ21hb3lvdUAxMjYuY29t