
94% of researchers rate our articles as excellent or good
Learn more about the work of our research integrity team to safeguard the quality of each article we publish.
Find out more
ORIGINAL RESEARCH article
Front. Microbiol., 13 January 2023
Sec. Microbial Physiology and Metabolism
Volume 14 - 2023 | https://doi.org/10.3389/fmicb.2023.1034325
 Jiahui Feng1Zhizhong Gong1
 Zhangran Sun1,2Juan Li3
 Na Xu1
 Rick F. Thorne2,4
 Xu Dong Zhang2,4
 Xiaoying Liu1,2*
 Gang Liu1*
Microbiome and their metabolites are increasingly being recognized for their role in colorectal cancer (CRC) carcinogenesis. Towards revealing new CRC biomarkers, we compared 16S rRNA gene sequencing and liquid chromatography-mass spectrometry (LC–MS) metabolite analyses in 10 CRC (TCRC) and normal paired tissues (THC) along with 10 matched fecal samples (FCRC) and 10 healthy controls (FHC). The highest microbial phyla abundance from THC and TCRC were Firmicutes, while the dominant phyla from FHC and FCRC were Bacteroidetes, with 72 different microbial genera identified among four groups. No changes in Chao1 indices were detected between tissues or between fecal samples whereas non-metric multidimensional scaling (NMDS) analysis showed distinctive clusters among fecal samples but not tissues. LEfSe analyses indicated Caulobacterales and Brevundimonas were higher in THC than in TCRC, while Burkholderialese, Sutterellaceaed, Tannerellaceaea, and Bacteroidaceae were higher in FHC than in FCRC. Microbial association networks indicated some genera had substantially different correlations. Tissue and fecal analyses indicated lipids and lipid-like molecules were the most abundant metabolites detected in fecal samples. Moreover, partial least squares discriminant analysis (PLS-DA) based on metabolic profiles showed distinct clusters for CRC and normal samples with a total of 102 differential metabolites between THC and TCRC groups and 700 metabolites different between FHC and FCRC groups. However, only Myristic acid was detected amongst all four groups. Highly significant positive correlations were recorded between genus-level microbiome and metabolomics data in tissue and feces. And several metabolites were associated with paired microbes, suggesting a strong microbiota-metabolome coupling, indicating also that part of the CRC metabolomic signature was attributable to microbes. Suggesting utility as potential biomarkers, most such microbiome and metabolites showed directionally consistent changes in CRC patients. Nevertheless, further studies are needed to increase sample sizes towards verifying these findings.
Colorectal cancer (CRC) is the third most common cancer and the fourth leading cause of cancer related deaths worldwide, and the second cause of cancer death in China (Tian et al., 2016; Zhang et al., 2017). Over the last 20 years, CRC has been rapidly increasing in the population under 50 years old with predictions of 550,000 new CRC cases in 2022 with an estimated 50,630 deaths (Xia et al., 2022; Zheng et al., 2022). Approximately 41% of all CRCs occur in the proximal colon, 22% in the distal colon and 28% in the rectum (Thanikachalam and Khan, 2019). The exact etiology of CRC remains unclear, but both genetics and environmental factors play important roles in its occurrence and development (Gao et al., 2017). Contributing lifestyle variables including age, tobacco and alcohol consumption, lack of physical activity, increased body weight and diet (Foulkes, 2008; Johnson et al., 2013; Thomas et al., 2019). Currently, surgery, chemotherapy and radiation comprise the major treatment strategies for CRC, with surgical resection being most effective treatment for localized disease, while chemotherapy is the best option for patients with lymph node metastases (Haraldsdottir et al., 2014).
The early diagnosis of patients with CRC is critical. The 5-year survival rate could be up to 90% if CRC patients were diagnosed in the early stage (Zhang et al., 2017). Despite improvements in imaging technologies, the accurate diagnosis of CRC still represents a clinical challenge (Liao et al., 2015; Notarnicola et al., 2018). Endoscopy is increasingly used for CRC screening; however, this invasive technique suffers from poor patient compliance, and there is still widespread reluctance in the population associated with the procedure (Simon, 2016; Ladabaum et al., 2020). Thus, other clinical examination techniques are still needed for the early detection of CRC (Phua et al., 2014; Macias et al., 2020). Recently, noninvasive monitoring tests, such as molecular biomarkers have been promoted as alternative non-invasive diagnostic tools for CRC diagnosis (Liu et al., 2013; Hong et al., 2016; Xu et al., 2016; Zhang S. et al., 2020). Among these studies, cancer progression has been associated with changes in the microbiome and metabolomics of feces, plasma, serum and tissues, proposing these as potential new biomarkers for the screening of various cancers including CRC (Spratlin et al., 2009; Mamas et al., 2011; Zhang S. et al., 2020). Moreover, evidence has emerged that the changes in tissue and gut microbiome are not passive aftereffects of carcinogenesis but rather, play a mechanistic role linking various risk factors to CRC pathogenesis. Microbiome and metabolomics biomarkers have been considered important approaches to discover the potential biomarkers for monitoring CRC progression (Zhang et al., 2017). Notably, many of the known cancer risk factors are also key determinants of the structures and functions of microbiome (Yazici et al., 2017; Hale et al., 2018; Kim et al., 2020). For example, comparison of CRC patients with healthy control individuals showed distinct clusters and alterations in the composition of enteric archaea during tumorigenesis whereas CRC-associated fecal samples show significant enrichment and depletion of halophilic and methanogenic archaea, respectively (Coker et al., 2020). Furthermore, meta-analysis showed higher species richness in CRC-associated samples compared to controls, with the further discovery that specific microbiome such as Fusobacterium Parabacteroides, Streptococcus, and Lachnospiraceae are associated with CRC (Thomas et al., 2019). Intriguingly, gut enrichments of microbiome in CRC patients showed a rapid decline occurring in the early postoperative period, suggesting that they may serve as potential CRC biomarkers (Xie et al., 2017).
Other studies have shown that microbiome interact with their hosts mainly through signals triggered by microbial metabolites, and changes in microbial metabolic functions are implicated in CRC pathogenesis (Tian et al., 2016; Yang et al., 2019; Kim et al., 2020; Zhang Y. et al., 2020). Microbial metabolites are strongly associated with cancer progression, influencing host metabolism, cellular signal transduction, and immune responses (Davis et al., 2012; Buas et al., 2017). So rather than the microbiome themselves, their metabolome directly affects CRC development and pathogenesis (Puchades-Carrasco and Pineda-Lucena, 2017; Kim et al., 2020). Notably, microbial metabolites have been shown to occur differentially in the serum, plasma, and urine in CRC patients vs. control subjects (Tokunaga et al., 2018). Thus far, metabolomics-based methods have identified different substances associated with the degree of cancer progression (Buas et al., 2017; Tokunaga et al., 2018). In the literature, bioactive lipids, fatty acids, polyunsaturated fatty acids, secondary bile acids, and sphingolipids showed consistent alterations in CRC patients, suggesting that these may represent early events in carcinogenesis (Kim et al., 2020; Li et al., 2022). Other studies have shown significant overall associations between gut microbiome with metabolome and the incidence of CRC (Thomas et al., 2019; Kim et al., 2020). Hence, microbiome and metabolomic analyses of cancer tissues and feces are important microenvironment, being different from healthy people (Feng et al., 2015; Williams et al., 2015; Tian et al., 2016; Kim et al., 2020; Taddese et al., 2020).
The microbiome and metabolome of tissue and gut appear to be closely linked to the overall physiopathological status of an individual, and moreover found to be strongly associated with the degree of CRC progression and development (Kim et al., 2020; Li et al., 2022). Indeed, significant changes in microbiome and metabolites have also been reported in the cancer tissues or fecal samples of gastric and esophageal cancer (Xu et al., 2016; Tokunaga et al., 2018). However, less attention has been paid to the conjoint analysis of microbiome and metabolome changes and their combined association in cancer tissues and fecal samples in CRC. Thus, to better understand and validate the potential links, it is necessary to investigate tissue and gut microbiome and metabolome simultaneously in CRC patients. Herein, we profiled the microbial communities of cancer tissues and feces in CRC patients and healthy controls to identify biomarker microbiome using high-throughput sequencing of 16S rRNA. Then we used the same samples to undertake liquid chromatography-mass spectrometry (LC–MS) analyses of their metabolomic features. In addition, microbial genera and metabolite data of CRC were utilized for correlation analyses. In short, we present fecal and tissue microbiota signatures that are characteristics of CRC and their associations with their metabolomic and CRC pathogenesis. This approach aimed to define the dual microbial and metabolomic characteristics of cancer tissues and fecal samples associated with CRC, and to explore the potential biomarkers for diagnosis and prognosis of CRC. Our findings provide evidence and suggest a potentially practical direction for further targeted experiments and developing new CRC prevention strategies.
This study was approved by the institutional review board of Anhui Medical University (20200491).
Ten patients and ten healthy volunteers were recruited from the First Affiliated Hospital of Anhui Medical University, China from 2020 to January 2022 (Supplementary Table S1). Inclusion criteria were as follows: (1) all participants were older than 18 and younger than 61 at the time of sample collection. (2) Diagnosis of CRC was defined according to clinical, radiological, endoscopic and histological criteria, and without other disease, and the TNM classification system was used for staging of patients with CRC as having TNM stages II/III disease. (3) None of the patients or healthy volunteers were treated with antibiotics, colon-cleansing products, or hormones within 1 month, nor did they receive radiation or chemotherapy before sample collection.
Ten tissue and fecal samples were collected from ten CRC patients. Additionally, ten tissue and fecal samples, respectively, were collected from the ten healthy volunteers. All tissues were frozen in liquid nitrogen immediately after the operation and stored longer term at −80°C until extraction of total DNA and protein. Stool samples were collected in sterile centrifuge tube on ice, and then immediately transferred to the laboratory and frozen at −80°C for further analysis. CRC tissue samples and their paired normal tissues were designated as TCRC (n = 10, sample No. TCRC1-10) and THC (n = 10, sample No. THC1-10), respectively. Healthy fecal samples and CRC fecal samples were designated as FHC (n = 10, sample No. FHC1-10) and FCRC (n = 10, sample No. FCRC1-10), respectively.
Microbiota sequencing and LC–MS analysis followed the scheme in Supplementary Figure S1. Microbial DNA was isolated from fecal samples using the MagPure Soil DNA LQ Kit (Magen, Guangdong, China) according to the manufacturer’s instructions. The extracted DNA was diluted to 1 ng/μl and used as the template for PCR amplification. The 343F/798R (343F: 5′-TAC GGR AGG CAG CAG-3′; 798R: 5′-AGG GTA TCT AAT CCT-3′) primers were used to amplify the 16S rRNA gene for fecal samples. For detailed PCR reaction methodology, readers are referred to Gao et al. (2017). The amplicons were purified with Agencourt AMPure XP beads (Beckman Coulter Co., United States) and quantified using Qubit dsDNA assay kit. Microbial DNA of cancer tissue, PCR amplification, cancer tissue microbiome sequencing library and sequencing of 16S rRNA genes were performed at LC-BIO Bio-tech, Ltd. (Hangzhou, China) using the Illumina Hiseq platform (PE250).
Tissue and fecal samples were both analyzed using LC–MS. Chromatographic separations were performed using a Thermo Scientific UltiMate 3000 HPLC system using an ACQUITY UPLC BEH C18 column (100 mm × 2.1 mm, 1.8 μM, Waters, United Kingdom) heated to 35°C for reverse phase separation. The column flow rate was 0.4 ml/min with the mobile phase consisting of solvent solutions A (water, 0.1% formic acid) and B (Acetonitrile, 0.1% formic acid). The injection volume was 4 μl for each sample with gradient elution conditions as follows: 0–0.5 min, 5% B; 0.5–7 min, 5 to 100% B; 7–8 min, 100% B; 8–8.1 min, 100 to 5% B; 8.1–10 min, 5% B. All the data matrixes were combined from both positive and negative ion data. The original LC–MS data were processed by Progenesis QI V2.3 (Nonlinear, Dynamics, Newcastle, United Kingdom) for baseline filtering, peak identification, integral, retention time correction, peak alignment, and normalization. The extracted data were then further processed by removing any peaks with missing values (ion intensity = 0) in more than 50% in groups, by replacing zero value by half of the minimum value, and by screening according to the qualitative results of the compound. Compounds with resulting scores below 36 (out of 60) points were also deemed to be inaccurate and removed. Tissue sample analyses were performed at LC-BIO Bio-tech, Ltd. (Hangzhou, China), and the fecal samples were analyzed by Oebiotech Biotech Co., Ltd. (Shanghai, China).
Microbial raw sequencing data of all 40 samples were received in FASTQ format. Poor quality (below an average quality score of 30) and short sequences (shorter than 200 bp) were removed using Trimmomatic software (version 0.35), and clean reads were clustered to generate Operational Taxonomic Units (OTUs) with a 97% similarity cutoff using Vsearch 2.4.2 (Rognes et al., 2016) after primer sequence removal. Representative OUT sequences were given a taxonomic assignment based on the SILVA microbial database using BLAST Version 2.60 (Release 111; Altschul et al., 1997). Fecal microbial communities of FHC and FCRC were analyzed using data from 20 fecal samples as described in Section 2.2, including 10 fecal samples from healthy volunteers and 10 from CRC patients (SRA accession number: SRR19633878, SRR19633895, SRR19633906, SRR19633874-SRR19633876, SRR19633880-SRR19633885, SRR1933887-SRR19633890, and SRR19633913-SRR19633916). Chao1 index were calculated using Mothur, and non-metric multidimensional scaling (NMDS) by using R v3.4.1 (R Core Team, 2017). Linear Discriminant Analysis Effect Size (LEfSe) was carried out between groups to determine the differentially abundant taxonomic features by using the non-parametric Kruskal-Wallis rank sum test. Venn diagram and heatmap analyses were performed by using the online cloud tools.1 Functional prediction analyses were performed by using Phylogenetic Investigation of Communities by Reconstruction of Unobserved States (PICRUSt) based on the 16S rRNA OTU membership (Langille et al., 2013). Correlation within the microbial taxonomic abundance was measured using Brownian distance covariance (Szekely and Rizzo, 2009), which is available via the online platform (see footnote 1).
All metabolite concentration information was exported to Excel and normalized by weight across all parallel samples before inclusion in the bioinformatics analysis. Different microbiome and metabolites were analyzed by using GraphPad Prism v7.0 and SPSS 22.0. Partial least squares discriminant analysis (PLS-DA) was performed by using R v3.4.1 (R Core Team, 2017) to analyze the clustering of individuals between or among groups. All the data were presented as mean ± standard deviation (SD). Associations were determined by Spearman rank correlation. To determine the differences between groups, the independent-samples t-test and the Mann–Whitney U test were applied for normally and non-normally distributed data, respectively. p < 0.05 was considered statistically significant.
To assess the overall association between microbial composition and metabolomic profiles, we computed correlations of microbial genera with metabolites and individual metabolites using the data from the CRC and control groups. We first reduced the dimensionality of data using ordination techniques, then, we calculated correlations between the first principal coordinate of microbiome data and the first principal component of metabolome data. As the microbial data were sparser than the metabolomics data, and accordingly we applied a looser criterion to consider several microbial genera detected in at least 20%, rather than 80% of the samples. Spearman’s correlation coefficient and its significance were calculated and its 95% confidence interval describing the overall trend. Pairwise correlations, R scores, and p values for the microbial genera and metabolites were calculated using the online cloud tools in R package, and also at https://cloud.oebiotech.cn/task/ and http://www.lc-bio.com/. Features determined with significant correlations (p < 0.05) were plotted as heatmaps.
After sequencing the 16S rRNA genes of all 40 samples, data comparisons between the THC and TCRC groups showed differences of 10 vs. 10 phyla, 21 vs. 19 classes, 30 vs. 36 orders, 60 vs. 66 families, and 222 vs. 309 genera, respectively. Comparisons between the FHC and FCRC groups showed differences of 21 vs. 33 phyla, 47 vs. 74 classes, 149 vs. 177 orders, 258 vs. 289 families, and 553 vs. 607 genera, respectively. The dominant microbial phyla from THC and TCRC were Firmicutes, Bacteroidetes, Proteobacteria, Fusobacteria, and Actinobacteria, accounting for 41.27, 25.77, 23.12, 8.25, and 1.21% of the OTUs, respectively (Figure 1A). The dominant microbial phyla from FHC and FCRC were Bacteroidetes, Firmicutes, Proteobacteria, Proteobacteria, and Actinobacteriota, accounting for 54.46, 31.07, 10.50, 1.97 and 1.39% of the OTUs, respectively (Figure 1A). The highest abundance microbial phyla from THC and TCRC were Firmicutes, while the dominant microbial phyla from FHC and FCRC were Bacteroidetes. Cancer tissue samples contained 32.94% unique microbial genera, while the fecal samples displayed 56.80% unique microbial genera with a total of 10.26% microbial genera in common between the cancer tissues and fecal samples.
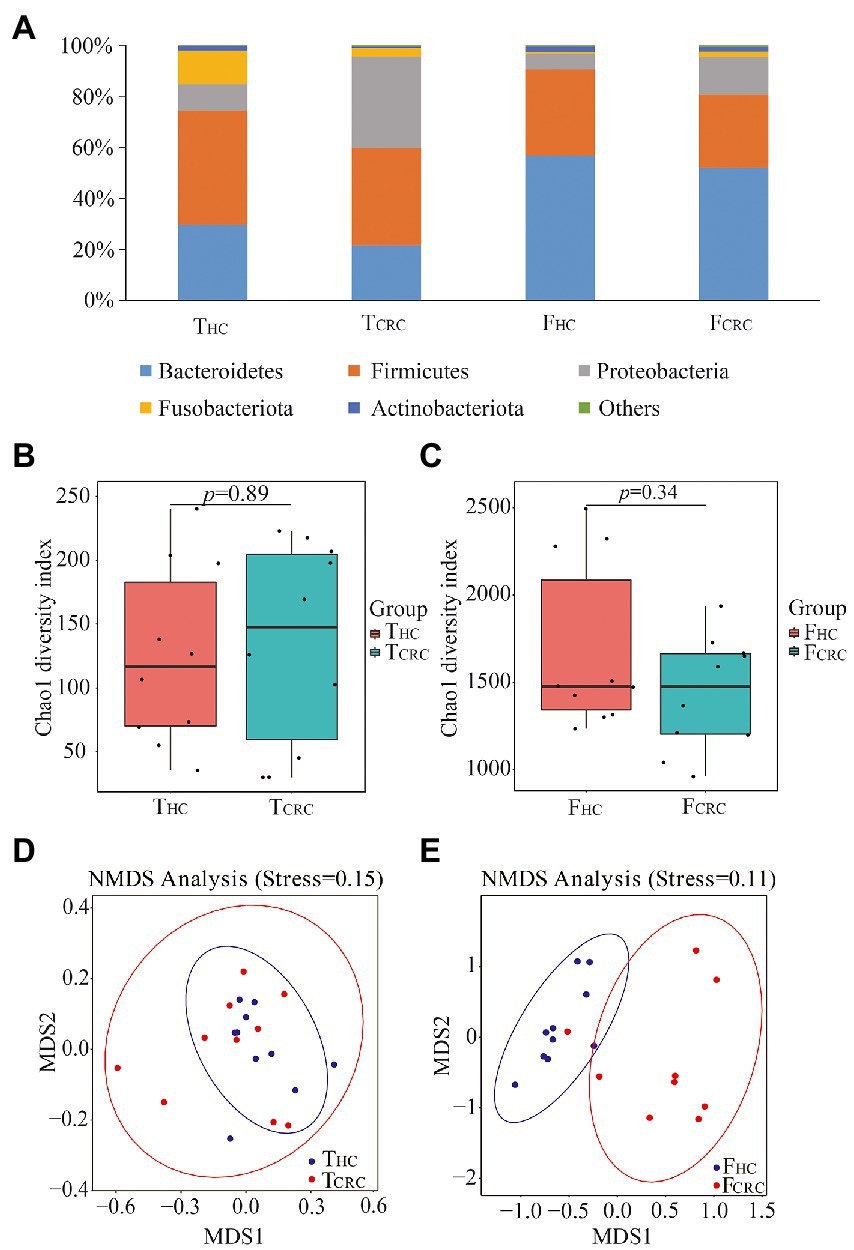
Figure 1. Microbial compositions at phyla level between THC and TCRC, and between FHC and FCRC (A) groups, respectively. Chao1 indices between the TCRC and THC (B), and between the FCRC and FHC groups (C), respectively. NMDS analyses between the TCRC and THC (D), and between the FCRC and FHC groups (E), respectively.
To determine potential shifts in microbial communities of cancer tissues and feces between CRC and control samples, the alpha and beta diversities were analyzed. However, no changes in Chao 1 indices were detected between THC and TCRC, which was similar to the comparisons between FHC and FCRC (Figures 1B,C). Nonetheless, beta diversity comparisons between the samples using NMDS showed that all THC and TCRC samples failed to cluster together (Figure 1D), whereas the FHC and FCRC samples clustered together (Figure 1E).
The raw data were analyzed to determine which microbiome were significantly associated with CRC patients compared with healthy volunteers. No significant differences were found between THC and TCRC at the phyla or class levels. However, at the order level, Caulobacterales was found to be significantly less abundant in TCRC compared with THC. Moreover, family level differences of Corynebacteriaceae, Caulobacteraceae, and Veillonellaceae were dramatically different between THC and TCRC, and Corynebacterium, Brevundimonas, Anaerovorax, and Acinetobacter were significantly different at the genus level. Comparison of FHC and FCRC at the phyla level showed no substantial differences, although at the class level, Longimicrobia, Myxococcia, Brevinematia, Desulfuromonadia, and Alphaproteobacteria were significantly different. A total of 19 orders, 48 families, and 89 genera were identified between FHC and FCRC samples. A total of 72 different microbial genera were identified among THC, TCRC, FHC and FCRC samples.
LEfSe was next used to determine the taxa that most likely reveal differences between CRC patients and control samples. Comparing THC with TCRC samples showed that Caulobacterales and Brevundimonas were higher in THC (Figure 2A). Alternatively, comparing FHC with FCRC showed that Burkholderialese, Sutterellaceae, Tannerellaceaea and Bacteroidaceae were increased in FHC (Figure 2B). Overall, 24 KEGG orthologs were identified between THC and TCRC, and between FHC and FCRC, respectively. PICRUSt analysis results indicated that membrane transport (12.78%), carbohydrate metabolism (11.01%), replication and repair (9.60%), amino acid metabolism (9.27%) and translation (5.83%) were dominant functional predictions from comparisons between THC and TCRC (Figure 2C). However, carbohydrate transport and metabolism (11.30%), transcription (8.82%), amino acid transport and metabolism (8.18%), cell wall/membrane/envelope biogenesis (7.61%), and replication, recombination and repair (7.21%) were the main predictions from the point of general function between FHC and FCRC (Figure 2D). To investigate individual relationships, we analyzed correlations between THC and TCRC samples, with results showing positive correlations between THC5, TCRC7, THC1, THC6, TCRC5 and THC7, THC5, TCRC7, THC1, THC6, respectively (Figure 2E). Comparing FHC with FCRC samples revealed that most samples had positive correlations with each other (Figure 2F). Moreover, we observed significant co-exclusive relationships between THC and TCRC-depleted microbiome including Selenomonas, Megamonas, and Campylobacter (Figure 2G). We also found that the genera including Alistipes, Gardnerella, Lactobacillus, Dialister, and Alloprevotella had substantially different correlation coefficients between FHC and FCRC (Figure 2H).
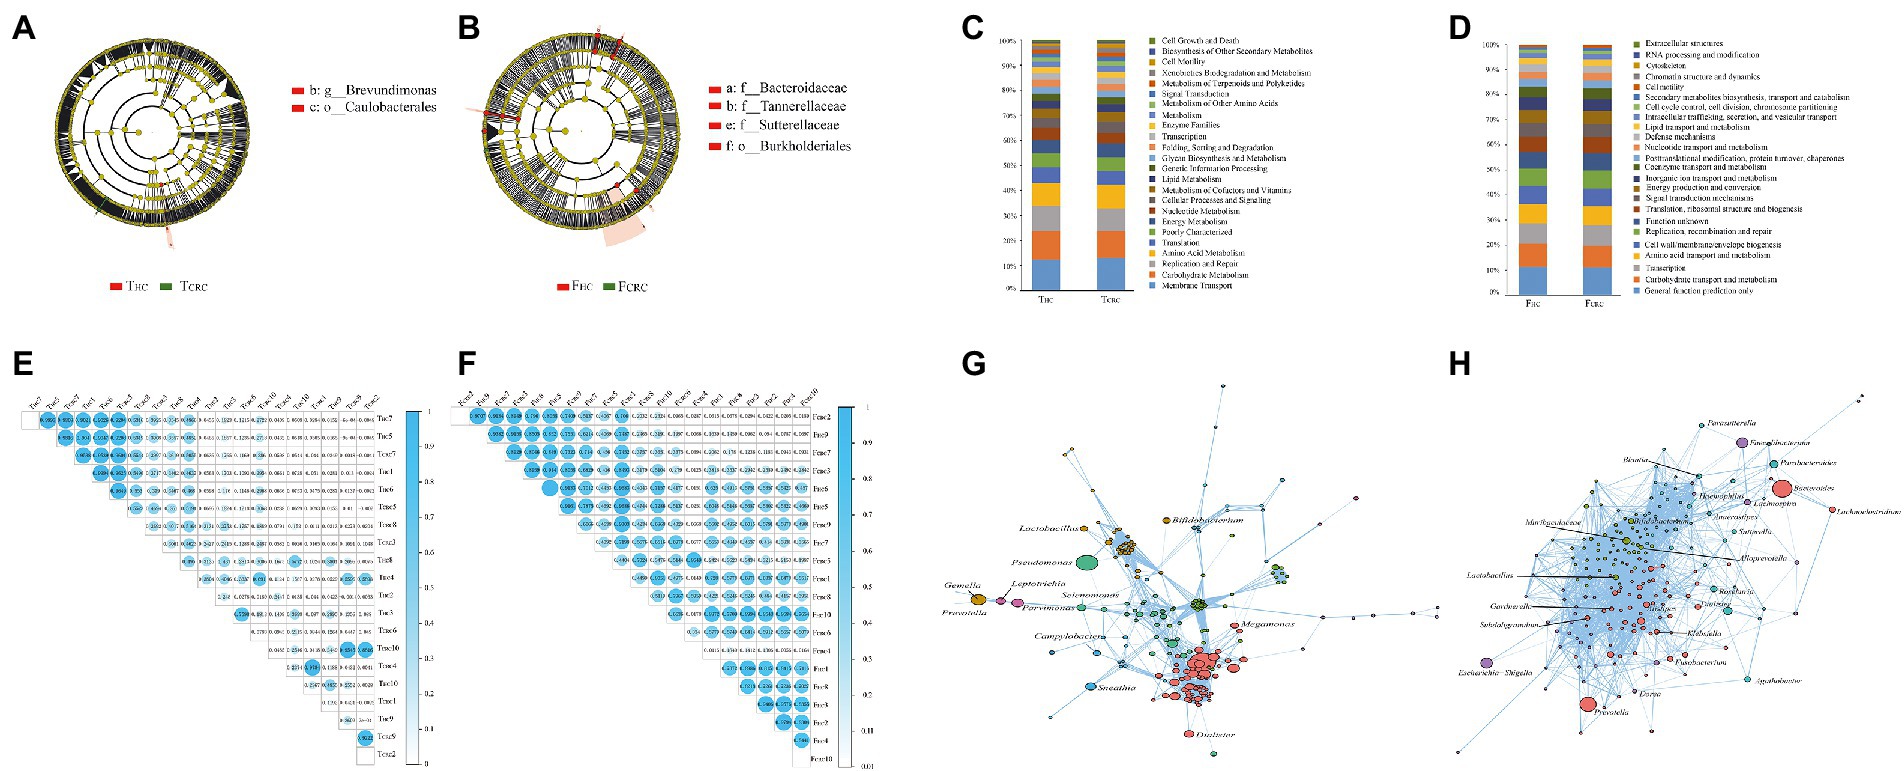
Figure 2. Most differentially abundant taxa between the THC and TCRC (A), and between the FCRC and FHC groups (B) based on LEfSe analyses, respectively. Functional predictions between the THC and TCRC (C), and between the FCRC and FHC groups (D) based on PICRUSt analyses, respectively. Correlation analysis in all samples of THC and TCRC (E), and the FHC and FCRC (F), and the network analysis in THC and TCRC (G), and the FHC and FCRC (H).
Metabolic analyses by LC–MS were successfully conducted on all matched cancer tissues and fecal samples, along with paired controls with the exception of one FCRC sample. In general, over 854 metabolites belonging to 14 superclasses were detected in TCRC and THC, the dominant superclasses were lipids and lipid-like molecules, and organic acids and derivatives, accounting for 26.28 and 2.78%, the highest metabolite superclass includes lipids and lipid-like molecules, and the lowest being alkaloids and derivatives (Figure 3A). Notably, over 10,654 metabolites were identified in FHC and FCRC samples with the dominant abundant superclasses in rank order being lipids and lipid-like molecules and organoheterocyclic compounds, accounting for 14.90 and 7.09%, respectively (Figure 3A). Notably, like the tissue analyses, lipids and lipid-like molecules were the most abundant metabolites detected in fecal samples. Moreover, among the 854 and 10,654 metabolites identified, respectively, in tissues and feces, only 1.4% of metabolites were common to all four groups. Intriguingly, only 6.1% of metabolites were unique between THC and TCRC samples in comparison to 92.5% unique metabolites between the FHC vs. FCRC samples. In particular, 10 differential metabolites were found among the four groups, namely N-lactoyl-Leucine, L-Kynurenine, Taurine, Myristic acid, 3Beta-7alpha-Dihydroxy-5-cholestenoate, 3-Formyl-6-hydroxyindole, 11-Hydroxyeicosatetraenoate glyceryl ester, Epitestosterone sulfate, Palmitelaidic acid, and 2,2-Dimethylsuccinic acid. To further illustrate the differences in metabolic profiles, the metabolomic data were subjected to PLS-DA analysis. Accordingly, we found all THC and TCRC samples produced distinct clusters (Figure 3B) and similarly, all FHC samples clustered distinctly from the FCRC samples (Figure 3C).
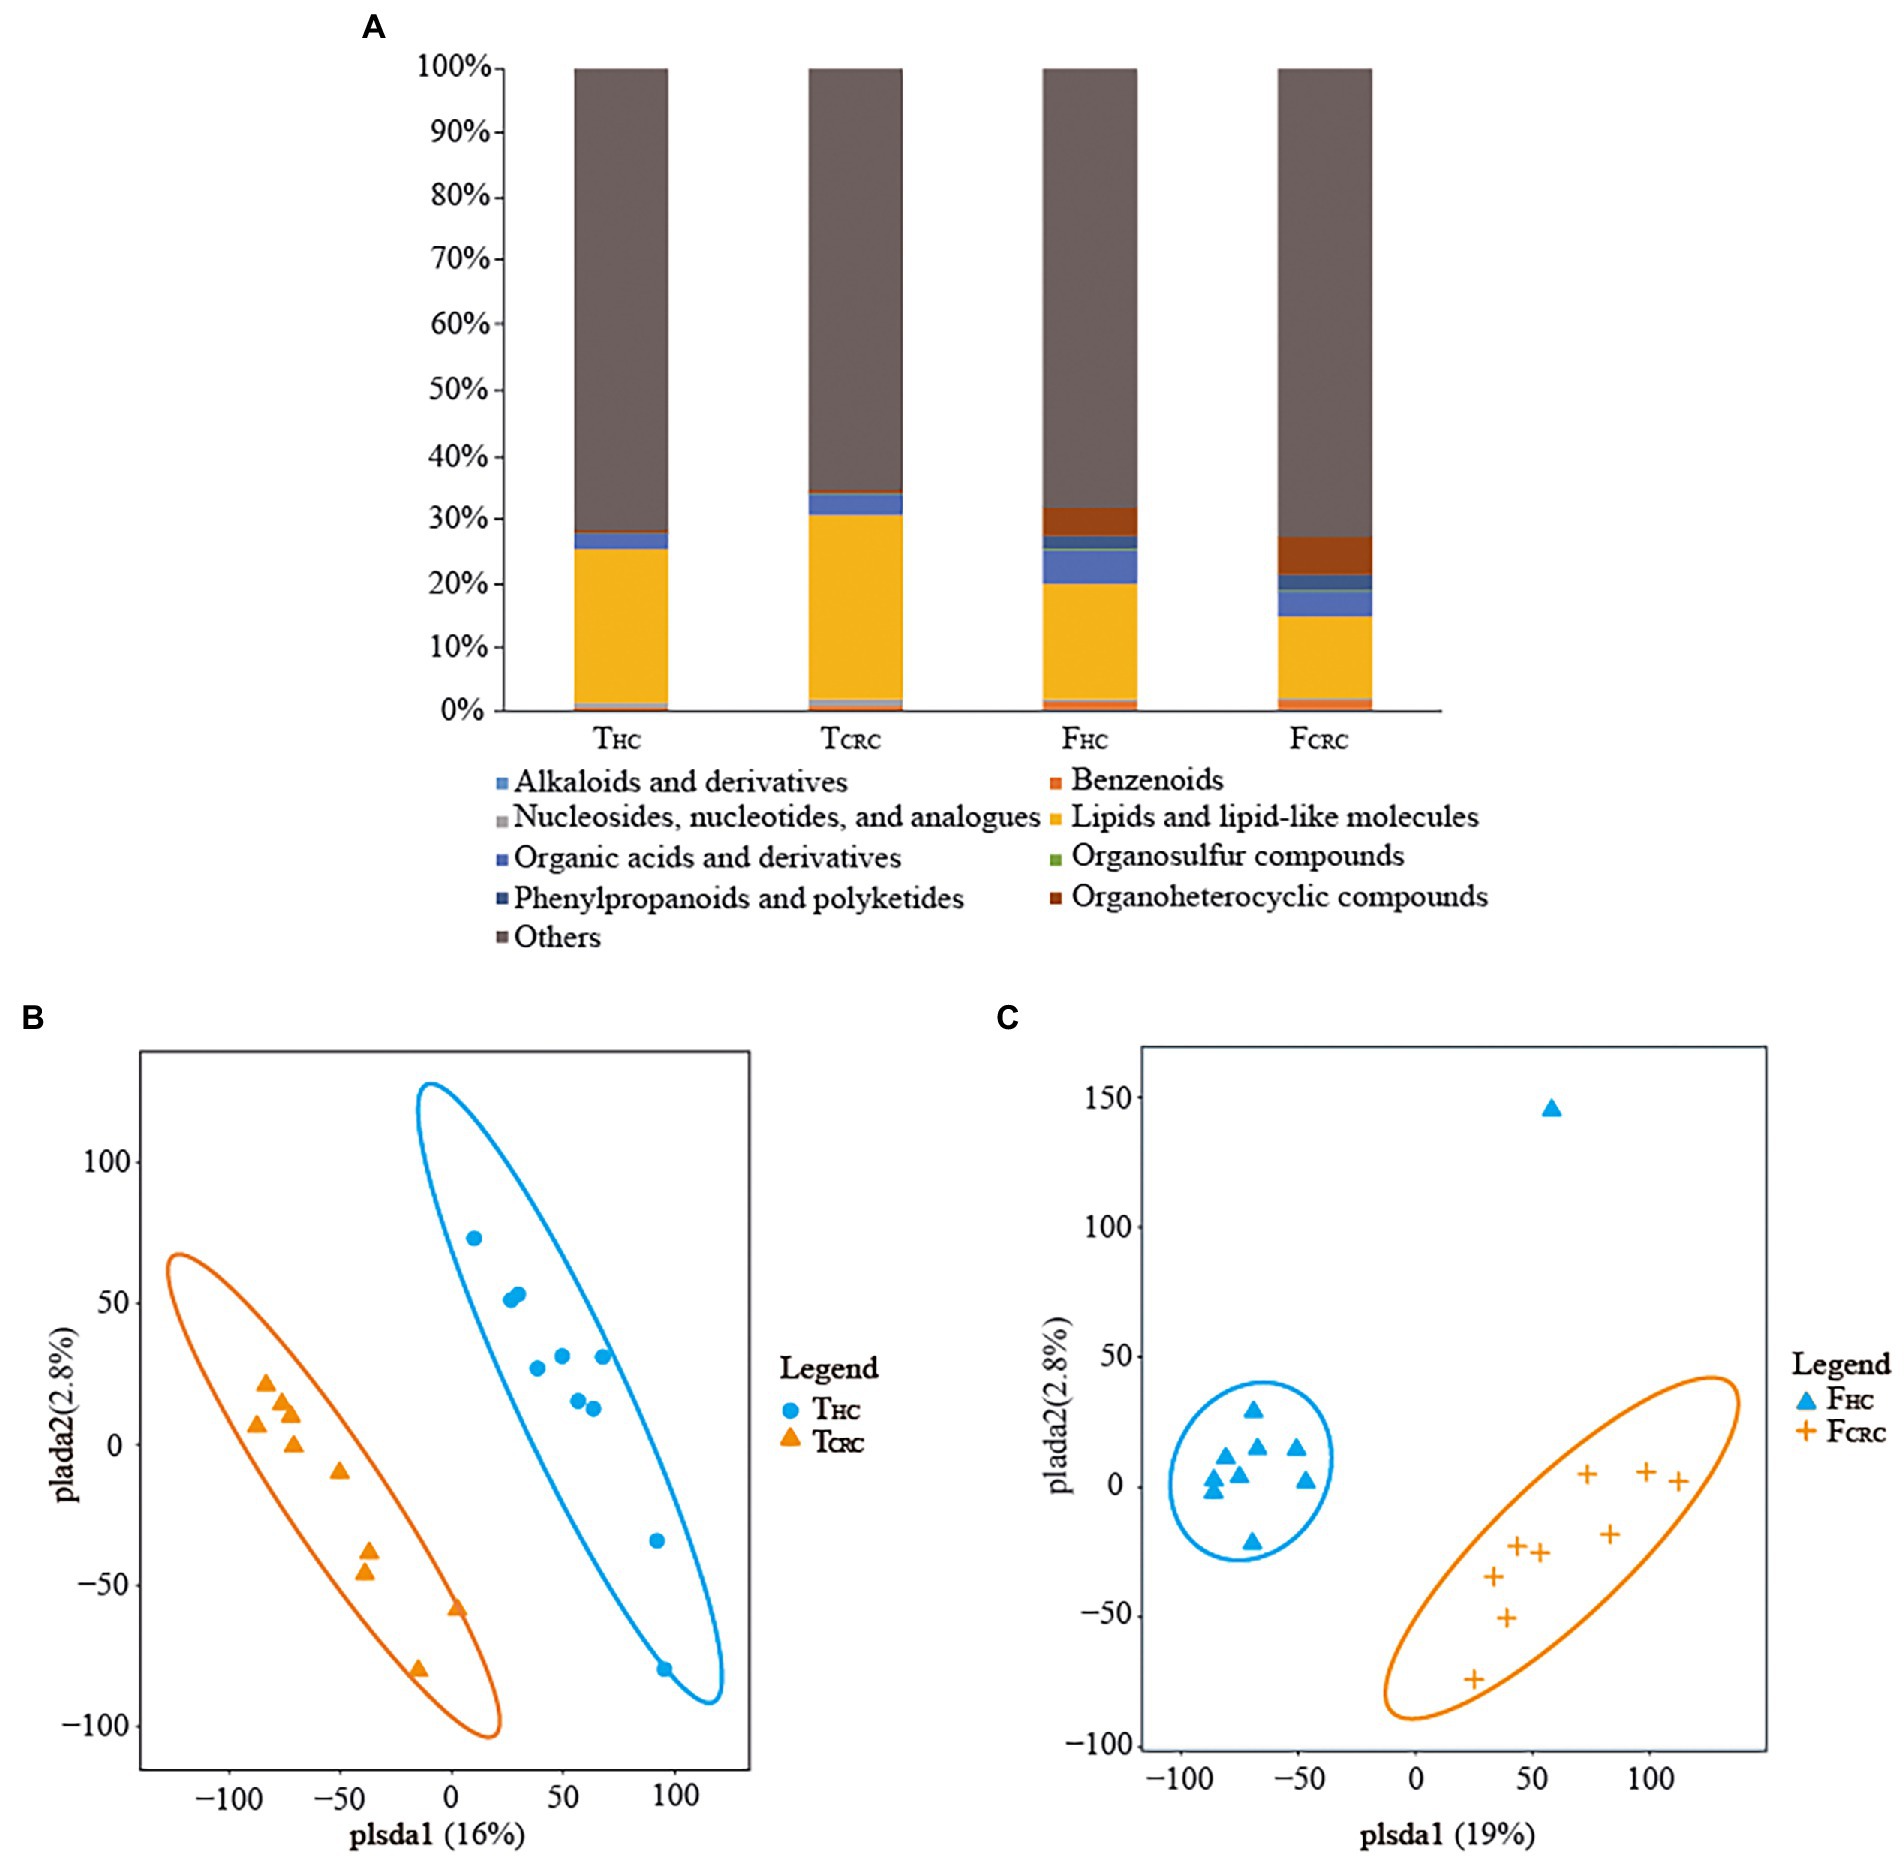
Figure 3. Compositions of metabolites between the THC and TCRC groups, and between the FHC and FCRC groups (A). PLS-DA score plots differentiating samples based on metabolites comparing the THC and TCRC groups (B), and between the FHC and FCRC groups (C), respectively.
The differential metabolites identified above were next used to interrogate the KEGG compound database to identify related metabolic pathways. According to the findings, 14 pathways were found to be different between the THC and TCRC groups, and among these, glycerophospholipid metabolism, choline metabolism in cancer and fatty acid biosynthesis were the most significantly different pathways (Figure 4A). Similar analyses comparing the FHC and FCRC groups uncovered 13 pathway enrichments, with the most prominent six pathways being arachidonic acid metabolism, valine, leucine and isoleucine biosynthesis, fructose and mannose metabolism, fatty acid biosynthesis, pyrimidine metabolism, and pentose and glucuronate interconversions (Figure 4B).
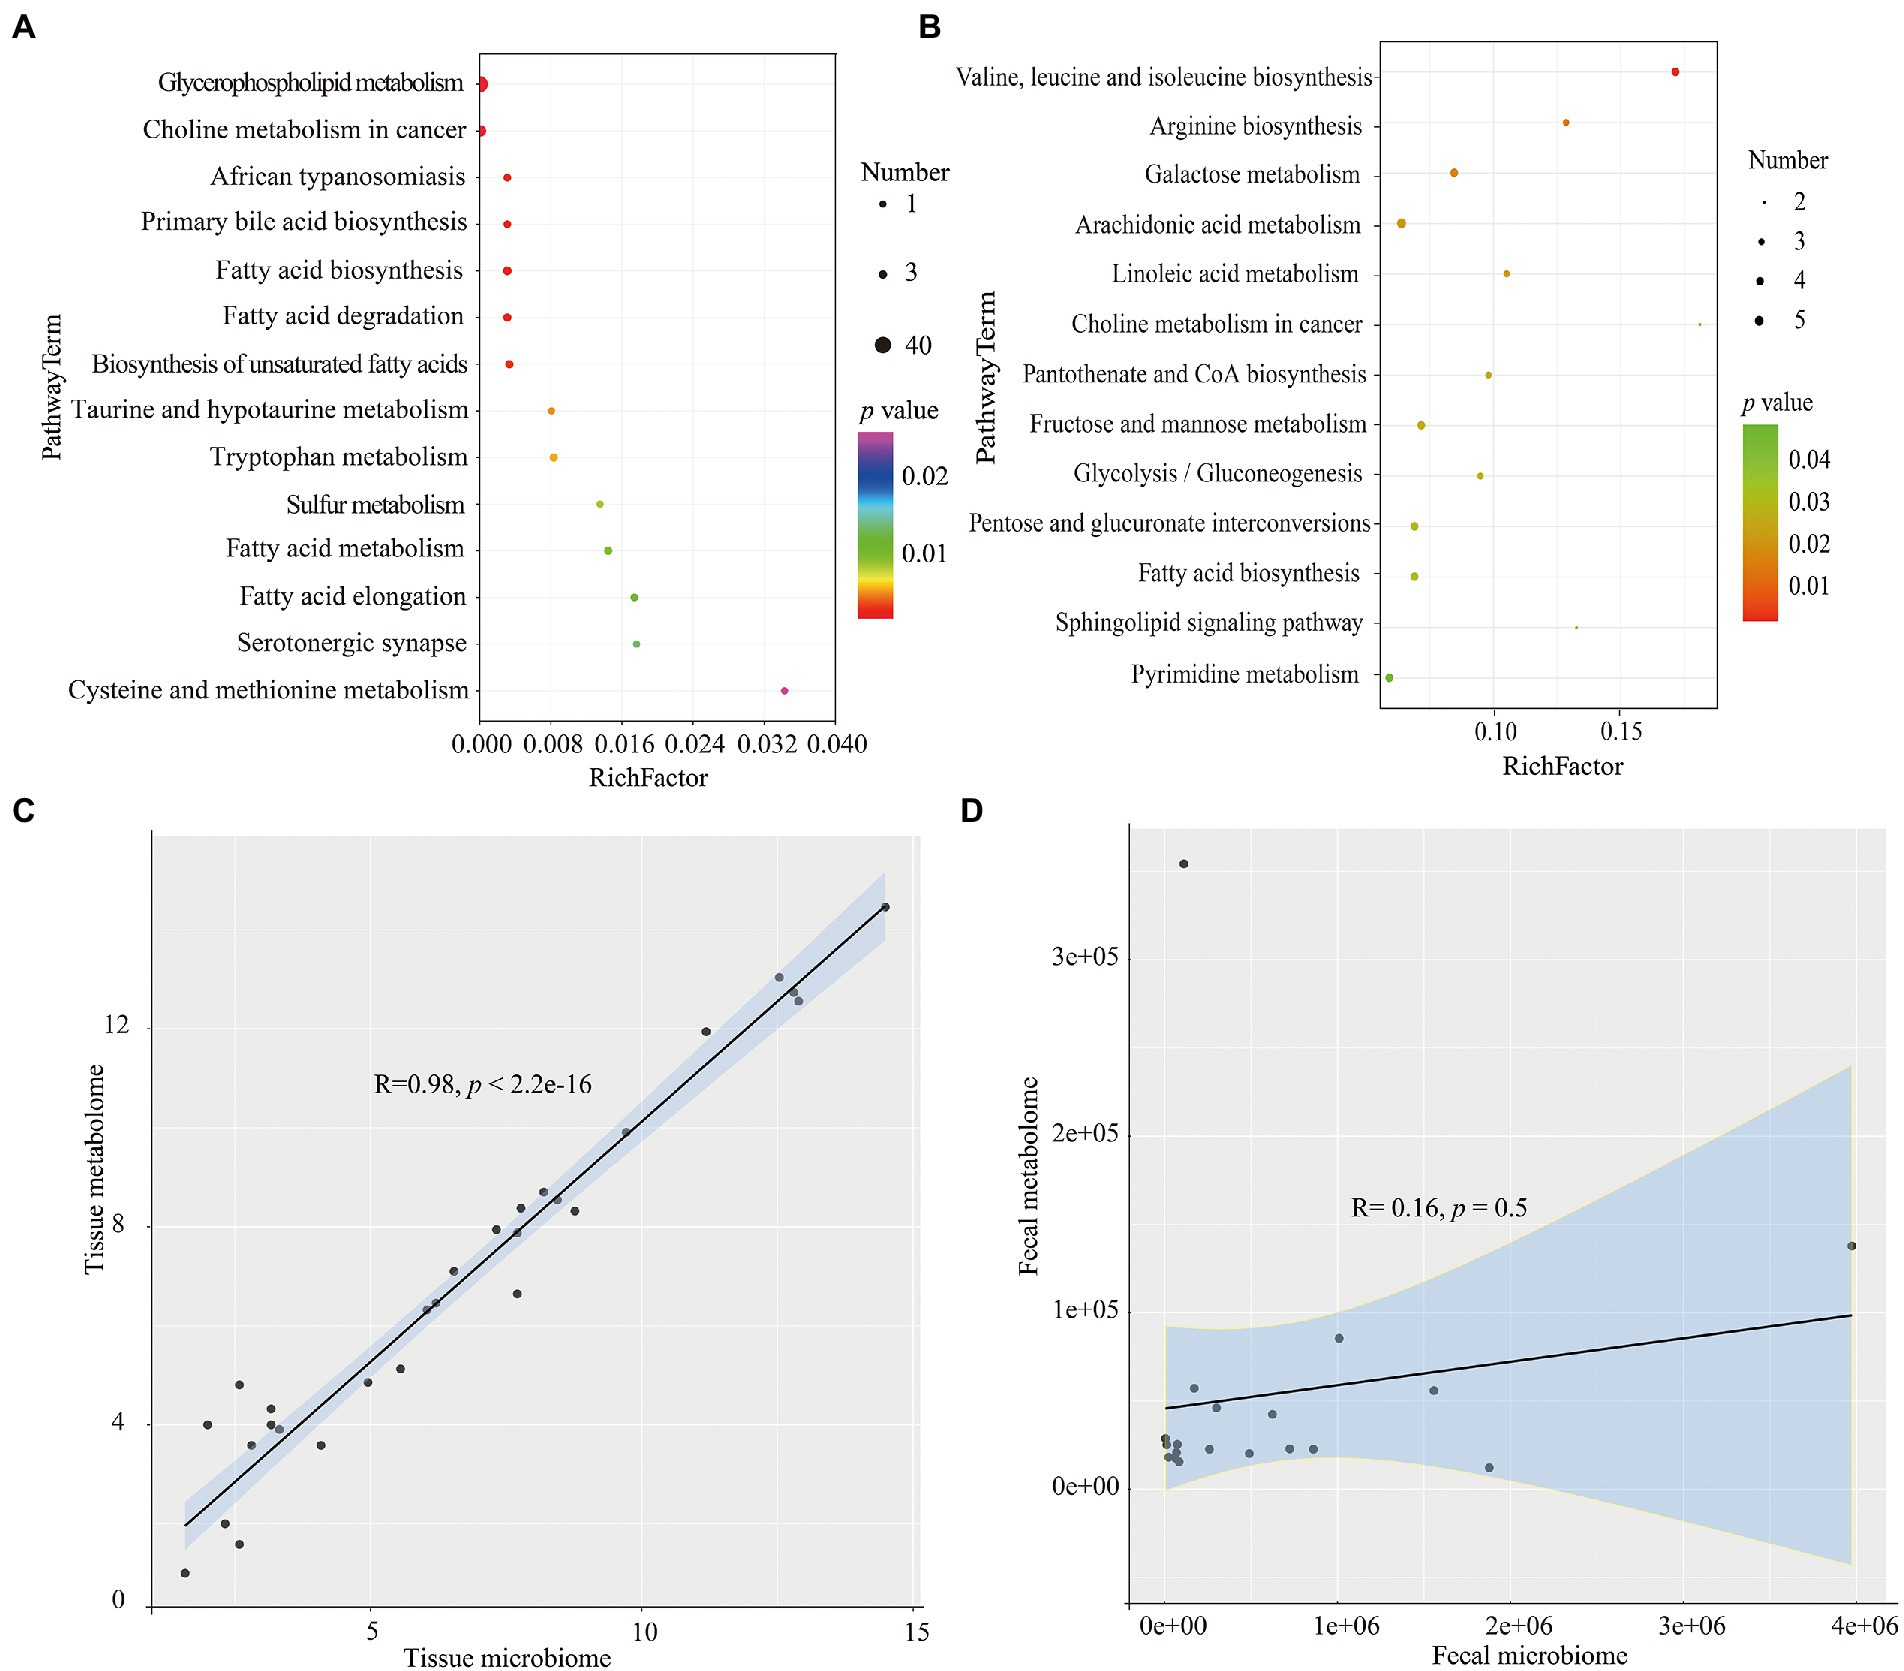
Figure 4. KEGG analyses of the differential metabolites the THC and TCRC (A), and between the FHC and FCRC groups (B), respectively. Correlation between microbiome and metabolomics data for THC vs. TCRC (C), and FHC vs. FCRC (D). *p < 0.05, **p < 0.01 and ***p < 0.001. Red: positive correlation; blue: negative correlation.
At the level of individual metabolites, 102 metabolites were differential between THC and TCRC groups while 700 metabolites were differential between the FHC and FCRC groups. However, only one differential metabolite (Myristic acid) was detected amongst all four groups. In order to display the relationships among samples and metabolites more intuitively, we then analyzed the relationships among the samples using the top 50 significantly differential metabolites between THC and TCRC, and between FHC and FCRC groups, respectively. Except for a few individuals, the results showed that the samples in two groups can be distinguished with different metabolites occurring between the group comparisons (Supplementary Figures S2A,B).
We calculated the correlation between microbiome and metabolomics data for THC vs. TCRC, and FHC vs. FCRC comparisons. We found a highly significant positive correlation between microbiome and metabolomics data for THC vs. TCRC (R = 0.98, p < 2.2 × 10⁻¹⁶), with similar results obtained between microbiome and metabolomics data for FHC vs. FCRC; however, the R and p values were not significantly different (R = 0.16, p = 0.5; Figures 4C,D). To investigate the relationship of microbial taxa and metabolites, we analyzed the correlations between the top 20 abundance microbial genus profiles and the top 20 metabolites profiles. Comparing THC with TCRC tissue samples showed positive correlations between the abundance of the Prevotella genera with L-Glutathione (reduced); Parvimonas and Gemella with Inosine; Parvimonas with L-Glutathione (reduced); Dialister with Erucamide. Conversely, the Clostridium genus was negatively correlated with LysoPE 18:0, LysoPC 16:0, 1-Oleoyl-sn-glycero-3-phosphocholine and LysoPC 18:0, respectively (Supplementary Figure S3A). Comparing FHC and FCRC fecal samples mainly showed that Subdoligranulum and Prevotella were positively correlated with P-Chlorophenylalaninee, Szopiclone, Eplerenone, and Porson, respectively. Klebsiella also showed positive correlations with THA, 6,9,12,15,18,21-Tetracosahexaenoic acid, mesobilirubinogen, respectively (Supplementary Figure S3B).
The incidence of CRC is rising worldwide and while colonoscopy is an effective screening tool for CRC diagnosis, it remains unpopular with the subjects being tested. Hence, there is an unmet need to develop effective non-invasive examinations to detect the early development of CRC (Chen et al., 2015; Li et al., 2022). Microbiome and their metabolites are now known to play important roles in tumorigenesis with alterations in their composition and structures apparent in cancer tissues and feces (Zhang Y. et al., 2020). Therefore, a potential biomarker approach involves assessing the combination of stool microbiome and metabolites (Li et al., 2022). Towards the notion of providing non-invasive tests for CRC, this study profiled the microbiome and metabolites of cancer tissues and feces of CRC patients and compared these with samples from healthy volunteers using a combination of high-throughput sequencing and LC–MS technology. This analysis revealed promising data showing alterations in specific microbiome and metabolites in both CRC tissues and corresponding fecal samples. Like a previous report, we found that the gut microbiome in CRC tissues has greater richness than controls (Thomas et al., 2019), with common findings suggesting these studies collectively identify potentially useful microbial biomarkers for the design of non-invasive diagnostic tools to target CRC. It is known that early diagnosis and detailed staging of CRC significantly impact CRC management and outcomes (Zhang et al., 2017), with our study analysis advancing the diagnostic implications of microbial and metabolomic profiling as early detection approaches for CRC.
Pathogenic microbiome in CRC tissues or gut can influence the cellular microenvironment, leading to cancer development or otherwise promoting cancer progression. Changes in the balance of commensal microbiome may lead to a rise in mucosal permeability, microbial translocation, and activation of factors of the innate and adaptive immune system to stimulate chronic inflammation (Vacante et al., 2020). Indeed, gut microbiome have been emerged as one of central players in CRC pathogenesis, with multiple effects on the cancer transformation process and progression, and response to treatment of cancer (Helmink et al., 2019; Hasan et al., 2022). Microbiome are believed to contribute to CRC risk by producing toxins or exoenzymes, influencing the defense against pathogens, and deregulating immune homeostasis (Hasan et al., 2022). Thus, studying the microbiome of cancer tissues and feces may help understand the underlying mechanisms (Zmora et al., 2018). We found that the microbial communities of cancer tissues and feces from CRC patients were signatures inextricably linked to the presence of malignancy. Similar to the results of previous studies, our results indicated that the alpha and beta diversities of microbial species in cancer tissues did not show differences (Hasan et al., 2022). Moreover, our data showed lower evenness (α-diversity) and species richness in TCRC than in THC samples, the microbial compositions between TCRC and THC being similar to previous findings (He et al., 2021). The alpha diversity of fecal samples by Chao1 index in the FHC group was higher than that in FCRC group, but with no significant differences between FHC and FCRC, which was similar to previous findings (Thomas et al., 2019). However, beta diversity analysis showed dramatic differences between FHC and FCRC samples, supporting the conclusion of Yu (2018). Previous research has shown that the gut microbiome in CRC has a greater richness than controls, partially due to the presence of oral cavity-associated species rarely found in the healthy gut (Manichanh, 2006; Le Chatelier et al., 2013; Thomas et al., 2019). Microbial composition analysis showed Firmicutes and Tenericutes had the highest and lowest abundance, respectively, in TCRC samples. Notably, these results differ from the previous reports, showing higher abundances of Proteobacteria and Fusobacteria, and lower abundances of Bacteroidetes, Actinobacteria, and Firmicutes in cancer tissues (Ringel et al., 2015; Kim et al., 2018; Shah et al., 2018; Wang et al., 2020). Nonetheless, microbial composition analysis of FCRC indicated high abundance of Bacteroidetes, Firmicutes and Proteobacteria, similar to the study by Yu (2018). The results from the PICRUSt analyses showed that cell growth and death, biosynthesis of other secondary metabolites, and cell motility were the most central functions in the microbial communities of the cancer tissues. However, extracellular structures, RNA processing and modification, and cytoskeleton were the major functions in the gut microbial communities, which were different from the functions of the microbial communities of the cancer tissues. The likely reasons are the different abundances of microbiome in CRC tissues and feces (Ringel et al., 2015; Kim et al., 2018; Shah et al., 2018; Yu, 2018; Wang et al., 2020).
Cancer-specific microbiome have been detected in CRC mucosal and/or fecal samples and not in healthy controls (Vacante et al., 2020). Several CRC biomarker genera were identified as potential biomarkers in our study including Solobacterium, Porphyromonas, Fusobacterium, Streptococcus, Gemella, and Bifidobacterium, consistent with previous research (Thomas et al., 2019). Notably, the great abundance of Fusobacteria has been observed in CRC and the species has been associated with poor prognosis in CRC patients and development of chemoresistance (Yu, 2018). Fusobacterium has been associated with colorectal tumors and adenomas (Thomas et al., 2019) and moreover, it was reported that F. nucleatum increased cell growth, invasiveness, and capability to form xenografted CRC tumors (Yang and Yu, 2018). However, our application of PICRUSt to the 16S rRNA amplicon sequencing data to infer microbial metabolic functions indicated no common microbial metabolic functions among the four groups, likely indicating these data reflect the different microbial communities.
Metabolite alterations have been reported in a variety of cancers, representing potentially important biomarkers for diagnosis, treatment and prognosis (Erben et al., 2018; Yachida et al., 2019; Zhang S. et al., 2020; Hasan et al., 2022). LC/MS-based metabolite profiles in cancer tissues and feces of CRC patients were compared in PLS-DA analyses, with the overall changes in metabolites providing excellent discrimination in cancer vs. normal comparisons, suggesting these were good candidates for biomarkers in CRC. Further dissection of the altered metabolic profiles between THC and TCRC, and between FHC and FCRC revealed that 10 metabolites were dramatically different among the four groups. Among these, N-lactoyl-leucine was reported to be associated with human kidney cancer detection (Knott et al., 2018) while Taurine metabolism represents an important regulatory pathway in breast cancer, and potential diagnostic measure (Huang et al., 2016). Taurine is a non-essential amino acid and an end product of sulfur metabolism, being essential for cell growth in renal, neural, and cardiac cells, preventing cell death (Baliou et al., 2020). Myristic acid, as a rare fatty acid, is dramatically decreased in endometrial cancer (Troisi et al., 2018). Palmitelaidic acid is rare in nature, but has been widely produced by food industry, however, previous research has indicated that high palmitelaidic acid consumption may increase cancer risk (Li et al., 2017). L-kynurenine, 3beta-7alpha-dihydroxy-5-cholestenoate, 3-Formyl-6-hydroxyindole, 11-hydroxyeicosatetraenoate glyceryl ester, Epitestosterone sulfate, and 2,2-Dimethylsuccinic acid were dramatically different between CRC and normal people in the first report. Pathway enrichment analysis showed that fatty acid biosynthesis was altered in CRC patients compared with that of healthy people in both cancer tissue and fecal samples. Fatty acids for membrane synthesis are common features in metabolism and are altered in energy metabolism in cancer cells (Currie et al., 2013). Akin to previous findings, differences in energy metabolism were clearly observable between the CRC tissues and feces and their control samples, a result likely associated with the high aerobic glycolysis rates associated with increased glucose uptake and utilization along with increased lactate production (Tian et al., 2016). Interestingly, six common metabolic pathways were observed between tissue samples and fecal samples, and we suspect these pathways provide potentially important clues for the further development of biomarkers.
Through a multi-omics profiling approach, we were able to investigate the associations between the microbiome and metabolites in CRC patients compared with normal subjects from both cancer tissues and fecal samples. Some microbiome and metabolites followed either positive or negative correlations in CRC patients compared with normal subjects. In cancer tissue samples, Clostridium was found to increase in abundance and was significantly correlated with four metabolites (LysoPE 18:1, LysoPE 18:0, LysoPC 16:0, 1-Oleoyl-sn-glycero-3-phosphocholine, and LysoPC 18:0), which may increase malignant progression during CRC progression (Xie et al., 2017; Coker et al., 2022). Moreover, our association analysis revealed that the compositions, structures and relationships between microbiome and metabolites were significantly different between THC and TCRC. Comparing FHC to FCRC, Subdoligranulum and Prevotella were positively correlated with porson, eplerenone, eszopiclone, and P-chlorophenylalaninee. Collectively, the results of the relationships between microbiome and metabolites suggest potential biomarkers in the development of CRC.
The diversity and subject-specificity of the human microbiome and metabolite are not yet fully uncovered, many of them with unknown functions. Technological advancements, especially large-scale shotgun metagenomics can overcome these limitations. Although interesting findings were gained from this study, some limitations must be acknowledged such as the small study size of 10 sample per group. This necessitates alternative larger cohorts on which to further validate our findings. However, as no single biomarker screen can be considered to provide definitive evidence, the findings here still make important and significant contributions to the field. Indeed, the relationships between microbial and metabolic biomarkers are complicated by the diet and physiology of the host, placing value in studies from diverse populations. In any event, the current findings provide evidence to further explore new non-invasive diagnostic tools for CRC. Furthermore, it is probably that the study could be further supplemented by incorporating additional omic analyses, such as proteogenomics, metagenomics, and proteomics, to expand the functional relationship between the microbiome, their metabolites and host functions.
In conclusion, we found significant alteration of metabolites between THC and TCRC, while the microbial profiles were not significantly different. Most such microbiome and metabolites showed directionally consistent changes in the CRC patients, suggesting that those changes may represent early events of carcinogenesis. Our study suggests that metabolic compositional and functional dissimilarities in CRC characterized by alterations in biodiversity and composition of microbiome. However, the gut microbiome and metabolites were both altered compared with those of normal subjects. Thus, our results identify several microbiome and metabolites that may act as potential biomarkers in CRC. However, before considering these for use in non-invasive diagnostic strategies for CRC, it will be necessary to increase the numbers of samples to validate these findings. Moreover, the functional contributions of the putative biomarker microbiome and metabolites need further exploration.
The datasets presented in this study can be found in online repositories. The names of the repository/repositories and accession number(s) can be found at: https://www.ncbi.nlm.nih.gov/genbank/, SRR21189098-SRR21289117.
GL and XL designed the experiments of this manuscript. JF, ZG, ZS, JL, and NX conducted sample collection and data analysis. JF, ZG, GL, and XL wrote the manuscript. RT and XZ contributed to discussions and suggestions. All authors contributed to the article and approved the submitted version.
This research was supported by the National Natural Science Foundation of China (Grant no. 81772908).
The authors thank to Aijun Guo for sample collection.
The authors declare that the research was conducted in the absence of any commercial or financial relationships that could be construed as a potential conflict of interest.
All claims expressed in this article are solely those of the authors and do not necessarily represent those of their affiliated organizations, or those of the publisher, the editors and the reviewers. Any product that may be evaluated in this article, or claim that may be made by its manufacturer, is not guaranteed or endorsed by the publisher.
The Supplementary material for this article can be found online at: https://www.frontiersin.org/articles/10.3389/fmicb.2023.1034325/full#supplementary-material
Altschul, S. F., Madden, T. L., Schäffe, A. A., Zhang, J., Zhang, Z., Miller, W., et al. (1997). Gapped BLAST and PSI-BLAST: a new generation of protein database search programs. Nucleic Acids Res. 25, 3389–3402. doi: 10.1093/nar/25.17.3389
Baliou, S., Kyriakopoulos, A. M., Spandidos, D. A., and Zoumpourlis, V. (2020). Role of taurine, its haloamines and its lncRNA TUG1 in both inflammation and cancer progression. On the road to therapeutics? (review). Int. J. Oncol. 57, 631–664. doi: 10.3892/ijo.2020.5100
Buas, M. F., Gu, H., Djukovic, D., Zhu, J., Onstad, L., Reid, B. J., et al. (2017). Candidate serum metabolite biomarkers for differentiating gastroesophageal reflux disease, Barrett's esophagus, and high-grade dysplasia/esophageal adenocarcinoma. Metabolomics 13:23. doi: 10.1007/s11306-016-1154-y
Chen, L., Zhang, C., Gui, Q., Chen, Y., and Yang, Y. (2015). Ultra−performance liquid chromatography coupled with quadrupole time−of−flight mass spectrometry−based metabolic profiling of human serum prior to and following radical resection of colorectal carcinoma. Mol. Med. Rep. 12, 6879–6886. doi: 10.3892/mmr.2015.4289
Coker, O. O., Liu, C., Wu, W. K. K., Wong, S. H., Jia, W., Sung, J. J. Y., et al. (2022). Altered gut metabolites and microbiota interactions are implicated in colorectal carcinogenesis and can be non-invasive diagnostic biomarkers. Microbiome 10:35. doi: 10.1186/s40168-021-01208-5
Coker, O. O., Wu, W. K. K., Wong, S. H., Sung, J. J. Y., and Yu, J. (2020). Altered gut archaea composition and interaction with bacteria are associated with colorectal cancer. Gastroenterology 159, 1459–1470.e5. doi: 10.1053/j.gastro.2020.06.042
Currie, E., Schulze, A., Zechner, R., Walther, T. C., and Farese, R. V. J. (2013). Cellular fatty acid metabolism and cancer. Cell Metab. 18, 153–161. doi: 10.1016/j.cmet.2013.05.017
Davis, V. W., Schiller, D. E., Eurich, D., and Sawyer, M. B. (2012). Urinary metabolomics signature of esophageal cancer and Barrett's esophagus. World J. Surg. Oncol. 10:271. doi: 10.1186/1477-7819-10-271
Erben, V., Bhardwaj, M., Schrotz-King, P., and Brenner, H. (2018). Metabolomics biomarkers for detection of colorectal neoplasms: a systematic review. Cancers 10:246. doi: 10.3390/cancers10080246
Feng, Q., Liang, S., Jia, H., Stadlmayr, A., Tang, L., Lan, Z., et al. (2015). Gut microbiome development along the colorectal adenoma-carcinoma sequence. Nat. Commun. 6:6528. doi: 10.1038/ncomms7528
Foulkes, W. D. (2008). Inherited susceptibility to common cancers. N. Engl. J. Med. 359, 2143–2153. doi: 10.1056/NEJMra0802968
Gao, R., Kong, C., Li, H., Huang, L., Qu, X., Qin, N., et al. (2017). Dysbiosis signature of mycobiota in colon polyp and colorectal cancer. Eur. J. Clin. Microbiol. Infect. Dis. 36, 2457–2468. doi: 10.1007/s10096-017-3085-6
Hale, V. L., Jeraldo, P., Mundy, M., Yao, J., Keeney, G., Scott, N., et al. (2018). Synthesis of multiomic data and community metabolic models reveals insights into the role of hydrogen sulfide in colon cancer. Methods 149, 59–68. doi: 10.1016/j.ymeth.2018.04.024
Haraldsdottir, S., Einarsdottir, H. M., Smaradottir, A., Gunnlaugsson, A., and Halfdanarson, T. R. (2014). Colorectal cancer - review. Laeknabladid 100, 75–82. doi: 10.17992/lbl.2014.02.531
Hasan, R., Bose, S., Roy, R., Paul, D., Rawat, S., Nilwe, P., et al. (2022). Tumor tissue-specific bacterial biomarker panel for colorectal cancer: Bacteroides massiliensis, Alistipes species, Alistipes onderdonkii, Bifidobacterium pseudocatenulatum, Corynebacterium appendicis. Arch. Microbiol. 204:348. doi: 10.1007/s00203-022-02954-2
He, T., Cheng, X., and Xing, C. (2021). The gut microbial diversity of colon cancer patients and the clinical significance. Bioengineered 12, 7046–7060. doi: 10.1080/21655979.2021.1972077
Helmink, B. A., Khan, M. A. W., Hermann, A., Gopalakrishnan, V., and Wargo, J. A. (2019). The microbiome, cancer, and cancer therapy. Nat. Med. 25, 377–388. doi: 10.1038/s41591-019-0377-7
Hong, T. T., Shen, D., Chen, X. P., Wu, X. H., and Hua, D. (2016). Preoperative serum lipid profile and outcome in nonmetastatic colorectal cancer. Chronic Dis. Transl. Med. 2, 241–249. doi: 10.1016/j.cdtm.2016.11.015
Huang, S., Chong, N., Lewis, N. E., Jia, W., Xie, G., and Garmire, L. X. (2016). Novel personalized pathway-based metabolomics models reveal key metabolic pathways for breast cancer diagnosis. Genome Med. 8:34. doi: 10.1186/s13073-016-0289-9
Johnson, C. M., Wei, C., Ensor, J. E., Smolenski, D. J., Amos, C. I., Levin, B., et al. (2013). Meta-analyses of colorectal cancer risk factors. Cancer Causes Control 24, 1207–1222. doi: 10.1007/s10552-013-0201-5
Kim, K., Castro, E. J. T., Shim, H., Advincula, J. V. G., and Kim, Y. W. (2018). Differences regarding the molecular features and gut microbiota between right and left colon cancer. Ann. Coloproctol. 34, 280–285. doi: 10.3393/ac.2018.12.17
Kim, M., Vogtmann, E., Ahlquist, D. A., Devens, M. E., Kisiel, J. B., Taylor, W. R., et al. (2020). Fecal metabolomic signatures in colorectal adenoma patients are associated with gut microbiota and early events of colorectal cancer pathogenesis. MBio 11, e03186–e03119. doi: 10.1128/mBio.03186-19
Knott, M. E., Manzi, M., Zabalegui, N., Salazar, M. O., Puricelli, L. I., and Monge, M. E. (2018). Metabolic footprinting of a clear cell renal cell carcinoma in vitro model for human kidney cancer detection. J. Proteome Res. 17, 3877–3888. doi: 10.1021/acs.jproteome.8b00538
Ladabaum, U., Dominitz, J. A., Kahi, C., and Schoen, R. E. (2020). Strategies for colorectal cancer screening. Gastroenterology 158, 418–432. doi: 10.1053/j.gastro.2019.06.043
Langille, M. G., Zaneveld, J., Caporaso, J. G., McDonald, D., Knights, D., Reyes, J. A., et al. (2013). Predictive functional profiling of microbial communities using 16S rRNA marker gene sequences. Nat. Biotechnol. 31, 814–821. doi: 10.1038/nbt.2676
Le Chatelier, E., Nielsen, T., Qin, J., Prifti, E., Hildebrand, F., Falony, G., et al. (2013). Richness of human gut microbiome correlates with metabolic markers. Nature 500, 541–546. doi: 10.1038/nature12506
Li, Z., Deng, X., Luo, J., Lei, Y., Jin, X., Zhu, J., et al. (2022). Metabolomic comparison of patients with colorectal cancer at different anticancer treatment stages. Front. Oncol. 11:574318. doi: 10.3389/fonc.2021.574318
Li, H., Zhang, Q., Song, J., Wang, A., Zou, Y., Ding, L., et al. (2017). Plasma trans-fatty acids levels and mortality: a cohort study based on 1999-2000 National Health and nutrition examination survey (NHANES). Lipids Health Dis. 16:176. doi: 10.1186/s12944-017-0567-6
Liao, F., He, W., Jiang, C., Yin, C., Guo, G., Chen, X., et al. (2015). A high LDL-C to HDL-C ratio predicts poor prognosis for initially metastatic colorectal cancer patients with elevations in LDL-C. Onco Targets Ther. 5, 3135–3142. doi: 10.2147/OTT.S90479
Liu, R., Peng, Y., Li, X., Wang, Y., Pan, E., Guo, W., et al. (2013). Identification of plasma metabolomic profiling for diagnosis of esophageal squamous-cell carcinoma using an UPLC/TOF/MS platform. Int. J. Mol. Sci. 14, 8899–8911. doi: 10.3390/ijms14058899
Macias, R. I. R., Muñoz-Bellvís, L., Sánchez-Martín, A., Arretxe, E., Martínez-Arranz, I., Lapitz, A., et al. (2020). A novel serum metabolomic profile for the differential diagnosis of distal cholangiocarcinoma and pancreatic ductal adenocarcinoma. Cancers 12:1433. doi: 10.3390/cancers12061433
Mamas, M., Dunn, W. B., Neyses, L., and Goodacre, R. (2011). The role of metabolites and metabolomics in clinically applicable biomarkers of disease. Arch. Toxicol. 85, 5–17. doi: 10.1007/s00204-010-0609-6
Manichanh, C. (2006). Reduced diversity of faecal microbiota in Crohn’s disease revealed by a metagenomic approach. Gut 55, 205–211. doi: 10.1136/gut.2005.073817
Notarnicola, M., Lorusso, D., Tutino, V., Valentina, D. N., Giampiero, D. L., Marangelli, G., et al. (2018). Differential tissue fatty acids profiling between colorectal cancer patients with and without synchronous metastasis. Int. J. Mol. Sci. 19:962. doi: 10.3390/ijms19040962
Phua, L. C., Chue, X. P., Koh, P. K., Cheah, P. Y., Ho, H. K., and Chan, E. C. (2014). Non-invasive fecal metabonomic detection of colorectal cancer. Cancer Biol. Ther. 15, 389–397. doi: 10.4161/cbt.27625
Puchades-Carrasco, L., and Pineda-Lucena, A. (2017). Metabolomics applications in precision medicine: an oncological perspective. Curr. Top. Med. Chem. 17, 2740–2751. doi: 10.2174/1568026617666170707120034
R Core Team (2017). R: A language and environment for statistical computing. R Foundation for Statistical Computing, Vienna, Austria.
Ringel, Y., Maharshak, N., Ringel-Kulka, T., Wolber, E. A., Sartor, R. B., and Carroll, I. M. (2015). High throughput sequencing reveals distinct microbial populations within the mucosal and luminal niches in healthy individuals. Gut Microbes 6, 173–181. doi: 10.1080/19490976.2015.1044711
Rognes, T., Flouri, T., Nichols, B., Quince, C., and Mahé, F. (2016). Vsearch: a versatile open source tool for metagenomics. Peer J. 4:e2584. doi: 10.7717/peerj.2584
Shah, M. S., DeSantis, T., Yamal, J. M., Yamal, J. M., Weir, T., Ryan, E. P., et al. (2018). Re-purposing 16S rRNA gene sequence data from within case paired tumor biopsy and tumor-adjacent biopsy or fecal samples to identify microbial markers for colorectal cancer. PLoS One 13:e0207002. doi: 10.1371/journal.pone.0207002
Simon, K. (2016). Colorectal cancer development and advances in screening. Clin. Interv. Aging 11, 967–976. doi: 10.2147/CIA.S109285
Spratlin, J. L., Serkova, N. J., and Eckhardt, S. G. (2009). Clinical applications of metabolomics in oncology: a review. Clin. Cancer Res. 15, 431–440. doi: 10.1158/1078-0432.CCR-08-1059
Szekely, G. J., and Rizzo, M. L. (2009). Brownian distance covariance. Ann. Appl. Stat. 3, 1236–1265. doi: 10.1214/09-AOAS312
Taddese, R., Garza, D. R., Ruiter, L. N., de Jonge, M. I., Belzer, C., Aalvink, S., et al. (2020). Growth rate alterations of human colorectal cancer cells by 157 gut bacteria. Gut Microbes 12, 1–20. doi: 10.1080/19490976.2020.1799733
Thanikachalam, K., and Khan, G. (2019). Colorectal cancer and nutrition. Nutrients 11:164. doi: 10.3390/nu11010164
Thomas, A. M., Manghi, P., Asnicar, F., Pasolli, E., Armanini, F., Zolfo, M., et al. (2019). Metagenomic analysis of colorectal cancer datasets identifies cross-cohort microbial diagnostic signatures and a link with choline degradation. Nat. Med. 25, 667–678. doi: 10.1038/s41591-019-0405-7
Tian, Y., Xu, T., Huang, J., Zhang, L., Xu, S., Xiong, B., et al. (2016). Tissue metabonomic phenotyping for diagnosis and prognosis of human colorectal cancer. Sci. Rep. 6:20790. doi: 10.1038/srep20790
Tokunaga, M., Kami, K., Ozawa, S., Oguma, J., Kazuno, A., Miyachi, H., et al. (2018). Metabolome analysis of esophageal cancer tissues using capillary electrophoresis-time-of-flight mass spectrometry. Int. J. Oncol. 52, 1947–1958. doi: 10.3892/ijo.2018.4340
Troisi, J., Sarno, L., Landolfi, A., Scala, G., Martinelli, P., Venturella, R., et al. (2018). Metabolomic signature of endometrial cancer. J. Proteome Res. 17, 804–812. doi: 10.1021/acs.jproteome.7b00503
Vacante, M., Ciuni, R., Basile, F., and Biondi, A. (2020). Gut microbiota and colorectal cancer development: a closer look to the adenoma-carcinoma sequence. Biomedicine 8:489. doi: 10.3390/biomedicines8110489
Wang, Q., Ye, J., Fang, D., Lv, L., Wu, W., Shi, D., et al. (2020). Multi-omic profiling reveals associations between the gut mucosal microbiome, the metabolome, and host DNA methylation associated gene expression in patients with colorectal cancer. BMC Microbiol. 20:83. doi: 10.1186/s12866-020-01762-2
Williams, M. D., Zhang, X., Park, J. J., Siems, W. F., Gang, D. R., Resar, L. M., et al. (2015). Characterizing metabolic changes in human colorectal cancer. Anal. Bioanal. Chem. 407, 4581–4595. doi: 10.1007/s00216-015-8662-x
Xia, C., Dong, X., Li, H., Cao, M., Sun, D., He, S., et al. (2022). Cancer statistics in China and United States, 2022: profiles, trends, and determinants. Chin. Med. J. 135, 584–590. doi: 10.1097/CM9.0000000000002108
Xie, Y. H., Gao, Q. Y., Cai, G. X., Sun, X. M., Zou, T. H., Chen, H. M., et al. (2017). Fecal clostridium symbiosum for noninvasive detection of early and advanced colorectal cancer: test and validation studies. EBioMedicine 25, 32–40. doi: 10.1016/j.ebiom.2017.10.005
Xu, J., Chen, Y., Zhang, R., He, J., Song, Y., Wang, J., et al. (2016). Global metabolomics reveals potential urinary biomarkers of esophageal squamous cell carcinoma for diagnosis and staging. Sci. Rep. 6:35010. doi: 10.1038/srep35010
Yachida, S., Mizutani, S., Shiroma, H., Shiba, S., Nakajima, T., Sakamoto, T., et al. (2019). Metagenomic and metabolomic analyses reveal distinct stage-specific phenotypes of the gut microbiota in colorectal cancer. Nat. Med. 25, 968–976. doi: 10.1038/s41591-019-0458-7
Yang, T. W., Lee, W. H., Tu, S. J., Huang, W. C., Chen, H. M., Sun, T. H., et al. (2019). Enterotype-based analysis of gut microbiota along the conventional adenoma-carcinoma colorectal cancer pathway. Sci. Rep. 9:10923. doi: 10.1038/s41598-019-45588-z
Yang, J., and Yu, J. (2018). The association of diet, gut microbiota and colorectal cancer: what we eat may imply what we get. Protein Cell 9, 474–487. doi: 10.1007/s13238-018-0543-6
Yazici, C., Wolf, P. G., Kim, H., Cross, T. L., Vermillion, K., Carroll, T., et al. (2017). Race-dependent association of sulfidogenic bacteria with colorectal cancer. Gut 66, 1983–1994. doi: 10.1136/gutjnl-2016-313321
Yu, S. Y. (2018). The impact of colorectal neoplasm resection on gut microbiota Shanghai Jiao Tong University. Doctoral dissertation, Shanghai Jiao Tong University.
Zhang, S., Lu, X., Hu, C., Li, Y., Yang, H., Yan, H., et al. (2020). Serum metabolomics for biomarker screening of esophageal squamous cell carcinoma and esophageal squamous dysplasia using gas chromatography-mass spectrometry. ACS Omega 5, 26402–26412. doi: 10.1021/acsomega.0c02600
Zhang, Y., Wang, J., Dai, N., Han, P., Li, J., and Zhao, J. (2020). Alteration of plasma metabolites associated with chemoradiosensitivity in esophageal squamous cell carcinoma via untargeted metabolomics approach. BMC Cancer 20:835. doi: 10.1186/s12885-020-07336-9
Zhang, F., Zhang, Y., Zhao, W., Deng, K., Wang, Z., Yang, C., et al. (2017). Metabolomics for biomarker discovery in the diagnosis, prognosis, survival and recurrence of colorectal cancer: a systematic review. Oncotarget 8, 35460–35472. doi: 10.18632/oncotarget.16727
Zheng, R. S., Zhang, S. W., Zeng, H. M., Wang, S. M., Sun, K. X., Chen, R., et al. (2022). Cancer incidence and mortality in China, 2016. JNCC 2, 1–9. doi: 10.1016/j.jncc.2022.02.002
Keywords: colorectal cancer, gut microbiome, metabolomics, biomarkers, tissue, feces
Citation: Feng J, Gong Z, Sun Z, Li J, Xu N, Thorne RF, Zhang XD, Liu X and Liu G (2023) Microbiome and metabolic features of tissues and feces reveal diagnostic biomarkers for colorectal cancer. Front. Microbiol. 14:1034325. doi: 10.3389/fmicb.2023.1034325
Edited by:
Hu T. Huang, McKesson, United StatesReviewed by:
Ximo Pechuan Jorge, Genentech Inc., United StatesCopyright © 2023 Feng, Gong, Sun, Li, Xu, Thorne, Zhang, Liu and Liu. This is an open-access article distributed under the terms of the Creative Commons Attribution License (CC BY). The use, distribution or reproduction in other forums is permitted, provided the original author(s) and the copyright owner(s) are credited and that the original publication in this journal is cited, in accordance with accepted academic practice. No use, distribution or reproduction is permitted which does not comply with these terms.
*Correspondence: Xiaoying Liu, ✉ bGl1eGlhb3lpbmdAYWhtdS5lZHUuY24=; Gang Liu, ✉ bGl1Z2FuZzg5NjZAMTYzLmNvbQ==
Disclaimer: All claims expressed in this article are solely those of the authors and do not necessarily represent those of their affiliated organizations, or those of the publisher, the editors and the reviewers. Any product that may be evaluated in this article or claim that may be made by its manufacturer is not guaranteed or endorsed by the publisher.
Research integrity at Frontiers
Learn more about the work of our research integrity team to safeguard the quality of each article we publish.