
95% of researchers rate our articles as excellent or good
Learn more about the work of our research integrity team to safeguard the quality of each article we publish.
Find out more
ORIGINAL RESEARCH article
Front. Microbiol. , 16 December 2022
Sec. Microbe and Virus Interactions with Plants
Volume 13 - 2022 | https://doi.org/10.3389/fmicb.2022.985691
This article is part of the Research Topic Plant-Fungal Interactions View all 26 articles
 Yang Zhou1,2,3
 Chingchai Chaisiri2,3Mei Luo2,3Fei Fan2,3Yu-Fu Wang2,3Liang-Fen Yin3,4Wei-Xiao Yin3,5
 Chao-Xi Luo2,3,5*
Venturia carpophila, the causal agent of scab disease of peach, mume, and apricot, is widely distributed around the world. Scab of stone fruits is an important disease in China. However, little is known about the population biology and genetic diversity of the V. carpophila. To better understand the genetic diversity and population structure of V. carpophila, 186 single-spore isolates from different hosts and geographic regions were obtained and analyzed by using 31 simple sequence repeat (SSR) markers. This included 156 isolates from peach spanning 14 provinces, 15 isolates from mume and 15 isolates from apricot in Huazhong Agricultural University (HZAU). Diversity analysis with SSR markers showed a low incidence of polymorphisms within mume isolates (32.59% of markers), but a higher incidence of polymorphisms within peach isolates (42.96%) and apricot isolates (57.04%). Within peach isolates, Nei’s average gene diversity ranged from 0.07 for Hebei population to 0.18 for Hubei population. AMOVA analysis revealed that 13% of the observed genetic diversity was partitioned among the geographic populations, while 40% of the observed genetic diversity was partitioned among the host populations. Other analyses (PCoA, STRUCTURE, DAPC, MSN, and UPGMA) indicated that the Chinese V. carpophila populations could be clustered into three distinct genetic groups, which correspond to the host boundaries of peach, mume and apricot. The genetic identity of V. carpophila isolates throughout the range is dependent on hosts, but not geographic regions.
Stone fruit trees such as peach (Prunus persica), mume (P. mume), and apricot (P. armeniaca) are grown widely in China (Chuda et al., 1999; Li et al., 2018). Venturia carpophila is an important pathogen that causes scab disease on several stone fruits including peach, mume, apricot, and almond (Prunus dulcis; Sivanesan, 1977; Chen et al., 2014; Bailly, 2020). The scab disease can result in yield loss, fruit quality decline, and increased management costs. Scab is one of the most serious diseases on peach in China, which can cause defoliation and tree weakening, and more susceptible to chilling and freezing injuries (Zhou et al., 2021a). Typical symptoms on fruits are black freckles, spots, and/or scabs of variable sizes, distribution and density, irregularly circular to oval lesions, developing a slightly raised dark-brown purple border and be slightly raised and corky in appearance (Scherm et al., 2008; Chen et al., 2017; Kim et al., 2017; Figure 1). Multiple spots on fruits often merge, leading to cracking of the skin (Figures 1A,B,E). Leaf symptoms are less common, but occur as yellowish blotches and then turn grayish as spores are produced (Chen et al., 2014; Figure 1F). In our experiments, we found that isolates from three hosts showed obvious differences in colony morphology, growth rate and spore production on the MEA medium. On MEA medium after 42 days at 21°C, isolates from apricot were light gray in color and were fast growing with approximately 3 cm colonies in diameter and the least conidia production (0.9 × 10⁴/dish). Isolates from mume were dark gray in color and the fastest growing with approximately 3.3 cm colonies in diameter and better conidia production (2 × 10⁴/dish). Isolates from peach were white to gray in color and were slow growing with approximately 2.6 cm colonies in diameter and the best conidia production (10 × 104/dish, unpublished data). Conidia of the pathogens are spread by rain splash and wind. The disease is particularly severe in temperate climate regions characterized by humid and cool springs, and poor air circulation (Bock et al., 2020). If the weather condition is favorable, asexual conidia release and cause massive secondary infections during the growing season (Villarino et al., 2012; González-Domínguez et al., 2017). Scabs can result in fruit downgrading and/or rejection if the infection is severe, and these blemishes reduce the value of fruit intended for the fresh market and cause huge economic losses (Schnabel and Layne, 2004). During the sample collection, the infection could be observed in up to 100% of fruits in some orchards (Figures 1A,C). Control of scabs is mainly based on the application of fungicides in China. So far, carbendazim resistance has been detected (Zhou et al., 2021a). Integrated management approaches such as planting resistant cultivars could potentially reduce scab inocula in orchards.
Figure 1. Typical symptoms of scab on peach, mume, and apricot. (A,B) Typical symptoms on peach, (C,D) on mume, (E,F) on apricot fruit and leaf, respectively.
With the development of modern molecular biology, molecular markers have become important tools to study the genetic diversity and population structure of pathogenic fungi. Different molecular tools have been used to characterize the genetic diversity of populations of Venturia spp., including random amplified polymorphic DNA (RAPD; Koh et al., 2013; Chen et al., 2014; Poniatowska et al., 2016), restriction fragment length polymorphism (RFLP; Tenzer and Gessler, 1999; Guérin et al., 2004; Padder et al., 2013), amplified fragment length polymorphism (AFLP; Gladieux et al., 2008), and simple sequence repeat marker (SSR; Tenzer and Gessler, 1999; Guérin et al., 2004; Chen et al., 2018). SSR markers have the advantages of high polymorphisms, stability, codominant inheritance, and easy operation. At present, SSR technology has been widely used in variety identification, genetic classification, mapping, core germplasm identification and evaluation, and genetic diversity research of pathogenic fungi, including Verticillium dahliae (Jiménez-Díaz et al., 2011; Baroudy et al., 2019), V. inaequalis (Tenzer and Gessler, 1999; Leroy et al., 2013; Ebrahimi et al., 2016), V. nashicola (Choi et al., 2019), Monilinia fructicola (Fan et al., 2010; Villarino et al., 2012), and Ustilaginoidea virens (Sun et al., 2013; Yu et al., 2016). In this study, SSR markers were used to make a fundamental and thorough analysis of the genetic diversity and population structure of V. carpophila. Although the genetic diversity was carried out on V. inaequalis from different regions of the world, the characterization of V. carpophila has rarely been reported, most likely the latter one is very difficult to be obtained in the laboratory. Two molecular tools have been used to characterize the genetic diversity of populations of V. carpophila in the United States. Results revealed some divergence between two different geographic V. carpophila populations, and different levels of genetic diversity were observed within the two populations (Chen et al., 2014, 2018).
Stone fruit scab is widely distributed in China, yet there is no information about the genetic diversity of Chinese V. carpophila populations. In this study, we collected samples and isolated single-spore isolates from three hosts and 14 provinces in China. Population genetics analysis is crucial for understanding the population genetic structure and diversity, thus helping to prevent and control the disease (Sitther et al., 2018; Choi et al., 2019; He et al., 2019; Singh and Khan, 2019). Considering that scab disease is one of the most important peach diseases in China, the population structure needs to be studied and monitored. The objectives of this study are to determine (i) if all scab-like symptoms on different stone fruits (peach, mume, and apricot) are caused by V. carpophila, (ii) the genetic diversity and population structure of V. carpophila in China, and (iii) if the genetic differences are specifically correlated with geographic regions or hosts.
From 2017 to 2019, samples of stone fruit scab were collected from 14 provinces in China, among them, peach scab samples were collected from 14 provinces, and all the apricot scab and mume scab samples were collected from Hubei Province (Table 1). Altogether 750 isolates were obtained using the single spore isolation method, from which 186 isolates were selected for genetic diversity analysis (Table 1; Figure 2). Among selected isolates, 156 were from peach or nectarine that were located in 14 provinces in China, 15 were from mume and 15 were from apricot in Huazhong Agricultural University (HZAU; Table 1), the isolates from mume and apricot are mainly used as references. Briefly, asexually produced conidia of V. carpophila were scraped from a single lesion on the fruit surface using a scalpel and then spread with a scalpel on the surface of water agar (20 g of agar per liter) plates. Using a modified microscope (Wuhan Heipu Science and Technology Ltd., Wuhan, China), a single spore was isolated with a glass needle and then transferred to potato dextrose agar (PDA; 200 g of potato, 20 g of dextrose, and 20 g of agar per liter) amended with lactic acid (0.50 ml/L), streptomycin sulfate (0.20 g/L), tetracycline (0.05 g/L), and chloramphenicol (0.05 g/L; Chen et al., 2014). For long-term storage, isolates were maintained on dried filter paper. In brief, colonies were grown on antibiotic-amended oatmeal agar medium (OMA; 30 g of oatmeal; 20 g of agar per liter) in petri dishes starting with mycelial suspension, and sterile filter paper discs (5 mm in diameter) were placed on the OMA surface (Zhou et al., 2020, 2022). Each isolate was grown at 21°C for about 14 days in darkness. When the filter discs were fully covered with mycelium, they were removed and dried in a desiccator with silica gel. After 10 days, discs were transferred into 1.5-ml sterile centrifuge tubes with desiccated silica gel and stored at −20°C (Chen et al., 2019; Zhou et al., 2021b).
Table 1. Sampling geographic regions, host, cultivar, and tissue of isolates of Venturia carpophila collected to assess population genetic diversity.
Figure 2. Distribution map of 186 Venturia carpophila isolates, which were collected from 14 major peach-producing provinces in China.
Suspension of V. carpophila spores was transferred into 50 ml of malt extract broth (MEB, 30 g of malt extract and 5 g of peptone per liter of water) in an Erlenmeyer flask, and incubated at 21°C, 160 rpm for 10 days to obtain a sufficient amount of mycelium for DNA extraction. Approximately 100 mg of mycelium of each isolate was collected from the MEB broth, and put into a pilot freeze dryer (25 L Genesis SQ Super ES-55) to dehydrate for 48 h. Dehydrated hyphae were placed into Eppendorf tubes containing 0.5 g steel balls (5 mm in diameter) and frozen with liquid nitrogen for 2 min. Mycelium was homogenized by shaking the tubes for 5 min at 30 shakes/s in a Mixer Mill Type LT2020 (Beijing Dinghaoyuan Gmbh, China). After homogenization, DNA was immediately extracted by the modified SDS method (Turan et al., 2015), and genomic DNA was diluted with 70 μl of sterile distilled water. DNA was quantified with a NanoDrop spectrophotometer (Thermo Fisher Scientific) and stored at −20°C.
Isolates of V. carpophila were identified based on morphological and molecular characterization. Briefly, fragments of nuclear ribosomal internal transcribed spacer regions (rDNA-ITS; White et al., 1990) and large subunit ribosomal RNA gene (LSU; Vilgalys and Hester, 1990) were amplified from 186 isolates by polymerase chain reaction (PCR), and then used for sequencing. The PCR reaction was performed following the conditions of 95°C for 3 min, followed by 35 cycles at 95°C for 30 s, annealing at 55°C for 50 s, 72°C for 2 min, and 72°C for 5 min. The Sanger sequencing of PCR products was performed on ABI 3730xl DNA Sequencer at Tianyihuiyuan Biotechnology Co., Ltd. (Wuhan, China). Phylogenetic trees of Venturia species were constructed based on the combined multi-locus dataset (LSU + ITS). The majority rule consensus tree from maximum parsimony (MP) analysis was used to show the phylogenetic relationships of Venturia species and their close species. The tree was rooted with Sympoventuria capensis (CBS 120136). The Bayesian posterior probabilities values (BIPP) ≥0.70, maximum likelihood and maximum parsimony bootstrap values (MLBS and MPBS) ≥ 50% were shown at the branch nodes (BIPP/MLBS/MPBS).
The genetic diversity analysis was carried out according to the previous description with minor modifications (Chen et al., 2018). Thirty-two microsatellite primers (Supplementary Table S1) were developed from a draft genome of V. carpophila which has been released, after primary screening, 31 microsatellite primers were used to conduct the genetic diversity analysis in this study (Chen et al., 2018). SSR markers were obtained via PCR reactions with fluorescently labeled primers. Primers were manufactured at Tianyihuiyuan Biotechnology Co., Ltd. (Wuhan, China). When primers were synthesized, the universal M13 sequence (5′-TGT AAA ACG ACG GCC AGT-3′) was added to the 5′ end of each forward primer. Simultaneously, M13 was labeled by FAM fluorescent dyes at the 3′ end. The labeled M13 was added to the PCR reaction to detect PCR product by complementing the unlabeled M13 added at 5′ end of primer (Chen et al., 2018). The PCR reaction was in a volume of 15 μl, including 4.5 μl ddH2O, 7.5 μl Mastermix (no dye), 0.4 μl of M13-tagged forward primer (10 μM) and 0.8 μl reverse primer (10 μM), 0.8 μl FAM-labeled M13 primer (10 μM), and 1 μl DNA (50~200 ng/μl). PCR conditions were an initial denaturation at 95°C for 5 min followed by 10 cycles of denaturation at 95°C for 30 s, annealing at 62°C for 30 s (with a −1°C Ramp/cycle), and extension at 72°C for 30 s, a further 25 cycles of denaturation at 95°C for 30 s, annealing at 52°C for 30 s, extension 72°C for 30 s, and ending with a final extension of 72°C for 2 min (iCycler; Bio-Rad Laboratories Inc., Hercules, CA). The fluorescent PCR products were loaded to an ABI 3730 × I Genetic Analyzer Capillary to generate chromatographic trace files. Negative control (ddH2O) was included in the analysis to eliminate potential contamination. Resulted amplicon peaks were scored by base pair size for each marker using GeneMarker V2.2.0 to generate a microsatellite allele table for subsequent analysis. The PCR-generated bands were scored as “1” (for presence) and “0” (absence) in a binary matrix for further analysis. Because the V. carpophila is a haploid organism, only a single band was observed at each locus for individual isolate.
The scorable bands for all isolates were determined and analyzed as dominant markers with genetics based on a haploid organism (Bock et al., 2005; Chen et al., 2014). The number of markers observed for the 186 isolates with each primer set was counted, and the percentage of polymorphic loci was calculated. The numbers of alleles (Na), and effective alleles (Ne) were calculated using Popgene 32 based on SSR markers identified among isolates of V. carpophila (Yeh et al., 1999).
The genetic structure of the populations was further explored by using analysis of molecular variance (AMOVA) in GenALEX 6.5, which was conducted at two scales: across geographic populations, across host populations (Peakall and Smouse, 2006). The population structure of V. carpophila was analyzed in five ways. (1) A principal coordinate analysis (PCoA) was performed to visualize patterns of variation between populations at the host and geographic region levels based on Nei’s measure of genetic distance, in GenALEX 6.5 (Peakall and Smouse, 2006). (2) STRUCTURE 2.2 was used to detect the most likely number of populations (K) among the V. carpophila isolates based on allele frequencies per locus using a Bayesian approach (Falush et al., 2007). To estimate the number of clusters, an admixture model with correlated allele frequencies was independently run 10 times, with 10,000 iterations followed by 120,000 Markov chain Monte Carlo interactions (Bock et al., 2014). Evanno’s ΔK method was used to identify the appropriate number of clusters (Evanno et al., 2005), which was computed using Structure Harvester (Earl and vonHoldt, 2012). (3) Discriminant analysis of principal components (DAPC) was performed in adegenet of R software (Jombart et al., 2010), thus interrelationships among V. carpophila populations from different geographic regions or different hosts could be visually explored. (4) The minimum spanning network (MSN) was created in the R package poppr (Bruvo et al., 2004) by using default parameters to identify the distribution of population substructure at different scales. (5) To compare populations, the UPGMA analysis of population structure based on Nei’s genetic distance was calculated using MEGA7, and annotation and management of phylogenetic trees were conducted using Evolview V2 (He et al., 2016).
Significant differences of growth rate and spore production values from different host populations were evaluated by one-way analysis of variance with the least significant difference test in SPSS software (release 19.0; SPSS).
In the current study, all 186 isolates used were investigated for morphological characteristics. The 186 isolates were incubated at 21°C for 6 weeks in darkness on PDA, and the V. carpophila colonies on PDA were black with circular morphology and floccose texture (Figures 3A,B). The conidia were cylindrical to fusiform, 0 to 1 septate, yellowish and (11.44 to 23.16) 15.87 × 4.15 (2.56 to 6.48) μm (n = 30) in size, L/W = 3.8 (Figures 3C,D), conidiophore is fusiform (Figure 3D), which were similar with the characteristics of V. carpophila described previously (Chen et al., 2017; Dar et al., 2019; Shen et al., 2020).
Figure 3. Morphological characteristics of Venturia carpophila. (A,B) Front and back view of 42-day-old PDA culture (petri dish is 90 mm); (C,D) conidia and conidiophores produced on PDA. Scale bars: C = 40 μm; D = 20 μm.
The phylogenetic analysis based on sequences of fragments from two loci (LSU + ITS) showed that the tested isolates grouped with representative V. carpophila strains GH120501 (Korea), CBS160.55 (United States), and CBS497.62 (Switzerland) in the same clade (Figure 4). New sequences obtained in this study were deposited in GenBank (Table 1, ITS: MN958548 to MN958647; LSU: MT845672 to MT845769).
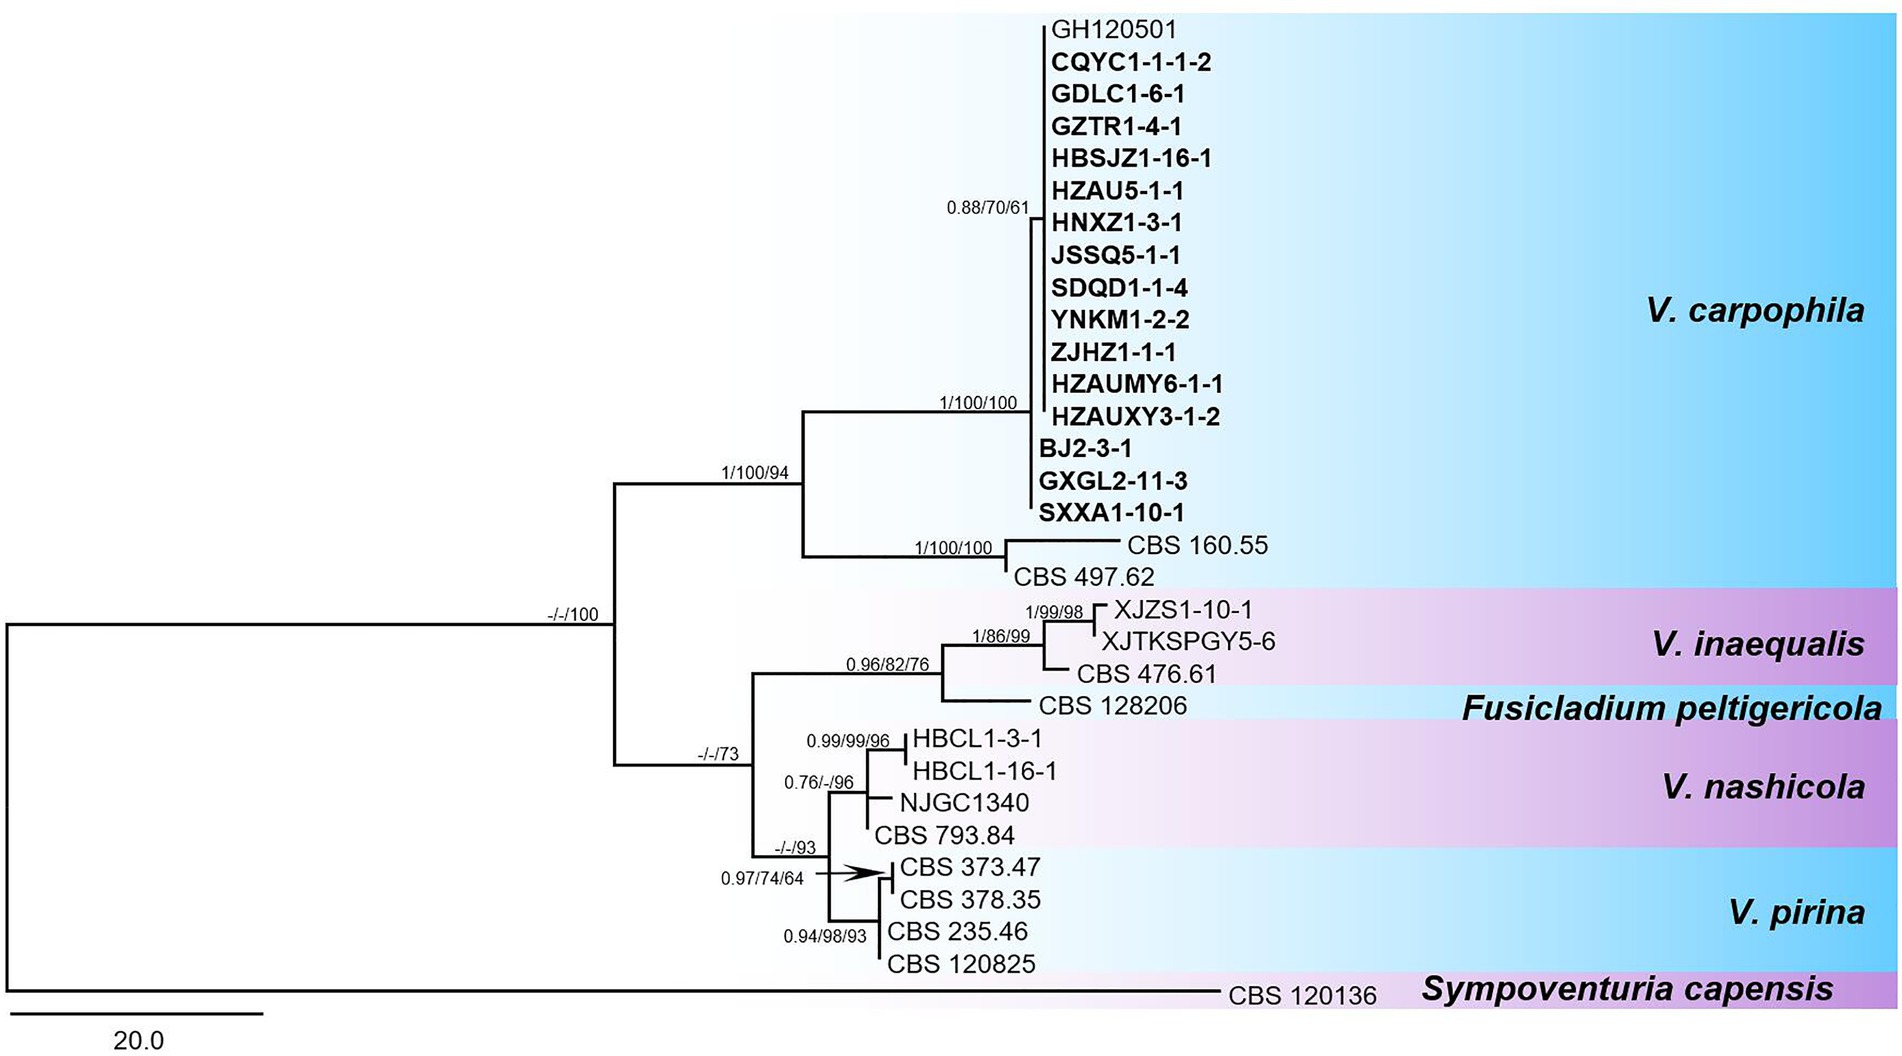
Figure 4. Phylogenetic tree in the Venturia species inferred from combined alignment with a two-locus dataset (LSU + ITS). The maximum parsimony (MP) analysis was shown for the phylogenetic relationships of species among Venturia spp. and closely related species. The tree was rooted to Sympoventuria capensis (CBS 120136). The Bayesian posterior probabilities values (BIPP) > 0.70, maximum likelihood and maximum parsimony bootstrap values (MLBS and MPBS) > 50% were shown at the branch nodes (BIPP/MLBS/MPBS). Scale bar estimated substitutions per site with 20. The isolates used in this study were displayed in bold fonts.
These 186 isolates were genotyped based on the ITS region which was amplified using the ITS4 and ITS5 primers, and four haplotypes were found for the ITS region with one to two nucleotide changes (Supplementary Figure S1). Overall, most of the isolates fell into ITS haplotype group I (MN958568, MN958609), group II (MN958640) with 82.80, and 15.59%, respectively. Only 1.08, and 0.54% of the tested isolates were in haplotype group III (MN958584), and group IV (MN958592).
To better understand the genetic diversity and population structure of Chinese V. carpophila populations, 31 SSR primer sets were chosen to analyze 186 selected single spore isolates. One peak per isolate, consistent with the haploid nature of the V. carpophila, was observed for all the loci. Among the tested 31 SSR primer sets, two primer sets (Vc015 and Vc021) showed monomorphic profiles with the only peaks at 222 bp (Vc015) and 301 bp (Vc021). The remaining 29 primer sets showed polymorphic profiles, the number of alleles at each microsatellite locus ranged from two to 21, and a total of 135 alleles were identified, with a mean number of 4.66 alleles per locus. Vc110 was the most variable primer set with 21 alleles detected and polymorphism information content (PIC) value was 0.77, whereas Vc106 had only 2 alleles and PIC value was 0.03 (Supplementary Table S1). The genotype accumulation curve showed that 29 polymorphic microsatellites were adequate to describe the genetic variability of V. carpophila (Supplementary Figure S2).
Altogether a total of 135 polymorphic loci (NPL) were detected in 186 isolates. Among them, 105 NPL were detected in 14 geographic populations and 102 NPL were detected in three host populations (Supplementary Tables S2, S3). In geographic populations, Hubei (HuB) had the largest number of NPL (77), and Hebei (HeB) had the least (22). In host populations, apricot had the largest number of NPL (77), and mume had the least number (44). Different levels of genetic diversity (H) were observed among 14 geographic populations and 3 host populations, ranging from 0.07 for HeB population to 0.18 for HuB population; a low genetic diversity of mume isolates (0.11) was observed, while higher genetic diversities were detected for peach isolates (0.14) and apricot isolates (0.17). Geographic populations showed a low percentage of polymorphic loci (PPL) in HeB population (15.30% of markers) but a higher PPL in Zhejiang (ZJ) population (50.37%) and HuB population (57.04%). Host populations showed a low PPL in mume population (32.59% of markers), and higher PPL in peach population (42.96%) and apricot population (57.05%). The number of observed alleles (Na) of the apricot population and HuB population were up to 1.57. The effective allele number (Ne) and Shannon index (I) of the HuB population were the highest, i.e., 1.31 and 0.27, respectively. Interestingly, the apricot population had only 15 isolates, but the number of polymorphic loci (NPL) was 77, as high as the HuB population (37 isolates; Supplementary Tables S2, S3). These results indicated that genetic diversity varied among different populations, and the HuB population showed the highest genetic diversity among different geographic populations, while the apricot population had the highest genetic diversity among different host populations.
Among different geographic populations, the lowest genetic similarity coefficient was 0.8819 for Guizhou versus Guangdong (GZ vs. GD), and the highest was 0.9882 for Zhejiang versus Hubei (ZJ vs. HuB). Among different host populations, the lowest genetic similarity coefficient was 0.8616 for apricot vs. mume (A vs. M), and the highest was 0.8841 for peach vs. mume (P vs. M, Supplementary Tables S4, S5). These results indicated that populations shared a moderate to substantial identity. At the same time, Nei’s genetic distance indicated that geographic populations varied in their degree of relatedness from 0.0118 (HuB vs. ZJ), which was separated by a relatively short genetic distance, to 0.1257 (GD vs. GZ), which was separated by greater genetic distance (Supplementary Table S4). Different host populations varied in their degree of relatedness from 0.1231 (P vs. M) to 0.149 (M vs. A; Supplementary Table S5).
AMOVA analysis of 14 geographic populations indicated that 13% of the observed genetic diversity was partitioned among the populations and 87% was within individual populations (PhiPT = 0.125; p = 0.001). For three host populations, 40% of the observed genetic diversity was partitioned among the populations and 60% was within individual populations (PhiPT = 0.403; p = 0.001). A moderate genetic differentiation was observed across host populations, however, limited genetic differentiation was observed across geographic populations (Supplementary Tables S5, S6). The pairwise indices of differentiation quantified the genetic variation between geographic and host populations (Supplementary Tables S6, S7). Significant pairwise geographic population PhiPT values ranged from 0.00 to 0.509, and the highest differentiation was found between the HeB and Yunnan (YN) populations (Supplementary Table S8). Significant pairwise host population PhiPT values ranged from 0.367 to 0.426, and the highest differentiation was found between the mume and apricot populations (Supplementary Table S9).
Principle coordinate analysis (PCoA) is a multidimensional scaling analysis to visualize the clustering of isolates due to genetic similarities among tested isolates. The analysis was performed in GenAlEx V6.5 based on Nei’s genetic distance. PCoA revealed three groups, one was specific to apricot isolates, the other was to mume isolates, and the third one was to peach isolates. Axes 1 and 2 of the PCoA accounted for 29.75% and 25.12% of the total genetic variation. Isolates from mume were relatively closer to peach isolates (Figure 5).
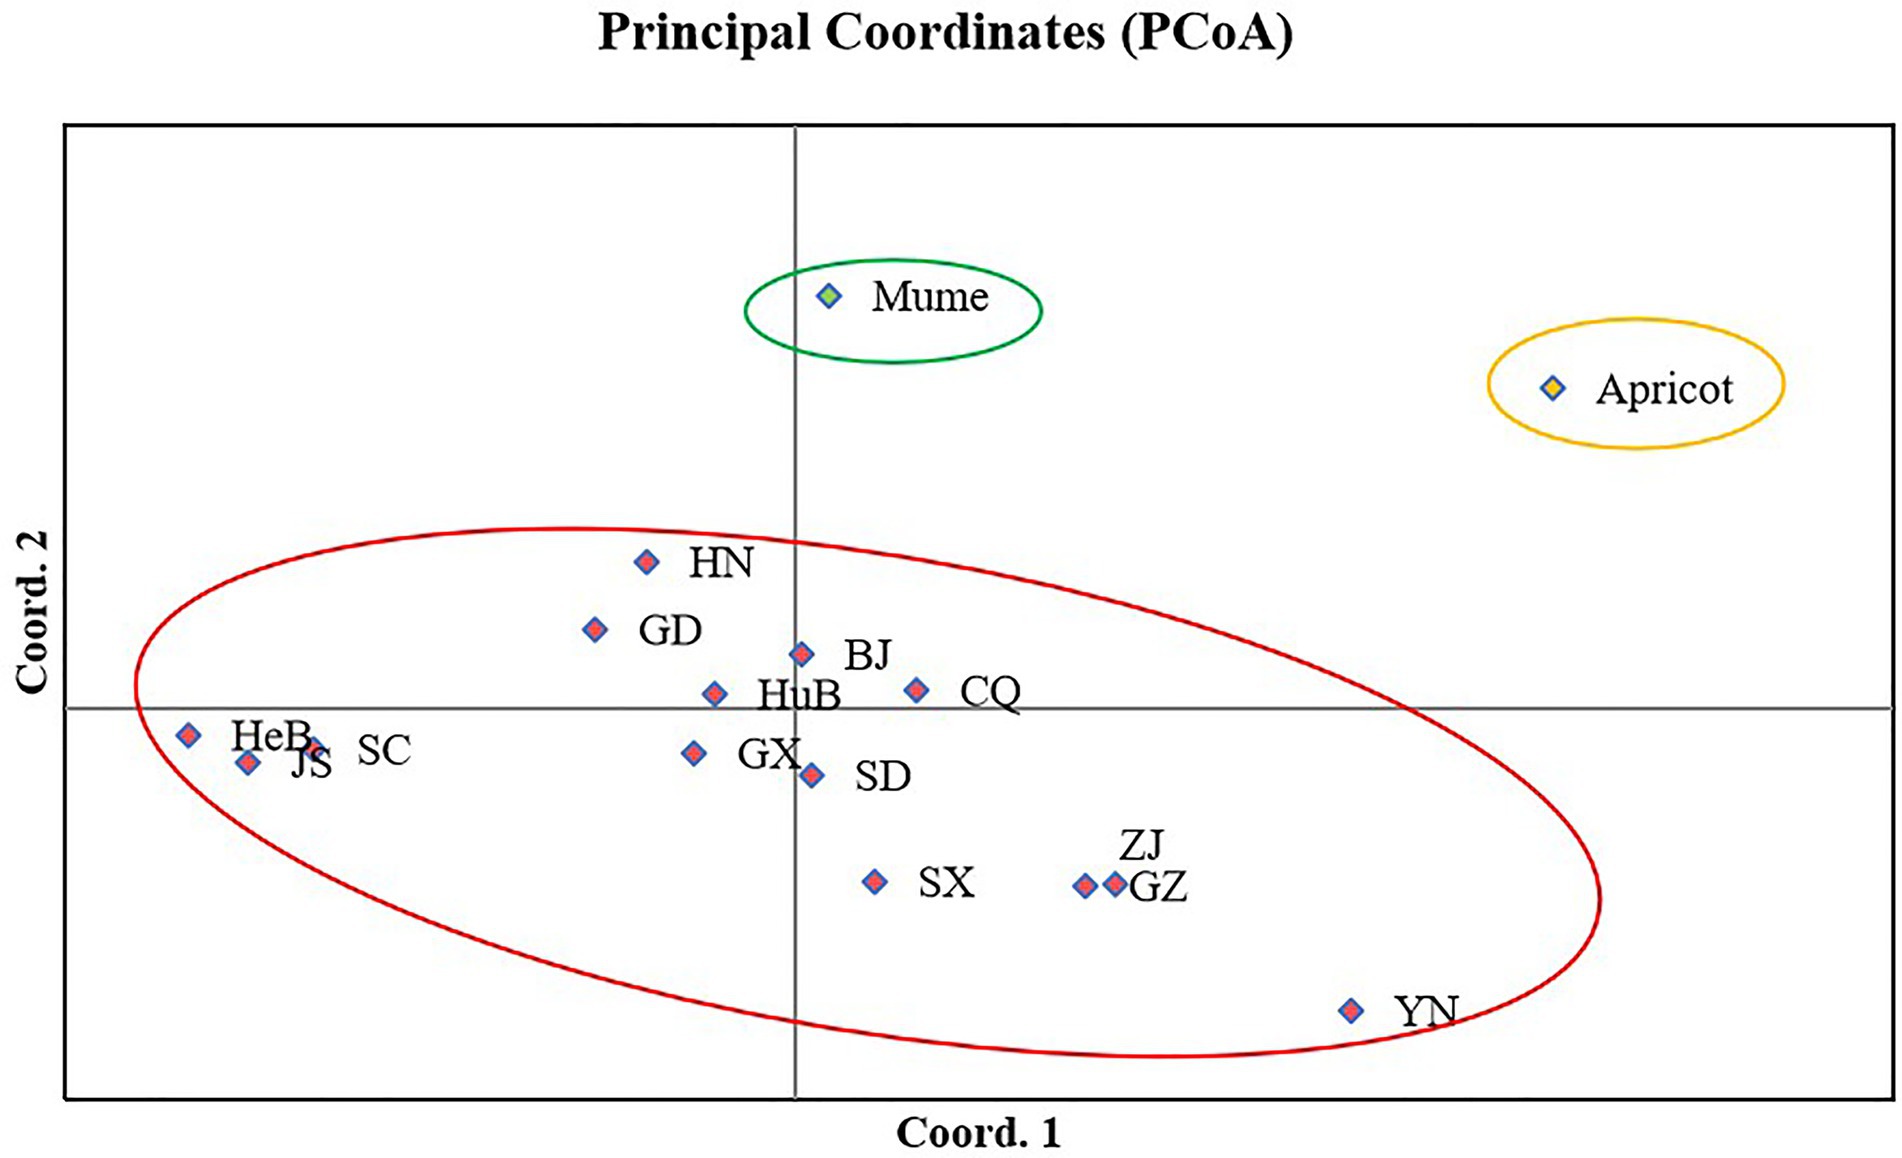
Figure 5. Principal coordinate analysis of 16 populations of Venturia carpophila in China based on Nei’s genetic distance using GenALEX. The red circle represents the isolates from peach, the green circle represents the isolates from mume and yellow circle represents the isolates from apricot. BJ, Beijing; CQ, Chongqing; GD, Guangdong; GX, Guangxi; GZ, Guizhou; HeB, Hebei; HuB, Hubei; HN, Henan; JS, Jiangsu; SC, Sichuan; SD, Shandong; SX, Shanxi; YN, Yunnan; ZJ, Zhejiang.
A similar clustering pattern was obtained by structure analyses. Structure analysis of all of the populations revealed that the highest likelihood values and the mode of the distribution of the ΔK index were all observed for K = 3 (Figure 6A), i.e., 186 isolates V. carpophila from China were divided into three subgroups (K = 3; Figure 6B). Structure analysis of 14 geographic populations revealed that the highest likelihood values and the mode of the distribution of the ΔK index were all observed for K = 3 (Same as Figure 6A, data not shown), significantly higher than other clusters. From 14 geographic populations, isolates were divided into three subgroups (K = 3; Figure 6C) which were not correlated with geographic regions. Structure analysis of 3 host populations revealed that the highest likelihood values and the mode of the distribution of the ΔK index were all observed for K = 3 (data not shown), significantly higher than other clusters. From 3 host populations, isolates were divided into three subgroups (K = 3; Figure 6D) which were correlated with hosts, i.e., isolates from the same host clustered in a group. Similarly, the DAPC analysis displayed the interrelationship of the 186 Chinese V. carpophila haplotypes. The model-based DAPC analyses suggested the existence of at least three clusters in V. carpophila populations (Figure 7A). One hundred and fifty-six isolates collected from 14 provinces on peach were overlapped (Figure 7B), while 45 isolates from different 3 hosts at the same collection geographic region showed that there are three clusters corresponding to their specific hosts (Figure 7C). Minimum spanning network (MSN) is a great way to visualize relationships among individual isolates. It is a more powerful visualization tool than trees. MSN analyses further confirmed the subdivision of populations based on hosts, where the apricot population was obviously separated from other populations, and mume isolates were relatively closer to peach isolates (Figure 8). The dendrogram was inferred using the UPGMA method based on a pairwise comparison genetic distance between populations, demonstrated three major clusters of sampling populations: one cluster included all isolates from apricot, the second cluster included all isolates from mume and a few isolates from peach, and the third cluster were all peach isolates (Figure 9). Altogether, the population structure of Chinese V. carpophila was analyzed in five ways, i.e., PCoA, STRUCTURE, UPGMA, MSN, and DAPC, and congruence among PCoA, DAPC, UPGMA, MSN, and STRUCTURE clusters was observed. The V. carpophila populations in China were clustered based on specific hosts instead of the different geographic regions.
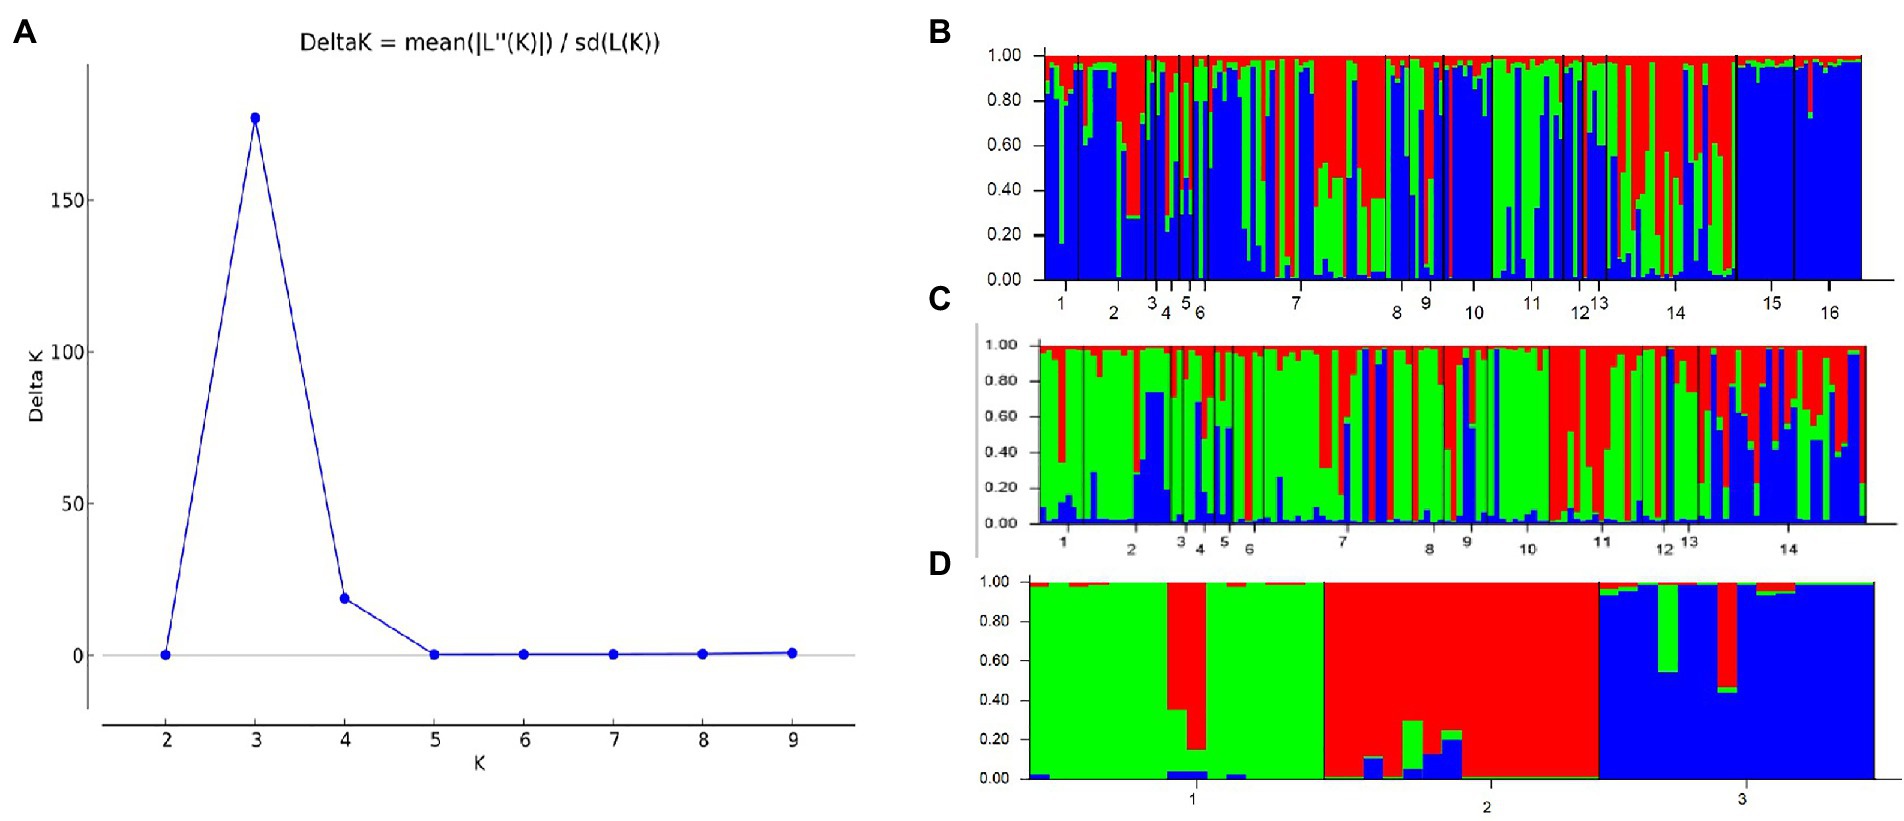
Figure 6. Estimation of population structure. (A) Optimum number of subpopulations was determined by using LnP(D) derived ∆K. The maximum value of delta K was found to be at K = 3, suggesting division of the entire population into 3 subpopulations. (B) Assignment plots of Venturia carpophila from 14 peach producing provinces and 3 hosts with K = 3 performed in the program STRUCTURE. Black lines separate isolates from different locations. 1 = Beijing (BJ), 2 = Chongqing (CQ), 3 = Guangdong (GD), 4 = Guangxi (GX), 5 = Guizhou (GZ), 6 = Hebei (HeB), 7 = Hubei (HuB), 8 = Henan (HN), 9 = Jiangsu (JS), 10 = Sichuan (SC), 11 = Shandong (SD), 12 = Shanxi (SX), 13 = Yunnan (YN), 14 = Zhejiang (ZJ), 15 = Mume, 16 = Apricot. (C) Assignment plots of V. carpophila from 14 peach producing provinces with K = 3 performed in the program STRUCTURE. 1 = Beijing, 2 = Chongqing, 3 = Guangdong, 4 = Guangxi, 5 = Guizhou, 6 = Hebei, 7 = Hubei, 8 = Henan, 9 = Jiangsu, 10 = Sichuan, 11 = Shandong, 12 = Shanxi, 13 = Yunnan, 14 = Zhejiang. (D) Assignment plots of V. carpophila from 3 hosts with K = 3 performed in the program STRUCTURE, 1 = Peach, 2 = Mume, 3 = Apricot.
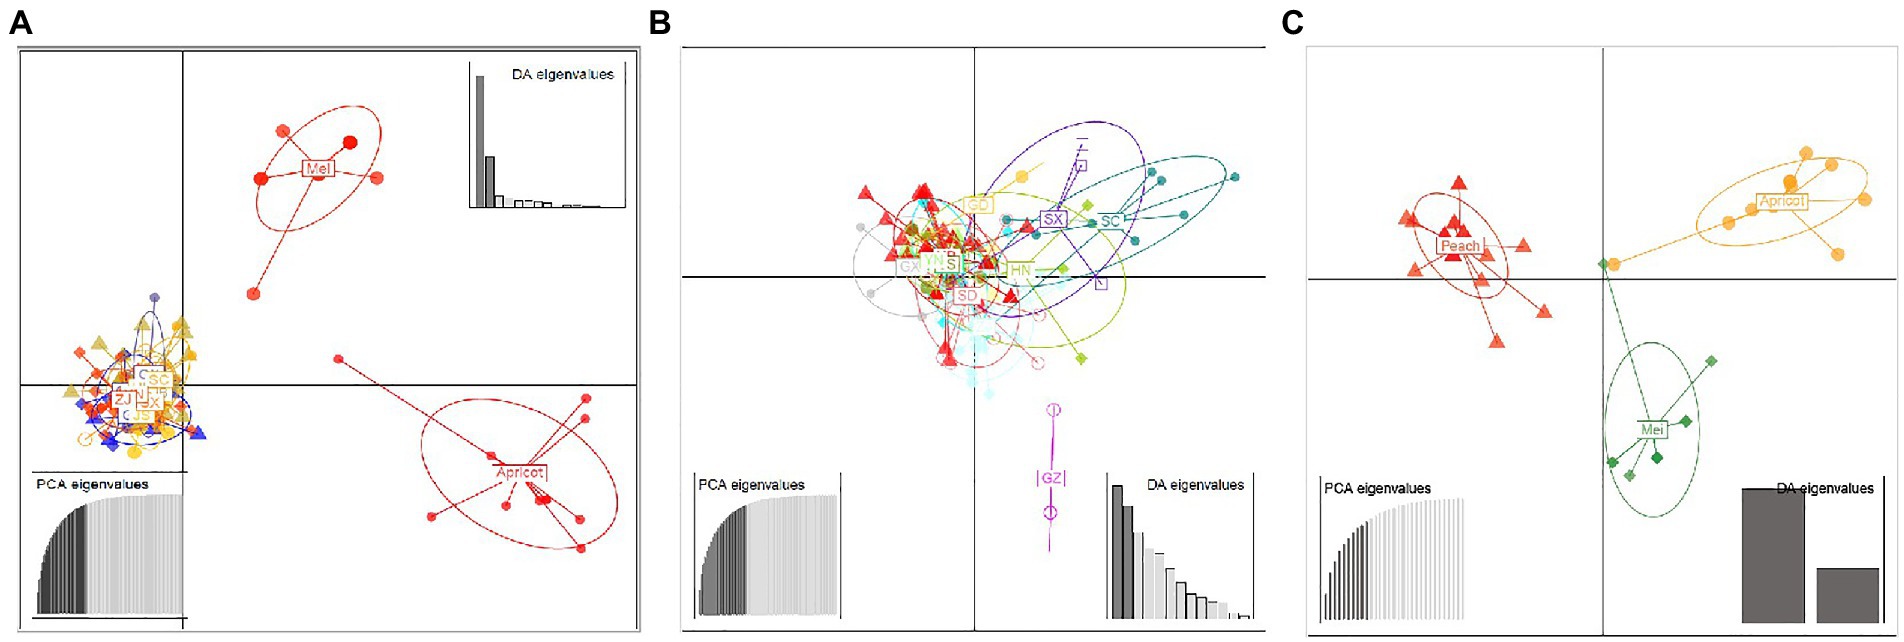
Figure 7. Discriminant analysis of principal components (DAPC) of Venturia carpophila populations including different geographic and host populations (A). Discriminant analysis of principal components of 14 geographic V. carpophila populations on peach (B). Discriminant analysis of principal components of 3 host populations (Peach, mume and apricot) V. carpophila (C). Eigenvalues signifying the variance explained by principal component analysis (PCA) and discriminant analysis (DA) indicated that the first two principal components adequately explain the genetic structure of the populations. Points represent individual isolates and ellipses represent individual populations. There is no representation of clonal individuals in this graphic.
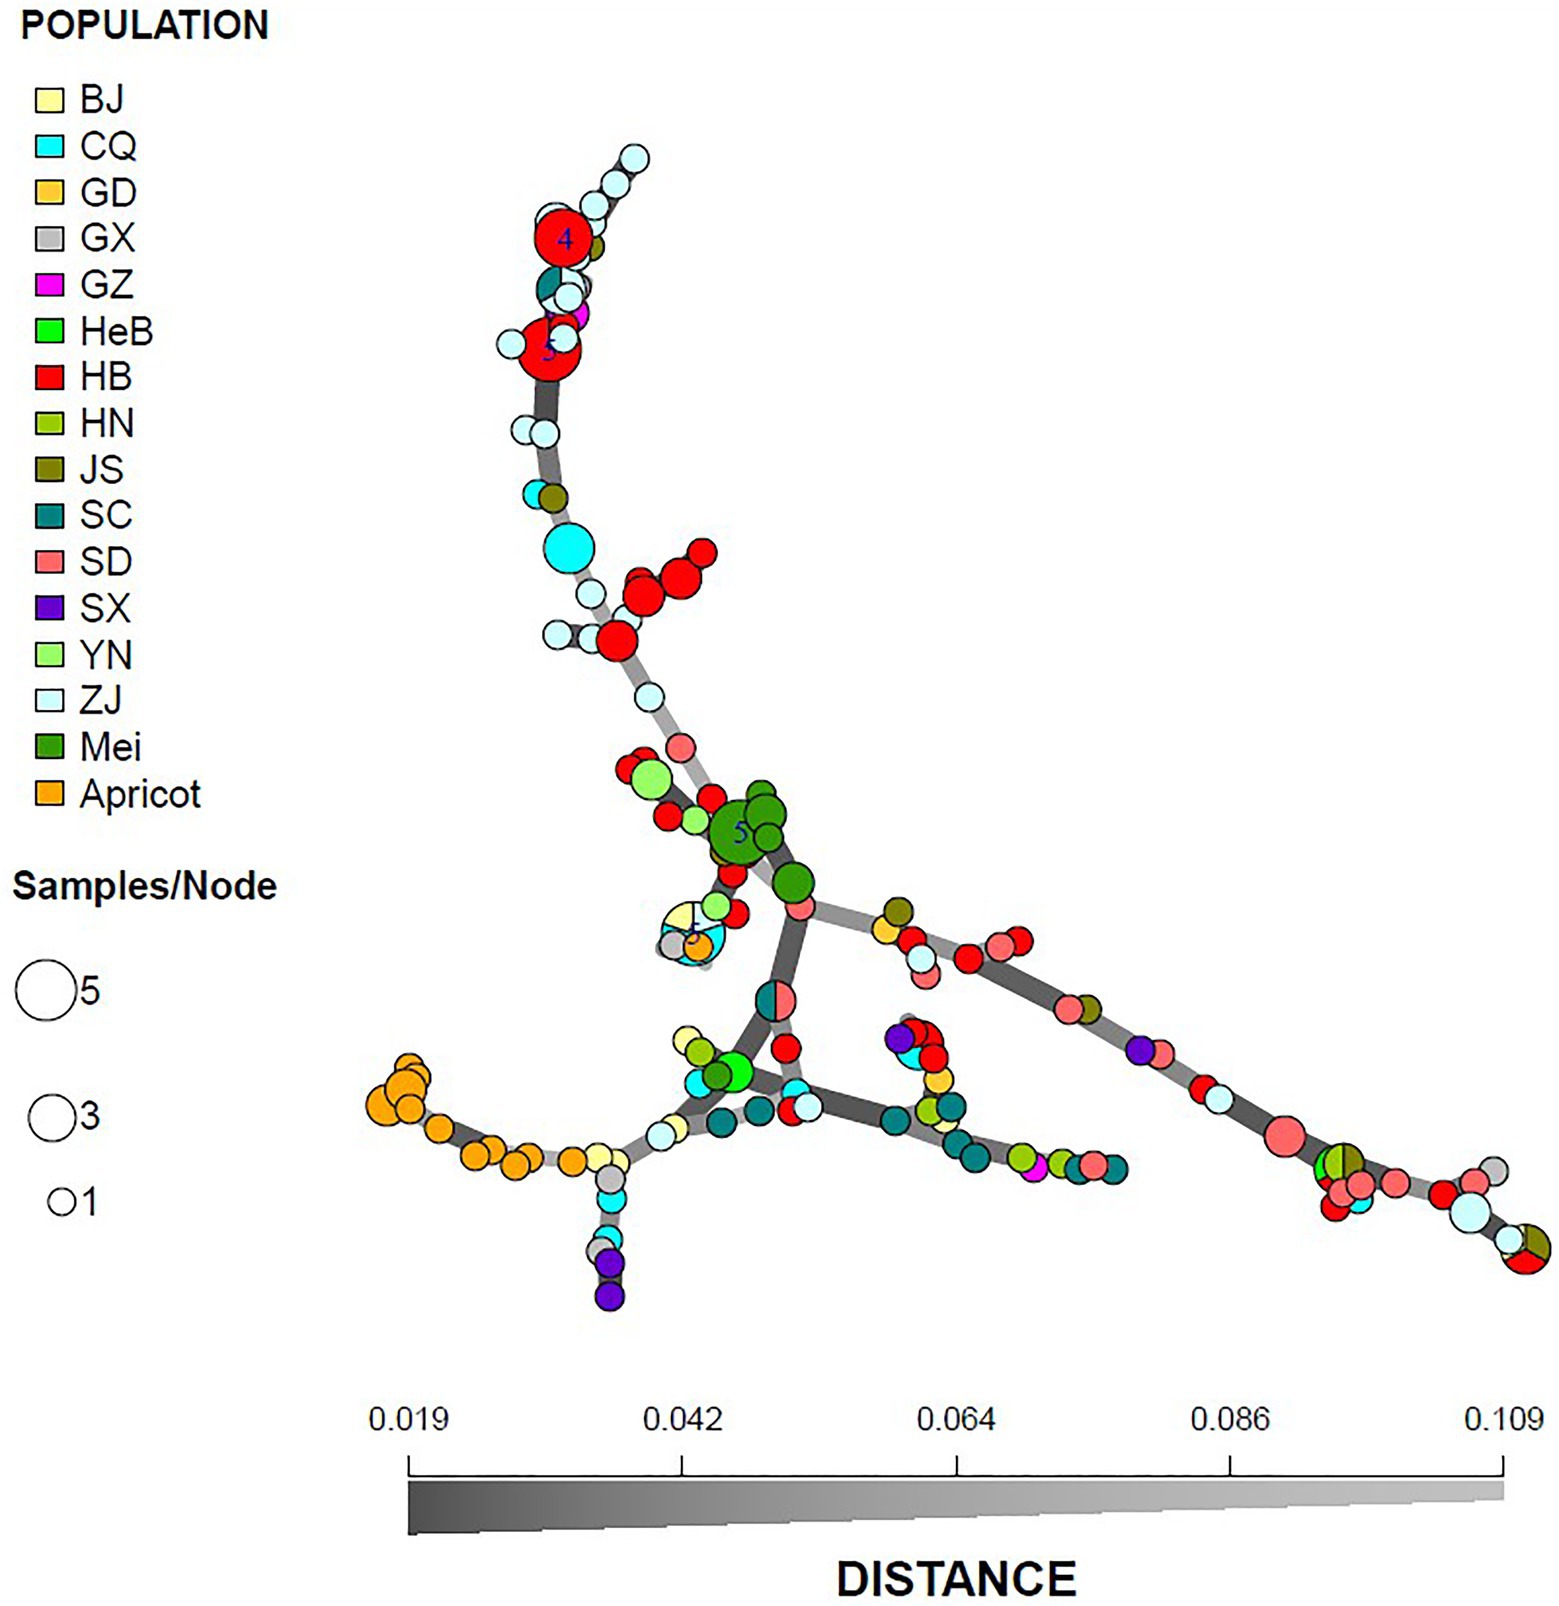
Figure 8. Minimum spanning network of 186 Venturia carpophila based on genetic distance from 14 geographic and 3 host populations. Node colors represent population membership and are proportional to the pie size. There is no representation of clonal individuals in this graphic.
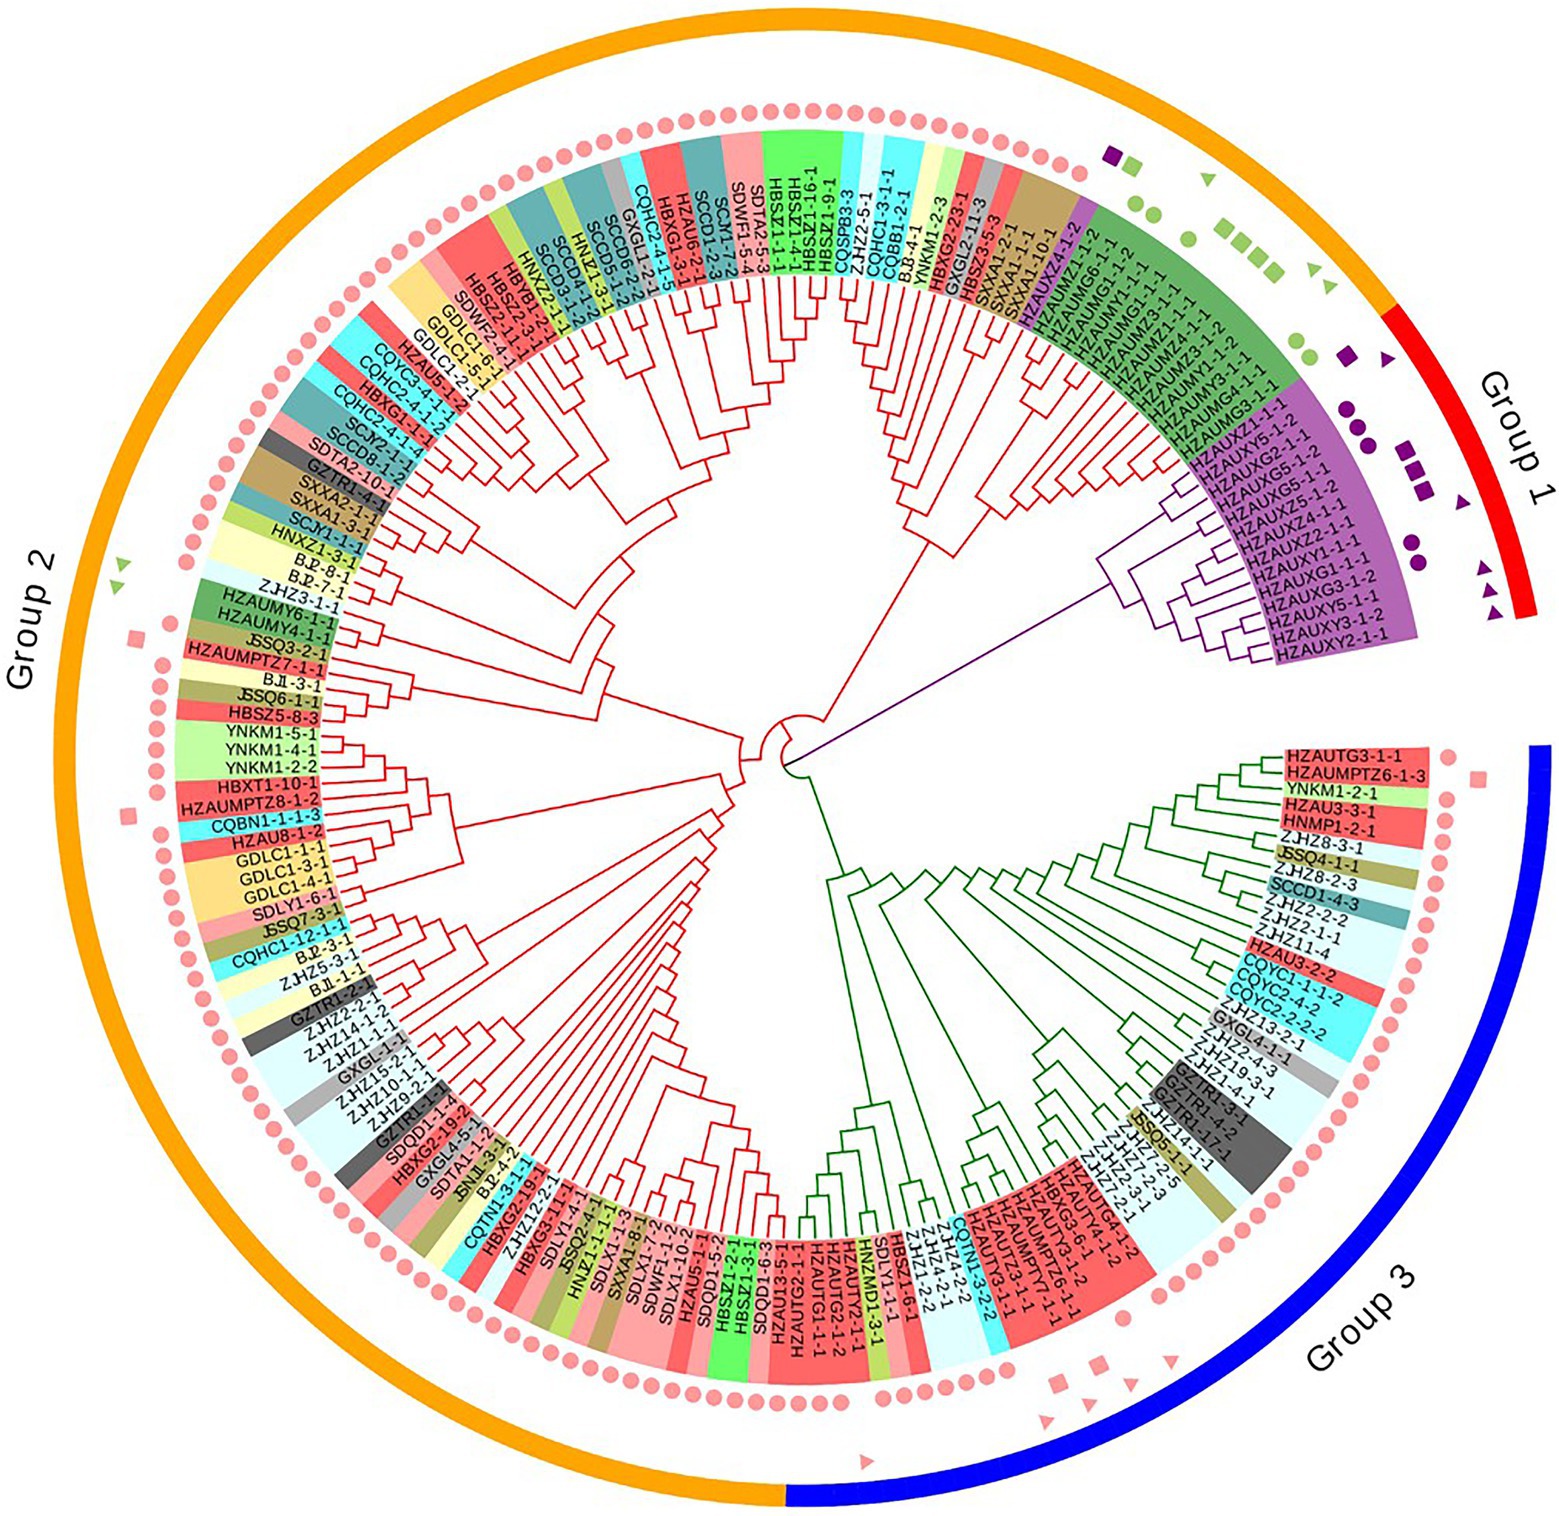
Figure 9. Relationships among 186 Venturia carpophila isolates from 14 provinces and 3 hosts. The dendrogram was constructed using the unweighted pair group method with arithmetic mean based on Nei’s genetic distance. Shape labels, circle: isolates from fruits, rectangle: isolates from twigs and triangle: isolates from leaves. Color labels, pink: isolates from peach, green: isolates from mume and purple: isolates from apricot. Phylogenetic tree was managed and annotated by using Evolview V2.
In this study, all of the isolates from scab samples of peach, mume, and apricot were confirmed as V. carpophila based on morphological and molecular characterizations. In order to better understand Chinese V. carpophila populations, SSR markers developed previously were used to analyze V. carpophila populations in China. Altogether 29 SSR markers could successfully differentiate a vast majority of isolates and sufficiently describe the genetic diversity of V. carpophila populations (Supplementary Figure S2). The relationship among different geographic populations and different host populations provides a new perspective for understanding the spread and inheritance of V. carpophila.
Chen et al. released the genomic data of V. carpophila, and designed SSR primers based on the genomic data (Chen et al., 2018). After screening, 32 pairs of SSR primers with polymorphisms were finally obtained. Genetic diversity analysis of 39 strains isolated from peach or nectarine using the above primers showed that the number of alleles identified ranged from 2 to 9, and the polymorphic information contents were from 0.097 to 0.792, indicating the substantial diversity of V. carpophila (Chen et al., 2018). Similarly, it was found that V. carpophila isolates in China were genetically diverse. The gene diversity of V. carpophila observed in this study is 0.07 to 0.18, which is similar to the results obtained in close fungal pathogen Fusicladium effusum (Nei’s measure of gene diversity = 0.083 to 0.160; Bock et al., 2014). The genetic diversity among V. carpophila isolates in China is higher than that observed in the United States (Chen et al., 2018), probably because our samples were from more geographic locations and different hosts, and also in our study, more isolates and primers were used.
Genetic diversity in host populations and geographic populations showed different levels. Genetic diversity levels among geographic populations directly correspond to the number of isolates and sampling range. For instance, the genetic diversity of the HuB population was the highest at 0.18, and the HuB population had the most isolates (37) and the widest sampling range (5 orchards that were more than 500 km apart). HeB population had the least number of isolates, only one sampling site, and showed the lowest genetic diversity at only 0.10. On the other hand, this study detected the highest genetic diversity within a small sample of 15 apricot isolates from the same orchard. Among three host populations collected from HZAU, the genetic diversity of the apricot population was higher than peach and mume populations. The sexual stage of V. carpophila was first reported in Australia on apricot trees in 1961. It was showed that V. carpophila had the ability of gene recombination (Fisher, 1961). According to our observation, the apricot leaf scab is the most common one among the three host scabs, and lesions on leaves are rare on peaches and plums. The infestation time is very long, and apricot leaf scab can be still observed until the leaf fall in autumn, which provides the basis for V. carpophila to produce sexual stage and genetic recombination. It might be the reason why the highest genetic diversity was observed within the apricot population.
In this study, AMOVA analysis of 14 geographic populations indicated that 13% of the observed genetic diversity was partitioned among geographic populations and 87% was within geographic populations. In addition, AMOVA analysis of three host populations indicated that 40% of the observed genetic diversity was partitioned among host populations and 60% was within host populations. This is similar to the results observed in a recent study (Bock et al., 2020). In four populations with more than 10 isolates, the AMOVA analysis indicated that most variance could be found within orchards for both original (83.10%) and clone corrected (87.98%) data sets (Bock et al., 2020). However, they did not conduct a population genetic study on isolates from different hosts. The genetic diversity was analyzed for V. carpophila isolates collected from peach and nectarine in the United States, although the sample size was smaller (n = 39 and 81), both studies revealed that the genetic diversity of V. carpophila isolates does not correspond to locations or host cultivars (Chen et al., 2018; Bock et al., 2020). Gene diversity is indicative that there is a transfer of genetic material among the populations infecting peach and nectarine. This may not be surprising as nectarine is considered a smooth-skinned peach (P. persica).
Population structure analysis revealed moderate host population differentiation (40%), which was identified when three host populations from HZAU were used. However, structure analysis of 14 geographic regions’ population revealed that V. carpophila were divided into three subgroups, and no significant differentiation was identified among geographic populations (13%). Analysis of the genetic structure of 81 peach isolates of V. carpophila from the eastern United States showed that V. carpophila population clustered in three distinct groups (Bock et al., 2020). In this study, the genetic structure analysis of V. carpophila isolates from peach (14 provinces) of China obtained similar results. Overall, these results suggested that there was a significant interflow of V. carpophila isolates among different geographic regions but not among different hosts, e.g., peach, mume, and apricot. Similarly, based on the DAPC analysis, isolates collected from 14 provinces did not cluster according to geographic regions, the discriminant analysis also demonstrated the overlap among isolates from different geographic regions, however, isolates from different hosts did cluster according to their hosts. The dendrogram construction based on Nei’s genetic distance using UPGMA for the isolates from 14 different geographic regions and three hosts also showed that isolates were grouped into three major clusters according to their hosts. The three host populations of V. carpophila showed significant differences in colony morphology, growth rate and spore production on the MEA medium. The cultures of V. carpophila from California almond trees and from peach trees in the southeastern United States showed similar results in which differences were observed for isolates from different hosts (Chen et al., 2014). This biological observation indicated that V. carpophila isolates from different hosts had significant differences, which were consistent with the results obtained by molecular analysis based on SSR markers. These differences might be caused by host specialization during the evolution of V. carpophila.
In brief, the genetic diversity and population structure of the V. carpophila have rarely been characterized. This is the first report of the genetic variation and population structure in V. carpophila isolates from China. We demonstrated that Chinese V. carpophila populations could be clustered into three distinct genetic groups, which correspond to the host boundaries, i.e., peach, mume, and apricot. Based on peach isolates from 14 provinces, it is obvious that V. carpophila isolates do not group according to the geographic regions. These results show that the host but not the environment play an important role during the evolution of V. carpophila. In other words, the genetic identity of V. carpophila isolates is dependent on the host, but not the geographic region. This research laid a solid foundation for a better understanding of the population biology and genetics of V. carpophila. The global geographic populations and more host populations of V. carpophila should be further explored in the future.
The datasets presented in this study can be found in online repositories. The names of the repository/repositories and accession number(s) can be found in the article/Supplementary material.
C-XL and YZ designed the study. YZ performed all the experiments. YZ, CC, Y-FW, and ML analyzed the data and drafted the manuscript. C-XL, YZ, FF, L-FY, and W-XY reviewed and edited the manuscript. All authors contributed to the article and approved the submitted version.
This work was supported by the China Agriculture Research System of the Ministry of Finance and the Ministry of Agriculture and Rural Affairs (No. CARS30-3-03), the Fundamental Research Funds for the Central Universities (No. 2662020ZKPY018), Central Public-interest Scientific Institution Basal Research Fund (No. 1610172022011), and the National Natural Science Foundation of China (No.32202389).
We thank Gengrui Zhu, Xianshan Gu, Haiyan Song, Caixia Xu, Lijuan Gao, Jianbo Zhao, and Hu Chen from Changli Fruit Research Institute, Tao Zhang (Beijing Academy of Agriculture and Forestry Sciences), Guokang Chen (Southwest University), and Xue Huang (Huazhong Agricultural University) for assisting the sample collection.
The authors declare that the research was conducted in the absence of any commercial or financial relationships that could be construed as a potential conflict of interest.
All claims expressed in this article are solely those of the authors and do not necessarily represent those of their affiliated organizations, or those of the publisher, the editors and the reviewers. Any product that may be evaluated in this article, or claim that may be made by its manufacturer, is not guaranteed or endorsed by the publisher.
The Supplementary material for this article can be found online at: https://www.frontiersin.org/articles/10.3389/fmicb.2022.985691/full#supplementary-material
Bailly, C. (2020). Anticancer properties of Prunus mume extracts (Chinese plum, Japanese apricot). J. Ethnopharmacol. 246:112215. doi: 10.1016/j.jep.2019.112215
Baroudy, F., Putman, A. I., Habib, W., Puri, K. D., Subbarao, K. V., and Nigro, F. (2019). Genetic diversity of Verticillium dahliae populations from olive and potato in Lebanon. Plant Dis. 103, 656–667. doi: 10.1094/PDIS-03-18-0420-RE
Bock, C. H., Thrall, P. H., and Burdon, J. J. (2005). Genetic structure of populations of Alternaria brassicicola suggests the occurrence of sexual recombination. Mycol. Res. 109, 227–236. doi: 10.1017/S0953756204001674
Bock, C. H., Wood, B. W., Stevenson, K. L., and Arias, R. S. (2014). Genetic diversity and population structure of Fusicladium effusum on pecan in the United States. Plant Dis. 98, 916–923. doi: 10.1094/PDIS-12-13-1229-RE
Bock, C., Young, C., Zhang, M., Chen, C., Brannen, P. M., Adaskaveg, J. E., et al. (2020). Mating type idiomorphs, heterothallism and high genetic diversity in Venturia carpophila, cause of peach scab. Phytopathology 111, 408–424. doi: 10.1094/PHYTO-12-19-0485-R
Bruvo, R., Michiels, N. K., D'Souza, T. G., and Schulenburg, H. (2004). A simple method for the calculation of microsatellite genotype distances irrespective of ploidy level. Mol. Ecol. 13, 2101–2106. doi: 10.1111/j.1365-294X.2004.02209.x
Chen, C., Bock, C. H., Brannen, P. M., and Adaskaveg, J. E. (2018). Mining and characterization of microsatellites from a genome of Venturia carpophila. Mycol. Prog. 17, 885–895. doi: 10.1007/s11557-018-1401-x
Chen, C., Bock, C. H., Brannen, P. M., Adaskaveg, J. E., Hotchkiss, M. W., Brewer, M. T., et al. (2014). Genetic variability among populations of Fusicladium species from different host trees and geographic locations in the USA. Mycol. Prog. 13, 1179–1190. doi: 10.1007/s11557-014-1006-y
Chen, C., Bock, C. H., and Wood, B. W. (2017). Draft genome sequence of Venturia carpophila, the causal agent of peach scab. Stand Genomic Sci. 12:68. doi: 10.1186/s40793-017-0280-0
Chen, S., Schnabel, G., Yuan, H., and Luo, C. (2019). LAMP detection of the genetic element 'Mona' associated with DMI resistance in Monilinia fructicola. Pest Manag. Sci. 75, 779–786. doi: 10.1002/ps.5178
Choi, E. D., Kim, G. H., Park, S.-Y., Hoon Song, J., Lee, Y. S., Jung, J. S., et al. (2019). Genetic diversity of the pear scab fungus Venturia nashicola in Korea. Mycobiology 47, 76–86. doi: 10.1080/12298093.2019.1572263
Chuda, Y., Ono, H., Ohnishi-Kameyama, M., Matsumoto, K., Nagata, T., and Kikuchi, Y. (1999). Mumefural, citric acid derivative improving blood fluidity from fruit-juice concentrate of Japanese apricot (Prunus mume Sieb. Et Zucc). J. Agric. Food Chem. 47, 828–831. doi: 10.1021/jf980960t
Dar, M., Ahmad, M., Shah, M. U. D., Bhat, N., Khan, A., and Padder, B. A. (2019). Phylogenetic relationship of Venturia carpophila, the causal agent of almond scab from Kashmir valley as inferred by ITS nr DNA. Int. J. of Curr. Microbiol. Appl. Sci. 8, 2913–2919. doi: 10.20546/ijcmas.2019.806.350
Earl, D. A., and vonHoldt, B. M. (2012). Structure harvester: a website and program for visualizing structure output and implementing the evanno method. Conserv. Genet. Resour. 4, 359–361. doi: 10.1007/s12686-011-9548-7
Ebrahimi, L., Fotuhifar, K.-B., Javan Nikkhah, M., Naghavi, M.-R., and Baisakh, N. (2016). Population genetic structure of apple scab (Venturia inaequalis (Cooke) G. winter) in Iran. PLoS One 11:e0160737. doi: 10.1371/journal.pone.0160737
Evanno, G., Regnaut, S., and Goudet, J. (2005). Detecting the number of clusters of individuals using the software structure: a simulation study. Mol. Ecol. 14, 2611–2620. doi: 10.1111/j.1365-294X.2005.02553.x
Falush, D., Stephens, M., and Pritchard, J. K. (2007). Inference of population structure using multilocus genotype data: dominant markers and null alleles. Mol. Ecol. Notes 7, 574–578. doi: 10.1111/j.1471-8286.2007.01758.x
Fan, J. Y., Guo, L. Y., Xu, J. P., Luo, Y., and Michailides, T. J. (2010). Genetic diversity of populations of Monilinia fructicola (fungi, ascomycota, helotiales) from China. J. Eukaryot. Microbiol. 57, 206–212. doi: 10.1111/j.1550-7408.2009.00467.x
Fisher, E. E. (1961). Venturia carpophila sp.nov., the ascigerous state of the apricot freckle fungus. Trans. Br. Mycol. Soc. 44, 337–IN4. doi: 10.1016/S0007-1536(61)80026-0
Gladieux, P., Zhang, X. G., Afoufa-Bastien, D., Valdebenito Sanhueza, R. M., Sbaghi, M., and Le Cam, B. (2008). On the origin and spread of the scab disease of apple: out of Central Asia. PLoS One 3:e1455. doi: 10.1371/journal.pone.0001455
González-Domínguez, E., Armengol, J., and Rossi, V. (2017). Biology and epidemiology of Venturia species affecting fruit crops: a review. Front. Plant Sci. 8:1496. doi: 10.3389/fpls.2017.01496
Guérin, F., Franck, P., Loiseau, A., Devaux, M., and Le Cam, B. (2004). Isolation of 21 new polymorphic microsatellite loci in the phytopathogenic fungus Venturia inaequalis. Mol. Ecol. Notes 4, 268–270. doi: 10.1111/j.1471-8286.2004.00637.x
He, R., Liu, P., Jia, B., Xue, S., Wang, X., Hu, J., et al. (2019). Genetic diversity of pseudomonas syringae pv. Actinidiae strains from different geographic regions in China. Phytopathology 109, 347–357. doi: 10.1094/PHYTO-06-18-0188-R
He, Z., Zhang, H., Gao, S., Lercher, M. J., Chen, W. H., and Hu, S. (2016). Evolview v2: an online visualization and management tool for customized and annotated phylogenetic trees. Nucleic Acids Res. 44, 236–241. doi: 10.1093/nar/gkw370
Jiménez-Díaz, R. M., Olivares-García, C., Landa, B. B., del Mar Jiménez-Gasco, M., and Navas-Cortés, J. A. (2011). Region-wide analysis of genetic diversity in Verticillium dahliae populations infecting olive in southern Spain and agricultural factors influencing the distribution and prevalence of vegetative compatibility groups and pathotypes. Phytopathology 101, 304–315. doi: 10.1094/PHYTO-07-10-0176
Jombart, T., Devillard, S., and Balloux, F. (2010). Discriminant analysis of principal components: a new method for the analysis of genetically structured populations. BMC Genet. 11:94. doi: 10.1186/1471-2156-11-94
Kim, G. H., Jo, K. Y., Shin, J. S., Shin, G. H., and Koh, Y. J. (2017). Epidemiological characteristics of scab of Japanese apricot in Korea. Plant Pathol. J. 33, 450–457. doi: 10.5423/PPJ.OA.03.2017.0044
Koh, H. S., Sohn, S. H., Lee, Y. S., Koh, Y. J., Song, J. H., and Jung, J. S. (2013). Specific and sensitive detection of Venturia nashicola, the scab fungus of Asian pears, by nested PCR. Plant Pathol. J. 29, 357–363. doi: 10.5423/PPJ.OA.06.2013.0055
Leroy, T., Lemaire, C., Dunemann, F., and Le, C. B. (2013). The genetic structure of a Venturia inaequalis population in a heterogeneous host population composed of different malus species. BMC Evol. Biol. 13:64. doi: 10.1186/1471-2148-13-64
Li, M., Zheng, P., Ni, B., Hu, X., Miao, X., and Zhao, Z. (2018). Genetic diversity analysis of apricot cultivars grown in China based on SSR markers. Eur. J. Hortic. 83, 18–27. doi: 10.17660/eJHS.2018/83.1.3
Padder, B. A., Sofi, T. A., Ahmad, M., Shah, M.-U.-D., Hamid, A., Saleem, S., et al. (2013). Virulence and molecular diversity of Venturia inaequalis in commercial apple growing regions in Kashmir. J. Phytopathol. 161, 271–279. doi: 10.1111/jph.12061
Peakall, R., and Smouse, P. E. (2006). Genalex 6: genetic analysis in excel. Population genetic software for teaching and research. Mol. Ecol. Notes 6, 288–295. doi: 10.1111/j.1471-8286.2005.01155.x
Poniatowska, A., Michalecka, M., and Puławska, J. (2016). Genetic diversity and pathogenicity of Monilinia polystroma the new pathogen of cherries. Plant Pathol. 65, 723–733. doi: 10.1111/ppa.12463
Scherm, H., Savelle, A. T., Boozer, R. T., and Foshee, W. G. (2008). Seasonal dynamics of conidial production potential of Fusicladium carpophilum on twig lesions in southeastern peach orchards. Plant Dis. 92, 47–50. doi: 10.1094/PDIS-92-1-0047
Schnabel, G., and Layne, D. R. (2004). Comparison of reduced-application and sulfur-based fungicide programs on scab intensity, fruit quality, and cost of disease control on peach. Plant Dis. 88, 162–166. doi: 10.1094/PDIS.2004.88.2.162
Shen, M., Zhang, J. Q., Zhao, L. L., Groenewald, J. Z., Crous, P. W., and Zhang, Y. (2020). Venturiales. Stud. Mycol. 96, 185–308. doi: 10.1016/j.simyco.2020.03.001
Singh, J., and Khan, A. (2019). Distinct patterns of natural selection determine sub-population structure in the fire blight pathogen, Erwinia amylovora. Sci. Rep. 9:14017. doi: 10.1038/s41598-019-50589-z
Sitther, V., Garrido Haro, P. A., Molineros, J. E., Garzon, C. D., and Jiménez-Gasco, M. M. (2018). Genetic diversity of apple-and crabapple-infecting isolates of Venturia inaequalis in Pennsylvania, the United States, determined by microsatellite markers. For. Path. 48:e12405. doi: 10.1111/efp.12405
Sun, X., Kang, S., Zhang, Y., Tan, X., Yu, Y., He, H., et al. (2013). Genetic diversity and population structure of rice pathogen Ustilaginoidea virens in China. PLoS One 8:e76879. doi: 10.1371/journal.pone.0076879
Tenzer, I., and Gessler, C. (1999). Genetic diversity of Venturia inaequalis across Europe. Eur. J. Plant Pathol. 105, 545–552. doi: 10.1023/A:1008775900736
Turan, C., Nanni, I. M., Brunelli, A., and Collina, M. (2015). New rapid DNA extraction method with Chelex from Venturia inaequalis spores. J. Microbiol. Methods 115, 139–143. doi: 10.1016/j.mimet.2015.06.005
Vilgalys, R., and Hester, M. (1990). Rapid genetic identification and mapping of enzymatically amplified ribosomal DNA from several Cryptococcus species. J. Bacteriol. 172, 4238–4246. doi: 10.1128/jb.172.8.4238-4246.1990
Villarino, M., Larena, I., Martinez, F., Melgarejo, P., and De Cal, A. (2012). Analysis of genetic diversity in Monilinia fructicola from the Ebro valley in Spain using ISSR and RAPD markers. Eur. J. Plant Pathol. 132, 511–524. doi: 10.1007/s10658-011-9895-y
White, T. J., Bruns, T., Lee, S., and Taylor, J. (1990). “Amplification and direct sequencing of fungal ribosomal RNA genes for phylogenetics” in PCR protocols, a guide to methods and applications. Eds. M. A. Innis, D. H. Gelfand, J. J. Sninsky, and T. J. White (San Diego: Academic), 315–322.
Yeh, F. C., Yahg, R., Boyle, T. J., Ye, Z., and Xiyan, J. M. (1999). POPGENE 32, Microsoft windows-based freeware for population genetic analysis, version 1.32, Molecular Biology and Biotechnology Centre. Edmonton, Canada: University of Alberta. http://www.ualberta.ca/~fyeh/popgene_download.html.
Yu, M., Yu, J., Li, H., Wang, Y., Yin, X., Bo, H., et al. (2016). Survey and analysis of simple sequence repeats in the Ustilaginoidea virens genome and the development of microsatellite markers. Gene 585, 28–34. doi: 10.1016/j.gene.2016.03.016
Zhou, Y., Fan, F., Chaisiri, C., Zhu, Y. T., Zhao, Y., Luo, M. K., et al. (2021a). Sensitivity of Venturia carpophila from China to five fungicides and characterization of carbendazim-resistant isolates. Plant Dis. 105, 3990–3997. doi: 10.1094/PDIS-04-21-0694-RE
Zhou, Y., Fan, F., Wang, L., Chaisiri, C., Yin, L. F., Yin, W. X., et al. (2020). Development of a loop-mediated isothermal amplification method for the rapid detection of Venturia carpophila on peach. Pest Manag. Sci. 77, 1383–1391. doi: 10.1002/ps.6154
Zhou, Y., Zhang, L., Fan, F., Wang, Z. Q., Huang, Y., Yin, L. F., et al. (2021b). Genome sequence of Venturia carpophila, the causal agent of peach scab. Mol. Plant Microbe 34, 852–856. doi: 10.1094/MPMI-11-20-0321-A
Keywords: peach, Venturia carpophila, genetic diversity, populations, specificity
Citation: Zhou Y, Chaisiri C, Luo M, Fan F, Wang Y-F, Yin L-F, Yin W-X and Luo C-X (2022) Genetic diversity of Venturia carpophila populations from different hosts and geographic regions in China. Front. Microbiol. 13:985691. doi: 10.3389/fmicb.2022.985691
Edited by:
Samantha Chandranath Karunarathna, Qujing Normal University, ChinaReviewed by:
Bilal A. Padder, Sher-e-Kashmir University of Agricultural Sciences and Technology, IndiaCopyright © 2022 Zhou, Chaisiri, Luo, Fan, Wang, Yin, Yin and Luo. This is an open-access article distributed under the terms of the Creative Commons Attribution License (CC BY). The use, distribution or reproduction in other forums is permitted, provided the original author(s) and the copyright owner(s) are credited and that the original publication in this journal is cited, in accordance with accepted academic practice. No use, distribution or reproduction is permitted which does not comply with these terms.
*Correspondence: Chao-Xi Luo, Y3hsdW9AbWFpbC5oemF1LmVkdS5jbg==
Disclaimer: All claims expressed in this article are solely those of the authors and do not necessarily represent those of their affiliated organizations, or those of the publisher, the editors and the reviewers. Any product that may be evaluated in this article or claim that may be made by its manufacturer is not guaranteed or endorsed by the publisher.
Research integrity at Frontiers
Learn more about the work of our research integrity team to safeguard the quality of each article we publish.