 Yaowen Chang†
 Xuhui Zhang
 Dongrong Chen
- Fudan University Pudong Medical Center, and Institute of Biomedical Sciences, Shanghai Medical College, Key Laboratory of Medical Epigenetics and Metabolism, Fudan University, Shanghai, China
Aminoglycosides are not only antibiotics but also have wider and diverse non-antibiotic cellular functions. To elucidate the understanding of non-antibiotic cellular functions, here we report transcriptome-profiling analysis of Escherichia coli in the absence or presence of 0.5 and 1 μM of Kanamycin B, concentrations that are neither lethal nor inhibit growth, and identified the differentially expressed genes (DEGs) at two given concentrations of Kanamycin B. Functional classification of the DEGs revealed that they were mainly related to microbial metabolism including two-component systems, biofilm formation, oxidative phosphorylation and nitrogen metabolism in diverse environments. We further showed that Kanamycin B and other aminoglycosides can induce reporter gene expression through the 5′ UTR of napF gene or narK gene (both identified as DEG) and Kanamycin B can directly bind to the RNA. The results provide new insights into a better understanding of the wider aminoglycosides cellular function in E. coli rather than its known antibiotics function.
Introduction
Aminoglycosides are antibiotics that are known to inhibit translation by binding to the A site of the ribosome during the translocation process (Davies and Davis, 1968; Fourmy et al., 1996; Carter et al., 2000), including Kanamycin B, Gentamicin, Amikacin, Tobramycin, Neomycin, and Streptomycin etc. Aminoglycosides are broad-spectrum antibiotics that are potent against various Gram-positive and Gram-negative organisms including members of the Enterobacteriaceae family such as Escherichia coli (E. coli) (Krause et al., 2016).
There have been reports on the response and effect of aminoglycosides in E. coli and in other bacteria. Biofilms are bacterial aggregates that resist antibiotic treatment. Subinhibitory concentrations of aminoglycosides were shown to regulate biofilm formation in E. coli and also in Pseudomonas aeruginosa (Hoffman et al., 2005; Khan et al., 2020). Gentamycin at sub-inhibitory concentrations can inhibit the swarming motility of E. coli (Zhuang et al., 2016). In E. coli, it is known that the uptake of aminoglycosides requires proton motive force generated by electron flow through the respiratory chain (Complexes I and II containing Fe-S clusters). Fe-S proteins play an important role in aminoglycoside killing through their effect on aminoglycoside uptake (Ezraty et al., 2013). In some organisms the aminoglycosides are linked to the bacterial SOS response. For example, aminoglycosides were found to induce SOS responses in Vibrio cholerae. However, in E. coli, aminoglycosides was shown not to induce SOS (Baharoglu and Mazel, 2011).
Genome-wide analysis of transcriptome profiling of E. coli and other bacteria upon treatment with specific aminoglycosides have been reported. Upon treatment with subinhibitory dose of gentamicin (1/2 MIC) that aims to find genes that may be involved in the development of adaptive resistance, transcriptome data of E. coli has revealed that genes associated with membrane protein and transporter were highly regulated. The transcriptome data identified yhjX (a putative transporter) as most upregulated gene and it regulates the cell growth of E. coli at subinhibitory dose of gentamicin and associate with the adaptive resistance to gentamicin (Zhou et al., 2019). Transcriptome profiling of Pseudomonas aeruginosa upon treatment with Tobramycin revealed expression changes in genes involved in a wider cellular function such as amino acid catabolism, tricarboxylic acid cycle (TCA) or bacterial motility and attachment etc. (Cianciulli Sesso et al., 2021). RNA-Seq analysis of Pseudomonas aeruginosa swarming cells at subinhibitory concentrations of tobramycin identified expression changes in gene encoding multidrug efflux pump and virulence factors (Coleman et al., 2020). In addition, transcriptional profiling changes in Mycobacterium tuberculosis in response to Kanamycin have been observed (Habib et al., 2017).
The use of aminoglycosides in the clinic has led to the development of resistance. Aminoglycoside resistance occurs commonly through modification of the aminoglycosides, methylation of their target rRNA or overexpression of efflux pumps (Nikaido, 2009). Modification of the aminoglycosides is achieved by aminoglycoside acetyltransferases (AAC) for acetylation, aminoglycoside adenyltransferase (AAD) for adenylylation, or phosphotransferases for phosphorylation (Mingeot-Leclercq et al., 1999). Aminoglycoside resistance is known to be inducible (Lovett and Rogers, 1996). One mechanism of induction of aminoglycosides resistance has been identified. The aminoglycosides can bind to riboswitch RNA in Pseudomonas fluorescens to regulate translation of AAC or AAD expression (He et al., 2013; Jia et al., 2013; Chen and Murchie, 2014; Wang et al., 2019; Zhang et al., 2020). The aminoglycoside sensing riboswitch is located at the 5′ untranslated region of AAC or AAD. Reporter assays in E. coli showed that aminoglycosides specifically induce expression of a reporter gene through the riboswitch RNA (Jia et al., 2013). Direct binding of aminoglycosides and the riboswitch RNA was measured. Chemical probing showed that aminoglycoside binding to the riboswitch RNA induces a structural change in Shine-Delgarno sequence (bacterial ribosomal binding site) that in turn regulate the translation of AAC or AAD.
These evidences indicate that the aminoglycoside has wider and diverse cellular functions as well as act as antibiotics. Here we have carried out transcriptome analysis by RNA-sequencing (RNA-seq) to investigate the genome-wide effect of Kanamycin B on E. coli, focusing on founding non-antibiotic cellular functions and kanamycin binding RNA. We identified the differentially expressed genes (DEGs) that are mainly related to microbial metabolism in diverse environments, two-component systems, nitrogen metabolism upon Kanamycin B treatment. We further showed that Kanamycin B could bind to 5′ UTR of the DEG and induce reporter gene expression. The results provide an insight into a better understanding of the wider aminoglycosides function in E. coli.
Materials and methods
Bacterial strains and growth condition
The strain used in this study was E. coli K-12 derived JM109 strain (Sangong, China). A single colony of JM109 was inoculated in 5 ml of rich medium LB and cultured overnight at 37°C under the condition of shaking speed at 200 rpm. The overnight bacterial culture was diluted 1: 1000 in fresh LB at 0, 0.5, 1, and 2 μM Kanamycin B. OD600 was measured using a SpectraMax® M5 every 1 h for 12 h. Each experiment was replicated three times.
RNA extraction and library preparation for transcriptome sequencing
E. coli JM09 was cultured with 0, 0.5, and 1 μM Kanamycin B for 7 h to an OD600 ≈ 0.6. Total RNA of harvested cells was extracted using Trizol (Invitrogen, United States). Total RNA of each sample was quantified and qualified by Agilent 2100 Bioanalyzer (Agilent Technologies, Palo Alto, CA, United States), NanoDrop (Thermo Fisher Scientific Inc.), and 1% agarose gel. The NEBNext Ultra II Directional RNA Library Prep Kit was used for the preparation of the library. The library preparations were performed following the manufacturer’s protocol. Three biological replicates of each library were sequenced on an Illumina HiSeq X Ten (Illumina, San Diego, CA, United States) with 150-bp paired-ends by AZENTA (Suzhou, China). RNA-seq data were uploaded to the Sequence Read Archive of the National Center for Biotechnology Information (accession number: PRJNA756617).
Sequence reads mapping and assembly
The raw reads of fastq format were initially filtered by removing reads containing adaptors, poly-N and low-quality reads. The high-quality clean reads were obtained (reads contain 20% base quality lower than Q20). Q20, Q30, GC-content and sequence duplication level of the clean data were calculated. The analyses were performed by using high quality clean reads. The clean reads were subsequently mapped to the E. coli str. K-12 substr. MG1655, genome assembly (NCBI: NC_000913.3) by using bowtie2 v2.2.6.
Principal component analysis
Principal Component Analysis (PCA) was performed to investigate the reproducibility of the biological repeats. DESeq2 in the deseq2_qc.r script was used for PCA calculation. The scores of the first and second principal components were plotted into two-dimensional space to represent the spatial relationships within the repeat samples for visualization (Long et al., 2020).
Differential expression analysis and functional annotations of DEGs
The expression levels of genes were counted by using HTseq in each sample (Anders et al., 2015). The DEGs are filtered to meet the threshold level with a |fold change| ≥ 2, and false discovery rate value of p < 0.05 in each pairwise comparison by using edgeR (Robinson et al., 2010). Functional annotations of DEGs are performed by R package, ClusterProfiler (Yu et al., 2012) with the Kyoto Encyclopedia of Genes and Genomes (KEGG) database. KEGG pathways with p < 0.05 were considered as significantly enriched.
Hierarchical clustering analysis
Hierarchical clustering analysis of DEGs was carried out by using the function heatmap. Two of gplots (version 3.0.1) in R version 3.3.1. The heatmaps are the outcome of this analysis to represent the reproducibility of the biological repeats (Khan et al., 2019).
Series-cluster analysis and functional annotation of the clusters
Short Time-series Expression Miner, version 1.3.13 (STEM) as a non-parametric clustering algorithm is designed to analyze short timeseries or concentration series expression data (Ernst and Bar-Joseph, 2006). STEM is a new clustering method that can identify real patterns from patterns. It clusters genes based on a series of pre-defined patterns (expression profiles). A profile is considered meaningful if the number of genes assigned to it surpasses the number of genes that are estimated to occur by chance with p < 0.05. The functional annotations of the clusters were analyzed by Gene ontology (GO) that is imbedded in the STEM. GO enrichment analysis is considered significant if the value of p < 0.05.
Validation of DEGs by real-time quantitative PCR
The 9 RNA samples for transcriptome sequencing were also used to perform real-time quantitative PCR (RT-qPCR) to assess the reliability of the sequencing data. RNA were reverse transcribed to cDNA using by PrimeScript™ RT reagent Kit (Takara, Japan) by reverse transcription. Obtained cDNAs were further used for RT-qPCR. The RT-qPCR reactions were carried out on a 7,500 Real-Time PCR System (Applied Biosystems) using the TB Green® Premix Ex Taq™ II (Takara, Japan) according to the manufacturer’s instructions. For absolute quantification of DEGs copy number, a gene-specific PCR of known concentration was prepared as a standard. The primers were obtained from AZENTA (Suzhou, China; Supplementary Table S1). Melting curve analysis was utilized to verify specificity of all PCR products. Error bars are the standard deviation of three independent experiments.
Reporter plasmid construction
The DNA sequences corresponding to the 5′ UTR of napF or narK were cloned into the reporter vector pGEX-leaderRNA-aac/aadlacZα as described before (Jia et al., 2013) to generate reporter plasmid pGEX-napF 5′ UTR-lacZα or pGEX-narK 5′ UTR-lacZα. The JM109 competent cells are placed on ice for 30 min. 1 μl of pGEX-napF 5′ UTR-lacZα plasmid was added to 50 μl of competent cells for transformation. The mixture was incubated on ice for 30 min. The cells were heat-shocked at 42°C in a heating block for 90 s followed by cooling down on ice for 2 min. Transfer the transformed competent cells onto LB plates containing Ampicillin (100 μg/ml). Spread with aseptic spreader uniformly until it gets resistant to move. Invert the plates and incubate at 37°C overnight and transformed colonies should appear in 12–16 h.
The reporter assays: Agar diffusion and β-galactosidase assays
Five milliliters culture of JM109 cells transformed with the pGEX-napF 5′ UTR-lacZα reporter plasmid was incubated overnight in LB broth containing 100 μg/ml Ampicillin. The culture was diluted 1: 100 in fresh LB broth containing Ampicillin (100 μg/ml) and IPTG (0.5 mM) and incubated for 2 h. A total of 1 ml of cultured cells (an OD600 ≈ 0.3) was then mixed well with 10 ml of 0.6% LB agar at 45°C. After mixing of components, the cells was poured on a 1.5% LB agar plate containing 100 μg/ml Ampicillin, 0.5 mM IPTG, and 200 μg/ml X-Gal. For the control sample IPTG was not added in the culture or on the agar plate. After the agar had solidified, discs of filter paper spotted with 2 μl different antibiotics stock solutions were placed onto agar plates and incubated at 37°C for at least 18 h (Bailey et al., 2008). Stock solutions included Kanamycin B (10 mM), Sisomycin (10 mM), Neamine (150 mM), Amikacin (10 mM), Gentamycin (10 mM), Tobramycin (10 mM), Ribostamycin (10 mM), Paromomycin (10 mM), Levofloxacin (5 mM), Tetracycline (10 mM), Erythromycin (100 mM), Trimethoprim (5 mM). β-Galactosidase assays were performed as previously described (Zhang and Bremer, 1995). Error bars are the standard deviation of three independent experiments.
MicroScale thermophoresis
The 5′ UTR of napF RNAs were prepared by in vitro transcription using T7 RNA polymerase. After PAGE purification, RNA was labeled with fluorescein-5-thiosemicarbazide as previously described (Wu et al., 1996). The fluorescein-RNA was annealed separately with 40 mM HEPES (pH 7.4), 100 mM KCl, the mixture was heated at 95°C for 3 min followed by subsequently placed on ice for 3 min. MgCl2 was added to a final concentration of 2.5 mM. Series of aminoglycosides were prepared with a final concentration from 125 nM to 128 μM. After incubation at 25°C for 20 min. The samples were added to premium coated capillaries (NanoTemper Technologies, GmbH, Munich, Germany) and subsequently subjected to MST analysis (20% MST power, 30% LED power) on a Monolith NT.115 pico instrument at 25°C. And data analysis was performed by MO. Affinity Analysis software (Entzian and Schubert, 2016; Moon et al., 2018). Error bars are the standard deviation of three independent experiments. The signal-to-noise ratio reflects the quality of the binding data and a ratio more than 12 reflects an excellent assay.
Results
Overview of the RNA-seq data
To investigate the effect of Kanamycin B on E. coli JM109, we performed transcriptome-profiling analysis by RNA-seq in the absence or presence of Kanamycin B. Since Kanamycin B is a bactericidal antibiotic, initial cultures in the absence or presence of a broad range of Kanamycin B were cultivated to select concentrations that are neither lethal nor inhibit growth (Figure 1A). 0.5 or 1 μM of Kanamycin B showed minimal effects on cell growth, while 2 μM of Kanamycin B clearly inhibited growth. As a result, 0.5 and 1 μM of Kanamycin B were chosen for transcriptome profiling analysis. Total RNA was extracted from cells at mid-log phase that had been treated with 0, 0.5, and 1 μM of Kanamycin B for RNA-seq analysis. The transcriptome-profiling data was uploaded to the National Center for Biotechnology Information Sequence Read Archive (accession number PRJNA756617). With three biological repeats of each sample, a total of 9 cDNA libraries were constructed containing 340.20 million raw reads; 339.64 million clean reads (accounting for 99.83% of raw reads) were recorded after removing adapter sequences and reads of low quality and those with more than 5% N bases. The average number of clean reads per sample was about 37.74 million and the clean Q20 (sequencing error rate < 1%) base rate was >97.86% for each sample. Ultimately, 336.74 million high-quality reads (accounting for 99.14% of clean reads) were mapped to the E. coli str. K-12 substr. MG1655 genome.
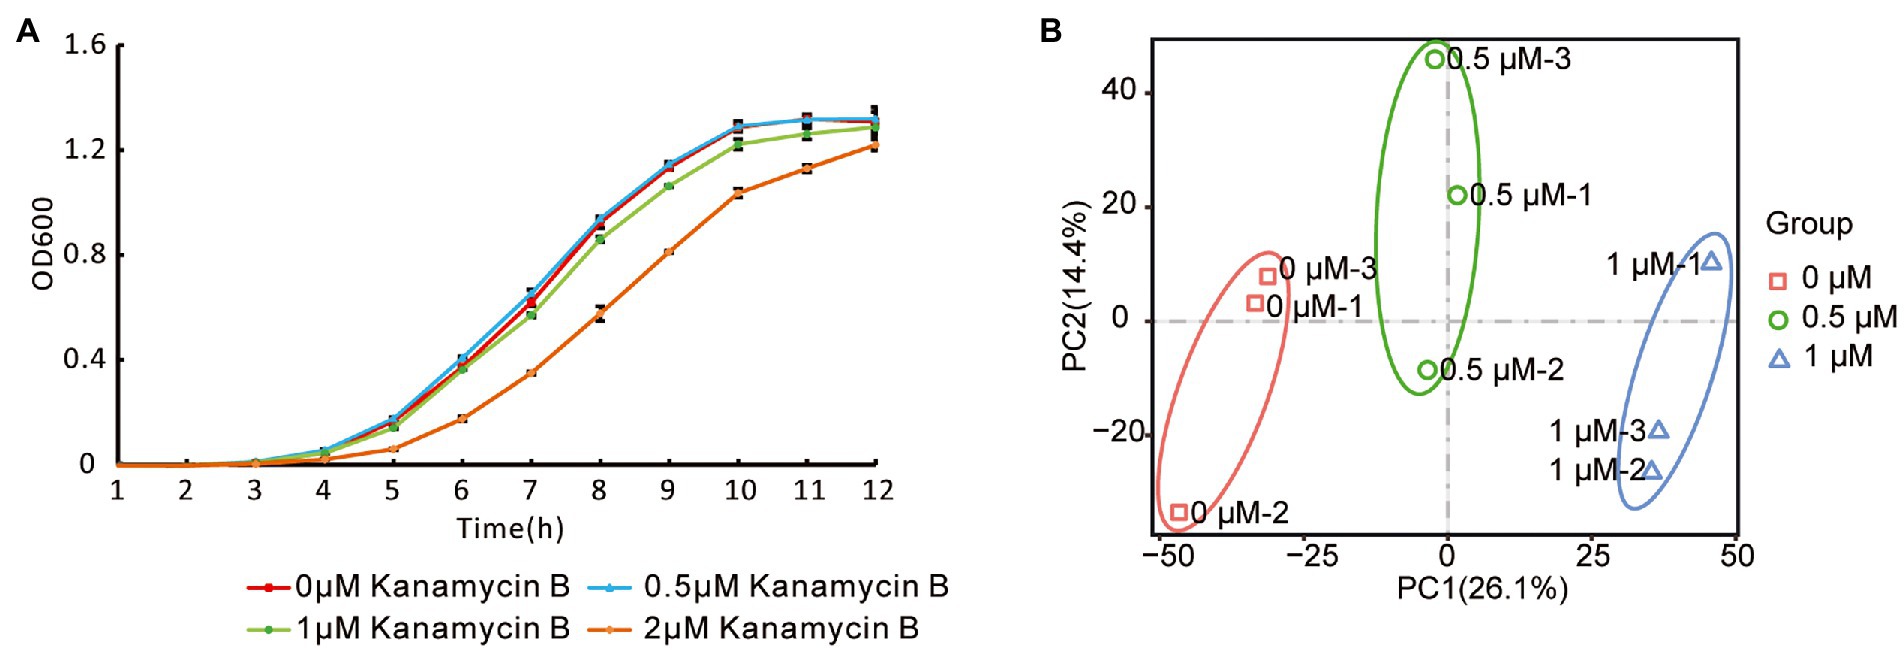
Figure 1. Escherichia coli growth curve and reproducibility of RNA-seq data. (A) Growth curve of JM109 treated with or without Kanamycin B. JM109 cells was grown in the presence of 0, 0.5, 1, and 2 μM Kanamycin B. Cell density was measured hourly. Error bars are the standard deviation of three independent experiments. (B) Principal component analysis of the RNA-Seq data. The small icon represents the original samples, colors are used to differentiate between treatments: red (0 μM), green (0.5 μM), and blue (1 μM).
To investigate their reproducibility, the biological repeats were analyzed by PCA. The results revealed that PC1 and PC2 had values of 26.1% and 14.4%, respectively, and accounted for 40.5% of the principal components (Figure 1B). PCA showed consistency between the three replicates at each Kanamycin B concentration; samples from the biological repeat clustered together, reflecting minimal differences between them. PCA suggested that the three biological repeats in this study were reasonably reproducible (Figure 1B).
Gene expression profile in response to Kanamycin B treatment
The cellular response to Kanamycin B was revealed by the changes in the levels of gene expression. The DEGs in response to treatment by Kanamycin B were identified by selecting gene expression levels with |fold changes| ≥ 2 and significant differences in p-values of <0.05 at 0.5 or 1 μM. Figure 2A shows a cluster analysis of the DEGs (for a full list of DEGs; see Supplementary Table S2). There are two main clusters: one with genes that were induced and one with genes that were repressed in response to Kanamycin B treatment. We identified 83 or 136 induced DEGs and 112 or 155 repressed DEGs upon treatment with 0.5 or 1 μM of Kanamycin B, respectively, compared to no treatment (Figure 2B). There are 65 upregulated and 58 downregulated DEGs in the 1/0.5 μM (comparisons between sample treated with 1 and 0.5 μM Kanamycin B) group (Figure 2B). Fewer numbers of DEGs were observed in the 1/0.5 μM group compared to the 0.5/0 μM and 1/0 μM (comparisons between sample treated with 0.5 or 1 μM Kanamycin B and the control) groups suggesting that 0.5 or 1 μM Kanamycin B causes similar cellular responses. We next compared the similarities and differences of the DEGs in response to 0.5 or 1 μM Kanamycin B treatment. The numbers of overlapping genes between the groups (0.5/0 μM, 1/0 μM, and 1/0.5 μM) are shown in the Venn diagram for upregulated or downregulated DEGs (Figures 2C,D) and overlapping groups listed (Supplementary Table S3). There is considerable overlap between 0.5/0 μM and 1/0 μM DEG groups; 30 genes and 57 genes were co-induced or co-repress in 0.5 and 1 μM of Kanamycin B treatment. All of the DEGs represent 8.8% of the whole genome transcripts. In addition, the results show that the magnitude of the transcriptional responses in DEGs varied significantly from gene to gene. For example, some genes are upregulated over 10-fold upon Kanamycin B treatment while the expression of many other genes are induced only by about 2-fold (Table 1; Supplementary Table S2).
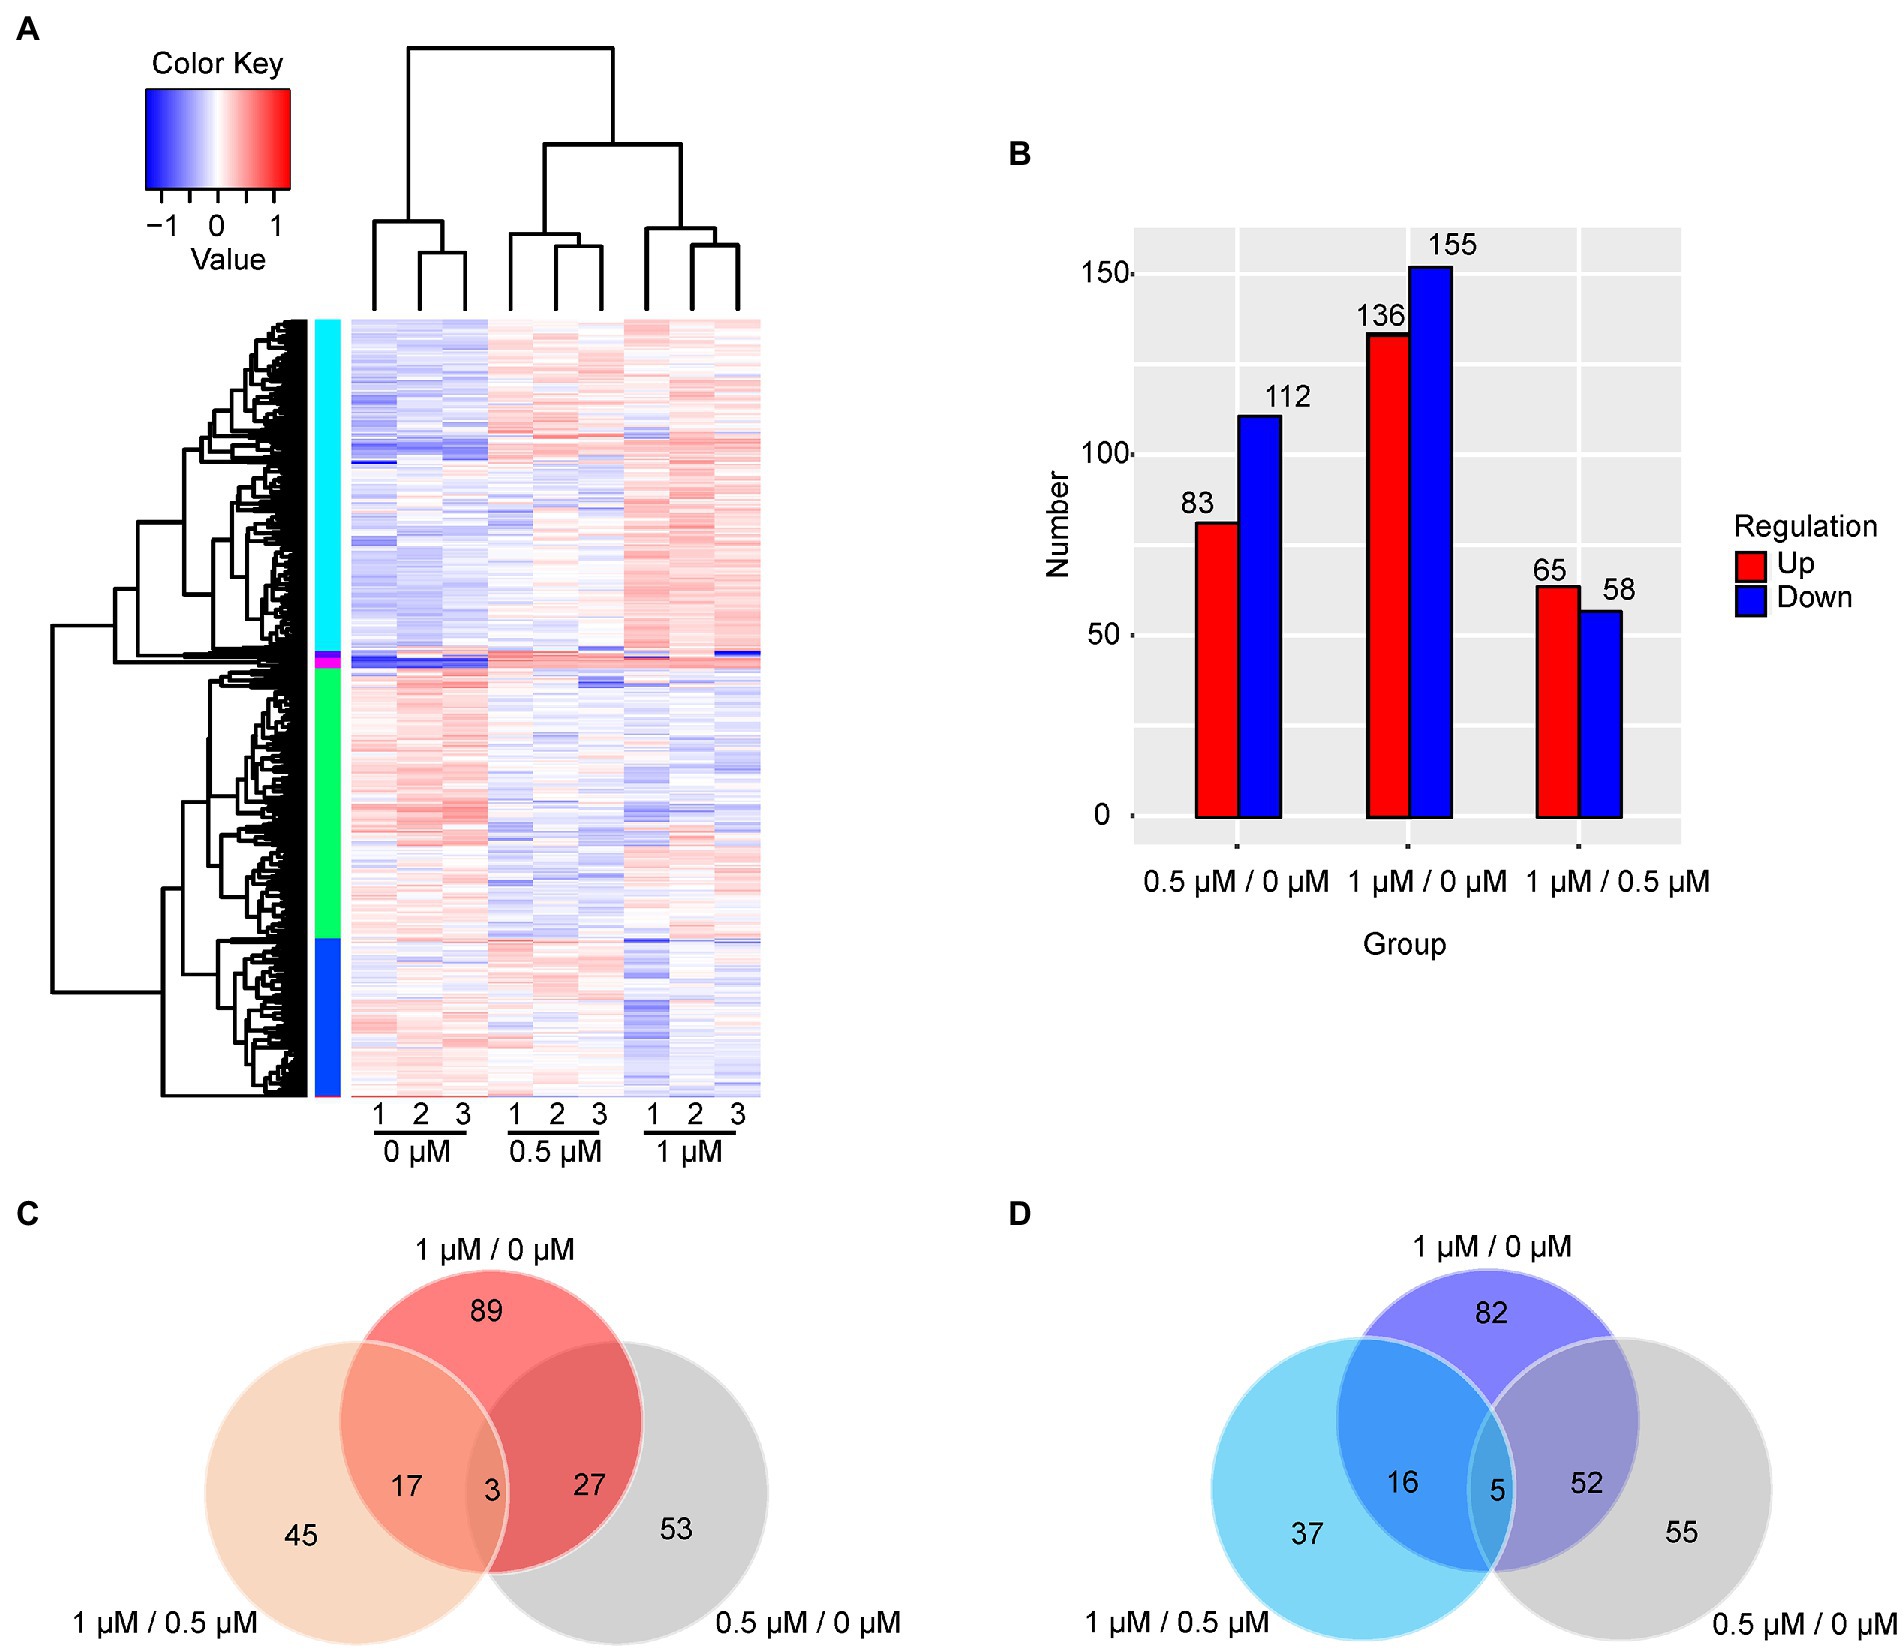
Figure 2. Analysis of DEGs. (A) The hierarchical cluster analysis of 463 DEGs. Rows represent gene expression levels and columns represent concentration of Kanamycin B, treatment and repeats. The relative quantitative changes within the row are shown in color: red suggests a relative higher expression whereas blue suggests a relative lower expression level. (B) The number of DEGs in the comparison groups is presented in histogram. Upregulated DEGs (red), and downregulated DEGs (blue) were presented by histogram. (C) The Venn diagram displays the number of the shared and unique genes of upregulated DEGs. (D) The Venn diagram displays the number of the shared and unique genes of downregulated DEGs.
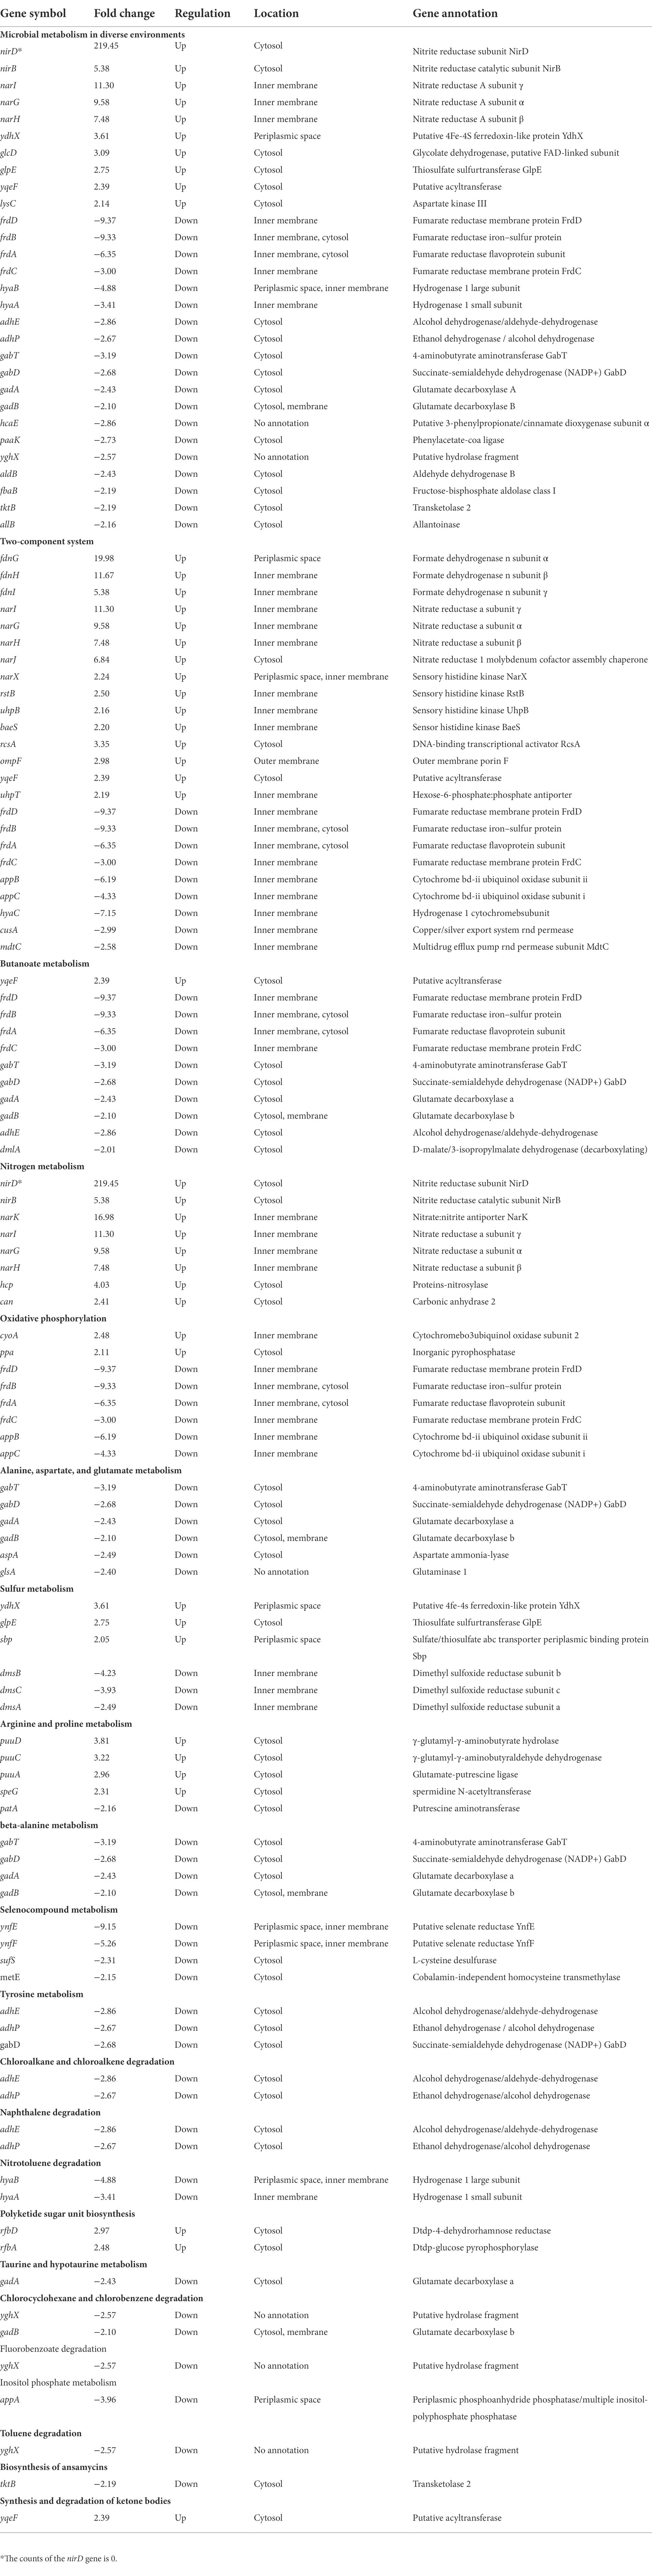
Table 1. Functional classification of DEGs (1/0 μM).
Functional classification of DEGs
To investigate the function of the DEGs, we carried out a KEGG pathway analysis of DEGs. Table 1 (1/0 μM), Supplementary Table S4 (0.5/0 μM), and Figure 3 show the DEGs classified into known or predicted functional groups. These genes encode proteins involved in the following cellular functions: microbial metabolism in diverse environments, two-component systems, nitrogen metabolism, butanoate metabolism, arginine and proline metabolism and inositol phosphate metabolism. Genes that encode proteins that participate in cellular degradation, including chloroalkane and chloroalkene degradation, naphthalene degradation, chlorocyclohexane and chlorobenzene degradation, fluorobenzoate degradation, toluene degradation and degradation of aromatic compounds. Genes that encode proteins involved in oxidative phosphorylation, aminoacyl-tRNA biosynthesis or the TCA cycle. KEGG pathway analysis of DEGs showed that many genes are classified in more than one functional group (Table 1). Further analysis of the genes that belong to the five relatively large functional classes (two-component systems, oxidative phosphorylation, nitrogen metabolism, microbial metabolism in diverse environments and butanoate metabolism) revealed the linkage network of these DEGs (Figure 4; Table 1), suggesting an overlap between these main functional classes through these DEGs.
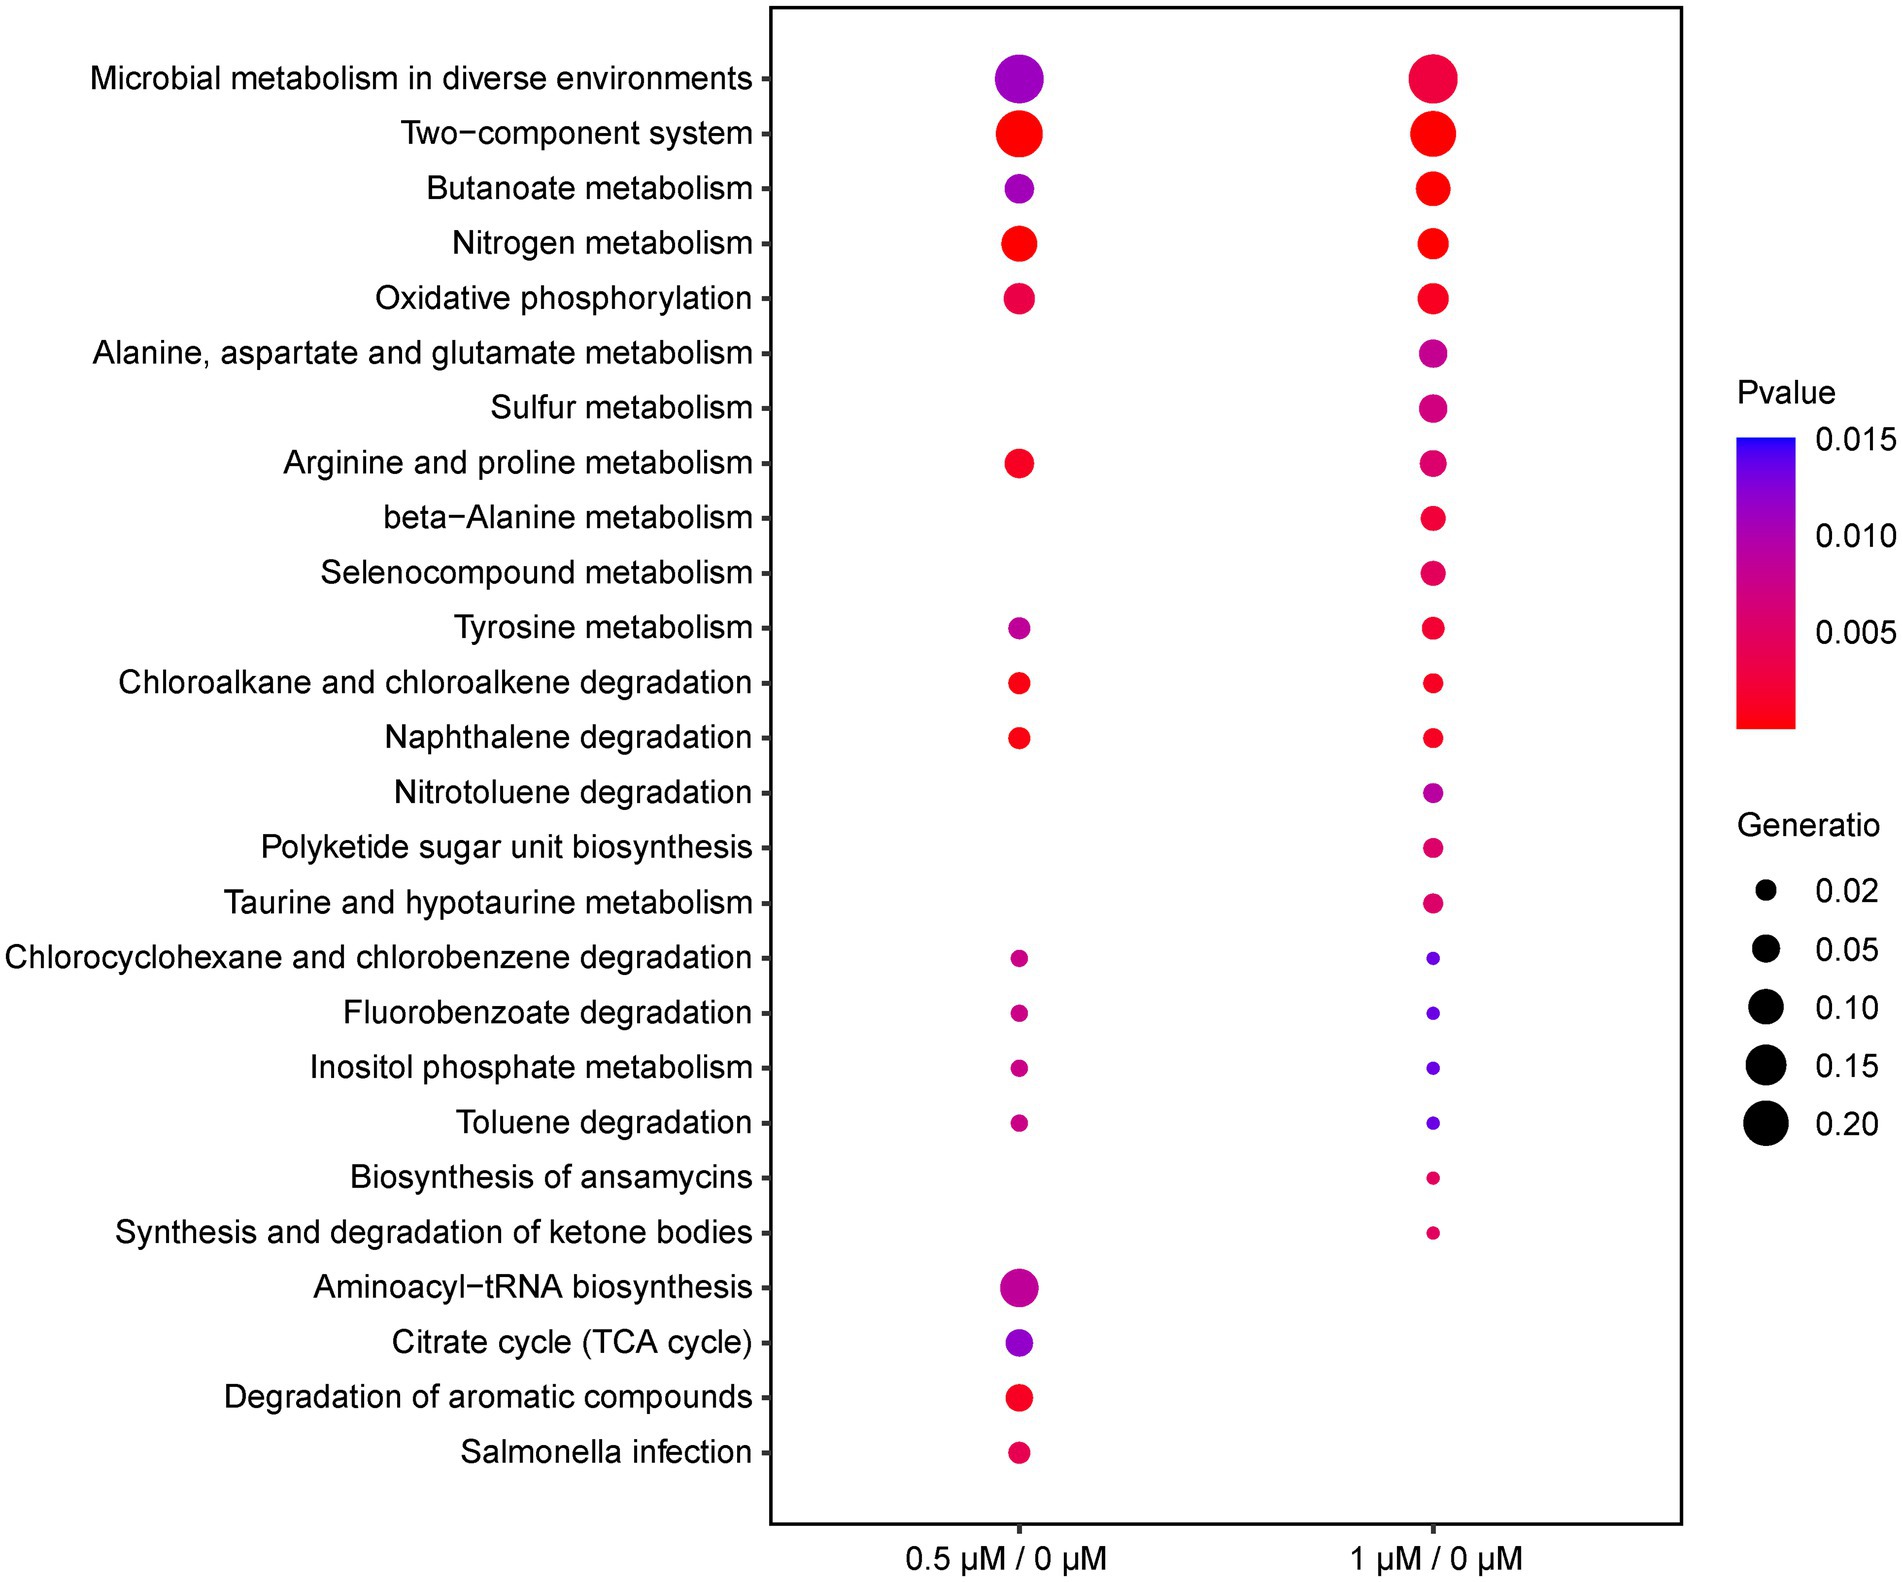
Figure 3. Functional classification of DEGs (0.5/0 μM and 1/0 μM) by KEGG enrichment analysis under the cutoff of p-value < 0.05. The ordinate represents the name of the pathway; the diameter of the dots implies the gene ratio, ranging from 0.02 to 0.20 (smallest to biggest dot); the color of the plot corresponds to p-value.
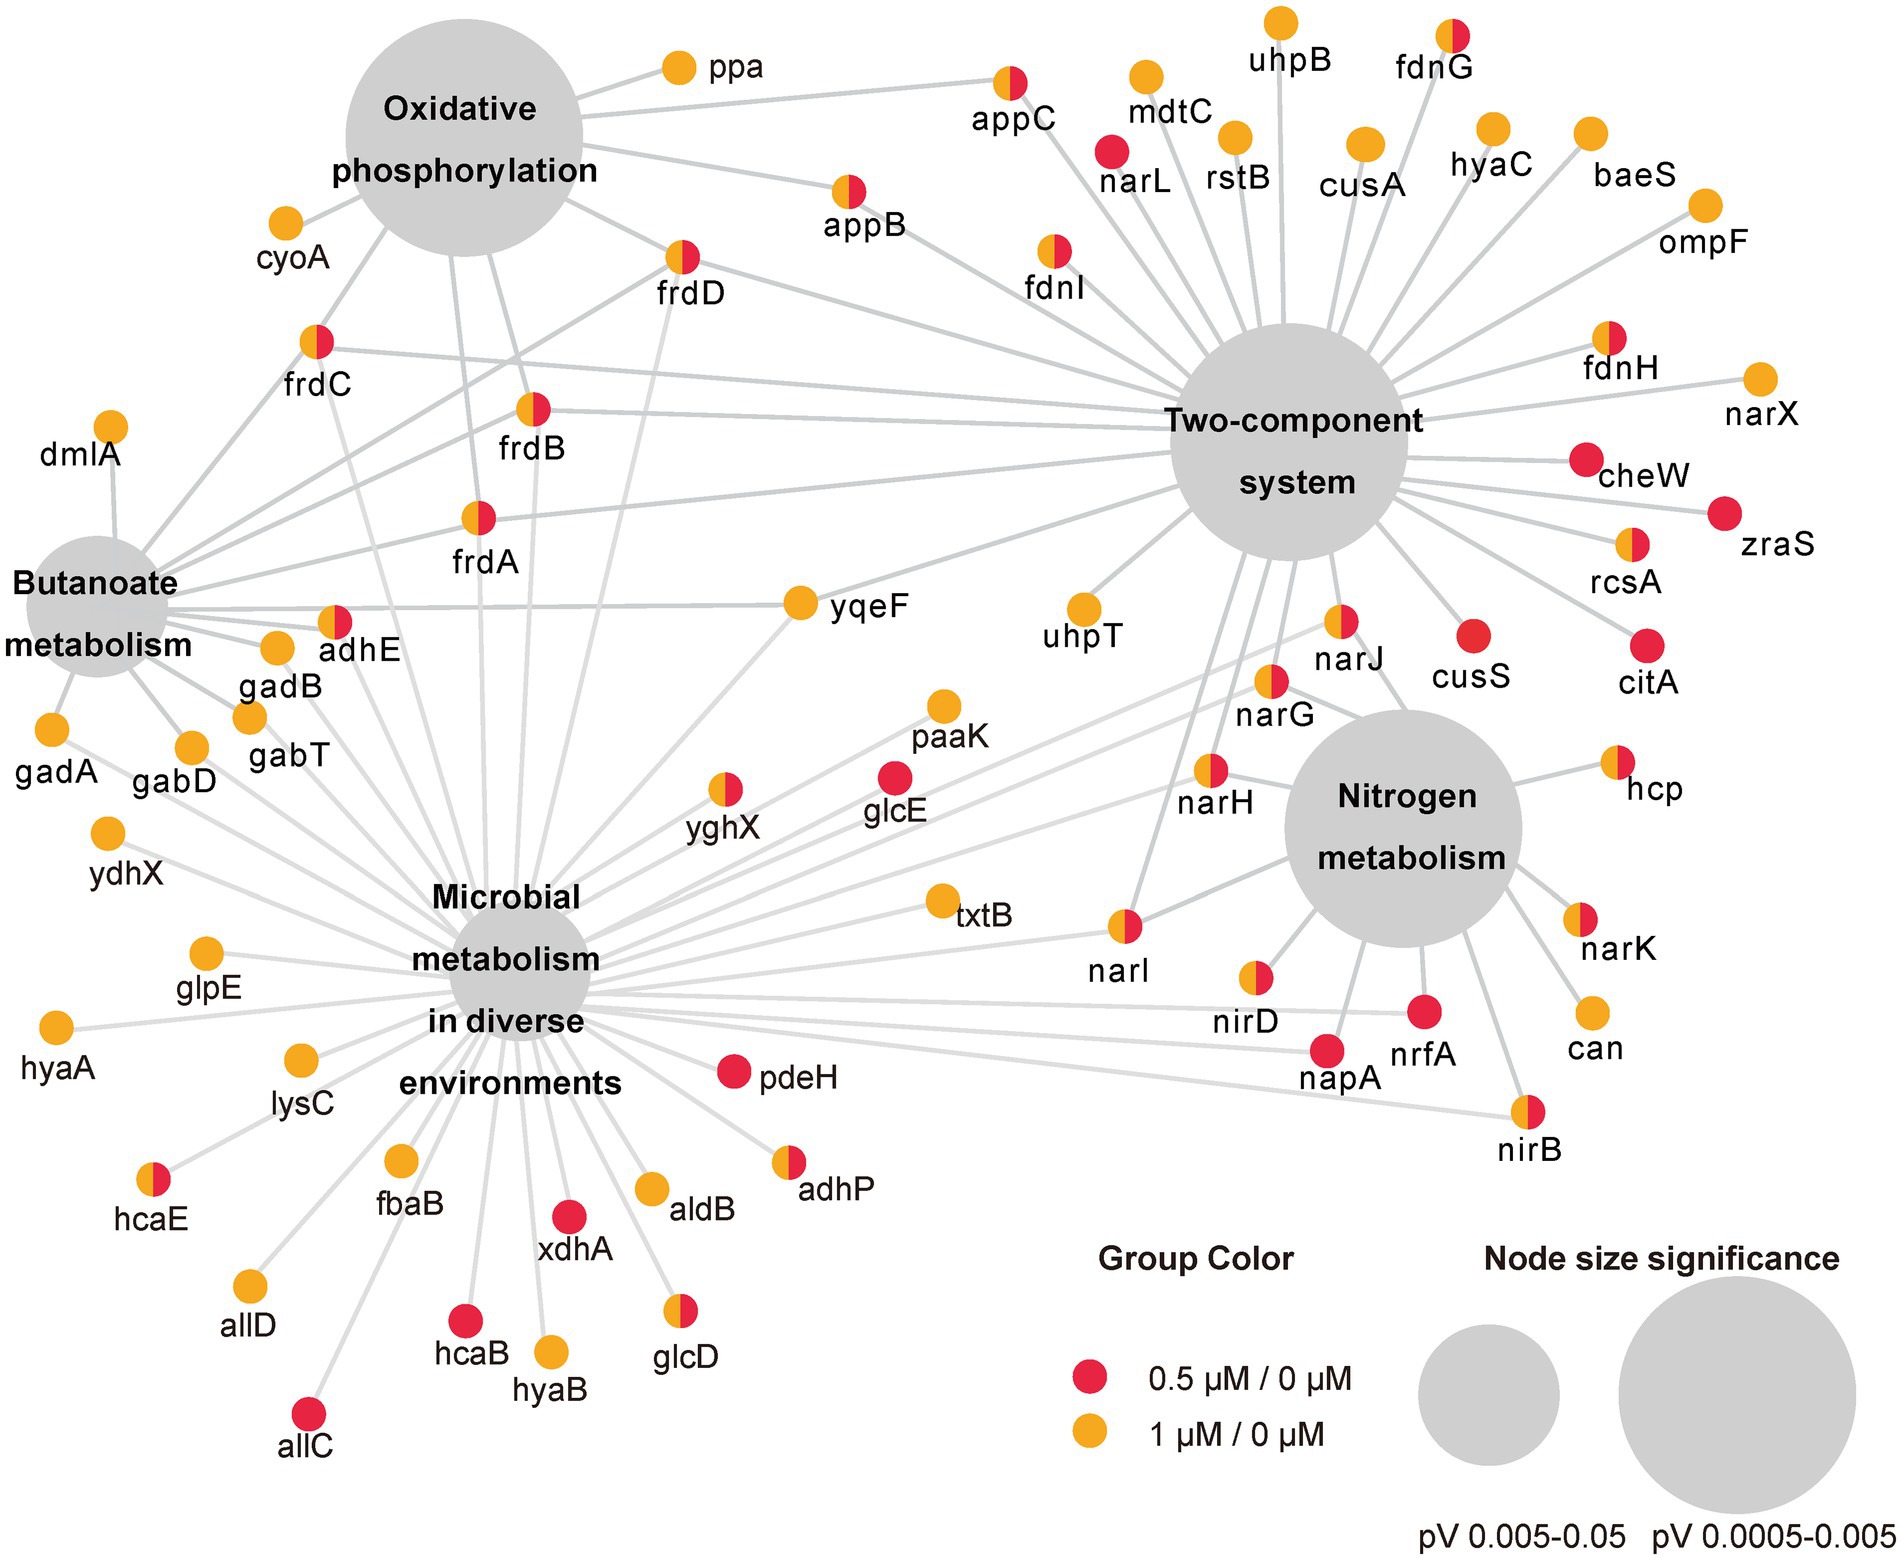
Figure 4. Network representation of the five main enriched KEGG pathways under the cutoff of p-value < 0.05 and their associated DEGs in two comparisons (0.5/0 μM and 1/0 μM). Small circles represent genes involved whereas colors represent DEGs in different comparison. The large gray circles are the KEGG pathway, and the size of the circles reflect the value of p.
Series-cluster analysis and functional annotation of the clusters
In addition to the DEGs analysis of the cellular response to Kanamycin B, we observed diverse and complex gene expression patterns over the Kanamycin B concentration courses. To dissect the gene expression patterns and further understand the gene functions, we performed a series-cluster analysis and functional annotation of the clusters. The series-cluster analysis can group genes that have similar expression patterns to form clusters of profiles and GO enrichment analysis further reveals functional annotations. A total of 4,534 genes were partitioned into 16 profiles of which 5 profiles were statistically significant (p < 0.05; Figure 5; Supplementary Table S5). STEM calculated the five profiles into two clusters. Each gene cluster exhibited a distinctive expression pattern. Cluster 1 includes profile 11 (115 genes), 12 (98 genes), 13 (107 genes), and 15 (116 genes). Genes in profile 11 show that expression levels increase rapidly after 0.5 μM Kanamycin B treatment and reach a plateau with 1 μM Kanamycin B, while the genes in profile 12, 13, and 15 present a gradual upregulation pattern. Cluster 2 consists of only profile 8 with 86 genes that exhibit similar expression from 0 to 0.5 μM Kanamycin B treatment and an increase in transcription with 1 μM Kanamycin B. STEM also supports GO enrichment analysis for each cluster and profile and includes functional classification of genes in the profiles in Figure 5 (Supplementary Table S6). Profile 11 includes 115 genes of which 18 GO terms are associated with nitrogen compound metabolism and oxidation–reduction processes. The profile 12 cluster contains a number of membrane genes, and the bacterial outer membrane contributes to drug efflux resistance mechanisms. The profile 13 includes 107 genes enriched in 68 GO terms that are linked to DNA binding and the regulation of RNA biosynthesis. Profile 15 has 116 genes enriched in 10 GO Terms of which 8 are related to biofilm formation and cell adhesion. Profile 8 in cluster 2 is associated with genes involved in RNA biosynthetic processes, regulation of primary metabolic process and cellular biosynthetic process.
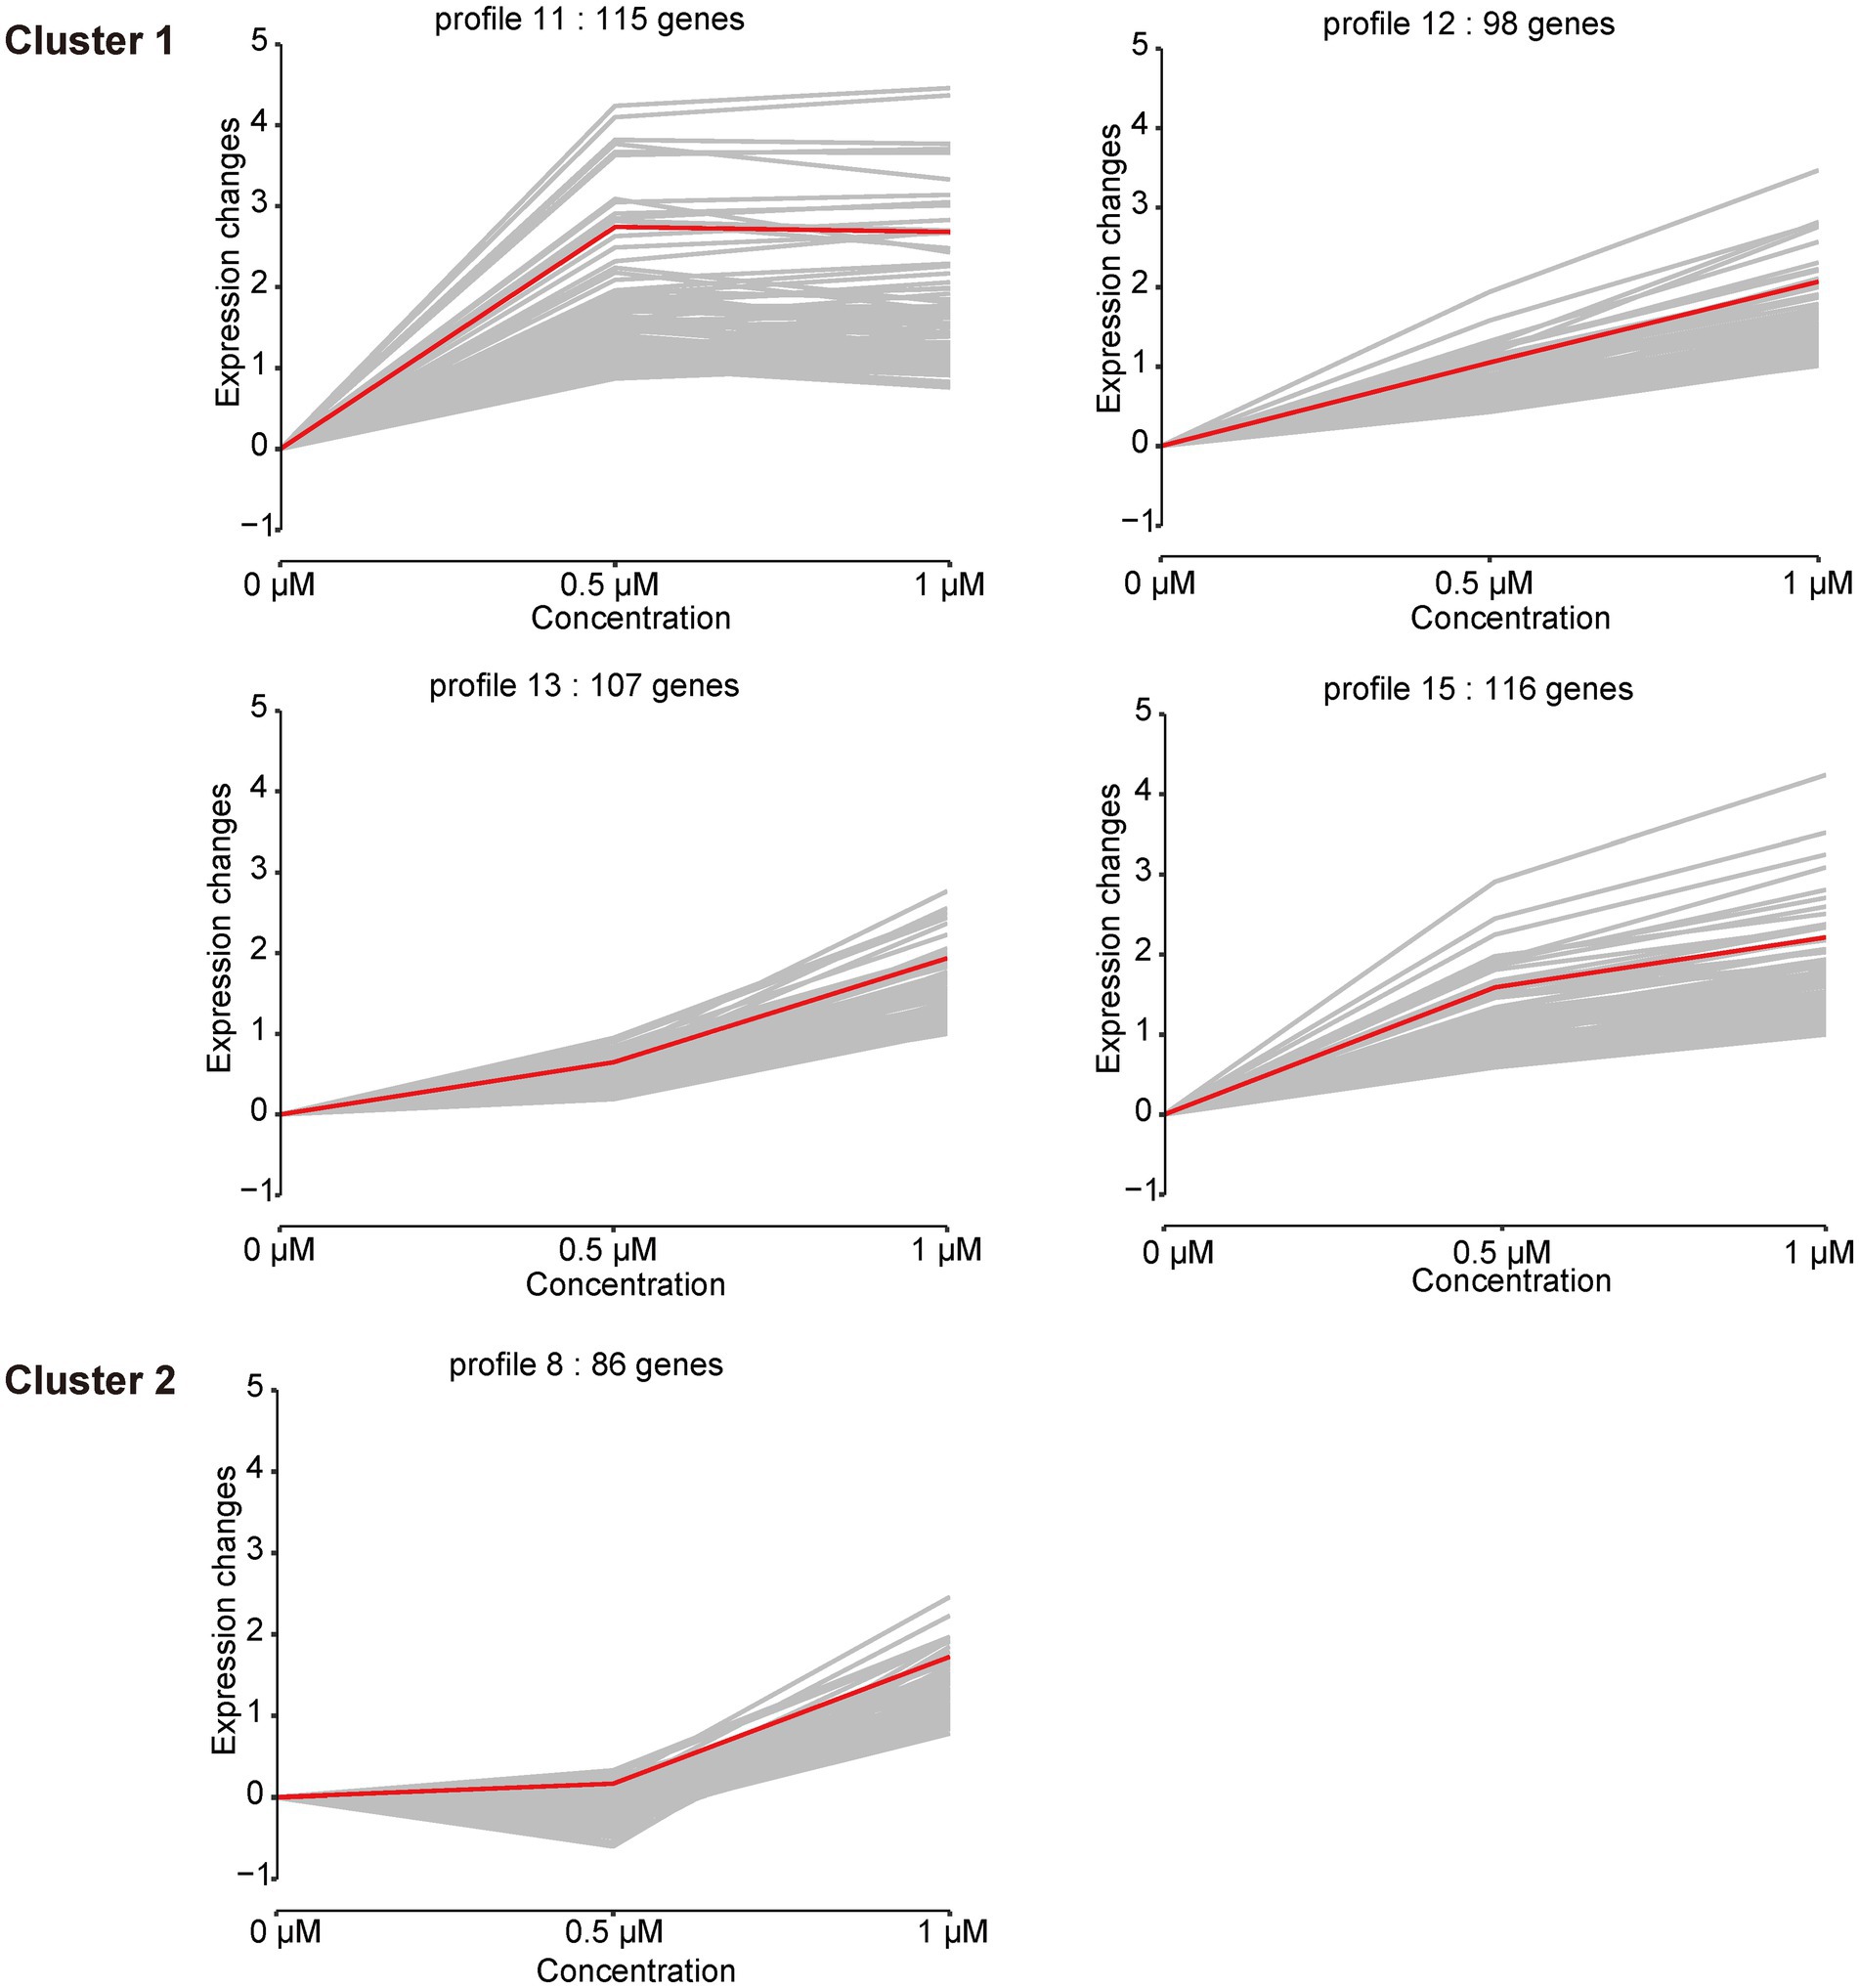
Figure 5. Cluster analysis of the gene expression patterns in the presence of 0, 0.5, 1 μM of Kanamycin B. Based on the correlation coefficient the genes were assigned to the model profile that more closely matched its series. Five Profiles were significantly clustered (p < 0.05). The number of genes in each of the clusters and each profile is shown; gray line is the trend of individual gene expression; red line is the overall trend of gene expression.
Validation by RT-qPCR
To verify the accuracy and reproducibility of the transcriptome results by an alternative method, we performed quantitation by RT-qPCR. We selected 8 genes that were differentially expressed upon treatment with Kanamycin B. A comparative analysis of all the selected genes showed a similar expression pattern in the RT-qPCR analysis as observed in RNAseq data (Figure 6). Thus, the RT-qPCR experiments confirm the reliability of the transcriptome sequencing data.
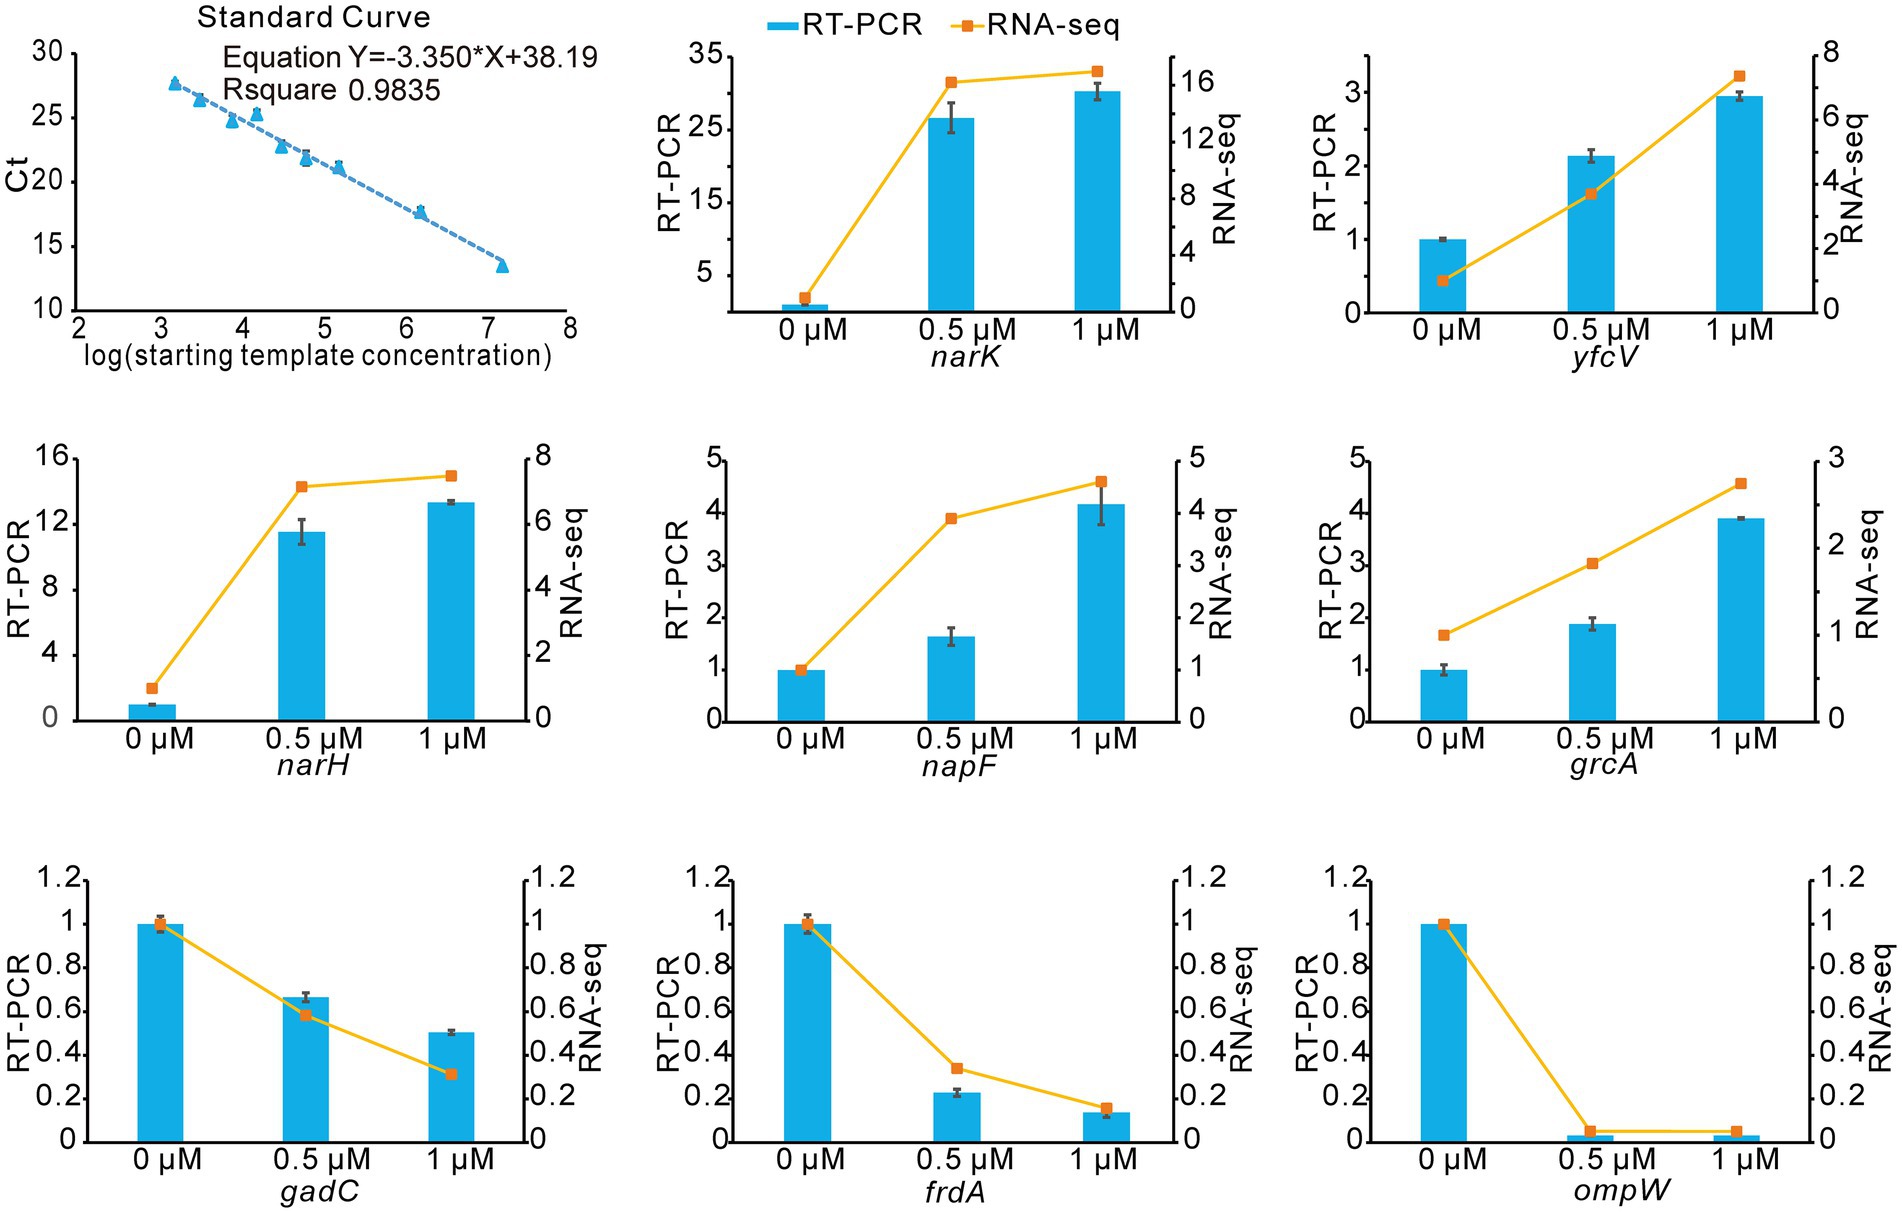
Figure 6. RNA-seq data validation by RT-qPCR. The blue histograms show the expression levels of 8 DEGs treated with 0.5 μM, 1 μM of Kanamycin B. The orange line indicates changes of gene expression levels upon treatment with different concentrations of Kanamycin B. Experiments were performed with three biological replicates. The right Y-axis indicates the fold change of RNA-seq data and the left Y-axis indicates the relative expression levels calculated by RT-qPCR. Error bars are the standard deviation of three independent experiments.
The Kanamycin B and other aminoglycosides induce reporter gene expression through the UTR of the identified DEG
The napF gene is one of the identified DEGs (Figure 6; Table 1) and the transcription start site of the napF gene has been mapped (Stewart et al., 2003). There are 80 nucleotides (nt) upstream of the transcription start site to the coding sequence of the napF gene. It has been shown that aminoglycosides can bind to the 5′ UTR of aac/aad gene to regulate downstream gene expression (Jia et al., 2013). To investigate whether Kanamycin B and other aminoglycoside have effects on downstream gene expression through the 5′ UTR of the napF gene, we constructed reporter plasmids pGEX-napF 5′ UTR-lacZα in which the 80 nt UTR of the napF gene and 9 nt into the coding sequence was under the control of the IPTG-inducible tac promoter (Ptac) and placed upstream of a β-galactosidase (β-gal) reporter gene. The reporter plasmid was transformed into E. coli JM109 and β-gal activity was tested in the absence and presence of Kanamycin B or other aminoglycoside antibiotics (Sisomycin, Tobramycin, Gentamycin, Amikacin) or control molecules (Ribostamycin, Neamine or Paromomycin and Levofloxacin, Tetracycline, Erythromycin, Trimethoprim) by agar diffusion assays. We observed induction of the reporter gene expression with Kanamycin B and Sisomycin, Amikacin, Gentamycin, and Tobramycin but not for the control molecules Ribostamycin, Neamine, Paromomycin, Levofloxacin, Tetracycline, Erythromycin or Trimethoprim (Figure 7A). No induction by Kanamycin B was seen in cells transformed with the reporter plasmid without IPTG in which Ptac promoter is inactive and the 5′ UTR of the napF gene is not made (Supplementary Figure S1A). No induction was observed on plates without Kanamycin B (Supplementary Figure S1B). No induction by Kanamycin B was seen in cells transformed with the reporter plasmid containing a control sequence with IPTG (Wang et al., 2019). To further quantify the agar diffusion assay, we measured β-gal activity in solution (Zhang and Bremer, 1995) on titration of Kanamycin B and other aminoglycosides (Figures 7B,C; Supplementary Figure S1C). Kanamycin B, Amikacin and Gentamycin induce the reporter gene expression by more than 3-fold. These results suggest that Kanamycin B and other aminoglycosides can induce the reporter gene expression through the 5′ UTR of the napF gene. The reporter gene expression requires both Kanamycin B or other aminoglycosides and the 5′ UTR of the napF gene. In parallel, we also observed that Kanamycin B and other aminoglycosides can induce the reporter gene expression through the 5′ UTR of the narK gene (another DEG; Supplementary Figure S2).
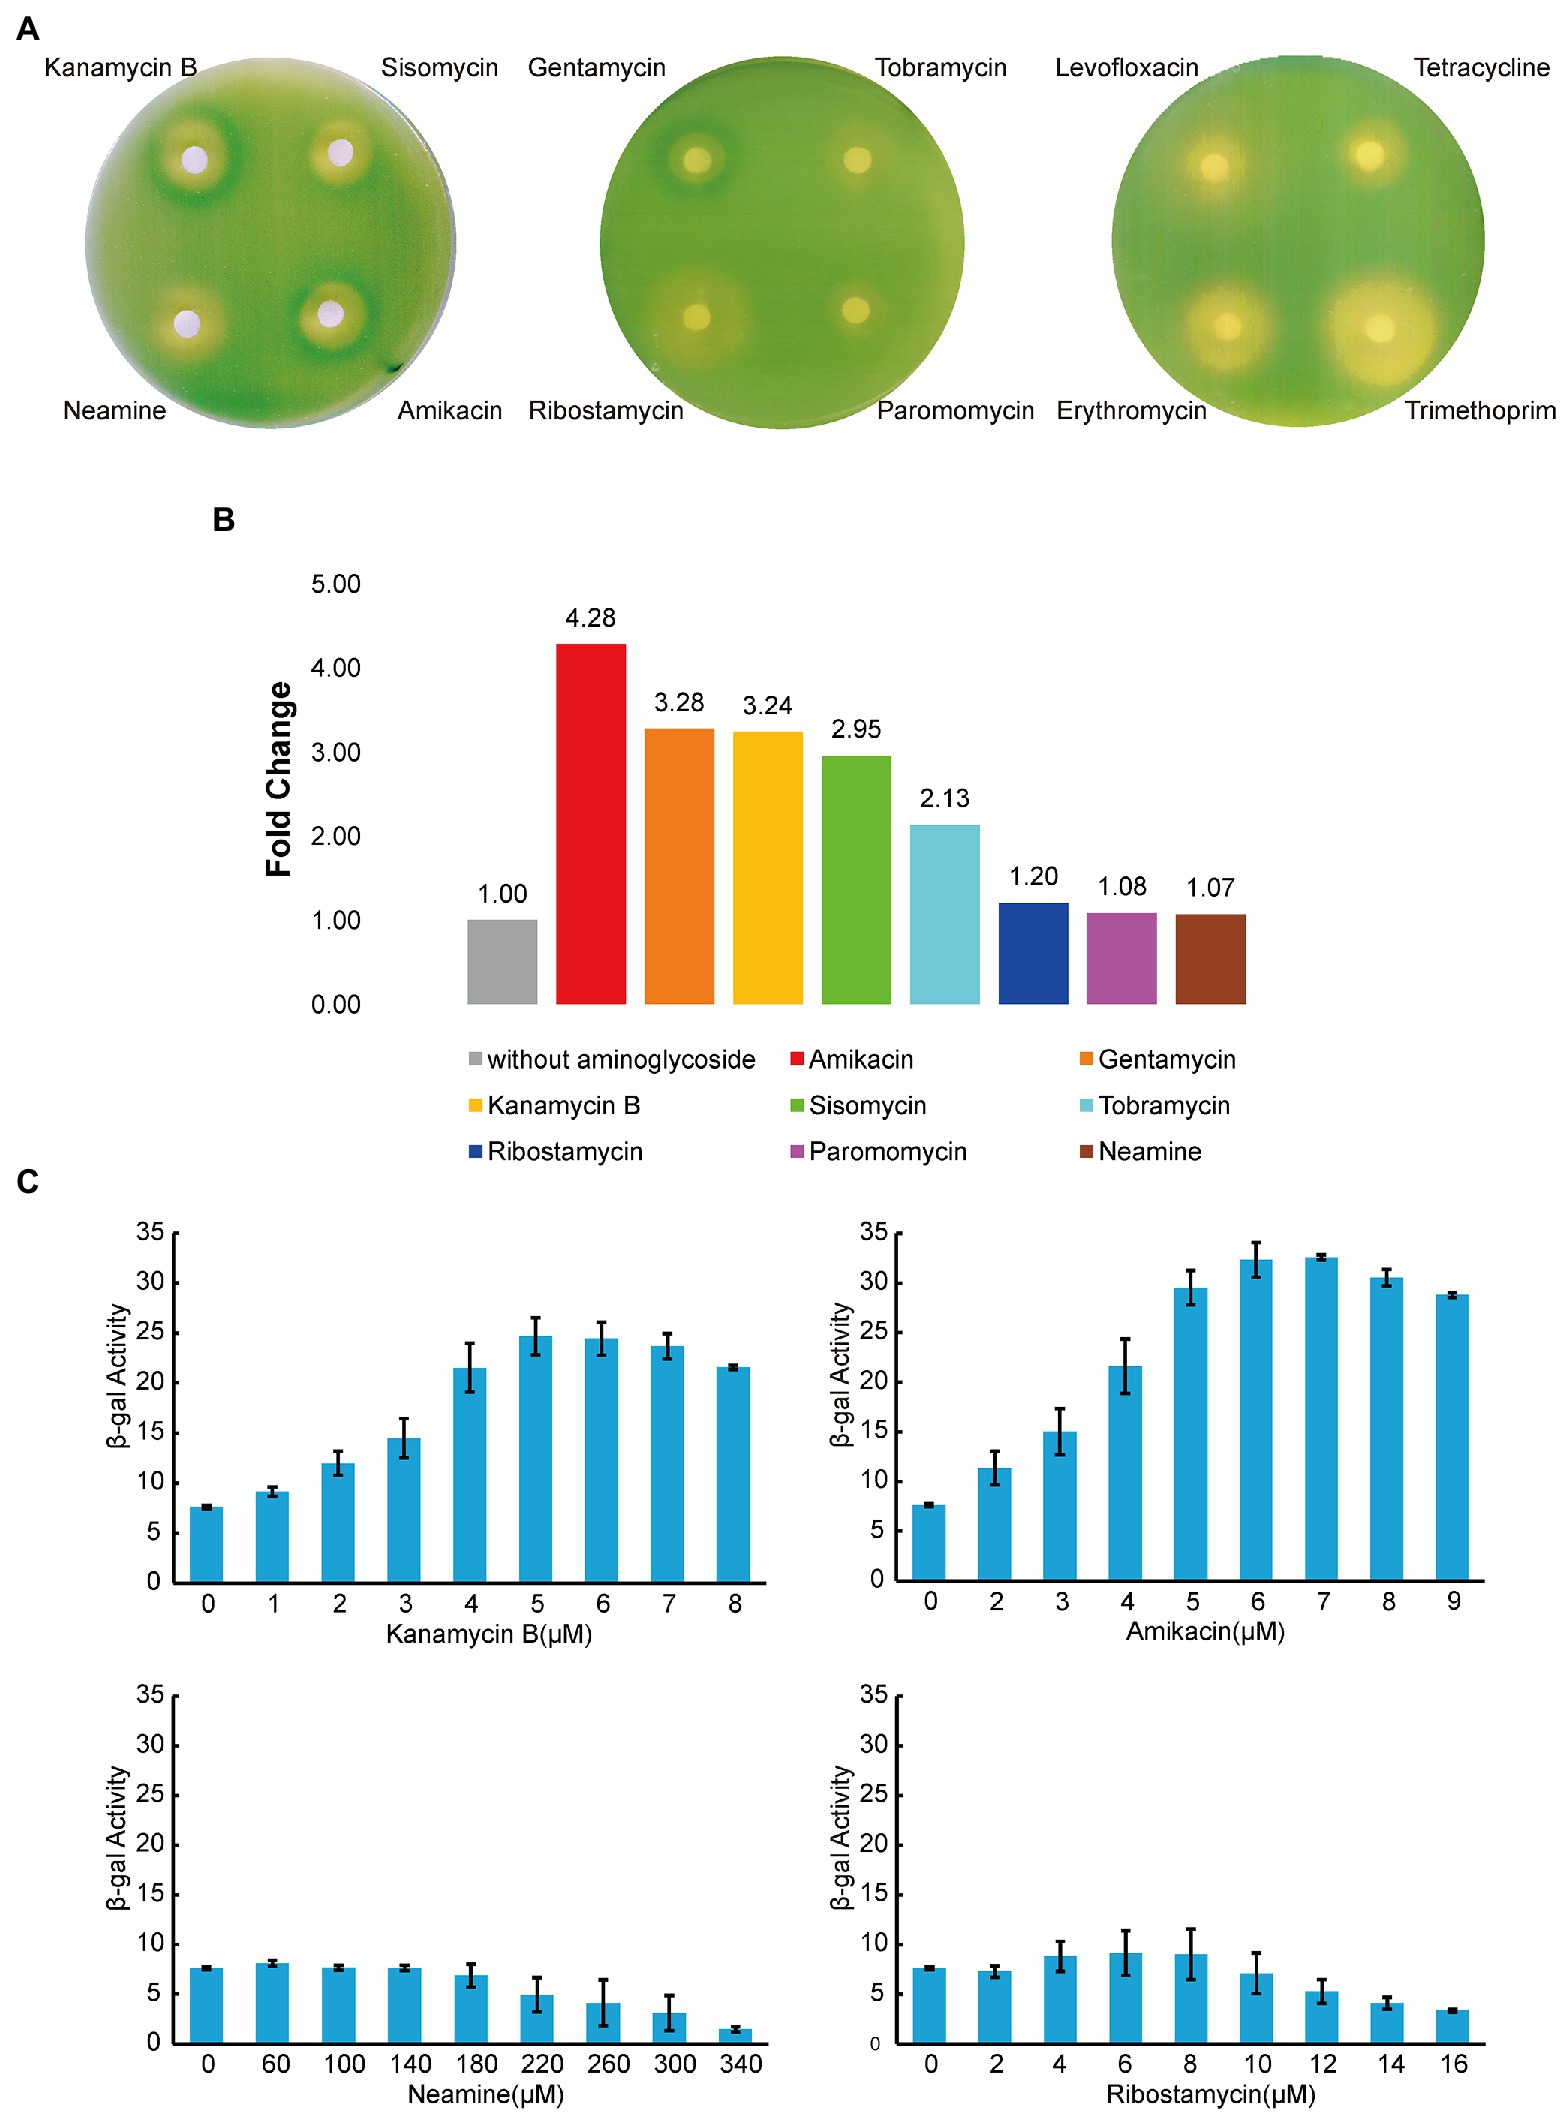
Figure 7. Reporter gene expression mediated by the 5′ UTR of napF. (A) Agar diffusion assay of E. coli JM109 transformed with the reporter construct plasmid with antibiotics in the presence of IPTG. (B) The induction of reporter expression in the presence of aminoglycoside antibiotics. (C) The β-gal activity (Miller units) of the reporter gene on titration of aminoglycoside antibiotics. Error bars are the standard deviation of three independent experiments.
Kanamycin B binds to 5′ UTR RNA
To investigate if Kanamycin B directly bind to the 5′ UTR of the napF gene to induce reporter gene expression, we used MST to measure the binding of Kanamycin B or control molecule (Ribostamycin or Neamine) to the 5′ UTR of the napF gene or Kanamycin B to a random RNA. The 5′ UTR of the napF gene was prepared by in vitro transcription using in-house purified T7 RNA polymerase and was labeled with fluorescein-5-thiosemicarbazide as previously described (Wu et al., 1996). Binding measurements was made on a Monolith NT.115 system by NanoTemper Technologies (Entzian and Schubert, 2016; Moon et al., 2018). An increase in the measured response upon titration of the Kanamycin B was observed, indicating the formation of a Kanamycin B-RNA complex. Kanamycin B binds to the RNA with affinity at 4.5 μM. In contrast, Ribostamycin, Neamine have weaker binding and lower affinities (Figure 8A) and no binding between Kanamycin B and the control RNA (ilvL) was detected (Figure 8B). Thus, Kanamycin B that induces reporter gene expression can bind to the 5′ UTR of the napF gene.
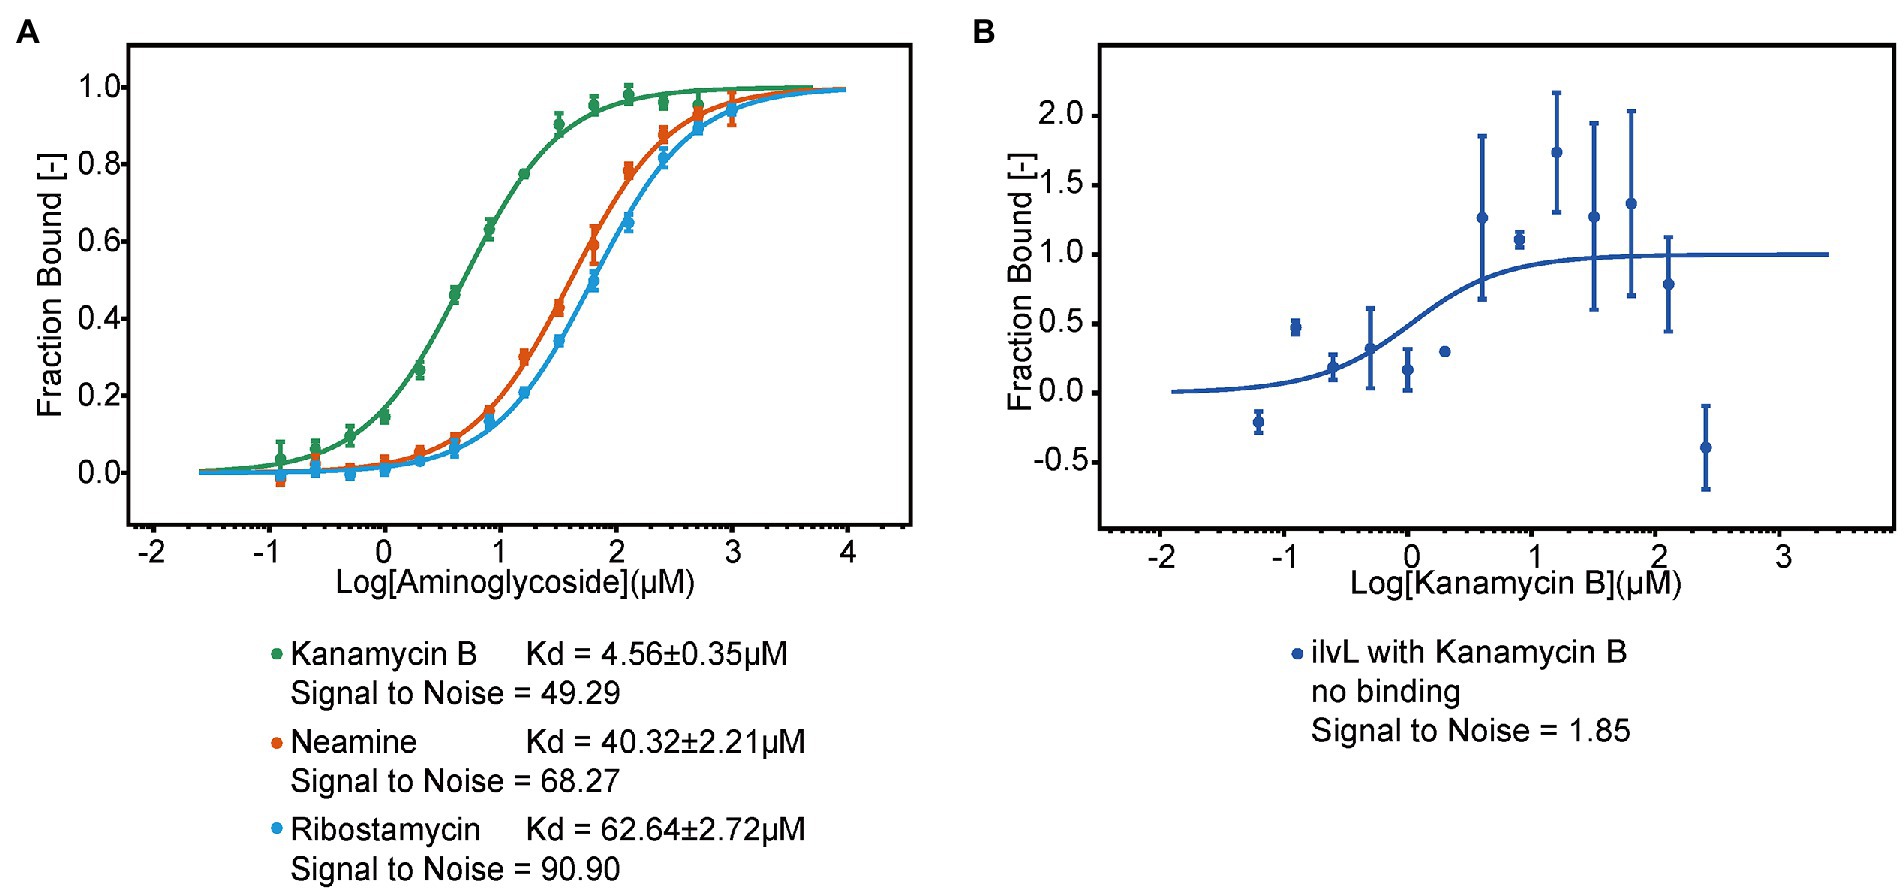
Figure 8. The MST binding of the 5′ UTR of napF with Kanamycin B and other aminoglycosides. (A) Binding curve generated by MST for binding of aminoglycosides to the 5′ UTR of napF. Error bars are standard deviations of at least three independent experiments. (B) Binding curve generated by MST for binding of Kanamycin B to the control RNA ilvL. Error bars are the standard deviation of three independent experiments.
Discussion
Transcriptome analysis of E. coli JM109 treated with Kanamycin B uncovered gene expression networks that respond to Kanamycin B. We set out to investigate the extra non ribosomal inhibitory cellular (i.e., the “off target”) function of Kanamycin B in E. coli through transcriptome data analysis (Figures 1–6). DEGs and STEM analysis of transcriptome data revealed that Kanamycin B treatment effects the expression of genes that are involved in a variety of cellular functions including oxidative phosphorylation, nitrogen metabolism, microbial metabolism in diverse environments, biofilm formation and cell adhesion (Table 1; Figures 3–5). Kanamycin B binds to the 5′ UTR of the napF or narK gene (one of the DEGs) and induces reporter gene expression (Figure 8; Supplementary Figure S3). The results provide insights into the cellular effects of Kanamycin B and are useful for establishing the non-antibiotic function of Kanamycin B.
We compare and contrast our study with the genome-wide transcriptome analysis of E. coli in response to gentamycin (Zhou et al., 2019). There are several differences between the two studies in terms of growth conditions, methods of treatment and concentration of aminoglycosides. E. coli cell was pretreated in the presence of 1 μg/ml gentamycin (1/2 MIC) for 1 h in MHB growth medium before harvesting for RNA extraction and RNA-seq. In comparison, 0.5 μM (1/8 MIC) or 1 μM (1/4 MIC) of Kanamycin B was used in our study to treat E. coli cell for 7 h in LB medium prior to transcriptome analysis. These differences would expect to result in different DEGs in the two studies. However, further analysis showed some complementary findings. A high number of genes related to membrane protein and transporter functions were strongly regulated in response to gentamycin treatment. Similarly, our data (Supplementary Table S2) also showed that a considerate number of transmembrane transport genes were differentially expressed. These data from two independent studies suggest that membrane protein and transporter may have key roles in response to aminoglycosides in E. coli. In particular, narK is membrane protein and we showed biochemically that Kanamycin B may effect gene expression through binding to the 5′ UTR of narK (Supplementary Figure S3). In addition, both studies have identified DEGs that are involved in biological process including ribosome and translation, TCA cycle, glycolysis or carbohydrate metabolism (Supplementary Tables S2, S6; Zhou et al., 2019).
Genome-wide transcriptome profiling of Mycobacterium tuberculosis upon treatment with Kanamycin has been reported (Habib et al., 2017). Comparison with the functional classification and pathways of the DEGs identified in the M. tuberculosis study with those identified in this study in E. coli indicated more differences than similarities between the two studies. Notably, the diverse responses are probably due to the fundamental differences in the biology between E. coli and M. tuberculosis. However, other factors may also account for some of the different responses. The study in M. tuberculosis used Kanamycin instead of Kanamycin B which necessitates different growth conditions in comparison with our study.
It has been reported that the uptake of aminoglycosides into bacterial cells needs the proton motive force that is produced by electron flow through the respiratory chain of oxidative phosphorylation. The proton motive force is mainly generated by the respiratory complex I that contains membrane proteins and/or Fe-S clusters and oxidoreductases (Ezraty et al., 2013). The mechanism of aminoglycoside uptake and the bacterial cell response to the aminoglycosides is still unclear. Aminoglycoside binding riboswitches have been characterized (Jia et al., 2013) and a randomly selected Kanamycin B riboswitch has been reported (Kwon et al., 2001). The transcription levels of some genes associated with oxidative phosphorylation change upon treatment with Kanamycin B in this study. These observations together raise the possibility that Kanamycin B may regulate the expression with oxidative phosphorylation genes through riboregulatory interactions with the transcripts. Further studies will be required to examine this speculation.
In this study, treatment by Kanamycin B induces transcription of nitrate reductase (narK, narG, narI, narH, and napA) and nitrite reductase (nirB, nirD, and nrfA) genes (Table 1; Supplementary Table S4), which are key genes that are involved in nitrogen metabolism. These reductases participate in the conversion of NO3− to NO2− to NO in cells and are associated with wider essential metabolic processes such as energy production, amino acid metabolism, biofilm formation, antibiotic resistance and bacterial pathogenesis. Nitrogen metabolism is also closely interlinked with biofilm formation that is also linked with the metabolism of glutamic acid, glutamine and arginine. It is widely recognized that NO plays an important role in modulating the architecture of biofilms (Vázquez-Torres and Bäumler, 2016; Rinaldo et al., 2018). Other antibiotics have been reported to be able to induce biofilm formation (Linares et al., 2006). Therefore, it is possible that Kanamycin B may be linked to wider biological functions through its association with nitrogen metabolism.
We have further analyzed the identified DEGs by studying the association and effect of Kanamycin B and the UTR of the DEG gene on reporter gene expression. The result showed that Kanamycin B and other aminoglycosides induced reporter gene expression through the 5′ UTR of the napF (involved in nitrogen metabolism) and further direct binding of Kanamycin B to the RNA was detected (Figures 7, 8; Supplementary Figure S1), suggesting that Kanamycin B could directly bind to the 5′ UTR of the napF gene to effect expression of the napF gene in E. coli. Although how the binding of Kanamycin B to the 5′ UTR of the napF gene regulate gene expression remains unclear, the result of this finding revealed that Kanamycin B can bind to the UTR RNA of a gene and effect the expression of its downstream gene. In this case, Kanamycin B may effect cellular nitrogen metabolism through binding to the 5′ UTR of the napF gene and regulate expression of the gene. Taken together, this study has collectively revealed new insights into the non-antibiotic function of Kanamycin B and its wider cellular effect on E. coli.
Data availability statement
The datasets presented in this study can be found in online repositories. The names of the repository/repositories and accession number(s) can be found in the article/Supplementary material.
Author contributions
AM and DC wrote the main manuscript text. YC and XZ prepared Figures 1–8; Table 1; Supplementary Tables 1–6; Supplementary Figures S1–S3. All authors contributed to the article and approved the submitted version.
Funding
This work was supported by National Natural Science Foundation grants 32271345 and 32250710140 to AM.
Acknowledgments
We thank members of the Murchie laboratories for discussion.
Conflict of interest
The authors declare that the research was conducted in the absence of any commercial or financial relationships that could be construed as a potential conflict of interest.
Publisher’s note
All claims expressed in this article are solely those of the authors and do not necessarily represent those of their affiliated organizations, or those of the publisher, the editors and the reviewers. Any product that may be evaluated in this article, or claim that may be made by its manufacturer, is not guaranteed or endorsed by the publisher.
Supplementary material
The Supplementary material for this article can be found online at: https://www.frontiersin.org/articles/10.3389/fmicb.2022.937827/full#supplementary-material
Abbreviations
PCA, principal component analysis; DEGs, differentially expressed genes; KEGG, Kyoto Encyclopedia of Genes and Genomes; GO, Gene ontology; STEM, Short Time-series Expression Miner; RT-qPCR, real-time quantitative PCR; E. coli, Escherichia coli; MST, MicroScale thermophoresis; MIC, minimal inhibitory concentration.
References
Anders, S., Pyl, P., and Huber, W. (2015). HTSeq--a python framework to work with high-throughput sequencing data. Bioinformatics 31, 166–169. doi: 10.1093/bioinformatics/btu638
Baharoglu, Z., and Mazel, D. (2011). Vibrio cholerae triggers SOS and mutagenesis in response to a wide range of antibiotics: a route towards multiresistance. Antimicrob. Agents Chemother. 55, 2438–2441. doi: 10.1128/aac.01549-10
Bailey, M., Chettiath, T., and Mankin, A. S. (2008). Induction of erm (C) expression by noninducing antibiotics. Antimicrob. Agents Chemother. 52, 866–874. doi: 10.1128/AAC.01266-07
Carter, A. P., Clemons, W. M., Brodersen, D. E., Morgan-Warren, R. J., and Ramakrishnan, V. (2000). Functional insights from the structure of the 30S ribosomal subunit and its interactions with antibiotics. Nature 407, 340–348. doi: 10.1038/35030019
Chen, D., and Murchie, A. (2014). An aminoglycoside sensing riboswitch controls the expression of aminoglycoside resistance acetyltransferase and adenyltransferases. Biochim. Biophys. Acta 1839, 951–958. doi: 10.1016/j.bbagrm.2014.02.019
Cianciulli Sesso, A., Lilić, B., Amman, F., Wolfinger, M., Sonnleitner, E., and Bläsi, U. (2021). Pseudomonas aeruginosa gene expression profiling of upon exposure to Colistin and tobramycin. Front. Microbiol. 12:626715. doi: 10.3389/fmicb.2021.626715
Coleman, S., Blimkie, T., Falsafi, R., and Hancock, R. (2020). Multidrug adaptive resistance of Pseudomonas aeruginosa swarming cells. Antimicrob. Agents Chemother. 64, e01999–19. doi: 10.1128/aac.01999-19
Davies, J., and Davis, B. (1968). Misreading of ribonucleic acid code words induced by aminoglycoside antibiotics. The effect of drug concentration. J. Biol. Chem. 243, 3312–3316. doi: 10.1016/S0021-9258(18)93308-9
Entzian, C., and Schubert, T. (2016). Studying small molecule–aptamer interactions using micro scale thermophoresis (MST). Methods 97, 27–34. doi: 10.1016/j.ymeth.2015.08.023
Ernst, J., and Bar-Joseph, Z. (2006). STEM: a tool for the analysis of short time series gene expression data. BMC Bioinformatics 7:191. doi: 10.1186/1471-2105-7-191
Ezraty, B., Vergnes, A., Banzhaf, M., Duverger, Y., Huguenot, A., Brochado, A. R., et al. (2013). Fe-S cluster biosynthesis controls uptake of aminoglycosides in a ROS-less death pathway. Science 340, 1583–1587. doi: 10.1126/science.1238328
Fourmy, D., Recht, M., Blanchard, S., and Puglisi, J. (1996). Structure of the a site of Escherichia coli 16S ribosomal RNA complexed with an aminoglycoside antibiotic. Science 274, 1367–1371. doi: 10.1126/science.274.5291.1367
Habib, Z., Xu, W., Jamal, M., Rehman, K., and Gang, C. (2017). Adaptive gene profiling of mycobacterium tuberculosis during sub-lethal kanamycin exposure. Microb. Pathog. 112, 243–253. doi: 10.1016/j.micpath.2017.09.055
He, W., Zhang, X., Zhang, J., Jia, X., Zhang, J., Sun, W., et al. (2013). Riboswitch control of induction of aminoglycoside resistance acetyl and adenyl-transferases. RNA Biol. 10, 1266–1273. doi: 10.4161/rna.25757
Hoffman, L., D'Argenio, D., Maccoss, M., Zhang, Z., Jones, R., and Miller, S. (2005). Aminoglycoside antibiotics induce bacterial biofilm formation. Nature 436, 1171–1175. doi: 10.1038/nature03912
Jia, X., Zhang, J., Sun, W., He, W., Jiang, H., Chen, D., et al. (2013). Riboswitch control of aminoglycoside antibiotic resistance. Cell 152, 68–81. doi: 10.1016/j.cell.2012.12.019
Khan, F., Lee, J., Pham, D., Lee, J., Kim, H., Kim, Y., et al. (2020). Streptomycin mediated biofilm inhibition and suppression of virulence properties in Pseudomonas aeruginosa PAO1. Appl. Microbiol. Biotechnol. 104, 799–816. doi: 10.1007/s00253-019-10190-w
Khan, S., Wu, S. B., and Roberts, J. (2019). RNA-sequencing analysis of shell gland shows differences in gene expression profile at two time-points of eggshell formation in laying chickens. BMC Genomics 20:89. doi: 10.1186/s12864-019-5460-4
Krause, K., Serio, A., Kane, T., and Connolly, L. (2016). Aminoglycosides: an overview. Cold Spring Harb. Perspect. Med. 6. doi: 10.1101/cshperspect.a027029
Kwon, M., Chun, S., Jeong, S., and Yu, J. (2001). In vitro selection of RNA against kanamycin B. Mol. Cells 11, 303–311. doi: 10.1002/yea.750
Linares, J., Gustafsson, I., Baquero, F., and Martinez, J. (2006). Antibiotics as intermicrobial signaling agents instead of weapons. Proc. Natl. Acad. Sci. U. S. A. 103, 19484–19489. doi: 10.1073/pnas.0608949103
Long, J., Zhang, J., Zhang, X., Wu, J., and Du, C. (2020). Genetic diversity of common bean (Phaseolus vulgaris L.) germplasm resources in Chongqing, evidenced by morphological characterization. Front. Genet. 11:697. doi: 10.3389/fgene.2020.00697
Lovett, P. S., and Rogers, E. J. (1996). Ribosome regulation by the nascent peptide. Microbiol. Rev. 60, 366–385. doi: 10.1128/mr.60.2.366-385.1996
Mingeot-Leclercq, M. P., Glupczynski, Y., and Tulkens, P. M. (1999). Aminoglycosides: activity and resistance. Antimicrob. Agents Chemother. 43, 727–737. doi: 10.1128/AAC.43.4.727
Moon, M., Hilimire, T., Sanders, A., and Schneekloth, J. (2018). Measuring RNA-ligand interactions with Microscale thermophoresis. Biochemistry 57, 4638–4643. doi: 10.1021/acs.biochem.7b01141
Nikaido, H. (2009). Multidrug resistance in bacteria. Annu. Rev. Biochem. 78, 119–146. doi: 10.1146/annurev.biochem.78.082907.145923
Rinaldo, S., Giardina, G., Mantoni, F., Paone, A., and Cutruzzolà, F. (2018). Beyond nitrogen metabolism: nitric oxide, cyclic-di-GMP and bacterial biofilms. FEMS Microbiol. Lett. 365. doi: 10.1093/femsle/fny029
Robinson, M., McCarthy, D., and Smyth, G. (2010). Edge R: a Bioconductor package for differential expression analysis of digital gene expression data. Bioinformatics 26, 139–140. doi: 10.1093/bioinformatics/btp616
Stewart, V., Bledsoe, P. J., and Williams, S. B. (2003). Dual overlapping promoters control nap F (periplasmic nitrate reductase) operon expression in Escherichia coli K-12. J. Bacteriol. 185, 5862–5870. doi: 10.1128/JB.185.19.5862-5870.2003
Vázquez-Torres, A., and Bäumler, A. (2016). Nitrate, nitrite and nitric oxide reductases: from the last universal common ancestor to modern bacterial pathogens. Curr. Opin. Microbiol. 29, 1–8. doi: 10.1016/j.mib.2015.09.002
Wang, S., He, W., Sun, W., Zhang, J., Chang, Y., Chen, D., et al. (2019). Integron-derived aminoglycoside-sensing riboswitches control aminoglycoside acetyltransferase resistance gene expression. Antimicrob. Agents Chemother. 63, e00236–19. doi: 10.1128/aac.00236-19
Wu, T., Ruan, K., and Liu, W. (1996). A fluorescence-labeling method for sequencing small RNA on polyacrylamide gel. Nucleic Acids Res. 24, 3472–3473. doi: 10.1093/nar/24.17.3472
Yu, G., Wang, L. G., Han, Y., and He, Q. Y. (2012). Cluster profiler: an R package for comparing biological themes among gene clusters. Omics J. Integr. Biol. 16, 284–287. doi: 10.1089/omi.2011.0118
Zhang, X., and Bremer, H. (1995). Control of the Escherichia coli rrn B P 1 promoter strength by pp Gpp. J. Biol. Chem. 270, 11181–11189. doi: 10.1074/jbc.270.19.11181
Zhang, J., Liu, G., Zhang, X., Chang, Y., Wang, S., He, W., et al. (2020). Aminoglycoside riboswitch control of the expression of integron associated aminoglycoside resistance adenyltransferases. Virulence 11, 1432–1442. doi: 10.1080/21505594.2020.1836910
Zhou, S., Zhuang, Y., Zhu, X., Yao, F., Li, H., Li, H., et al. (2019). Yhj X regulates the growth of in the presence of a subinhibitory concentration of gentamicin and mediates the adaptive resistance to gentamicin. Front. Microbiol. 10:1180. doi: 10.3389/fmicb.2019.01180
Zhuang, Y., Chen, W., Yao, F., Huang, Y., Zhou, S., Li, H., et al. (2016). Short-term pretreatment of sub-inhibitory concentrations of gentamycin inhibits the swarming motility of Escherichia Coli by Down-regulating the succinate dehydrogenase gene. Cell. Physiol. Biochem. 39, 1307–1316. doi: 10.1159/000447835
Keywords: Kanamycin B, transcriptome, aminoglycosides, differentially expressed genes, binding
Citation: Chang Y, Zhang X, Murchie AH and Chen D (2022) Transcriptome profiling in response to Kanamycin B reveals its wider non-antibiotic cellular function in Escherichia coli. Front. Microbiol. 13:937827. doi: 10.3389/fmicb.2022.937827
Edited by:
Alberto Antonelli, University of Florence, ItalyCopyright © 2022 Chang, Zhang, Murchie and Chen. This is an open-access article distributed under the terms of the Creative Commons Attribution License (CC BY). The use, distribution or reproduction in other forums is permitted, provided the original author(s) and the copyright owner(s) are credited and that the original publication in this journal is cited, in accordance with accepted academic practice. No use, distribution or reproduction is permitted which does not comply with these terms.
*Correspondence: Alastair I. H. Murchie, YWlobUBmdWRhbi5lZHUuY24=; Dongrong Chen, ZHJjaGVuQGZ1ZGFuLmVkdS5jbg==
†These authors have contributed equally to this work