 Yuqian Zhang
 Jie Zhang
 Changyu Yan1
 Meishan Fang
 Lijie Wang
- 1College of Horticulture, South China Agricultural University, Guangzhou, China
- 2Henan Key Laboratory of Tea Plant Comprehensive Utilization in South Henan, College of Tea Science, Xinyang Agriculture and Forestry University, Xinyang, China
Tea (Camellia sinensis) is an important crop that is mainly used in the food industry. This study using the metabolome and microbiome investigates the resistance factors of wild tea plant resources against tea gray blight disease, which is caused by Pestalotiopsis theae (Sawada) Steyaert. According to the interaction analysis of tea leaves and pathogenic fungus, the resistance of wild tea plant resource “R1” (Resistance 1) to tea gray blight disease was significantly higher than that of wild tea plant resource “S1” (Susceptibility 1). The difference between “R1” and “S1” in the metabolome was obvious. There were 145 metabolites that significantly changed. The phenolic acids and flavonoids were the major increased categories in “R1,” and it included 4-O-glucosyl-sinapate and petunidin-3-o-(6”-o-p-coumaroyl) rutinoside. Six metabolic pathways were significantly enriched, including aminoacyl-tRNA biosynthesis, flavone, and flavonol biosynthesis. In terms of bacteria, there was no significant difference between “S1” and “R1” in the principal component analysis (PCA). Pseudomonas was the major bacterial genus in “S1” and “R1.” In addition, each of the two resources had its own predominant genus: Cellvibirio was a predominant bacterial genus in “S1” and Candidatus_competibacter was a predominant bacterial genus in “R1.” In terms of fungi, the fungal diversity and the abundance of the two tea plant resource samples could be distinguished clearly. The fungal component of “S1” was more abundant than that of “R1” at the genus level. Toxicocladosporium was the predominant fungal genus of “S1,” and Filobasidium was the predominant fungal genus of “R1.” The relative abundance of unclassified-norank-norank-Chloroplast and Penicillium were significantly different between “S1” and “R1.” Penicillium was identified as a potential biomarker. They correlated with some metabolites enriched in “S1” or “R1,” such as L-arginine and quercetin-3-o-(2”-o-rhamnosyl) rutinoside-7-o-glucoside. Overall, phenolic acids, flavonoids, and Penicillium could be functional metabolites or microorganisms that contributed to improving the resistance of wild tea plant resources to tea gray blight disease.
Introduction
Tea (Camellia sinensis) is an important crop that is mainly used in the food industry. Metabolites of polyphenols, alkaloids, theanine, tea saponin, and tea polysaccharides are rich in tea, and they have nutrients and functions in healthcare (Yang et al., 1999; Zheng et al., 2011). Tea gray blight disease, a destructive disease caused by the pathogen Pestalotiopsis theae (Sawada) Steyaert, can seriously harm tea leaves and the new shoots of the tea plant. Tea gray blight disease can greatly affect the yield of the tea product (Pallavi et al., 2012). The screening of tea plants' disease-resistance resources plays an important role in the tea industry. It is also important to study the disease-resistance mechanisms in tea.
Previous research has shown that tea plants contain many metabolites with obvious antibacterial properties, such as tea polyphenols and alkaloids (Karou et al., 2006; Ma et al., 2020). Primary and secondary metabolites compose a complex metabolic network in plants. Secondary metabolites can be used as biochemical barriers to resist pathogen invasion and can also be used as signal substances to participate in the transduction of plant-disease resistance response (Escobedo-Martínez et al.,2010; El-Hadidy and El-Ati, 2014). Secondary metabolites that are involved in the plant disease resistance process mainly include lignin, callose, and peroxidase (Luna et al., 2011; Schmelz et al., 2011; Ahuja et al., 2012; Sattler and Funnell-Harris, 2013; Yamane, 2013). Lignin, an important physical antimicrobial substance, causes lignification around the cell wall of the necrotic area to prevent the spread of pathogens (Qiao and Dixon, 2011; Sattler and Funnell-Harris, 2013). When the plant is infected by pathogens, callose can be deposited in a large number of plant cells, which is a response to biological stress such as pathogen invasion. Therefore, the accumulation of callose is an indicator of disease resistance in the study of plant disease resistance (Mt et al., 2003; Luna et al., 2011). Tea polyphenols have various biological activities, such as eliminating free radicals, and antioxidation (Liu et al., 2000). Caffeine also has an inhibitory effect on fungi such as Hydromycetes, Rhizopus serpentonum, and Rhizopus piriocephalus (Zhou et al., 2018; Thangaraj et al., 2020).
Microorganisms are important biological resources in nature and are ubiquitous in plants. Some microorganisms cannot cause disease symptoms when they survive in plant tissues. Some endophytic fungi can produce biochemical substances with insecticidal, antimicrobial, antitumor, immunosuppression, antioxidant, and other biological activities. Endophytic microorganisms can be positively involved in the growth and development of plants, for example, by promoting the ability to defend against biotic stresses. B. subtilis strain 330-2 produces lytic enzymes (laminarase, cellulase, and protease) that can degrade the cell walls of pathogenic fungi and inhibit the growth of Rhizoctonia solani Kühn. The leaf microbiome is very important for the biological control of leaf diseases (Bruisson et al., 2019; Becker et al., 2020). The special epiphytic bacteria around peach leaves have a great influence on the colonization of pathogenic bacteria (Randhawa, 1986). The endophytic fungus extracted from the leaves and stems of Nyctanthes arbortristsi can effectively inhibit pathogenic bacteria and fungus. Thus, these microbiomes have been regarded as potential biological resources to improve plant disease resistance. This present research on the metabolome and microbiome of the disease-resistant wild tea resources can further improve the theory of resistance in tea plants.
This study aimed to investigate the potential microorganisms and metabolites that contribute to disease resistance in tea plants via the metabolome and microbiome. The bacterial and fungal compositions of tea leaves were analyzed using 16S rRNA and ITS high-through sequencing, respectively. Additionally, the quadrupole time of flight mass spectrometry (UPLC–QTOF–MS) was applied to identify the metabolic profiles of the resistance and susceptibility of tea plant resources. The results of this research would provide directions for the mining of functional metabolites and microorganisms of tea tree resources against tea gray blight disease. They can also provide theoretical support for the prevention and control of tea gray blight disease, which would help guide the development of breeding tea plants with improved disease resistance.
Materials and Methods
Plant Materials
Fresh disease-free leaves from wild tea plant resources “S1” (Susceptibility 1), “R1” (Resistance 1), and “SR1” (Sub-resistance 1) were used for the analysis of disease resistance. The wild tea plant resources were collected in Yuntai Mountain, Anhua County, Yiyang City, Hunan Province, and non-artificial cultivation. “R1,” with obvious resistance to tea gray blight disease, and “S1,” with susceptibility to tea gray blight disease, were selected for microbiome and metabolome analysis. The tea leaves for the metabolome and microbiome were collected from nine tea plants, cleaned, and disinfected. This disinfection procedure ensures that there were no other microorganisms on the leaves' surface. The disinfection process was as follows: the leaves were washed 2-3 times with sterile water, soaked in 1% NaClO for 1 min, soaked in 75% alcohol for 1 min, and then washed 2-3 times with sterile water. Finally, the sterile water that was used for the last step of washing was cultured for microorganisms to determine whether the leaves' surface was thoroughly disinfected. Three tea plants were taken as one biological replicate, and three replicates of “S1” and “R1” were used for the microbiome and metabolome analysis.
Resistance Phenotype to Pestalotiopsis theae
The third leaves of the three candidate tea plant resources were collected. After surface cleaning and disinfection, they were moisturized and placed in a plastic box. Fungal samples, 5 mm in diameter, were selected from the pathogenic fungus plate, cultivated for 5 days, and inoculated on the leaves. After inoculation for 24 h, the fungal samples were removed and the cultivation of leaves continued, which were observed for the formation of leaf spots. The diameters of the disease spots at different time points were measured with vernier calipers.
Widely Targeted Metabolomics
The tea samples were freeze-dried with a vacuum freeze-dryer (Scientz-100F). The metabolite extraction method was based on Wang et al. (2020). The extracts were filtrated (SCAA-104, 0.22 μm pore size; ANPEL, Shanghai, China) before UPLC-MS/MS analysis.
For UPLC conditions and ESI-Q TRAP-MS/MS processing, the sample extracts were analyzed using the UPLC-ESI-MS/MS system (UPLC, SHIMADZU Nexera X2; MS, Applied Biosystems 4500 Q TRAP) equipped with a C18 column (Agilent SB-C18, 1.8 μm, 2.1 × 100 mm). The mobile phase consisted of solvent A, pure water with 0.1% formic acid, and solvent B, acetonitrile with 0.1% formic acid. The measurement procedure of the tea sample was based on Chen et al. (2013). Linear ion trap (LIT) and triple quadrupole (QQQ) scans were acquired on a triple quadrupole-linear ion trap mass spectrometer, AB4500 Q TRAP UPLC/MS/MS System, equipped with an ESI Turbo Ion-Spray interface, and controlled using Analyst 1.6.3 software (AB Sciex, Framingham, MA, USA). The ESI source operation parameters were based on Wang et al. (2020).
For UPLC-MS/MS baseline data analysis, unsupervised PCA was performed using the prcomp function in R. Data were assessed for unit variance prior to unsupervised PCA. The hierarchical cluster analysis (HCA) results of samples and metabolites were presented as heatmaps with dendrograms, while Pearson correlation coefficients (PCC) between samples were calculated using the cor-function in R and presented only as heatmaps. Significantly changed metabolites between the control (“S1”) and treatment (“R1”) groups were determined by VIP ≥ 1 and absolute Log2FC (fold change) ≥ 1. VIP values were derived from the OPLS-DA result, which also contains score plots and permutation plots. To avoid overfitting, a permutation test (200 permutations) was performed. The identified metabolites were annotated using the KEGG compound database (http://www.kegg.jp/kegg/compound/). The annotated metabolites were subsequently associated with the KEGG pathway database (https://www.kegg.jp/kegg/pathway.html).
Microbiome Profile of Tea Leaf Samples
The genomic DNA of the microbial community was extracted from the tea leaf sample using FastDNA® Spin Kit for Soil (MP Biomedicals, USA) as directed by the manufacturer. The hypervariable region V5-V7 of the bacterial 16S rRNA gene and the fungal ITS gene were amplified with primer pairs 799F (5'-AACMGGATTAGATACCCKG-3') and 1193R (5'-ACGTCATCCCCAC CTTCC-3'), and ITS1F (5'-CTTGGTCATTTAGAGGAAGTAA-3') and ITS2R (5'-GCTGCGTTCTTC ATCGATGC-3'), respectively. The resulting PCR products of the 16S rRNA and ITS gene were extracted and purified. Following standard protocols, the Illumina MiSeq PE300 (Illumina, USA) platform was used for sequencing by Majorbio Bio-Pharm Technology Co. Ltd. (Shanghai, China). The sequenced results were analyzed through the Majorbio Cloud Platform (https://www.majorbio.com). The sequences were demultiplexed and quality-filtered using QIIME (version 1.9.1) with some criteria. The criteria reference was Zhang et al. (2018). The bioinformatics procedure is as follows: in-house Perl scripts were used to analyze the alpha- and beta-diversity. Ribosomal Database Project (RDP) was used to annotate the taxonomic information from OTUs (Cole et al., 2014). Significant differences between the two groups of samples were evaluated using the paired Student's t-test in the a-diversity indices. Taxonomical and functional differences between the two groups of samples were analyzed using the STAMP 2.1.3 software (Parks et al., 2014), and the p-values were calculated via Welch's t-test. LEfSe analysis was performed to identify the most differentially abundant taxa between the two groups of samples (Segata et al., 2011), and the most discriminant taxa were distinguished by linear discriminant analysis (LDA) score > 2 and p < 0.05. Differences in relative taxa abundance between the two groups of samples were calculated using a non-parametric Wilcoxon rank-sum test. Taxa-relative abundance in the difference between the two groups of samples was calculated by a non-parametric Wilcoxon rank-sum test. Population differences were analyzed with a unidirectional ANOVA. p < 0.05 was deemed statistically significant.
Statistical Analysis
All statistical analyses have been carried out using SPSS 22 statistics. The differences between the control (“S1”) and treatment groups (“R1”) were analyzed using the Student t-tests. Statistical significance was assessed by p < 0.05. Correlations between the microbiotas and metabolites were analyzed by Spearman correlation analysis.
Results
Resistance Phenotypes to Pestalotiopsis theae
The interaction analysis results of the third tea leaves and the tea gray blight pathogen showed that the wild tea plant resource “R1” had obvious resistance to tea gray blight disease, and no obvious disease spots were found in the leaves during the whole infection cycle (Figure 1A). Tea plant resource “S1” was sensitive to tea gray blight disease. On the 6th day of infection, the leaves showed obvious browning (Figure 1). On the 12th day, the “S1” leaves were dead (Figure 1). The resistance of the tea plant resource “SR1” to tea gray blight disease was between those of “S1” and “R1” (Figure 1). Consequently, “S1” and “R1” were selected for subsequent analysis of the microbiome and metabolome to obtain differences in microbial diversity and metabolites between “S1” and “R1.”
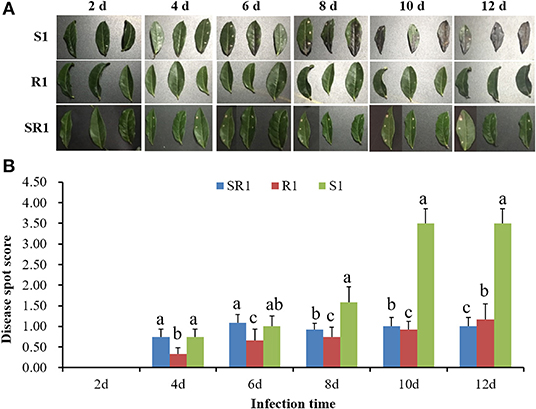
Figure 1. (A) Analysis of the interaction between wild tea leaves and tea gray blight pathogen. (B) Disease resistance analysis of wild tea plant resources and tea gray blight pathogen. S1, Susceptibility 1; R1, Resistance 1; SR1, Sub-resistance 1. Different lowercase letters in the histogram indicate significant difference of disease spot score among “S1”, “SR1”, and “R1” at the same time of infection (p < 0.05, SNK-q test).
Metabolism Differences Between the Two Wild Resources
The tea leaf samples were analyzed using UHPLC-MS/MS in positive and negative modes (Supplementary Figure 1A). A typical TIC plot of one QC sample and the multipeak detection plot of metabolites in the multiple reaction monitoring (MRM) modes were illustrated in Supplementary Figures 1B,C. The TIC plot represents a continuous description of the intensity sum of all ions in the mass spectrum at different time points. The multipeak detection plot of metabolites in the MRM mode revealed the substances that were detected in the samples. In the multipeak detection plot, each peak in a different color represents a detected metabolite. Information on metabolite serial numbers, peak integration values, and metabolite names are listed in Supplementary Table 1.
In total, 728 metabolites were identified, including 184 flavonoids, 121 phenolic acids, 92 lipids, 76 amino acids and their derivatives, 51 nucleotides and their derivatives, 50 organic acids, 39 alkaloids, 31 tannins, 20 lignans and coumarins, 3 terpenoids, and 61 others (Figure 2, Supplementary Table 1). The metabolites of class II belong to class I in Figure 2. All metabolites were analyzed by ANOVA (Supplementary Table 1). As shown in the Venn plot, the most detected and identified metabolites can be found in the two tea leaf samples (Figure 3A).
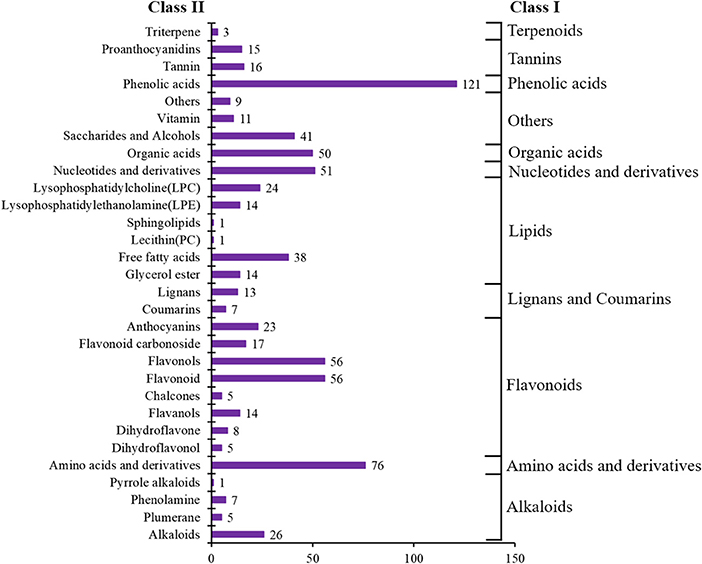
Figure 2. Number of metabolite categories identified in all samples.
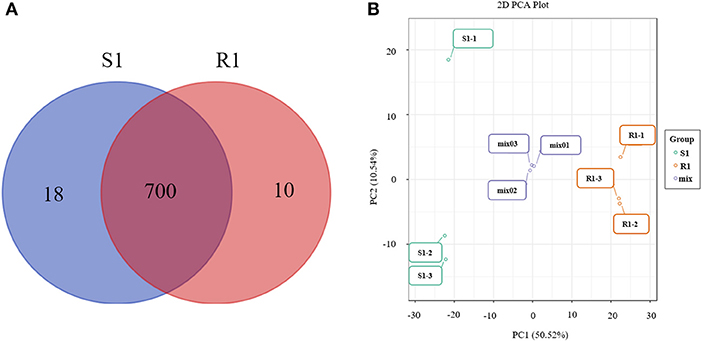
Figure 3. Venn diagrams of metabolites detected in each group (A) and principal component analysis (PCA) score plot for mass spectrum data of tea samples and quality control samples (B). The X-axis represents the first principal component (PC1) and the Y-axis represents the second principal component (PC2) in the PCA score plot.
The quality control samples (QC) were prepared by mixing extracts from two tea leaf samples. As shown in the principal component analysis (PCA) plots, there was a large separation of trends between the “S1” and “R1” leaves and little intragroup variation was observed (PC1=50.52% and PC2=10.54%, Figure 3B). OPLS-DA modeling can maximize the difference between different groups and can be performed to evaluate the data quality and identify potential biomarkers. As is shown, the values of R2Y (0.999) were high and the values of Q2 were >0.5 (Supplementary Figure 2A), indicating good reliability and predictability of the model. In the permutation test of the OPLS-DA, the sequential order of categorical variable Y was randomly changed many times (n=200) (Supplementary Figure 2B). Three corresponding OPLS-DA models were established on each occasion (Supplementary Figures 2C,D). Thus, the R2 and Q2 values of the stochastic models were obtained. The results suggested that these methods were of great importance for preventing the test model from overfitting and for evaluating the statistical significance of the model. As shown in Supplementary Figure 2B, the original model's R2Y values were close to 1 in “S1” and “R1,” respectively. The results indicate that the established models were an accurate description of the real situation in all sample data. The Q2 values in “S1” and “R1” were close to 1 (0.966), and these show that a similar distribution would be generated if other new samples were added to the models. As a whole, the original model of the “S1” and “R1” groups can ideally explain the difference between each treatment group and the control group. Furthermore, there was a gradual decrease in the retention degree of the permutation. The R2Y' and Q2' values of permutation models are less than those of the R2Y and Q2 of the stochastic model shown in Supplementary Figure 2B. Therefore, these results indicate that the PCA and OPLS-DA models in the present study demonstrate good repeatability and reliability. The potential biomarkers were screened according to the VIP value (VIP > 1), the absolute value of fold change ≥ 2, and statistical tests p < 0.05.
Based on the PCA and OPLS-DA results, the VIP can be used for the preliminary screening of different metabolites between the treatment and the control groups. Moreover, differential metabolites can be further screened by combining the VIP value with the fold-change value. In this study, there were 145 metabolites that significantly changed (|Log2Foldchange| ≥ 1 and VIP > 1). Among them, compared with “S1,” 96 metabolites were significantly decreased and 49 metabolites were significantly increased in “R1” (Figure 4, Supplementary Table 2). Flavonols, phenolic acids, amino acids and their derivatives, and flavonoids were the main categories of significantly changed metabolites (SCMs). The most increased categories were phenolic acids and flavonoids in “S1” (Figure 4A). Among all the differentially enriched metabolites, 21 metabolites were particularly obvious, such as quercetin-7-o-rutinoside-4'-o-glucoside and petunidin-3-o-(6”-o-p-coumaroyl) rutinoside (Supplementary Figure 3).
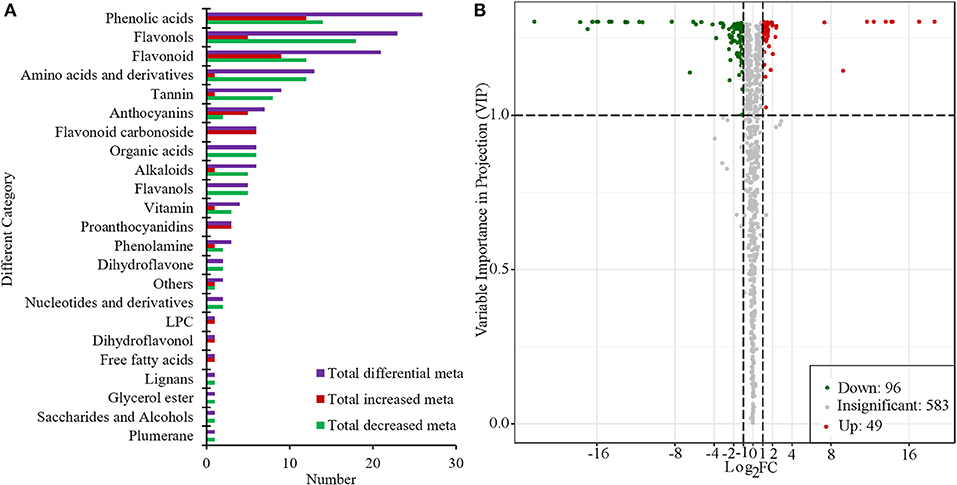
Figure 4. Number of different categories (A) and volcano plot of metabolites (B) in “R1” vs. “S1.”
The potential biomarkers were used for pathway analysis using KEGG topology analysis. In this study, 145 SCMs were used for KEGG analysis. The differential metabolites were classified into corresponding pathways according to the information from the pathway database (Supplementary Table 3). The pathway analysis of SCMs involved a total of 52 pathways (Supplementary Figures 4, 5). Six metabolic pathways (rich factor value > 0, p < 0.05) were significantly enriched, including aminoacyl-tRNA biosynthesis (rich factor value = 0.56); glucosinolate biosynthesis (rich factor value = 0.75); tropane, piperidine, and pyridine alkaloid biosynthesis (rich factor value = 0.67); 2-oxocarboxylic acid metabolism (rich factor value = 0.39); flavone and flavonol biosynthesis (rich factor value = 0.42); and valine, leucine, and isoleucine degradation (Rich factor value = 0.50). It should be noted that aminoacyl-tRNA biosynthesis, 2-oxocarboxylic acid metabolism, and flavone and flavonol biosynthesis encompass a large portion of the total metabolites in “S1” and “R1” (Supplementary Figure 5).
Microbial Difference Analysis in Tea Leaves
The bacterial and fungal compositions of “S1” and “R1” leaves were analyzed using 16S rRNA and ITS high-throughput sequencing, respectively. A total of 69,996 raw reads of 16S rRNA and 4,06,834 raw reads of ITS were obtained from six tea leaves samples (n = 3 for each group) with an average of 11,666 reads of bacterial and 67,805 reads of fungi per sample. The average read lengths of 16S rRNA and ITS were 377.18 bp and 232.51 bp, respectively. A total of 207 distinct operational taxonomic units (OTUs) of bacteria and 191 OTUs of fungi were observed in all samples. The Simpson index and Sobs index of bacteria and fungi did not show a significant difference between “S1” and “R1” (Supplementary Figures 6A,B). Genus-based principal component analysis (PCA) showed distinct fungal profiles between “S1” and “R1” (Supplementary Figure 7A), but the PCA of bacteria did not show distinct bacterial profiles between “S1” and “R1” (Supplementary Figure 6C). Also, the results of the hierarchical clustering of fungus and bacteria did not show better separations (Supplementary Figures 6D, 7B).
In Supplementary Figure 6E, Proteobacteria and Actinobacteria dominated the leaf microbiota composition at the phylum level of bacteria, contributing to 92 and 7.1% of the leaves' microbiota in “S1,” and 91 and 8% of the leaves' microbiota in “R1,” respectively. At the genus level, the relative abundance of microbes showed a difference between “S1” and “R1” (Supplementary Figure 6F). In Supplementary Figure 7C, Ascomycota and Basidiomycota dominated the leaf microbiota composition at the phylum level of fungi, contributing to 83 and 17% of the microbiota in “S1,” and 70 and 30% of the microbiota in “R1,” respectively. At the genus level, the relative abundance of fungi showed the difference between “S1” and “R1” (Supplementary Figure 7D). The differences in leaf microbiota among these groups were also evidenced by linear discriminant analysis effect size (LEfSe), which showed the most different abundant taxon of two tea plant resource samples (Supplementary Figures 8, 9). Using a metagenomic biomarker discovery approach, Cyanobacteria was found to be significantly enriched in the “S1” samples (LDA score > 3), while Burkholderia–Caballeronia–Paraburkholderia (LDA score > 3.5) and Penicillium, Plectosphaerella, and Plectosphaerellaceae (LDA score > 4) were identified as biomarkers of the “R1” group (Supplementary Figures 8, 9).
At the genus level of bacteria, 151 genera coexisted in the two tea resources. A total of 40 genera only existed in the “S1” resources and 29 genera only existed in the “R1” resources (Supplementary Figure 10A). Pseudomonas was the predominant genus, contributing to 79.74% of the common microbiota in the two tea samples (Supplementary Figure 11A). Cellvibirio was the predominant genus (10.82%) only in “S1,” and Candidatus_competibacter was the predominant genus (28.90%) only in “R1” (Supplementary Figures 11B,C).
At the genus level of fungi, 102 genera coexisted in the two tea resources. A total of 41 genera only existed in the “S1” resources and 27 genera existed in the “R1” resources (Supplementary Figure 10B). Cutaneotrichosporon was the predominant genus, contributing to 23.12% of the common microbiota in the two sample groups (Supplementary Figure 12A). Toxicocladosporium was the predominant genus (18.85%) only in “S1” and Filobasidium was the predominant genus (13.30%) only in “R1” (Supplementary Figures 12B,C). The results show that the microbiota composition at the genus level of “S1” is more abundant than that in “R1.”
Norank_norank_Chloroplast (p=0.04451) was a significantly different enrichment bacterial genera between the two tea resources (Supplementary Figure 13). Penicillium (p = 0.02156) was a significantly different enrichment fungal genera between the two tea resources (Supplementary Figure 14). At the species level of bacteria, the relative abundance of unclassified_norank_norank_ Chloroplast (p = 0.04451) showed a significant difference between the two tea resources (Figure 5A). At the species level of fungi, the relative abundance of unclassified_Penicillium (p = 0.03377) showed a significant difference between the two tea samples (Figure 5B).
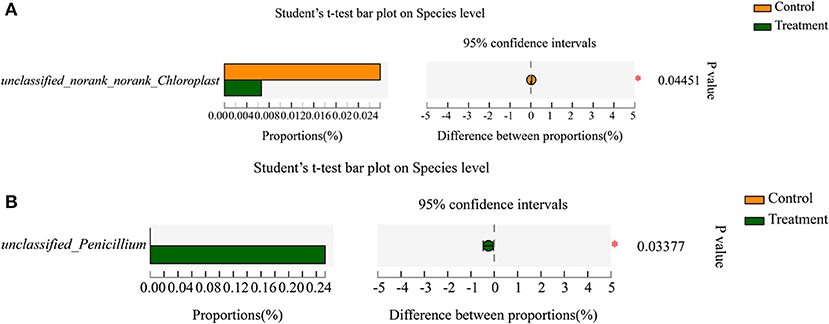
Figure 5. The significantly enriched bacterial and fungal species in “S1” and “R1” samples. (A) The significantly enriched bacterial species. (B) The significantly enriched fungal species.
Correlations Between Microorganisms and Metabolites in Tea Leaves
Correlation analysis between the leaves” microorganisms and metabolites indicates potential mutual contributions. To investigate the contributions of metabolites to leaves' microbiota, we performed RDA on the significantly changed metabolites related to the leaves' microbiota (Supplementary Figure 15). The top three high-enrichment or low-enrichment metabolites contributed to the leaves' microbiota. We found that the top three high-enrichment metabolites, namely quercetin-7-o-rutinoside-4'-o-glucoside, 2,3-di-o-galloyl-d-glucose, and L-arginine contributed to the bacteria and fungi of “S1” leaves. However, the top three low-enrichment metabolites, namely luteolin-6-c-glucoside-7-o-(6”-p-coumaroyl) glucoside, isovitexin-2”-o-(6”'-p-coumaroyl) glucoside, and vitexin-7-o-(6”-p-coumaroyl) glucoside contributed to bacteria and fungus of “R1” leaves (Supplementary Figure 15).
In addition, the metabolites, and the bacterial and fungal genera in two tea resources were used for Spearman's correlation analysis. In Supplementary Figures 16, 17, the relative abundance of unclassified_Gammaproteobacteria, Microbacterium, norank_norank_ Gaiellales, Aeromonas, Bacillus, norank_norank_Chloroplast, Pseudomonas, Ralstonia, unclassified_Enterobacteriaceae, Sphingomonas and Penicillium, Pseudocercospora, Plectosphaerella, Cladosporium, unclassified_Ascomycota, Phyllosticta, Strelitziana, Toxicocladosporium, Bipolaris, Trichoderma, and unclassified_Xylariales were significantly correlated with the top twenty-one metabolites enriched in “S1” or “R1.” The positive and negative correlations were as follows: Microbacterium, norank_norank_Gaiellales, Aeromona, and unclassified-norank-norank-Chloroplast were significantly positively correlated with the levels of delphinidin-3-o-(2”'-o-p-coumaroyl) rutinoside and isorhamnetin-3-o-rutinoside-7-o-rhamnoside, but were significantly negatively correlated with some SCMs, such as 1,2,3-tri-o-galloyl-d-glucose and castanoside. Bacillus, norank_norank_Chloroplast, Pseudomonas, Ralstonia, unclassified_ Enterobacteriaceae, and Sphingomonas were significantly positively correlated with the levels of some SCMs, such as 2,3-tri-o-galloyl-d-glucose, 2,3-di-o-galloyl-d-glucose, dicaffeoylquinic acid-o-glucoside, kaempferol-3-o-(2”-p-coumaroyl) galactoside, feruloylmalic acid, feruloyltartaric acid (fertaric acid), and p-coumaroylmalic acid, but were significantly negatively correlated with delphinidin-3-o-(2”'-o-p-coumaroyl)rutinoside, quercetin-3-o-(2”-o-rhamnosyl)rutinoside-7-o-glucoside, petunidin-3-o-(6”-o-p-coumaroyl) rutinoside, isorhamnetin-3-o-rutinoside-7-o-rhamnoside, luteolin-7-o-sophoroside-5-o-arabinoside, etc. Penicillium, Pseudocercospora, and Plectosphaerella were significantly positively correlated with the levels of delphinidin-3-o- (2”'-o-p-coumaroyl) rutinoside, quercetin-3-o- (2”-o-rhamnosyl) rutinoside-7-o-glucoside, petunidin-3-o-(6”-o-p-coumaroyl) rutinoside, and isorhamnetin-3-o-rutinoside-7-o-rhamnoside but were significantly negatively correlated with some metabolites such as L-arginine, eriodictyol-7-o-glucoside, cyanidin-3-o- (6”-o-p-coumaroyl) rutinoside-5-o-glucoside, and 6-c-methylquercetin-3-o-rutinoside. Strelitziana, Toxicocladosporium, Bipolaris, Trichoderma, and unclassified_Xylariales were significantly positively correlated with the levels of L-arginine and eriodictyol-7-o-glucoside. Trichoderma and unclassified_Xylariales were significantly negatively correlated with delphinidin-3-o-(2”'-o-p-coumaroyl) rutinoside.
Discussion
Although some secondary metabolites, such as lipids (Lim et al., 2017), flavonoids (Cushnie and Lamb, 2011), alkaloids (Yang et al., 2016), polyphenols (Bazzaz et al., 2016), and glycoside (Escobedo-Martínez et al., 2010), are not directly involved in plant growth and development, they can nonetheless act as a chemical defense. That is, they can be used for defending against the damage caused by plant diseases in specific environments and physiological conditions. Flavonoids, as one of the substances with defense functions, are widely found in plants. In maize, 2,4-dihydroxy-7-methoxy-2H-1,4- benzoxazin-3(4H)-one (DIMBOA) can resist fungus (Frey et al., 1997). The isoflavones also have antimicrobial functions (Undhad et al., 2021). Research has shown that under the stimulation of pathogenic bacterial infection, tea leaves can increase polyphenols as antibacterial factors, and the cortex of roots and stems can also produce antitoxin (Turkmen et al., 2007).
In the present study, the tea plant resource “R1” had obvious resistance to tea gray blight disease, but “S1” was susceptible. Flavonoids, phenolic acids, amino acids, and derivatives were the major differential accumulated categories of SCMs. The major SCMs include kaempferol, luteolin, vitexin, quercetin, and their glycosides. “R1” sample specifically enriched petunidin, luteolin, vitexin, isovitexin, quercetin, and isorhamnetin's glycoside. In Arabidopsis, quercetin can protect Arabidopsis against Pseudomonas syringae pv. Tomato DC3000 infection through both quercetin-mediated H2O2 generation and the involvement of SA and NPR1 (Jia et al., 2010). Isovitexin is a biologically active flavone C-glycosylated derivative of apigenin that possesses anti-inflammatory and antioxidant properties in vegetables and fruits (Zielińska-Pisklak et al., 2015; Lv et al., 2016). Isorhamnetin augments the cellular antioxidant defense capacity by activating the Nrf2/HO-1 pathway (Hyun, 2016). Sinapate helps to improve pathogen resistance for Botrytis cinerea by UV-B radiation in Arabidopsis (Demkura and Ballaré, 2012). Vitexin has been reported to have inhibitory effects on Gram-negative bacteria, especially Pseudomonas aeruginosa and Bordetella petrii (Das et al., 2016; Rath et al., 2016; Corrêa et al., 2021), and vitexin's glucoside has a significant antioxidant effect (Fang et al., 2016; Wu et al., 2021). Thus, the enriched metabolites in the “R1” sample may contribute to the disease resistance to tea gray blight disease. These metabolites therefore provided the research directions for analyzing the function of metabolites through the interaction between metabolites and pathogens.
The dominant species and compositions of antimicrobial bacteria are closely related to plants' resistance to disease (Mendes et al., 2011; Lareen et al., 2016). Bacteria can have wide-ranging effects on the host plants. For example, they can affect many plant processes such as disease resistance, drought tolerance, life cycle phenology, and overall vigor (Panke-Buisse et al., 2017). The research on the microorganisms and Cassava phenotype shows that Lactococcus sp., Pantoea dispersa, and Saccharomyces cerevisiae are closely associated with cassava disease resistance (Bonito et al., 2014). An antagonistic function has been reported for the pathogen Pantoea dispersa, an indigenous endophytic bacterium of rice seeds that can produce auxins to inhibit the pathogen Fusarium oxysporum, allowing it to play an important role in the defense against pathogens (Verma et al., 2017). Pantoea dispersa has fungicidal properties and was found to significantly inhibit the growth of Ceratocytis fimbriata on the leaves and tuberous roots of a susceptible sweet potato cultivar (Jiang et al., 2019). Gu et al. (2020) found that the modulation of siderophore plays an important role in iron competition and biocontrol of the soil-borne pathogen Ralstonia solanacearum. In our study, Proteobacteria, Actinobacteria, Ascomycota, and Basidiomycota dominated the microbiota composition at the phylum level. At the genus level, Pseudomonas and Cutaneotrichosporon were the predominant genera in the two sample groups. Cellvibirio, Toxicocladosporium or Candidatus_competibacter, and Filobasidium were the predominant genera only in “S1” or “R1.” Cellvibrio has been isolated from soil environments; nevertheless, strains belonging to the genus have also been found in aquatic environments (Rhee et al., 2010). The Cellvibrio genus, especially C. japonicus, has been recognized and studied for its industrial enzymic potential to degrade a variety of polysaccharides, including those present in the plant cell wall (DeBoy et al., 2008). This means that the members of Cellvibrio might hurt plant cells. The yeast Filobasidium has been described as an important member of the wine consortia for its role in creating specific flavor profiles or reducing final alcohol content (Cureau et al., 2021). At the species level, the relative abundance of unclassified_norank_norank_Chloroplast and unclassified_Penicillium have shown significant differences between the two groups of samples. Furthermore, we found that the proportional abundance of Penicillium in the “R1” group was particularly significantly increased. A high level of Penicillium was identified as a potential biomarker of the “R1” group via LEfSe analysis. According to the correlation research between metabolites and microorganisms, the predominant genera, such as norank_norank_Chloroplast, Pseudomonas, Penicillium, and Toxicocladosporium are significantly correlated with the top SCMs enriched in “S1” or “R1,” including L-arginine, castanoside B, cyanidin-3-o-(6”-o-p-coumaroyl) rutinoside-5-o-glucoside, dicaffeoylquinic acid-o-glucoside, isorhamnetin-3-o-rutinoside-7-o-rhamnoside, luteolin-7-o-sophoroside-5-o-arabinoside, p-coumaroylmalic acid, and quercetin-3-o-(2”-o-rhamnosyl) rutinoside-7-o-glucoside.
Overall, the present study demonstrated an obvious difference between “S1” and “R1” tea plant resources in their metabolomes. The phenolic acids and flavonoids were the categories in “R1” samples with major increases and they included 4-O-glucosyl-sinapate and petunidin-3-o-(6”-o-p-coumaroyl) rutinoside. The major bacterial genus was Pseudomonas in “S1” and “R1.” Cellvibirio was predominant genus in “S1” and Candidatus_competibacter was predominant genus in “R1.” The microbiota of “S1” is more abundant than that in “R1.” Unclassified_norank_norank_Chloroplast and unclassified_Penicillium showed significant differences between “S1” and “R1.” Penicillium was identified as a potential biomarker. They were both significantly correlated with some metabolites. Phenolic acids and flavonoids, as well as Penicillium can be functional metabolites and microorganisms that may contribute to tea plants' resistance to tea gray blight disease. These will be used for further research on the mechanism of disease resistance.
Data Availability Statement
The datasets presented in this study can be found in online repositories. The names of the repository/repositories and accession number(s) can be found below: NCBI BioProject - PRJNA823872.
Author Contributions
YZ and JZ designed and performed the experiments and wrote the manuscript. MF and LW revised the manuscript. YH provided the wild tea plant resources, participated in sample preprocessing, and part of the manuscript writing. FW conceived the experiments and revised the manuscript. All authors contributed to the article and approved the submitted version.
Funding
This study was funded by the National Natural Science Foundation of China (No. 31902077), the Open Fund of Henan Key Laboratory of Tea Comprehensive Utilization in South Henan (No. HNKLTOF2020007), and the Guangdong Provincial Special Fund for Modern Agriculture Industry Technology Innovation Teams (No. 2021KJ120). The funders were not involved in the design of the study, collection, analysis, interpretation of data, and manuscript writing.
Conflict of Interest
The authors declare that the research was conducted in the absence of any commercial or financial relationships that could be construed as a potential conflict of interest.
Publisher's Note
All claims expressed in this article are solely those of the authors and do not necessarily represent those of their affiliated organizations, or those of the publisher, the editors and the reviewers. Any product that may be evaluated in this article, or claim that may be made by its manufacturer, is not guaranteed or endorsed by the publisher.
Acknowledgments
We thank Dr. Xiumin Fu of South China Botanical Garden, Chinese Academy of Sciences and MDPI (https://www.mdpi.com/) for linguistic assistance during the preparation and revision of this manuscript.
Supplementary Material
The Supplementary Material for this article can be found online at: https://www.frontiersin.org/articles/10.3389/fmicb.2022.907962/full#supplementary-material
References
Ahuja, I., Kissen, R., and Bones, A. M. (2012). Phytoalexins in defense against pathogens. Trends Plant Sci. 17, 73–90. doi: 10.1016/j.tplants.2011.11.002
Bazzaz, B., Sarabandi, S., Khameneh, B., and Hosseinzadeh, H. (2016). Effect of catechins., green tea extract and methylxanthines in combination with gentamicin against Staphylococcus aureus and Pseudomonas aeruginosa: combination therapy against resistant bacteria. J. Pharmacopunct. 19, 312–318. doi: 10.3831/KPI.2016.19.032
Becker, R., Ulrich, K., Behrendt, U., Kube, M., and Ulrich, A. (2020). Analyzing ash leaf-colonizing fungal communities for their biological control of Hymenoscyphus Fraxineus. Front. Microbiol. 11, 590944. doi: 10.3389/fmicb.2020.590944
Bonito, G., Reynolds, H., Robeson, M. S., Nelson, J., Hodkinson, B. P., and Tuskan, G. (2014). Plant host and soil origin influence fungal and bacterial assemblages in the roots of woody plants. Mol. Ecol. 23, 3356–3370. doi: 10.1111/mec.12821
Bruisson, S., Zufferey, M., L'Haridon, F., Trutmann, E., and Anand, A. (2019). Endophytes and epiphytes from the grapevine leaf microbiome as potential biocontrol agents against phytopathogens. Front. Microbiol. 10, 2726. doi: 10.3389/fmicb.2019.02726
Chen, W., Gong, L., Guo, Z., Wang, W., Zhang, H., Liu, X., et al. (2013). A novel integrated method for large-scale detection, identification, and quantification of widely targeted metabolites: application in the study of rice metabolomics. Mol. Plant. 6, 1769–1780. doi: 10.1093/mp/sst080
Cole, J. R., Wang, Q., Fish, J. A., Chai, B., McGarrell, D. M., Sun, Y., et al. (2014). Ribosomal database project: data and tools for high throughput rRNA analysis. Nucleic Acids Res. 42, 633–642. doi: 10.1093/nar/gkt1244
Corrêa, J. G. D. S., Bianchin, M., Lopes, A. P., Silva, E., and Santin, S. (2021). Chemical profile, antioxidant and anti-inflammatory properties of Miconia Albicans (Sw.) Triana (melastomataceae) fruits extract. J. Ethnopharmacol. 273, 113979. 113979. doi: 10.1016/j.jep.2021.113979
Cureau, N., Threlfall, R., Marasini, D., Lavefve, L., and Carbonero, F. (2021). Year. location, and variety impact on grape-associated mycobiota of arkansas-grown wine grapes for wine production. Microbial. Ecol. 82,845–858. doi: 10.1007/s00248-021-01705-y
Cushnie, T., and Lamb, A. J. (2011). Recent advances in understanding the antibacterial properties of flavonoids. Int. J. Antimicrob. Ag. 38, 99–107. doi: 10.1016/j.ijantimicag.2011.02.014
Das, M. C., Sandhu, P., Gupta, P., Rudrapaul, P., De, U. C., Tribedi, P., et al. (2016). Attenuation of Pseudomonas aeruginosa biofilm formation by vitexin: a combinatorial study with azithromycin and gentamicin. Sci. Rep. 6, 23347. doi: 10.1038/srep23347
DeBoy, R. T., Mongodin, E. F., Fouts, D. E., Tailford, L. E., Khouri, H., Emerson, J. B., et al. (2008). Insights into plant cell wall degradation from the genome sequence of the soil bacterium Cellvibrio japonicus. J. Bacteriol. 190, 5455–5463. doi: 10.1128/JB.01701-07
Demkura, P. V., and Ballaré, C. L. (2012). UVR8 mediates UV-B-induced Arabidopsis defense responses against Botrytis cinerea by controlling sinapate accumulation. Mol. Plant. 5, 642–652. doi: 10.1093/mp/sss025
El-Hadidy, A., and El-Ati, A. A. (2014). Efficiency of effective microorganisms (EM) to induce resistance against chocolate spot disease and enhance productivity of Faba Bean under reclaimed soil conditions. J. Phytopathol. 42, 117–142. doi: 10.21608/ejp.2014.96742
Escobedo-Martínez, C., Cruz-Morales, S., Fragoso-Serrano, M., Rahman, M. M., Gibbons, S., and Pereda-Miranda, R. (2010). Characterization of a xylose containing oligosaccharide, an inhibitor of multidrug resistance in Staphylococcus aureus, from Ipomoea Pescaprae. Phytochemistry 71, 1796–1801. doi: 10.1016/j.phytochem.2010.06.018
Fang, A., Cao, X., Qu, H., and Wang, S. (2016). Attenuation of oxidative stress of erythrocytes by the plant-derived flavonoids vitexin and apigenin. Evid Based Compl. Alt. 70, 724–732. doi: 10.1691/ph.2015.5665
Frey, M., Chomet, P., Glawischnig, E., Stettner, C., Grün, S., and Winklmair, A. (1997). Analysis of a chemical plant defense mechanism in grasses. Science. 277, 696–699. doi: 10.1126/science.277.5326.696
Gu, S., Yang, T., Shao, Z., Wang, T., and Pommier, T. (2020). Siderophore-mediated interactions determine the disease suppressiveness of microbial consortia. Msystems. 5, e00811–e00819. doi: 10.1128/mSystems.00811-19
Hyun, C. Y.. (2016). The cytoprotective effect of isorhamnetin against oxidative stress is mediated by the upregulation of the NrF2-dependent ho-1 expression in C2C12 myoblasts through scavenging reactive oxygen species and ERK inactivation. Gen. Physiol. Biophys. 35, 145–154. doi: 10.4149/gpb_2015034
Jia, Z., Zou, B., Wang, X., Qiu, J., Ma, H., and Gou, Z. (2010). Quercetin-induced H2O2 mediates the pathogen resistance against pseudomonas syringae pv. tomato DC3000 in Arabidopsis Thaliana. Biochem. Bioph. Res. Co. 396, 522–527. doi: 10.1016/j.bbrc.2010.04.131
Jiang, L., Jeong, J. C., Lee, J. S., Park, J. M., and Lee, J. (2019). Potential of pantoea dispersa as an effective biocontrol agent for black rot in sweet potato. Sci. Rep. 9, 16354. doi: 10.1038/s41598-019-52804-3
Karou, D., Savadogo, A., Canini, A., Yameogo, S., and Traore, A. S. (2006). Antibacterial activity of alkaloids from Sida Acuta. Afr. J. Biotechnol. 5, 195–200. doi: 10.4314/ajb.v4i12.71463
Lareen, A., Burton, F., and Schäfer, P. (2016). Plant root-microbe communication in shaping root microbiomes. Plant Mol. Biol. 90, 575–587. doi: 10.1007/s11103-015-0417-8
Lim, G. H., Singhal, R., Kachroo, A., and Kachroo, P. (2017). Fatty acid- and lipid-mediated signaling in plant defense. Annu. Rev. Phytopathol. 55, 505–536. doi: 10.1146/annurev-phyto-080516-035406
Liu, Z. Q., Ma, L. P., Zhou, B., Yang, L., and Liu, Z. L. (2000). Antioxidative effects of green tea polyphenols on free radical initiated and photosensitized peroxidation of human low-density lipoprotein. Chem. Phys. Lipids. 106, 53–63. doi: 10.1016/S0009-3084(00)00133-X
Luna, E., Pastor, V., Robert, J., Flors, V., Mauch-Mani, B., and Ton, J. (2011). Callose deposition: a multifaceted plant defense response. Mol. Plant Microbe. Interact. 24, 183–193. doi: 10.1094/MPMI-07-10-0149
Lv, H., Yu, Z., Zheng, Y., Wang, L., Qin, X., and Cheng, G. (2016). Isovitexin exerts anti-inflammatory and anti-oxidant activities on lipopolysaccharide-induced acute lung injury by inhibiting mapk and NF-?B and activating HO-1/NrF2 pathways. Int. J. Biol. Sci. 12, 72–86. doi: 10.7150/ijbs.13188
Ma, T., Peng, W., Liu, Z, Gao, T., and Tian, Y. (2020). Teapolyphenols inhibit the growth and virulence of ETEC K88. Microb. Pathogenesis. 152, 104640. doi: 10.1016/j.micpath.2020.104640
Mendes, R., Kruijt, M., Bruijn, I. D., Dekkers, E., and Voort, M. V. D. (2011). Deciphering the rhizosphere microbiome for disease-suppressive bacteria. Science. 332, 1097–1100. doi: 10.1126/science.1203980
Mt, N., Stein, M., BH, H., JP, V., Edwards, H., and Sc, S. (2003). Loss of a callose synthase results in salicylic acid-dependent disease resistance. Science. 301, 969–972. doi: 10.1126/science.1086716
Pallavi, R. V., Nepolean, P., Balamurugan, A., Jayanthi, R., Beulah, T., and Premkumar, R. (2012). In vitro studies of biocontrol agents and fungicides tolerance against grey blight disease in tea. Asian Pac. J. Trop. Bio. 12, 435–438. doi: 10.1016/S2221-1691(12)60202-0
Panke-Buisse, K., Lee, S., and Kao-Kniffin, J. (2017). Cultivated sub-populations of soil microbiomes retain early flowering plant trait. Microb. Ecol. 73, 394–403. doi: 10.1007/s00248-016-0846-1
Parks, D. H., Tyson, G. W., Philip, H., and Beiko, R. G. (2014). STAMP: statistical analysis of taxonomic and functional profiles. Bioinformatics 30, 3123–3124. doi: 10.1093/bioinformatics/btu494
Qiao, Z., and Dixon, R. A. (2011). Transcriptional networks for lignin biosynthesis: more complex than we thought. Trends Plant Sci. 16, 227–233. doi: 10.1016/j.tplants.2010.12.005
Randhawa, P. S.. (1986). Interaction of Xanthomonas campestris pv. pruni with pruniphage and epiphytic bacteria on detached peach leaves. Phytopathology. 76, 549–553. doi: 10.1094/Phyto-76-549
Rath, S. N., Ray, M., Pattnaik, A., and Pradhan, S. K. (2016). Drug target identification and elucidation of natural inhibitors for Bordetella petrii: an In Silico study. Genomics Inform. 14, 241–254. doi: 10.5808/GI.2016.14.4.241
Rhee, Y. J., Han, C. R., Kim, W. C., Jun, D. Y., Rhee, I. K., and Kim, Y. H. (2010). Isolation of a novel freshwater agarolytic Cellvibrio sp. KY-YJ-3 and characterization of its extracellular b-agarase. J. Microbiol. Biotechnol. 20, 1378–1385. doi: 10.4014/jmb.1007.07010
Sattler, S. E., and Funnell-Harris, D. L. (2013). Modifying lignin to improve bioenergy feedstocks: strengthening the barrier against pathogens. Front. Plant Sci. 4, 70. doi: 10.3389/fpls.2013.00070
Schmelz, E. A., Kaplan, F., Huffaker, A., Dafoe, N. J., Vaughan, M. M., Ni, X., et al. (2011). Identity, regulation, and activity of inducible diterpenoid phytoalexins in maize. Proc. Natl. Acad. Sci. U. S. A. 108, 5455–5460. doi: 10.1073/pnas.1014714108
Segata, N., Izard, J., Waldron, L., Gevers, D., Miropolsky, L., and Huttenhower, G. C. (2011). Metagenomic biomarker discovery and explanation. Genome Biol. 12, R60. doi: 10.1186/gb-2011-12-6-r60
Thangaraj, K., Deng, C., Cheng, L. L., Deng, W. W., and Zhang, Z. Z. (2020). Inhibition mechanism of caffeine in tea pathogenic fungi Botryosphaeria Dothidea and Colletotrichum Gloeosporioides. BMC Microbiol. 2020, 1–28. doi: 10.21203/rs.3.rs-27631/v1
Turkmen, N., Sedat-Velioglu, Y., Sari, F., and Polat, G. (2007). Effect of extraction conditions on measured total polyphenol contents and antioxidant and antibacterial activities of black tea. Molecules. 12, 484–496. doi: 10.3390/12030484
Undhad, T., Hati, S., and Makwana, S. (2021). Significance of storage study on ace inhibitory, antioxidative, antimicrobial Activities and biotransformation of isoflavones of functional fermented soy-based beverage. J. Food Process. Pres. 45, e15062. doi: 10.1111/jfpp.15062
Verma, S. K., Kingsley, K., Irizarry, I., Bergen, M., Kharwar, R. N., and White, JF. Jr. (2017). Seed-vectored endophytic bacteria modulate development of rice seedlings. J. Appl. Microbiol. 122, 1680–1691. doi: 10.1111/jam.13463
Wang, F. Y., Huang, Y. J., Wu, W., Zhu, C. Y., Zeng, J. W., and Chen, J. Z. (2020). Metabolomics analysis of the peels of different colored citrus fruits (Citrus reticulata cv. 'Shatangju') during the maturation period based on UHPLC-QQQ-MS. Molecules. 25, 396–411. doi: 10.3390/molecules25020396
Wu, S. T., Shen, D. Y., Wang, R. H., Li, Q. Y., Mo, R. H., Zheng, Y. W., et al. (2021). Phenolic profiles and antioxidant activities of free, esterified and bound phenolic compounds in Walnut Kernel. Food Chem. 350, 129217. doi: 10.1016/j.foodchem.2021.129217
Yamane, H.. (2013). Biosynthesis of phytoalexins and regulatory mechanisms of it in rice. Bioscience Biosci. Biotech. Bioch. 77, 1141–1148. doi: 10.1271/bbb.130109
Yang, C., Kim, S., Yang, G., Mao, L., Liao, J., Chung, J., et al. (1999). Inhibition of carcinogenesis by tea: bioavailability of tea polyphenols and mechanisms of actions. Proc. Soc. Exp. Biol. Med. 220, 213–7. doi: 10.3181/00379727-220-44368
Yang, P. S., Zhang, W., Shen, X. F., Wang, X. L., Li, C., and Gong, X. W. (2016). Two new alkaloids from the seeds of Cassia alata and their bioactivities. Heterocycles. 92, 1706–1712. doi: 10.3987/COM-16-13511
Zhang, F., Sun, X. X., Zhang, X. C., Zhang, S., Lu, J., Xia, Y. M., et al. (2018). The interactions between gut microbiota and entomopathogenic fungi: a potential approach for biological control of Blattella germanica (L.). Pest Manag. Sci. 74, 438–447. doi: 10.1002/ps.4726
Zheng, R., Chen, T. S., and Lu, T. (2011). A comparative reverse docking strategy to identify potential antineoplastic targets of tea functional components and binding mode. Int. J. Mol. Sci. 12, 5200–5212. doi: 10.3390/ijms12085200
Zhou, B., Ma, C., Wang, H., and Tao, X. (2018). Biodegradation of caffeine by whole cells of tea-derived fungi Aspergillus sydowii, Aspergillus niger and optimization for caffeine degradation. BMC Microbiol. 18, 53–63. doi: 10.1186/s12866-018-1194-8
Zielińska-Pisklak, M. A., Kaliszewska, D., Stolarczyk, M., and Kiss, A. K. (2015). Activity-guided isolation, identification and quantification of biologically active isomeric compounds from folk medicinal plant desmodium adscendens using high performance liquid chromatography with diode array detector, mass spectrometry and multidimentional nuclear magnetic resonance spectroscopy. J. Pharmaceut. Biomed. 102, 54–63. doi: 10.1016/j.jpba.2014.08.033
Keywords: wild tea plant resource, Camellia sinensis, Pestalotiopsis theae, microbiome, metabolome
Citation: Zhang Y, Zhang J, Yan C, Fang M, Wang L, Huang Y and Wang F (2022) Metabolome and Microbiome Signatures in the Leaves of Wild Tea Plant Resources Resistant to Pestalotiopsis theae. Front. Microbiol. 13:907962. doi: 10.3389/fmicb.2022.907962
Received: 30 March 2022; Accepted: 23 May 2022;
Published: 15 July 2022.
Edited by:
Javier Veloso, University of A Coruña, SpainReviewed by:
Ashutosh Pandey, National Institute of Plant Genome Research (NIPGR), IndiaRupali Gupta, Agricultural Research Organization, Volcani Center, Israel
Copyright © 2022 Zhang, Zhang, Yan, Fang, Wang, Huang and Wang. This is an open-access article distributed under the terms of the Creative Commons Attribution License (CC BY). The use, distribution or reproduction in other forums is permitted, provided the original author(s) and the copyright owner(s) are credited and that the original publication in this journal is cited, in accordance with accepted academic practice. No use, distribution or reproduction is permitted which does not comply with these terms.
*Correspondence: Feiyan Wang, d2ZlaTA4QDE2My5jb20=; Yahui Huang, eWFodWlodWFuZ3p6QHNjYXUuZWR1LmNu
†These authors have contributed equally to this work