 Arjun Chakrawal
 Salvatore Calabrese
 Anke M. Herrmann
 Stefano Manzoni
- 1Department of Physical Geography, Stockholm University, Stockholm, Sweden
- 2Bolin Centre for Climate Research, Stockholm University, Stockholm, Sweden
- 3Department of Biological and Agricultural Engineering, Texas A&M University, College Station, TX, United States
- 4Department of Soil and Environment, Swedish University of Agricultural Sciences, Uppsala, Sweden
Microorganisms function as open systems that exchange matter and energy with their surrounding environment. Even though mass (carbon and nutrients) and energy exchanges are tightly linked, there is a lack of integrated approaches that combine these fluxes and explore how they jointly impact microbial growth. Such links are essential to predicting how the growth rate of microorganisms varies, especially when the stoichiometry of carbon- (C) and nitrogen (N)-uptake is not balanced. Here, we present a theoretical framework to quantify the microbial growth rate for conditions of C-, N-, and energy-(co-) limitations. We use this framework to show how the C:N ratio and the degree of reduction of the organic matter (OM), which is also the electron donor, availability of electron acceptors (EAs), and the different sources of N together control the microbial growth rate under C, nutrient, and energy-limited conditions. We show that the growth rate peaks at intermediate values of the degree of reduction of OM under oxic and C-limited conditions, but not under N-limited conditions. Under oxic conditions and with N-poor OM, the growth rate is higher when the inorganic N (NInorg)-source is ammonium compared to nitrate due to the additional energetic cost involved in nitrate reduction. Under anoxic conditions, when nitrate is both EA and NInorg-source, the growth rates of denitrifiers and microbes performing the dissimilatory nitrate reduction to ammonia (DNRA) are determined by both OM degree of reduction and nitrate-availability. Consistent with the data, DNRA is predicted to foster growth under extreme nitrate-limitation and with a reduced OM, whereas denitrifiers are favored as nitrate becomes more available and in the presence of oxidized OM. Furthermore, the growth rate is reduced when catabolism is coupled to low energy yielding EAs (e.g., sulfate) because of the low carbon use efficiency (CUE). However, the low CUE also decreases the nutrient demand for growth, thereby reducing N-limitation. We conclude that bioenergetics provides a useful conceptual framework for explaining growth rates under different metabolisms and multiple resource-limitations.
Introduction
Microorganisms (chemoheterotrophs) depend on organic matter (OM) not only as a carbon (C) source but also as an energy source. From a bioenergetics perspective, a single microbial cell can be considered as a system or an “engine” that converts dead OM into living cells. This engine also generates the energy required via an exchange of electrons with the surrounding environment (Roels, 1980a; Kleerebezem and Van Loosdrecht, 2010; Stockar, 2010). Specifically, during growth, microorganisms catabolize OM that generates the electrons (therefore, OM is an electron donor) taken up by terminal electron acceptors (EAs), thereby creating a redox system driven by the changes in Gibbs energy. A fraction of this energy is then utilized by microbial cells for maintaining and producing more cells (anabolism), while the rest is dissipated into the environment (McCarty, 2007; Smeaton and Van Cappellen, 2018; Calabrese et al., 2021). This balance of electrons from the catabolic and anabolic reactions in the form of Gibbs energies frames the bioenergetic theory of microbial growth (Von Stockar et al., 2006; Amend and LaRowe, 2019).
In microbial ecology, energy- and C-limitations are often confounded (Burgin et al., 2011). However, based on the bioenergetic theory of microbial growth, these two controlling factors can be independent, due to the different degree of reduction of the OM (or the energy content of OM), defined as the number of electrons produced per C-mol of OM in a complete oxidation reaction. For example, when C is not limiting, microorganisms growing on glucose would have a higher growth rate compared to oxalate because of the higher number of electrons produced per C-mol of glucose catabolized, which results in higher carbon use efficiency (CUE) (the ratio of growth over C-uptake) (Roels, 1980a; Heijnen et al., 1992). Moreover, how much energy can be extracted from catabolism also depends on which EAs are available. For example, when C is not limiting, the microorganisms that are catabolizing glucose under oxic conditions with oxygen as the EA would have a higher growth rate compared to those under anoxic conditions with iron as the EA (LaRowe and Amend, 2015). Energy-limitation not only reduces microbial growth by decreasing CUE (Roels, 1980a; Heijnen et al., 1992; Bölscher et al., 2016; Calabrese et al., 2021) but also alters microbial physiology (e.g., dormancy) under an extremely low substrate-availability (Lever et al., 2015). We consider a microbial system as energy-limited when the energy content of OM or the availability of thermodynamically preferred EA constrains growth (Lever et al., 2015), whereas it is C-limited when the C content of OM constrains growth. The combinations of C and energy availabilities create a spectrum of conditions ranging from relatively more C- to more energy-limited and (often) with co-limitation of these two resources.
The importance of energy-limitations on OM degradation is often studied in anoxic environments (e.g., marine sediments, groundwater) because of the low availability of high energy yielding EAs (Hoehler and Jørgensen, 2013; Lever et al., 2015; Bradley et al., 2020; LaRowe et al., 2020). However, OM decomposition can also be inhibited by EA or degree of reduction of OM under fluctuating oxic and anoxic conditions found in paddy fields (Fan et al., 2020; Li et al., 2021), wetlands and humid tropical forest soils (Hall et al., 2013; Wang et al., 2017; Bhattacharyya et al., 2018; Calabrese and Porporato, 2019; Lin et al., 2021), and hyporheic zones (Graham et al., 2017; Stegen et al., 2018; Garayburu-Caruso et al., 2020) or along spatial gradients in soil profiles and within aggregates (Ebrahimi and Or, 2016). There is growing interest in the bioenergetic regulation of OM decomposition under anoxic conditions in soils and aquatic systems because of the potential implications for greenhouse gas emissions and C-storage (Keiluweit et al., 2016; Garayburu-Caruso et al., 2020). For example, the formation of anoxic microsites in rapidly fluctuating redox environments in soils could temporarily inhibit the decomposition of more reduced forms of OM, promoting C storage (Boye et al., 2017; Keiluweit et al., 2017).
The chemical composition of OM determines its energy content, but also poses constraints on C-availability as C released via extracellular enzymatic reactions depends on OM chemistry. Reflecting this role, OM chemistry is traditionally used in soil C cycling models to separate C-compartments, but less is known on how the energy content affects microbial processes. Novel molecular methods such as Fourier-transform ion cyclotron resonance (FTICR) mass spectrometry or nuclear magnetic resonance (NMR) characterize the elemental composition of OM to unprecedented levels, posing new challenges on how to incorporate these data into soil C cycling models (Boye et al., 2017; Ding et al., 2020). Recently, Song et al. (2020) presented a substrate explicit decomposition model using data from high-resolution OM characterization that coupled Gibbs energy and C-balance during catabolic and anabolic processes to estimate microbial growth rate. However, such detailed chemical characterization of OM and its effect on metabolism might not be enough to predict changes in microbial growth rates when nutrients are also limited.
Microorganisms are often considered to grow at a fixed chemical composition (homeostatic assumption) so that their ratios of C to other elements do not change when the elemental composition of their substrates varies, at least at the microbial community level (Fanin et al., 2013; Mooshammer et al., 2014b; Schleuss et al., 2019). It is generally assumed that during growth, microorganisms try to meet their nitrogen (N)-demand (i.e., growth rate/microbial C:N) using N from OM (thus releasing excess N via ammonification) and compensate for possible N-imbalances using inorganic N (NInorg)-sources (immobilization). When the supply rate of NInorg is lower than the rate of microbial N-demand, N-limitation ensues (Wutzler et al., 2017). Microorganisms have adapted to deal with N-limited conditions. For example, they could increase the rate of respiration by an overflow respiration mechanism or reduce the uptake of OM by inhibiting extracellular enzyme production (Sistla et al., 2012; Mooshammer et al., 2014a; Manzoni et al., 2021). Depending on the availability of external NInorg and the C:N ratio of OM, stoichiometric theory quantifies the growth rate as conditions shift between C- and N-limitations (Sterner and Elser, 2002; Sinsabaugh et al., 2013; Manzoni et al., 2017). However, how C- and N-limitations vary depending on the energy content of the OM remains to be studied.
Also, the type of NInorg-source controls microbial growth rate. Microorganisms require N in the form of ammonium () for any cell functions (e.g., protein synthesis); therefore, if the NInorg-source is of a more oxidized form such as nitrate () or nitrite (), it must be first reduced to to be used (Stouthamer, 1977; Lin and Stewart, 1997; Kuypers et al., 2018). This reduction reaction has an energetic cost, because some of the electrons from the catabolism of OM must be allocated to the reduction of the N-source.
Therefore, the availabilities of C, N, and energy lead to different patterns of resource-limitation, which affect microbial growth and respiration. For example, Garayburu-Caruso et al. (2020) showed a shift in the regulation of respiration rate from energy- to N-availability for C- vs. N-limited systems under oxic conditions. The respiration rate was thermodynamically regulated because it increased with decreasing degree of reduction of OM as long as N was abundant. In contrast, in N-limited conditions, respiration decreased with the N-content of OM, suggesting that the respiration rate was controlled by N-availability. This result indicates that the energetic constraints on microbial metabolism may become less critical in N-limited systems.
To further complicate the picture, under anoxic conditions, different N compounds such as , , NO, or N2O can act as both EA to drive the catabolism of OM and N-source for microbial growth (Kraft et al., 2014; Kuypers et al., 2018). One such example is the reduction of via denitrification ( to N2) and the dissimilatory nitrate reduction to ammonia (DNRA) ( to ). Indeed, the activity of denitrifiers is higher than that of microorganisms performing DNRA at high NInorg concentrations or in C-limited conditions, where OM already provides N for growth, and vice versa at low NInorg concentrations (Strohm et al., 2007; van den Berg et al., 2016; Putz et al., 2018). These examples illustrate the complex links between C-, N-, and energy-limitations, which we study here from a theoretical perspective (Figure 1).
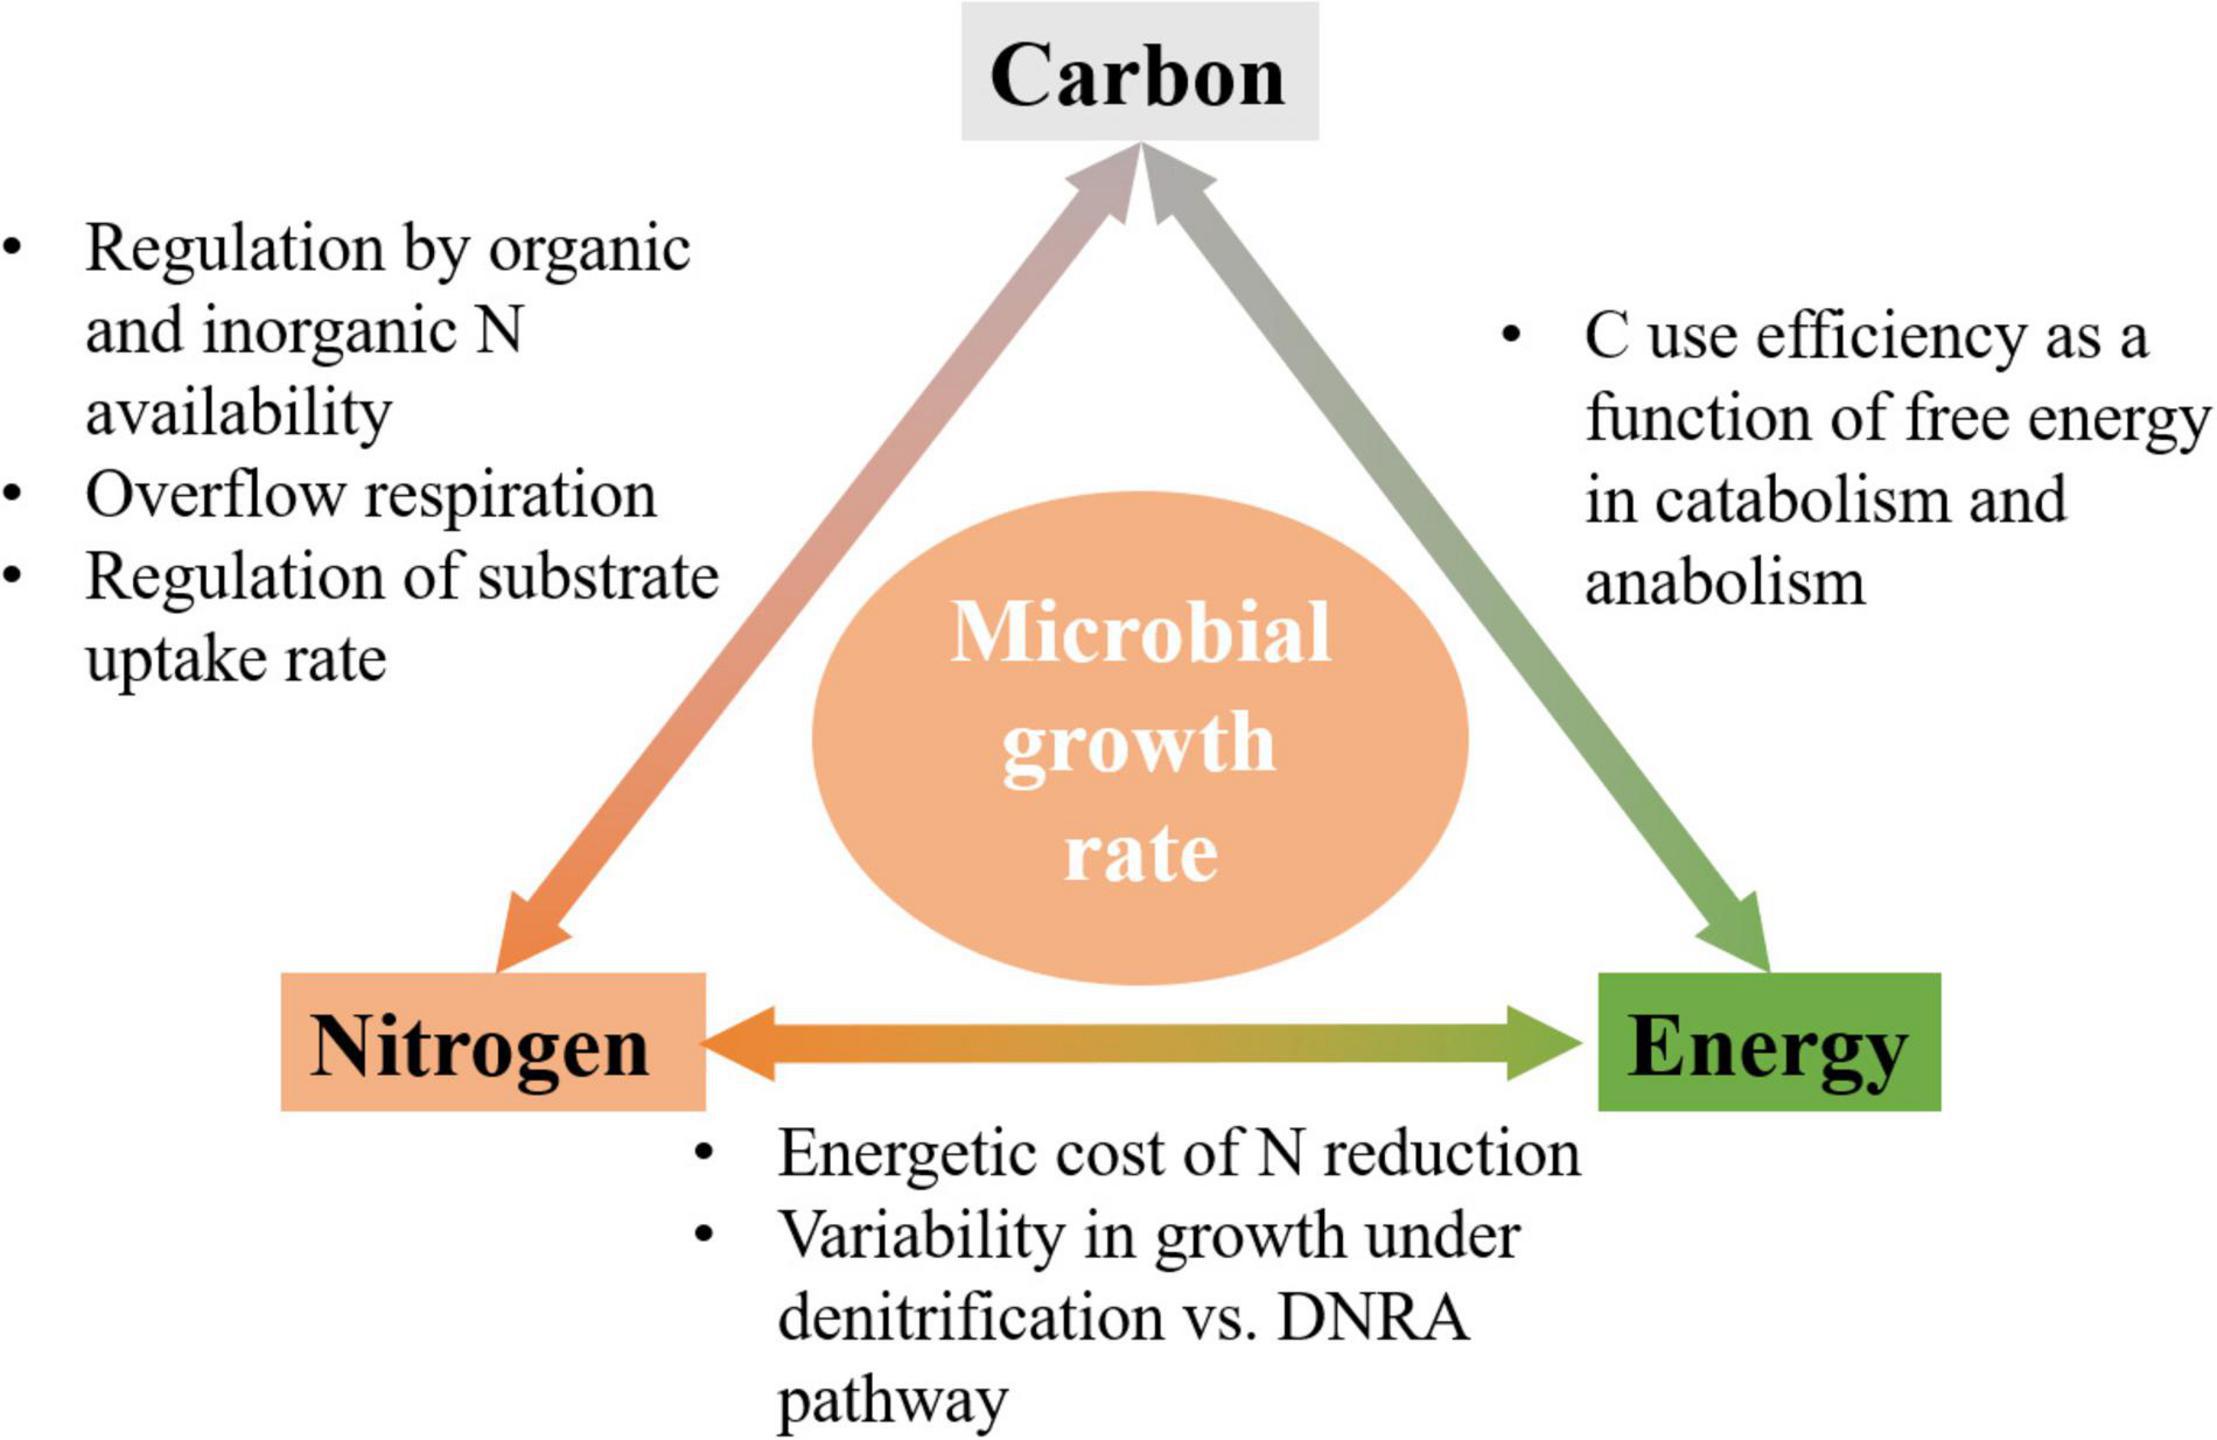
Figure 1. Schematic of links among C, N, and energy flows, and mechanisms by which they affect microbial growth rate.
In this contribution, we build on the existing bioenergetics and stoichiometry theories to develop a theoretical framework for microbial growth under combined C–N–energy limitations. In particular, by integrating stoichiometry and bioenergetic theory of microbial growth, we present a generalized description of microbial growth rate [extending the work by Song et al. (2020)] and address the following questions:
1. Carbon-limitation vs. energy-limitation: What are the effects of OM degree of reduction and EA energy yield on microbial growth?
2. Nitrogen-limitation vs. energy-limitation: What are the effects of different NInorg ( or )-sources or using NInorg () as both EA and N-source on microbial growth?
3. Carbon-, Nitrogen-, and energy-limitations: What are the effects of combined thermodynamic (OM degree of reduction and EA energy yield) and biogeochemical factors (OM C:N ratio and NInorg-availability) on microbial growth?
After addressing these questions, we discuss the importance of accounting for limitations in C, N, and energy to explain the variability in growth rate across environmental conditions.
The C-, N-, and Energy-Limitations of Microbial Growth
General Assumptions and Macrochemical Equations
Microorganisms are open systems that constantly exchange matter and energy with their surroundings, thereby requiring a non-equilibrium approach to study their dynamics (Prigogine, 1967; Westerhoff et al., 1982; Ornes, 2017). The rates of transformation of mass in a non-equilibrium system depend on the Gibbs energy change, as opposed to systems in equilibrium where the Gibbs energy change mainly describes the feasibility of a process (Bauchop and Elseden, 1960; Jin and Bethke, 2007; LaRowe et al., 2012). Additionally, the coupling of catabolic and anabolic processes is energy dependent, making the microbial CUE a function of the Gibbs energy changes (von Stockar et al., 2008). While we do account for the energy-limitation on CUE, we neglect thermodynamic constraints on microbial-uptake rate (Boudart, 1976; Jin and Bethke, 2007; LaRowe et al., 2012). These constraints are at play only at very low C-availabilities, when only microbial maintenance demand can be met (Hoehler and Jørgensen, 2013; Bradley et al., 2020)—these severely C- and energy-limited systems are not considered here, where we instead focus on conditions that allow for microbial growth.
For simplicity, we take a bioenergetic (macrochemical) perspective on microbial growth and describe growth via the coupling of catabolic and anabolic reactions instead of describing individual metabolic pathways. Catabolic and anabolic reactions can be further broken down in several chains of reactions (LaRowe and Amend, 2015, 2016, 2019); however, we simplify the problem and only consider the overall reactants and products, i.e., oxidation of a single OM in catabolism and biosynthesis in anabolism. We assume that an extracellular breakdown of polymeric OM has already occurred, and the microorganisms take up low molecular weight OM available in the surroundings of their cells. Moreover, we assume that homeostasis for microbial growth, i.e., the microorganisms are described as a chemical entity (denoted by B) with fixed elemental ratios [we assumed a microbial biomass C:N ratio CNB = 5, Roels (1980a)]. If OM contains N, then microbial N-demand is first met by taking up the organic N-source; otherwise, an external NInorg-source must be immobilized (Manzoni et al., 2017; Wutzler et al., 2017). As microbes require N in the form of , more oxidized forms of the NInorg-source must be reduced to before being converted into biomass (Tiedje et al., 1981).
Microorganisms use OM that acts as both electron donor and C-source with a given C:N ratio (CNOM) and degree of reduction (γOM). For a given NInorg-source and EA, we can write a general metabolic equation for microbial growth as follows:
where are the stoichiometric coefficients of the reactant and product species, NInorg is the inorganic N source, eis the CUE, and OMox and EAred are the oxidized and reduced forms of electron donors (OM) and acceptors, respectively (all symbols are listed and explained in Table 1). For example, under oxic conditions with O2 as the EA, bicarbonate ion and water are OMox and EAred, respectively.

Table 1. List of symbols and acronyms with their descriptions and units.
When EA and the NInorg-source are the same such as in denitrification or DNRA pathways, the metabolic equation for microbial growth can be written as follows:
where yN is the stoichiometric coefficient of the NInorg-source, which is different in Eqs. (1) and (2). In denitrification or DNRA pathways, the N-source is which is reduced to EAred; i.e., either N2 or , respectively. Note that to balance the chemical reactions throughout the text, H+ and H2O with appropriate stoichiometry must be added on either side; however, including H+ and H2O is not necessary for our purposes, so we only balance C and N in the reactions. After defining the reaction rate (section “Microbial Growth Rate Under C- and N-Limitations”), in section “Bioenergetics of Microbial Growth” we formulate the stoichiometric coefficients of Eqs. (1) and (2) as the functions of microbial and OM C:N ratios, and the degrees of reduction of biomass, OM, and EA. In this way, these coefficients are calculated under a range C-, N-, and energy-limited conditions. A schematic of the bioenergetic framework is provided in Figure 2.
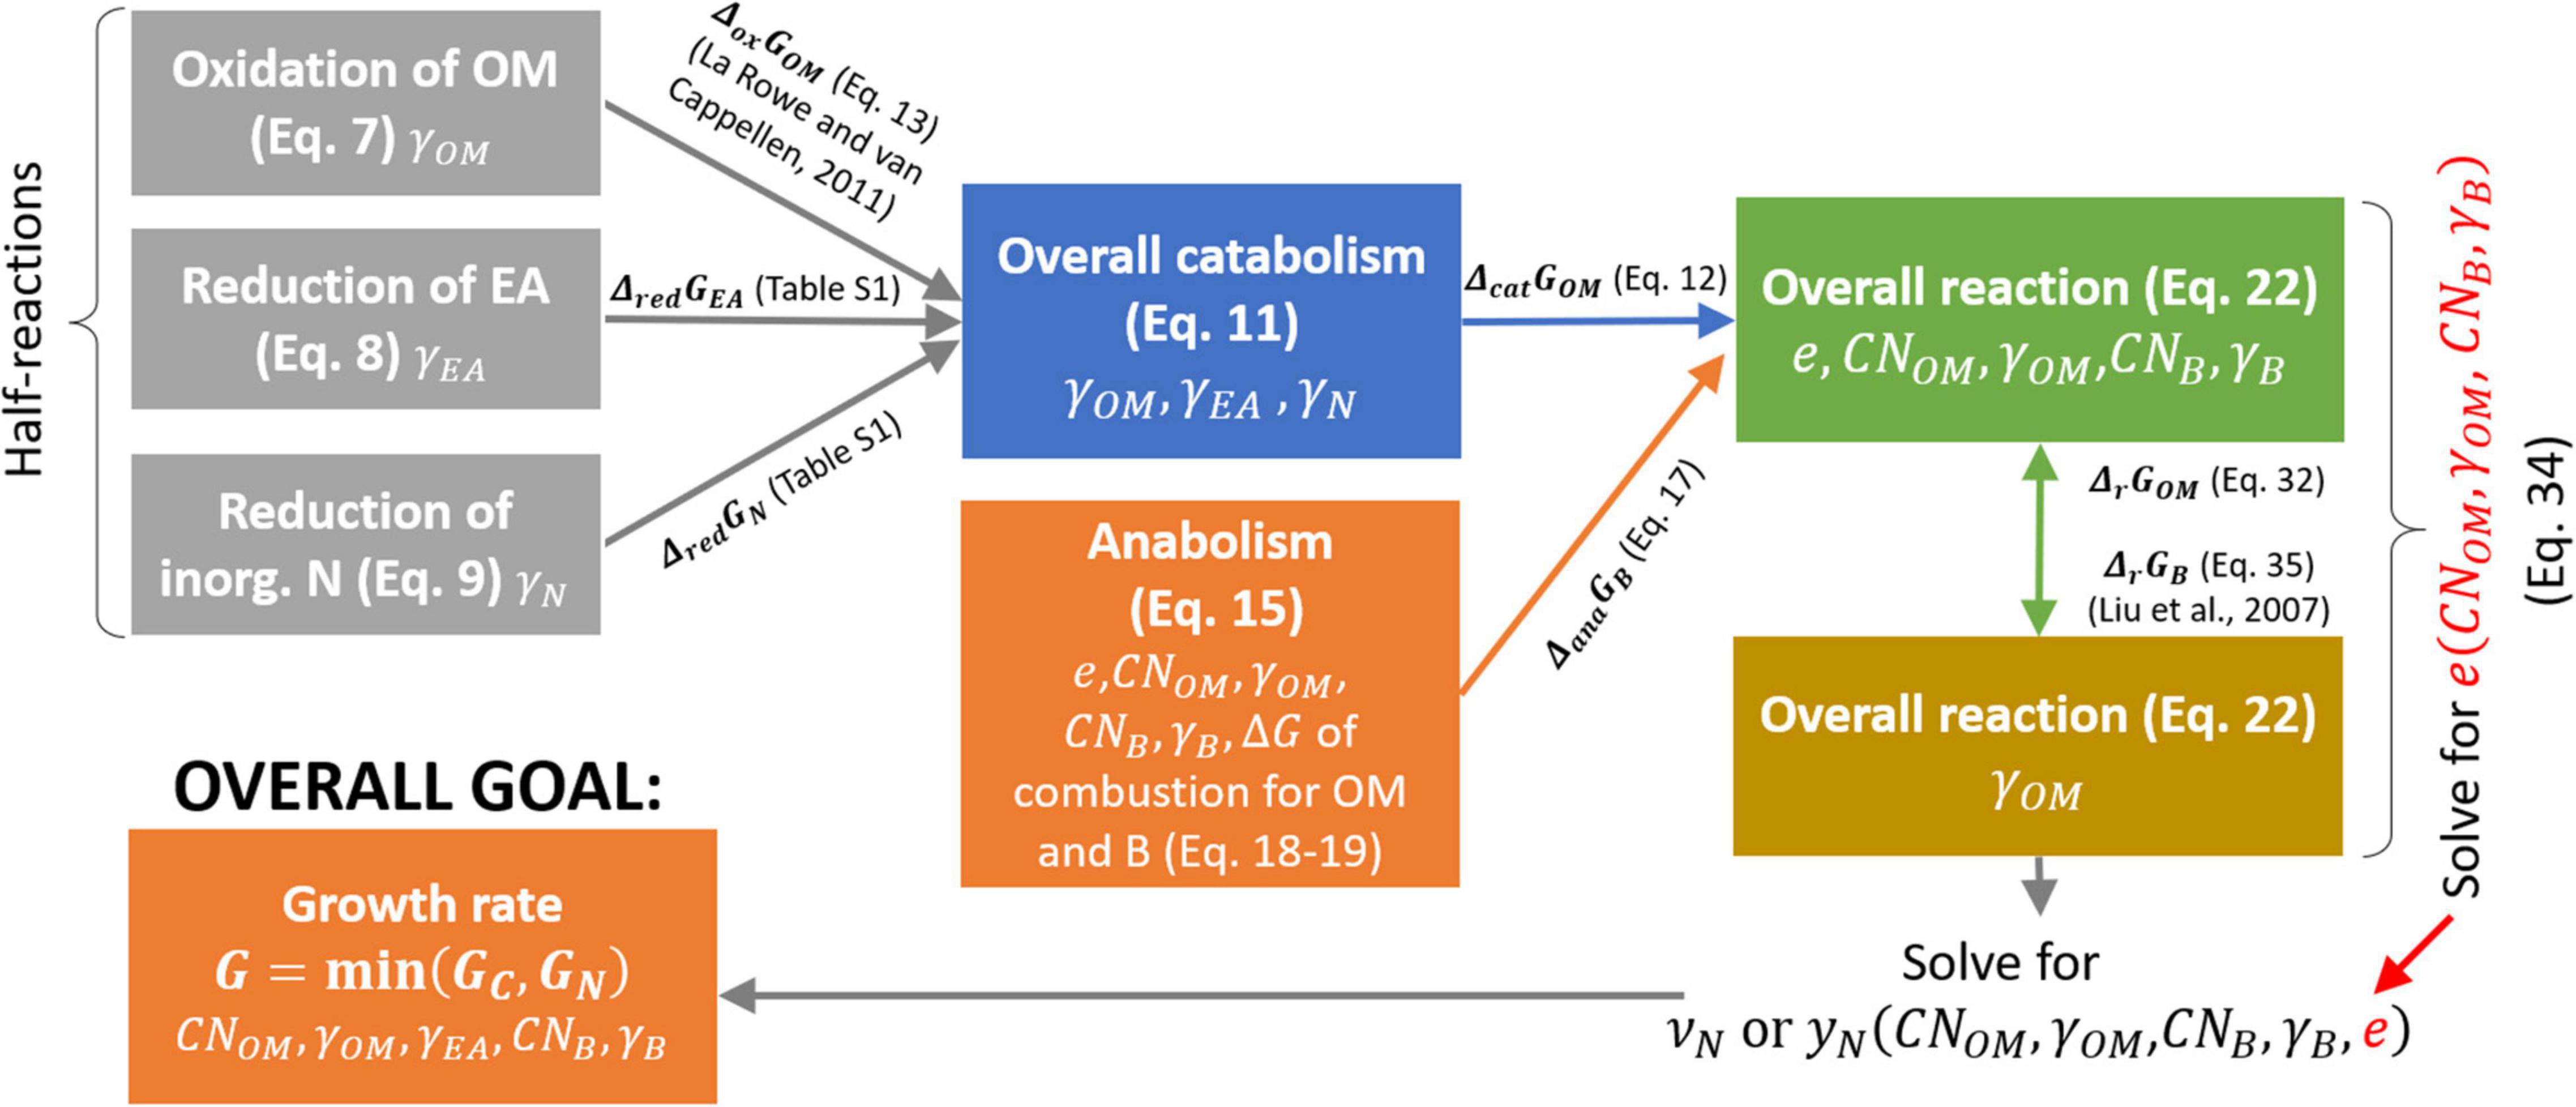
Figure 2. Roadmap for the calculation of normalized microbial growth rate (G) as a function of OM and microbial C:N ratios (CNOM and CNB, respectively), and degrees of reduction of OM, EA, and biomass (γOM,γEA,and γB, respectively). Each box refers to a half or overall reaction (with equation number in brackets) and includes the parameters affecting the reaction stoichiometry (listed at the bottom of each box). Arrows represent the changes in Gibbs energy associated to each half reaction, which is then used to calculate the changes in Gibbs energy of the overall reactions. Symbols are defined in Table 1.
Microbial Growth Rate Under C- and N-Limitations
Using the metabolic Eqs. (1) and (2), we now formulate the microbial growth rate under C- and N-limited conditions by integrating stoichiometry theory and bioenergetics. As Eqs. (1) and (2) are written with respect to the uptake of 1 C-mol of OM, the rate of reaction is the same as the uptake rate of OM, denoted in C-limited conditions as UOM with units of C-mol OM day–1. The microbial growth rate GC under C-limitation can be written as follows:
where the subscript C in GC denotes microbial growth rate under C-limitation, and eis the maximum CUE without considering maintenance costs (as mentioned above, we focus on conditions where growth can occur and maintenance respiration is relatively small). When the NInorg-source is a limiting reactant, then the metabolic reaction rate is controlled by the N supply, and growth becomes N-limited. By dividing Eqs. (1) and (2) with the stoichiometric coefficient of the NInorg-source (νN or yN) and taking the rate of NInorg supply as the rate of the metabolic reaction, we can write the microbial growth rate under N-limited condition as follows:
where the subscript N in GN denotes growth rate under N-limitation, and IN is the rate of supply of the NInorg-source. Note that the units of GC and GN are the same, C-mol B day–1.
A general form of microbial growth rate (G) can then be written by taking the minimum of GC and GN as defined by Eq. (5) (Liebig’s law),
Here, we do not focus on the functional form of uptake kinetics, rather on using bioenergetics to model growth rate and stoichiometric constraints for given UOM. Hence, we normalize by UOM both growth rate and NInorg uptake rate . As a result, the non-dimensional growth rate becomes
In the following sections, we consider the coupling of catabolic and anabolic reactions based on their Gibbs energy balances, and account for the energy cost to reduce NInorg to estimate both CUE and the stoichiometric coefficient for NInorg (“overall goal” in Figure 2).
Bioenergetics of Microbial Growth
The two general reactions in Eqs. (1) and (2) are here broken down into catabolic and anabolic reactions, and these are further broken down into oxidation and reduction half-reactions (Figure 2). This detailed formulation allows calculating the stoichiometric coefficients in Eqs. (1) and (2) as a function of OM and N-source characteristics.
Catabolism of Organic Matter
Without the loss of generality, the macrochemical catabolic reaction is formulated for one C-mol of OM. When OM does not contain any N or have high C:N ratios (N-limited), microorganisms immobilize NInorg from the environment. If this NInorg-source is not , then some of the electrons produced from the oxidation of the OM [Eq. (7)] must be allocated to the reduction of the NInorg-source. This allocation is often performed by intracellular electron carrier proteins, either NADP(H) or ferredoxins (Bloom, 2010). Therefore, the energetic cost of the reduction of the NInorg-source to ammonium must be accounted for in the catabolic reaction. The catabolic reaction is formulated by considering the half-reaction of oxidation of OM and reduction of EA and NInorg. To keep the formulation general, we separately consider the redox reactions for OM and EAs (top left in Figure 2).
The half-reaction of oxidation of the OM can be written as follows:
where OMox is the oxidized form of OM, 1/CNOM is the stoichiometric coefficient for released during the oxidation, γOM is the degree of reduction of the OM, and ΔoxGOM [kJ (C-mol OM)–1] is the change in Gibbs energy of the oxidation reaction. Note that for all Gibbs energy changes, the subscript of Δ indicates the reaction and the subscript of G is the substance per unit of which the Gibbs energy is reported. For simplicity, we assume that OMox is always bicarbonate and catabolism does not produce any other organic product.
Next, the reduction half-reaction of a generic EA can be written as follows:
where γEA is the number of moles of electron received by the EA, EAred is the reduced form of EA (e.g., H2O in case of O2), and νEAred is its stoichiometric coefficient; ΔredGEA [kJ (mol EA)–1] is the change in Gibbs energy of the reduction reaction. A list of commonly occurring half-reactions of reduction of EAs is provided in Supplementary Table 1.
Next, the reduction of the NInorg-source to ammonium is given by
where γN and ΔredGN are, respectively, the number of moles of electrons accepted when reducing 1 N-mol of NInorg-source and the change in Gibbs energy of the reaction to reduce the N-source. For as NInorg-source, no reduction would be required and γN = 0. The amount of N-source reduced to depends on the microbial N-demand for growth, which in turn depends on the CUE and the C:N ratio of the OM. If xN is the number of moles of NInorg reduced to , xN × γN moles of electron per mol of OM must be transferred from the oxidation of OM to the reduction of the N-source in Eq. (9).
Finally, the catabolic reaction is obtained by adding the three half-reactions, Eqs. (7)–(9), and adjusting the stoichiometric coefficients so that the electrons are balanced (top center of Figure 2),
where is the stoichiometric coefficient of the EA; ΔcatGOM [kJ (C-mol OM)–1] is the amount of Gibbs energy released by catabolizing 1 C-mol of OM for a given EA. Similar to Eq. (11), ΔcatGOM is given by summing the Gibbs energy of the three half-reactions, Eqs. (7)–(9), multiplied by appropriate stoichiometric coefficients.
In principle, ΔcatGOM can be calculated directly from Eq. (11) using Hess’s law, if the involved species and their chemical formulae are known. However, such information is often not known, as in the case of plant residues or soil OM. Using Eq. (12) is advantageous because the change in Gibbs energy of oxidation of OM can be estimated based on its degree of reduction γOM, as proposed by LaRowe and Van Cappellen (2011),
The empirical formulation of ΔoxGOM in Eq. (13) holds under standard conditions, therefore it needs to be modified under non-standard OM aqueous concentrations [for more details, see LaRowe et al. (2012) and Song et al. (2020)]. The γOM of 1 C-mol of OM is estimated based on the OM chemical formula as follows:
where ni for i = C, H, N, or O are the numbers of theith element and z is the overall charge in the chemical formula of OM. While the actual values of γOM can be calculated from the chemical formula of OM, here we explore a range of values from 0 (least reduced, CO2) to 8 (most reduced, CH4), to cover the whole spectrum of organic compounds.
The change in Gibbs energy of the reduction reactions (ΔredGEA and ΔredGN, Supplementary Table 1) are calculated using standard Gibbs energy of formation listed in Supplementary Table 3. With this information, ΔcatGOM can be estimated from the degree of reduction of the OM. An example of the calculations for the catabolism of glycine with as both EA and the N-source, and of glucose with O2 as the EA and as the N-source, are provided in Supplementary Table 2.
Anabolism of Microbial Biomass
Energy from catabolism is then transferred to the anabolism to support the synthesis of new biomass (center of Figure 2). Here, we formulate a generic reaction for the anabolism (biosynthesis) for 1 C-mol of microbial biomass. There are multiple ways of writing a macrochemical representation of an anabolic reaction (von Stockar et al., 2008; Battley, 2009; Kleerebezem and Van Loosdrecht, 2010). We follow Battley (2009), who simplifies Gibbs energy calculations by neglecting EA in anabolism. Briefly, 1 C-mol of biomass is formed from the same organic C used in catabolism and as the N-source [other N-sources are reduced to before being used, Eq. (9)]. Further, a degree of reduction balance is used to balance the electrons, and the imbalance of C is balanced by adding OMox(i.e., bicarbonate) to either side of the reaction. Thus, the anabolic reaction for an OM with given CNOM can be written as follows:
where γB = 4.2 is the degree of reduction of the microbial biomass and ΔanaGB is the change in Gibbs energy of anabolism. Balancing N on both sides yields the stoichiometric coefficient of the N-source (i.e., ),
The value of ΔanaGB [kJ (C-mol B)–1] is estimated by writing the Gibbs energy balance of Eq. (15), as follows:
where ΔCGOM and ΔCGB are the changes in Gibbs energy of combustion for a given EA. Note that we have used combustion as the reference state so that only the organic C appears in Eq. (17).
To find ΔCGOM and ΔCGB, we can regard a catabolic reaction as analogous to a combustion reaction when a NInorg-source is not included. Therefore, for xN = 0 and O2 as the EA, Eq. (11) represents the complete combustion of an organic C compound to CO2. Thus, from Eqs. (12) and (13), we obtain ΔCGOM and ΔCGB as follows:
Now, from Eqs. (17)–(19), we obtain ΔanaGB as follows:
Examples of the anabolic reaction on glycine and glucose are provided in Supplementary Table 2.
Overall Metabolic Reaction
The overall metabolic reaction is obtained by summing the catabolic and anabolic reactions so that 1 C-mol of OM is used to form e C-mol of biomass (right of Figure 2). Thus, multiplying the catabolic reaction Eq. (11) by and the anabolic reaction Eq. (15) by e, and summing these reactions, gives the overall metabolic reaction of microbial growth as follows:
In Eq. (22), ΔrGOM is the Gibbs energy change for the overall metabolic reaction, and νi are the stoichiometric coefficients of each reaction species (i = EA, EAred, , NInorg). Equation (22) thus recovers the form of Eqs. (1) or (2), but now all stoichiometric coefficients can be determined as a function of the degrees of reduction of OM, EA, and biomass, and the C:N ratios of OM and biomass,
In Eqs. (23)–(26), xN is not known, but it can be calculated by setting νNH4 = 0, because used for microbial growth is already accounted for in the stoichiometric coefficient of the N-source. Thus, setting νNH4 = 0 yields the following:
The expressions for νEA and νN can now be simplified by inserting xN in Eqs. (23) and (25), which are expressed as follows:
Equations (28) and (29) can be used to assess N-demand for microbial growth under oxic or anoxic conditions for any EA. Under C-limited, oxic conditions and assuming is the N-source, the rate of N-uptake, νNUOM, is the same as given by Manzoni et al. (2017). By setting Eq. (29) equal to zero, we can calculate the threshold C:N ratio of the OM at which no is formed or immobilized. Above this C:N ratio—often called threshold elemental ratio (TER)—microbial growth becomes limited by the supply of organic N, which is expressed as follows:
If CNOM < TER, then νN > 0 and net release of occurs (i.e., net N mineralization), whereas if CNOM > TER, then νN < 0 and net uptake of occurs (i.e., net immobilization). Moreover, if the supply of NInorg, IN, cannot sustain the required rate of immobilization, the microbial growth rate is determined by the rate of supply of the external NInorg-source; this condition is denoted as N-limitation (net required immobilization rate > IN). Under N-limited conditions, microorganisms reduce the C-uptake rate, thereby decreasing their growth rate so that N-demand matches NInorg-availability (i.e., IN). Mathematically, the reduction in UOM is obtained from Eq. (6) as a function of the stoichiometry of N in the overall metabolic reaction, which in turn is a function of CNOM and Inorm.
If EA and NInorg-source are the same (i.e., ), such as during denitrification or DNRA, N is used for both oxidation of OM and microbial N-demand for growth; therefore, N-limitation would affect both uptake of OM and microbial growth. Thus, the total amount of N used [yN in Eq. (2)] is given as the sum of νEA and νN, as follows:
Examples of the overall metabolic reaction on glycine and glucose are provided in Supplementary Table 2.
Gibbs Energy Change of Metabolic Reaction and Carbon Use Efficiency
The change in Gibbs energy of the metabolic reaction, ΔrGOM [kJ (C-mol)–1 OM], can be obtained by adding catabolic and anabolic reactions as done in Eq. (21), and can be written as follows:
Equation (32) can be used to estimate ΔrGOM knowing the CUE, or inversely it can be used to estimate CUE if ΔrGOM is known. It has been shown that the energy dissipated from microbial systems can be predicted by the degree of reduction of the OM, γOM (Heijnen and Dijken, 1992; Liu et al., 2007). However, these formulations are based on the Gibbs energy dissipated to produce 1 C-mol of biomass (ΔrGB); therefore, we divide Eq. (32) by CUE and obtain the following:
where , ΔcatGOM is given by Eq. (12), and ΔanaGB by Eq. (20). Simplifying the above equation to obtain CUE as a function of Gibbs energies yields the following:
Finally, the only remaining unknown in Eq. (34) is ΔrGB, which is given by Liu et al. (2007) as follows:
It is clear from Eqs. (12), (20), and (35) that the microbial CUE depends mainly on the degree of reduction of the OM and microbial biomass, and the type of EAs. Note that in Eq. (34), ΔcatGOM is also a function of e, making Eq. (34) an implicit non-linear equation in e, which therefore needs to be solved numerically. An example of metabolic reaction on glycine and glucose is presented in Supplementary Table 2.
We assumed standard conditions for calculating Gibbs energy, so that the stoichiometry of the metabolic reactions is also representative of standard conditions, i.e., species concentrations are at 1 mol L–1, pH 7, temperature of 298 K, and pressure of 1 bar. In a dynamic system, changing concentrations of the involved species, pH, or temperature would change the Gibbs energy of metabolic reactions, and thus also the stoichiometric coefficients of such reactions. Our framework can be generalized by including the effects of non-standard conditions as shown in previous work (Kleerebezem and Van Loosdrecht, 2010; LaRowe and Amend, 2015, 2016; Delattre et al., 2019).
To summarize the theory section, we started with a general description of microbial growth rate under C- or N-limited conditions (section “Microbial Growth Rate Under C- and N-Limitations”). The stoichiometric coefficients needed to calculate growth rate are estimated by splitting the overall metabolic reaction into catabolic and anabolic parts and considering their Gibbs energies (sections “Catabolism of Organic Matter” and “Anabolism of Microbial Biomass”). Finally, the stoichiometric coefficients of the metabolic reaction—mainly CUE (e)—and of N-uptake (vN or yN) were constrained using bioenergetics (sections “Overall Metabolic Reaction” and “Gibbs Energy Change of Metabolic Reaction and Carbon Use Efficiency”). Table 2 summarizes some simplifications of νEA, vN, and yN under specific conditions for the OM; e.g., when OM contains N or when EA and NInorg-source are both .
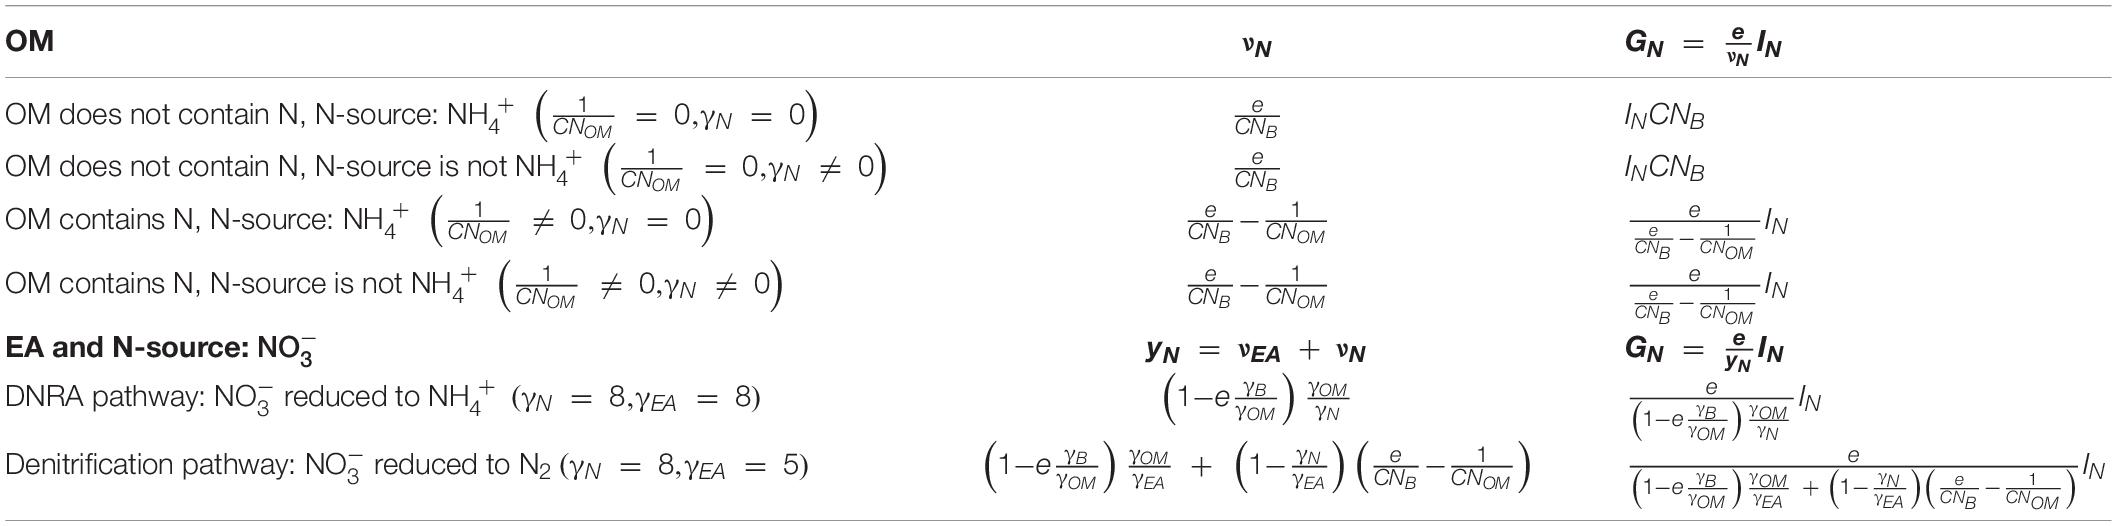
Table 2. Values of the stoichiometric coefficients for the N-source (νN) and microbial growth rate (GN), for various types of OM and NInorg-sources.
Results
First, we studied the interactions between C- and energy-limitations, showing how the degree of reduction of the OM and the energy-availability from the reduction of the EA (ΔredGEA) affect the growth rate (section “Interactions Between C- and Energy-Limitations”). Second, we investigated the interactions among C-, N-, and energy-limitations (section “Interactions Among C-, N-, and Energy-Limitations”), when the OM either does not contain N (section “Microbial Growth on Organic Matter Without N”) or it does (section “Microbial Growth on Organic Matter Containing N”). In section “Microbial Growth on Organic Matter Without N,” we showed how the degree of reduction of the OM under oxic conditions and different NInorg-sources ( and ) and N availabilities affect the microbial growth rate. Next, we focused on growth rate under anoxic conditions when is both EA and N-source; in this case, is reduced to via either DNRA or denitrification pathway. In section “Microbial Growth on Organic Matter Containing N,” we studied the microbial growth rate along a gradient of organic N from OM and NInorg-availability. In this case, we used as N-source, but calculated the growth rate under a range of EAs such as O2, Fe3+ (goethite), Fe3+ (ferrihydrite), and (sulfate). For simplicity, in section “Interactions Among C-, N-, and Energy-Limitations,” we have further assumed that the availability of EA does not limit microbial growth.
Interactions Between C- and Energy-Limitations
In general, when N is not limiting, the normalized growth rate (Gnorm = e) increases with increasing degree of reduction of OM (γOM), except at the high values of γOM, when it can also decrease (Figure 3). For a given γOM, Gnorm also increases proportionally to the change in Gibbs energy of the EA reduction Δred[GEA in kJ (e− mol)–1] (different line colors in Figure 3). Within these general trends, specific interactions between γOM and ΔredGEA emerge. Under energy rich conditions; i.e., high values of both γOM and |−ΔredGEA| (e.g., brown curve), the normalized growth rate is maximum because of high CUE. Under energy-limited conditions, the growth increases with increasing γOM as long as γOM < 4.7, but for γOM > 4.7, the growth rate starts decreasing when catabolism is coupled with low energy yielding EA (low values of |−ΔredGEA|; e.g., orange curve). These combined trends cause the growth rate to attain a peak at an intermediate γOM (blue–red curves). To summarize, purely C-limited conditions only occur at high γOM and |−ΔredGEA|, while the energetic constraints are at play in all other cases.
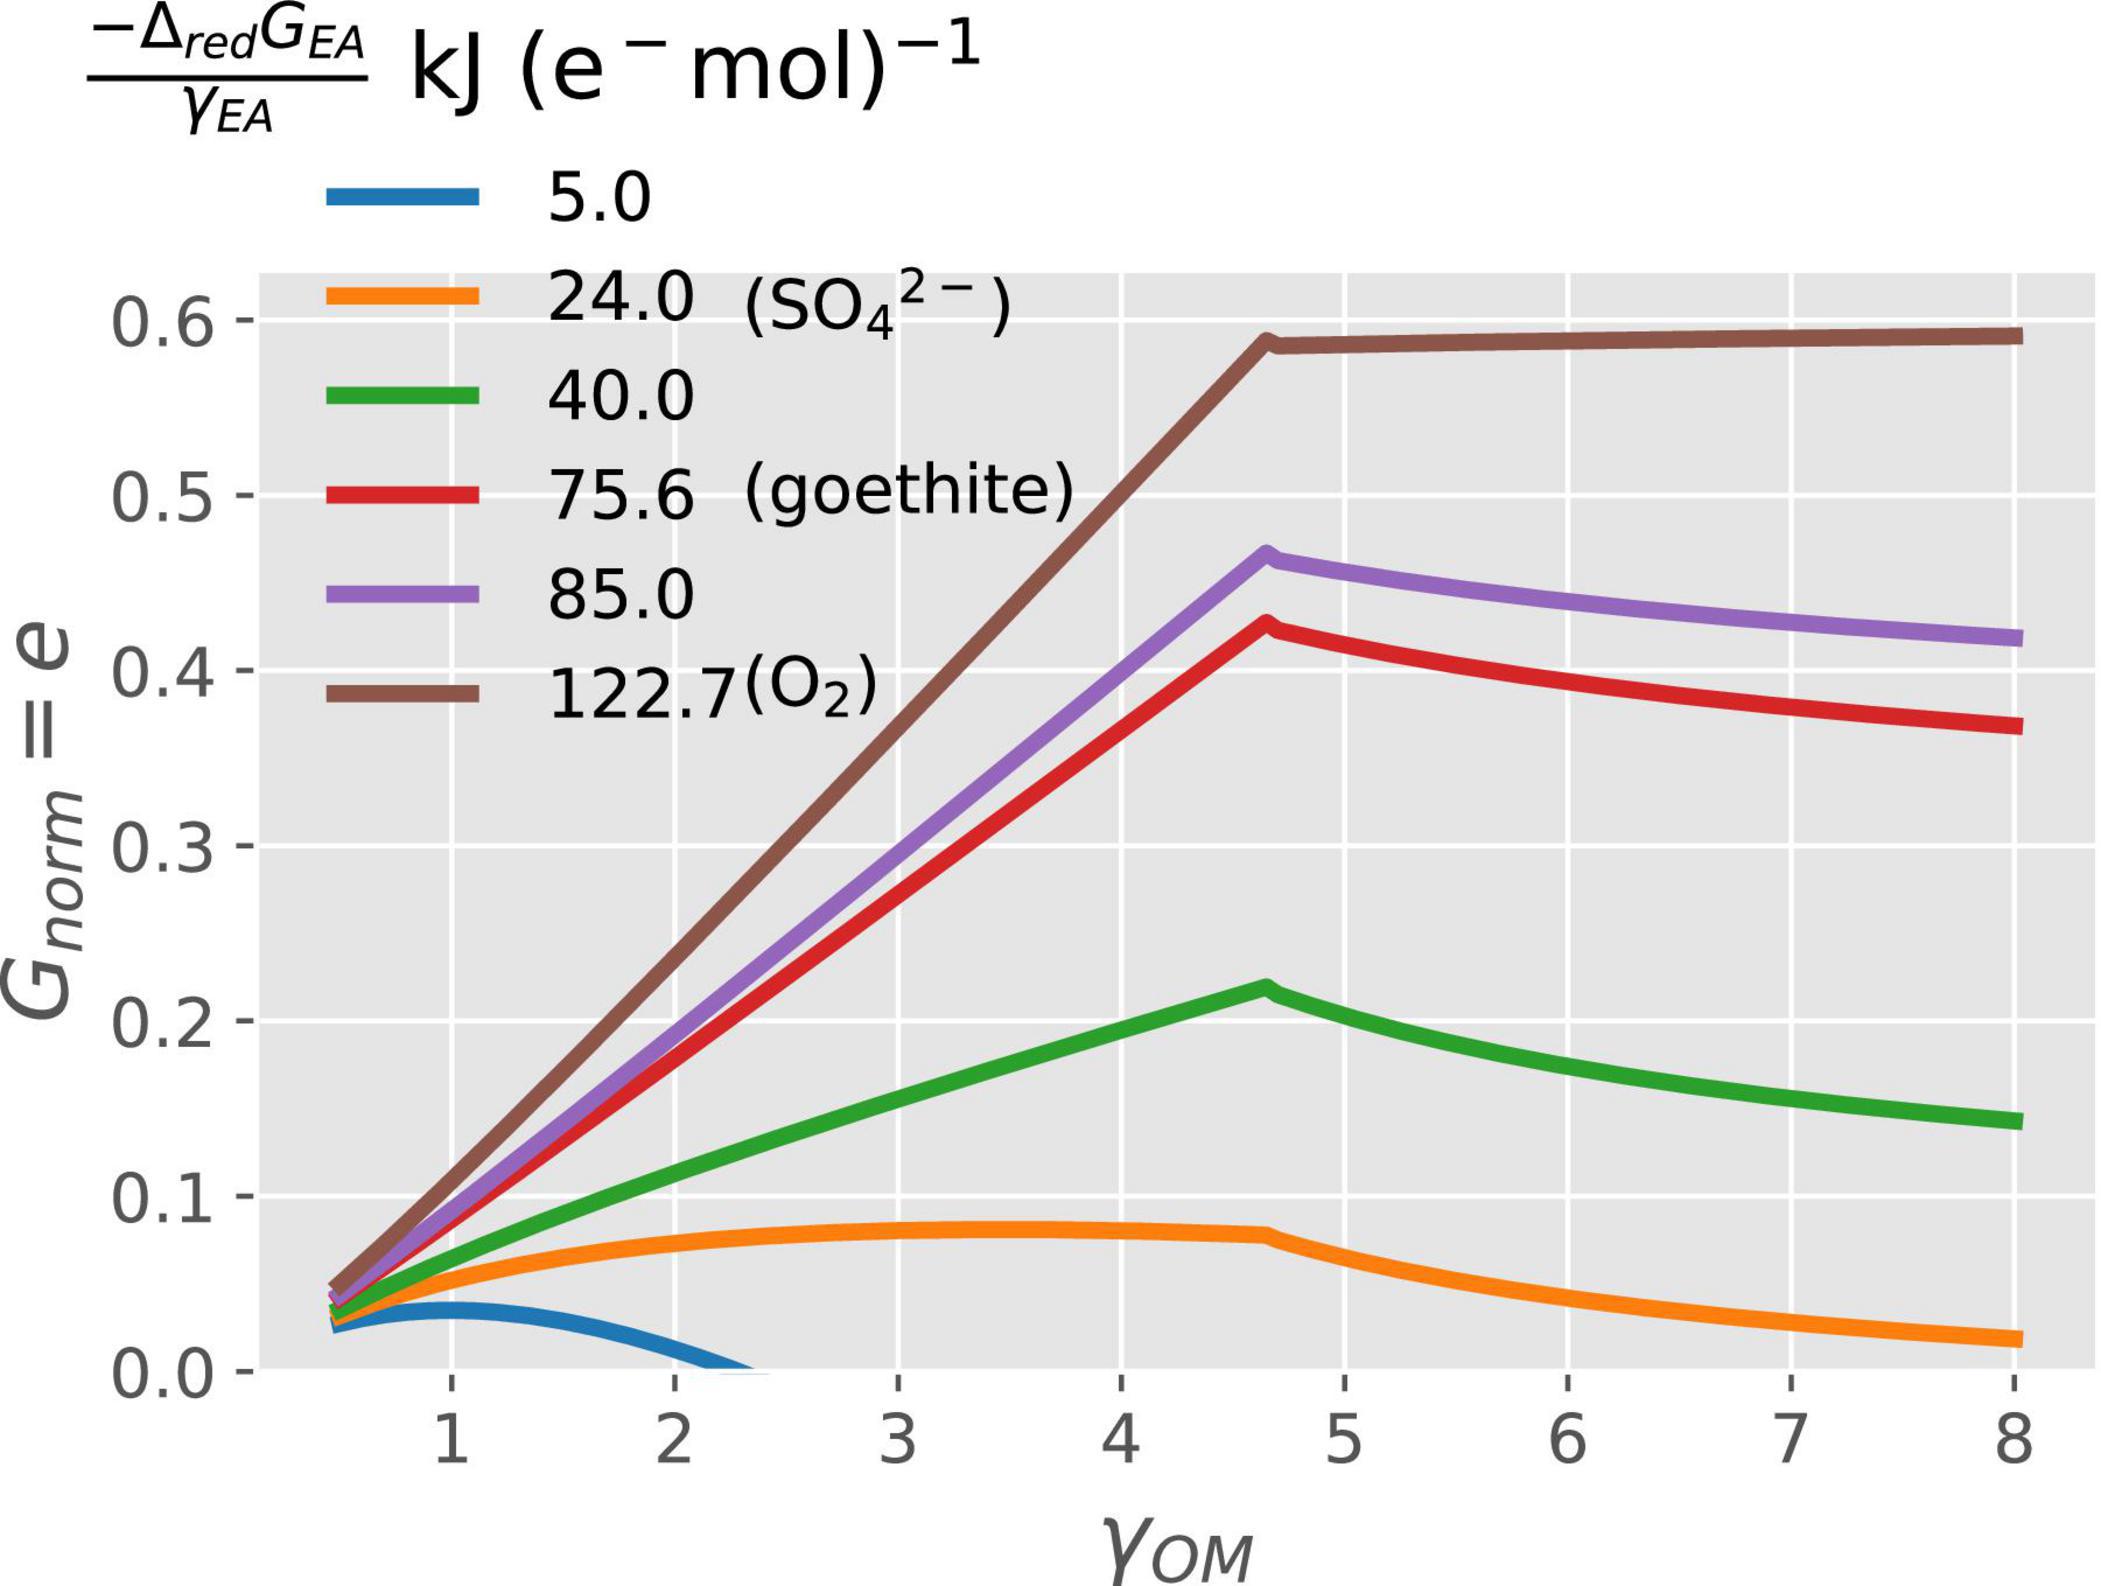
Figure 3. Variation of normalized growth rate (Gnorm) with the degree of reduction of the OM (γOM on the x-axis) and energy available from the reduction of EA (ΔredGEA; curves with different colors).
Interactions Among C-, N-, and Energy-Limitations
Microbial Growth on Organic Matter Without N
Figure 4 shows how the normalized microbial growth rate varies under C-limitation vs. N-limitation under oxic conditions. At high N-availability (high values of Inorm), microbes are C-limited and the normalized growth rate only depends on the CUE. In turn, the CUE increases with a higher degree of reduction of the OM, causing the growth rate to increase with γOM (lines with different colors), as also shown in Figure 3. In contrast, at low N-availability (low values of Inorm), microbes are N-limited and their growth is constrained by Inorminstead of CUE. As a consequence, N-limited growth is independent of the degree of reduction of the OM (Table 2). When microbes are supplied with an NInorg-source other than , the energetic cost for reduction to reduces the CUE [dashed vs. solid lines in Figure 4]. Even if Figure 4 shows the normalized growth rate under oxic conditions, the same dependence of the growth rate on NInorg-availability and γOM occurs for any EA also under anoxic conditions, although the lines shift depending on the metabolic pathway of N, as shown next.
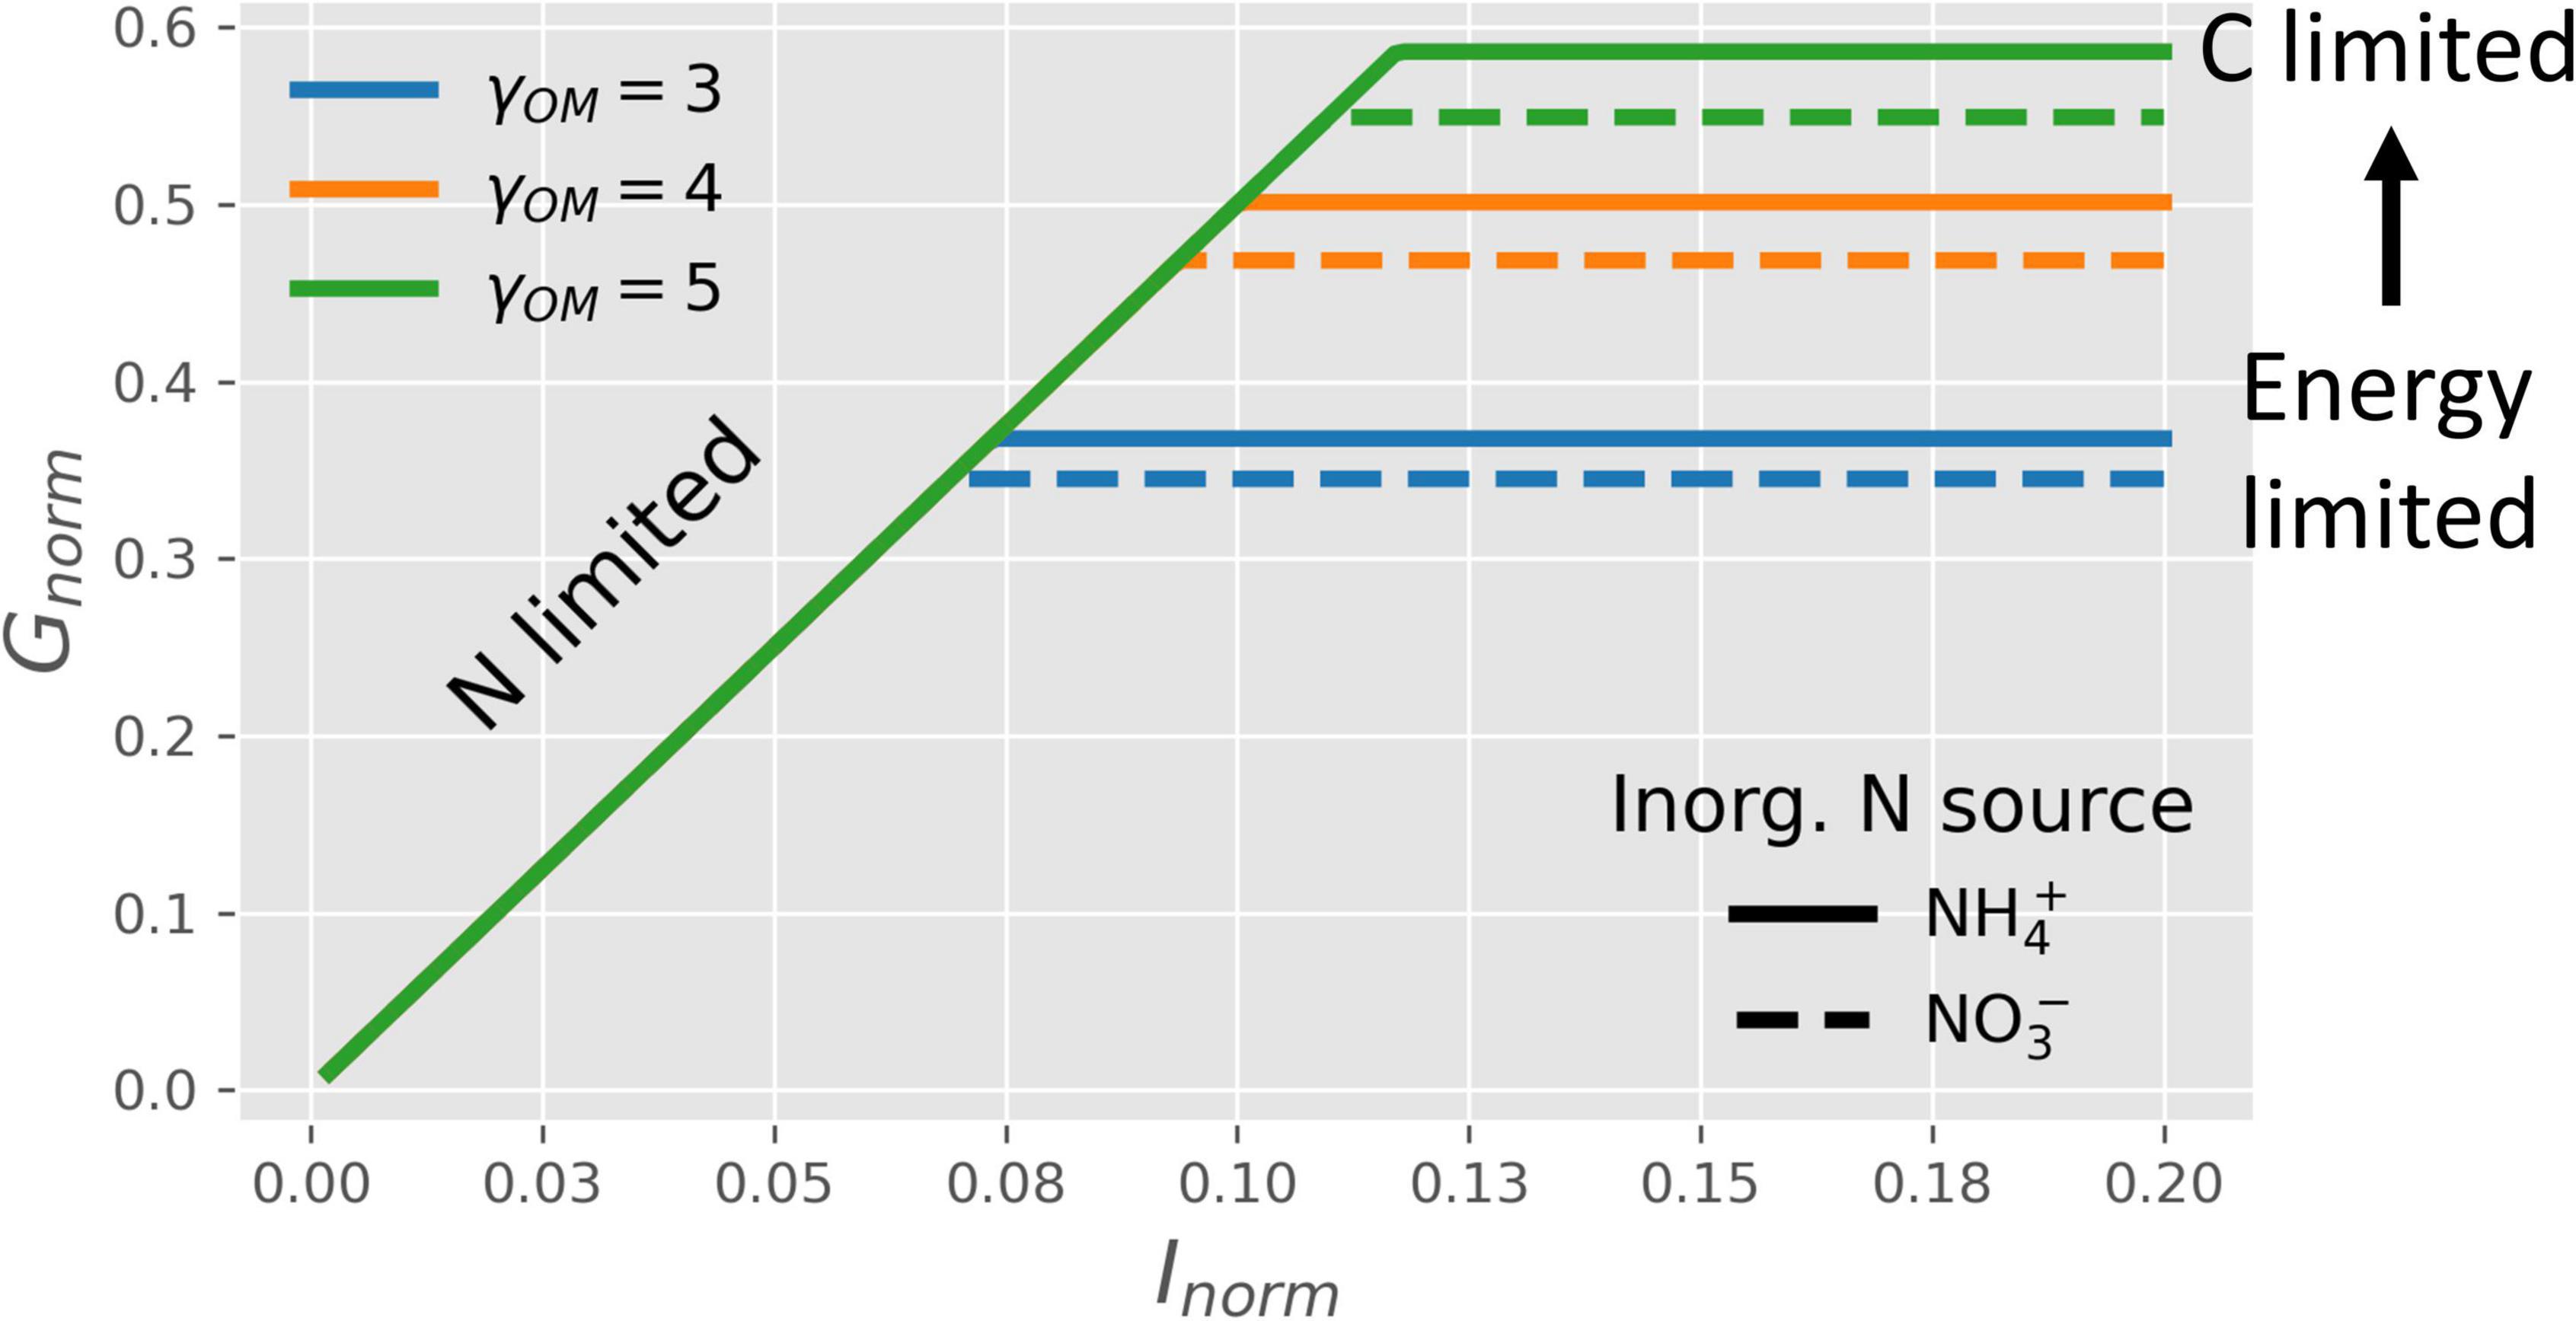
Figure 4. OM without N: normalized microbial growth rate (Gnorm) under oxic conditions as a function of NInorg-availability (Inorm), degrees of reduction of the OM (γOM; lines with different colors), and source of NInorg (solid lines for vs. dashed lines for ). Horizontal lines, blue to green, represent the transition from energy to C-limited conditions.
Figure 5 shows the transition of microbial growth rate from C- to energy- to N-limitation under anoxic conditions when is used both as EA and NInorg-source via DNRA (solid curves) or denitrification (dashed curves) pathway. The normalized growth rate for both pathways increases linearly at low values of γOM, attains a maximum, and then decreases non-linearly for high values of γOM (Figure 5A). Under C-limited conditions, the growth rate is higher for the denitrification as compared to the DNRA pathway for all values of γOM (cf. dashed vs. solid brown curves in Figure 5A). Conditions transition to N-limitation at high γOM when Inorm < 1.5 (colored curves). To clarify where this transition occurs, Figure 5B shows the full responses of GC, norm (only C-limitation; black curves) and GN, norm (only N-limitation; colored curves) to changes in γOM. For a given level of Inorm, the N-limited branch of the growth curve is initially flat, then decreases with increasing γOM. This is because under N-limited conditions, CUE per unit of total utilized (e/yN) decreases as γOMincreases for reduced compunds (γOM > 4.7). Changing the level of external NInorg (Inorm) simply re-scales the growth rate under N-limited conditions because GN, norm = (e/yN)Inorm [Eq. (4)]. Under N-limitation and in contrast to C-limited conditions, the growth rate is higher for DNRA as compared to the denitrification pathway (cf. solid vs. dashed blue curves in Figure 5A, enlarged view provided in Supplementary Figure 1).
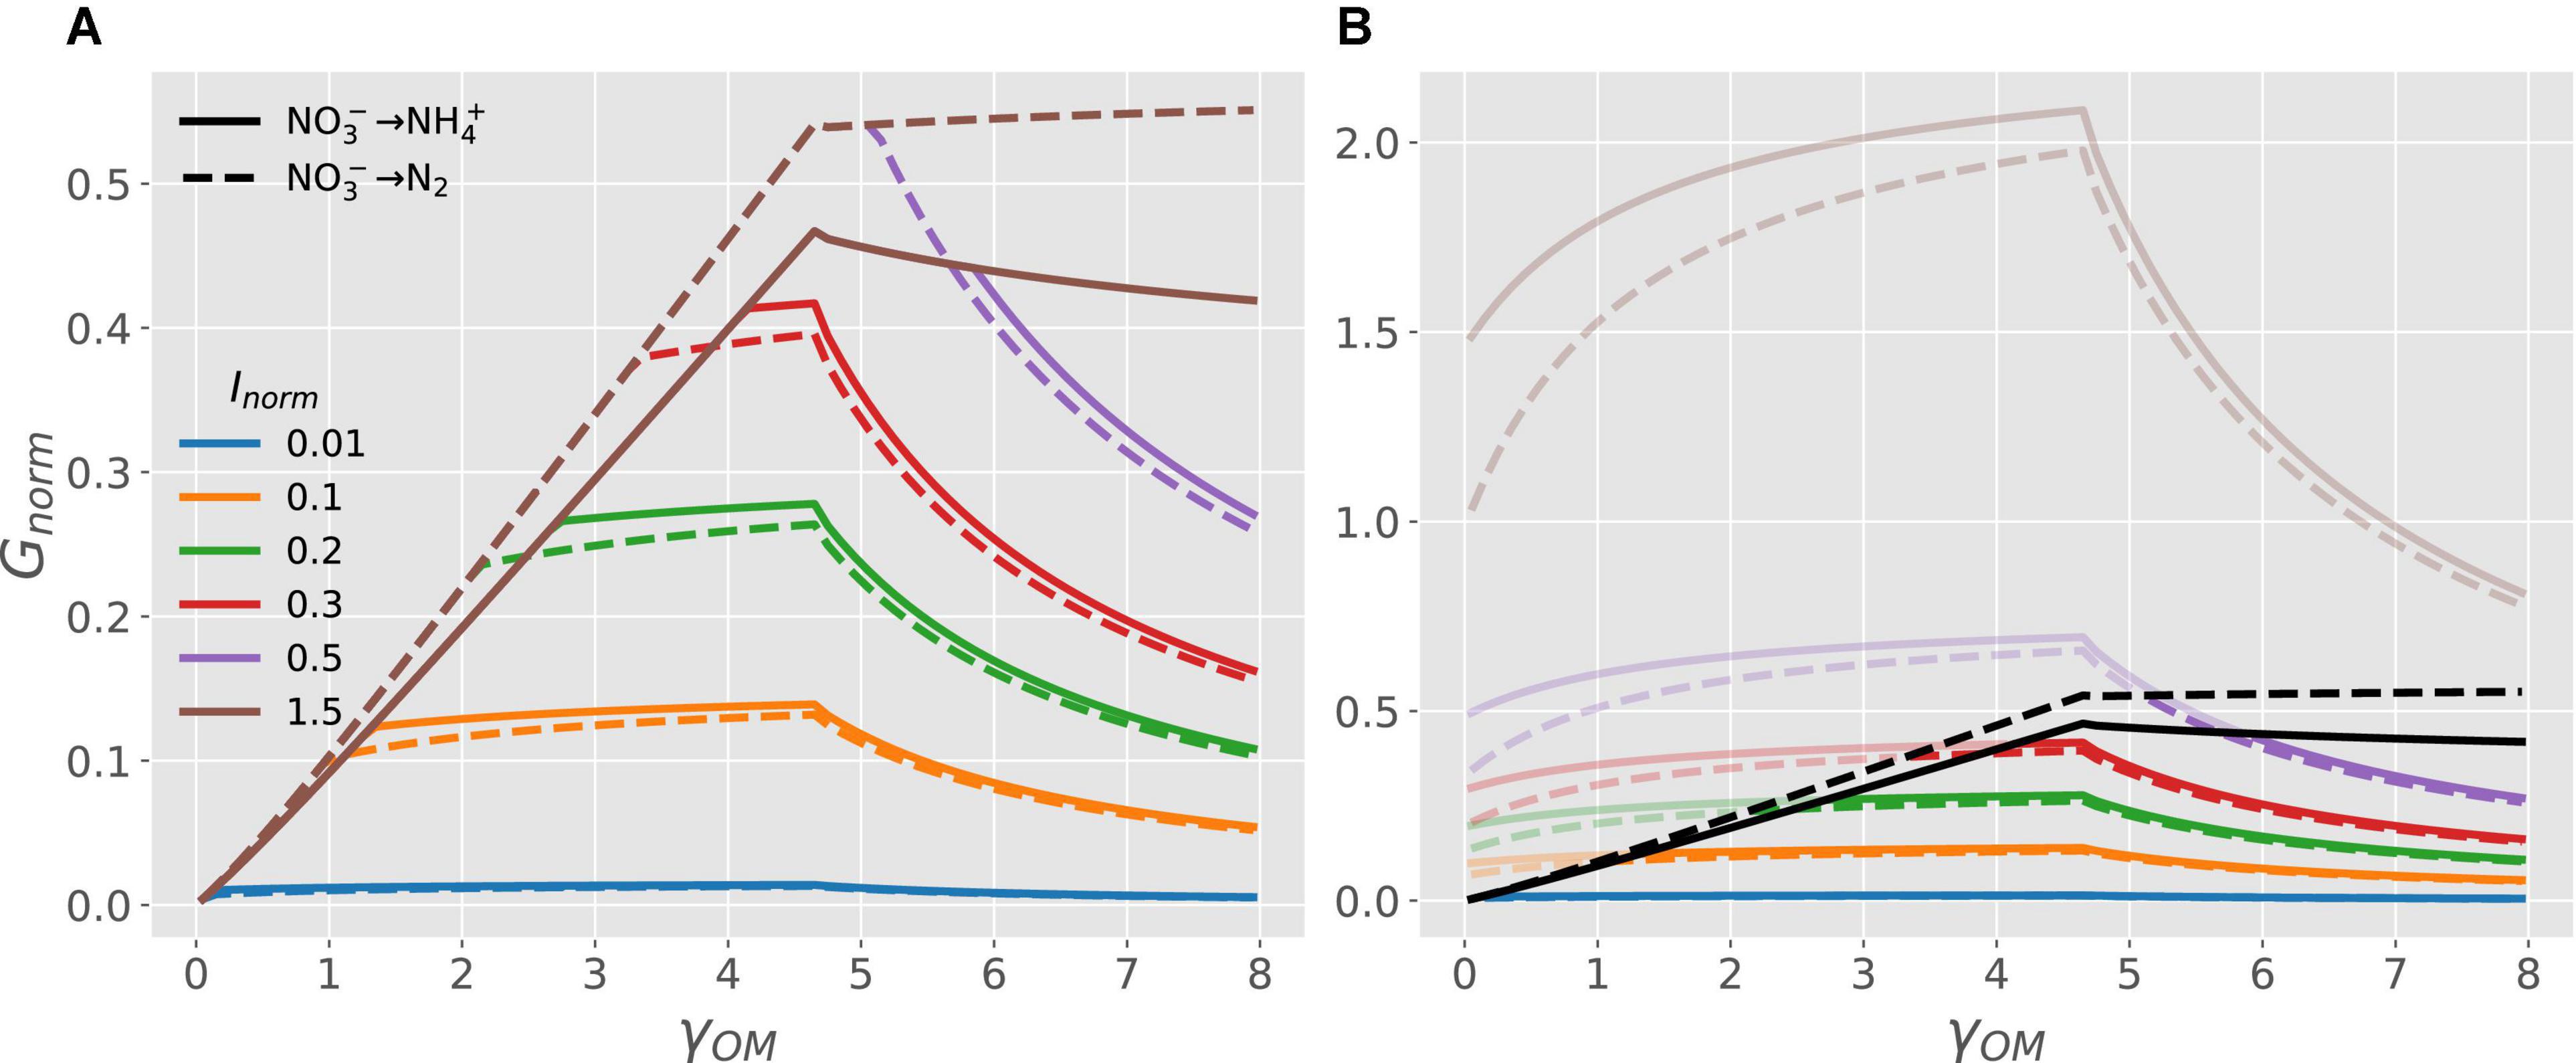
Figure 5. OM without N and nitrate as EA and N-source: (A) normalized microbial growth rate (Gnorm) as a function of NInorg-availability (Inorm) and degree of reduction of the OM (γOM; curves with different colors), when the OM is catabolized via denitrification (dashed curves) or DNRA pathway (solid curves). (B) Normalized microbial growth rate under C-limitation [GC, norm = e, Eq. (3); black curves] and N-limitation [GN, norm = (e/yN)Inorm, Eq. (4); colored curves]. The parts of the curves that are not realized [recall that Gnorm = min(GC, norm, GN, norm) ] are shaded. Because GC, normdepends only on γOM, all curves corresponding to different Inorm overlap for a given pathway under C limited conditions. An enlarged view of the growth rate curves for Inorm = 0.01 (blue curves) is provided in Supplementary Figure 1.
Microbial Growth on Organic Matter Containing N
The microbial growth rate for given γOM (curves with different colors in Figure 6) and availability of NInorg (; solid vs. dashed curves) is stable at low OM C:N ratio (CNOM) when organic N is abundant (C- and energy-limitations). Under these conditions, the microbial growth rate also increases with increasing γOM and it does not depend on N-availability (as shown in Figure 3). In contrast, under N-limited conditions, the growth rate depends on both γOM and CNOM (Table 2). As CNOM increases, the supply of organic N for microbial growth decreases, up to the point where growth becomes limited by the supply of NInorg. Under these conditions, the growth rate is reduced to match the NInorg supply (Table 2); therefore, the growth rate also decreases with decreasing Inorm (solid vs. dashed curves). Contrary to the negative effect of low γOM under C-limitation, low γOM reduces the effects of N-limitation by forcing microbes to grow at a slower rate, which lowers their N-demand.
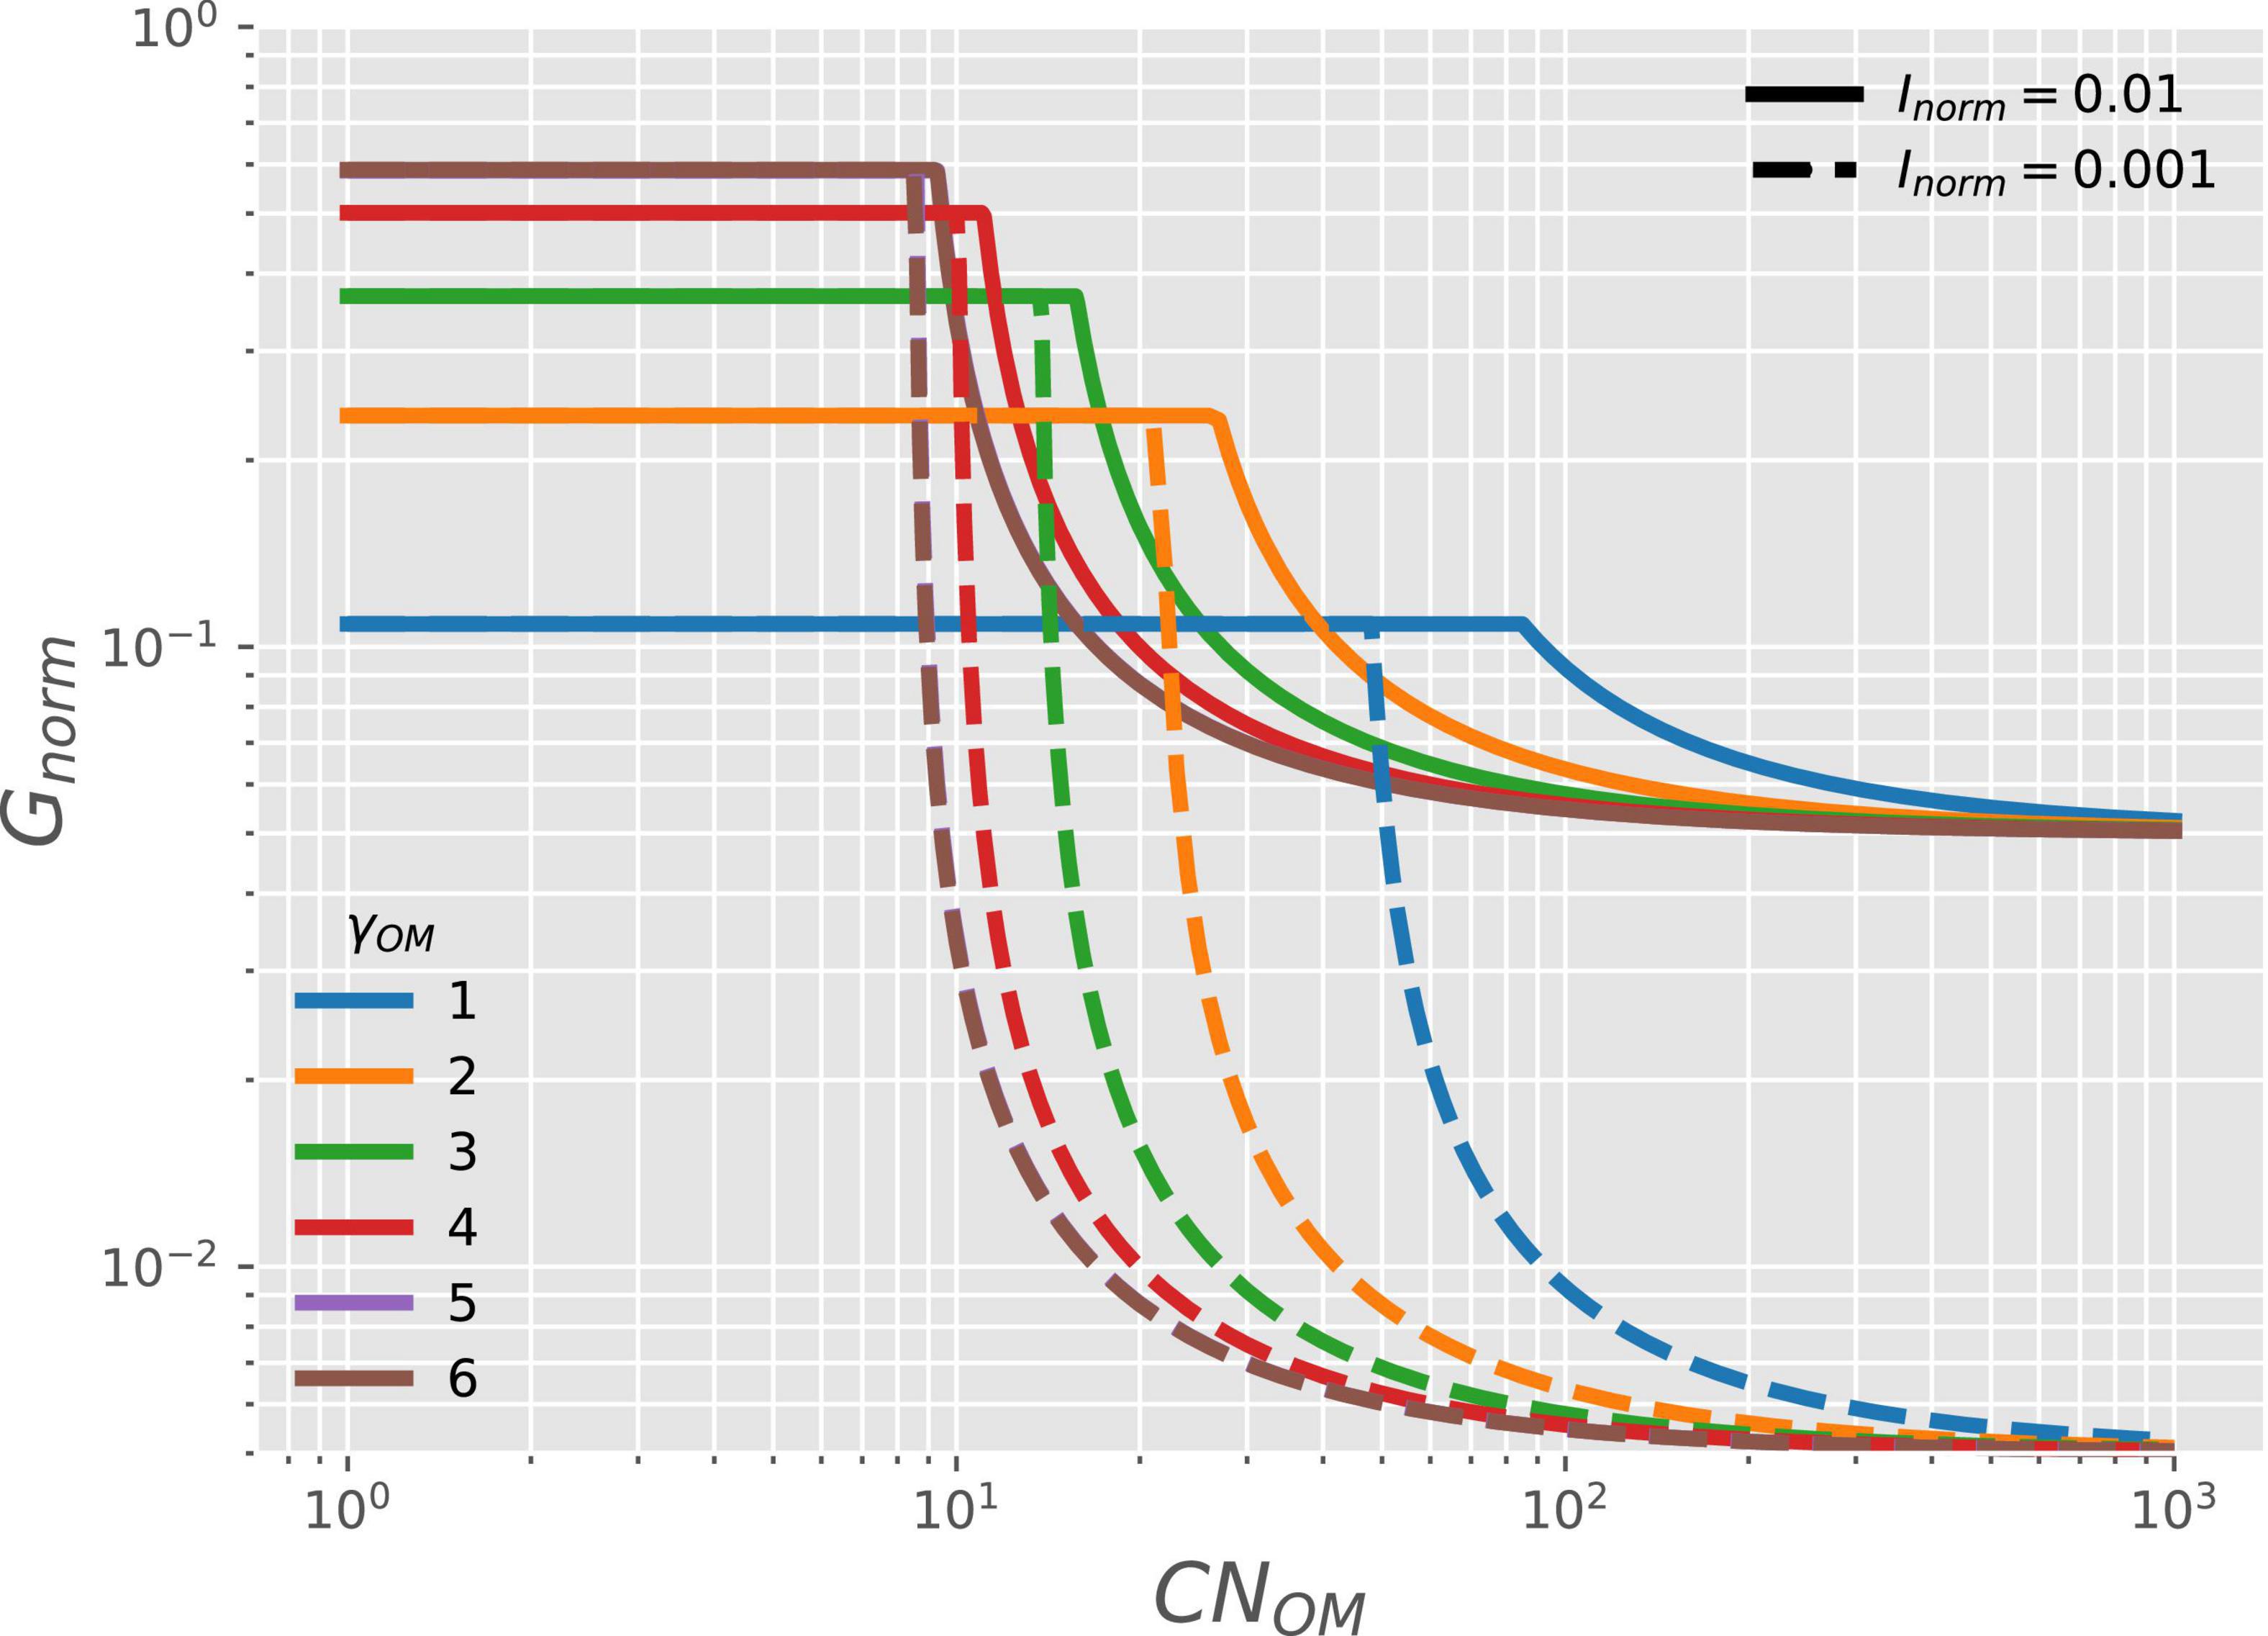
Figure 6. OM containing N: variation of normalized microbial growth rate (Gnorm) along a gradient of OM C:N ratio [CNOM in C-mol (N-mol)–1] under oxic conditions, and with varying degree of reduction of the OM (γOM; curves with different colors) and two levels of NInorg-availability (Inorm, solid vs. dashed curves). For γOM > 5, curves are close to each other so that the curve for γOM = 5 is not visible and is below the brown curve.
The different EAs shift the relative position of energy-, C-, and N-limitation regions in the space of CNOM and γOM (Figure 7). In the case of O2 and Fe3+ (goethite or ferrihydrite) as EAs, the growth rate varies as in Figure 6, i.e., it is maximum for OM with high γOM and low CNOM (C-limited region), decreases with decreasing γOM (energy-limited region), and is lowest at high values of CNOM (N-limited region). In all these cases the growth rate decreases only slightly when OM is highly reduced. In the case of as the EA (see also the orange curve in Figure 3), the growth rate at a given CNOM first increases with increasing γOM, reaches its maximum values for γOM close to 4 and then decreases. For lower values of γOM, the growth rate decreases as CNOM increases because of transition from C- to N-limited conditions, similar to the behavior under other EA, whereas at high γOM N-limitation does not occur even at CNOM as high as 1,000 C-mol (N-mol)−1. As a result, the energy-limited region shifts from left [Figure 7, panels (A–C)] where it is caused by low γOM, to the right in panel D where it is caused by high |ΔrGB| (see Supplementary Figure 2 for ΔrGB as function of γOM).
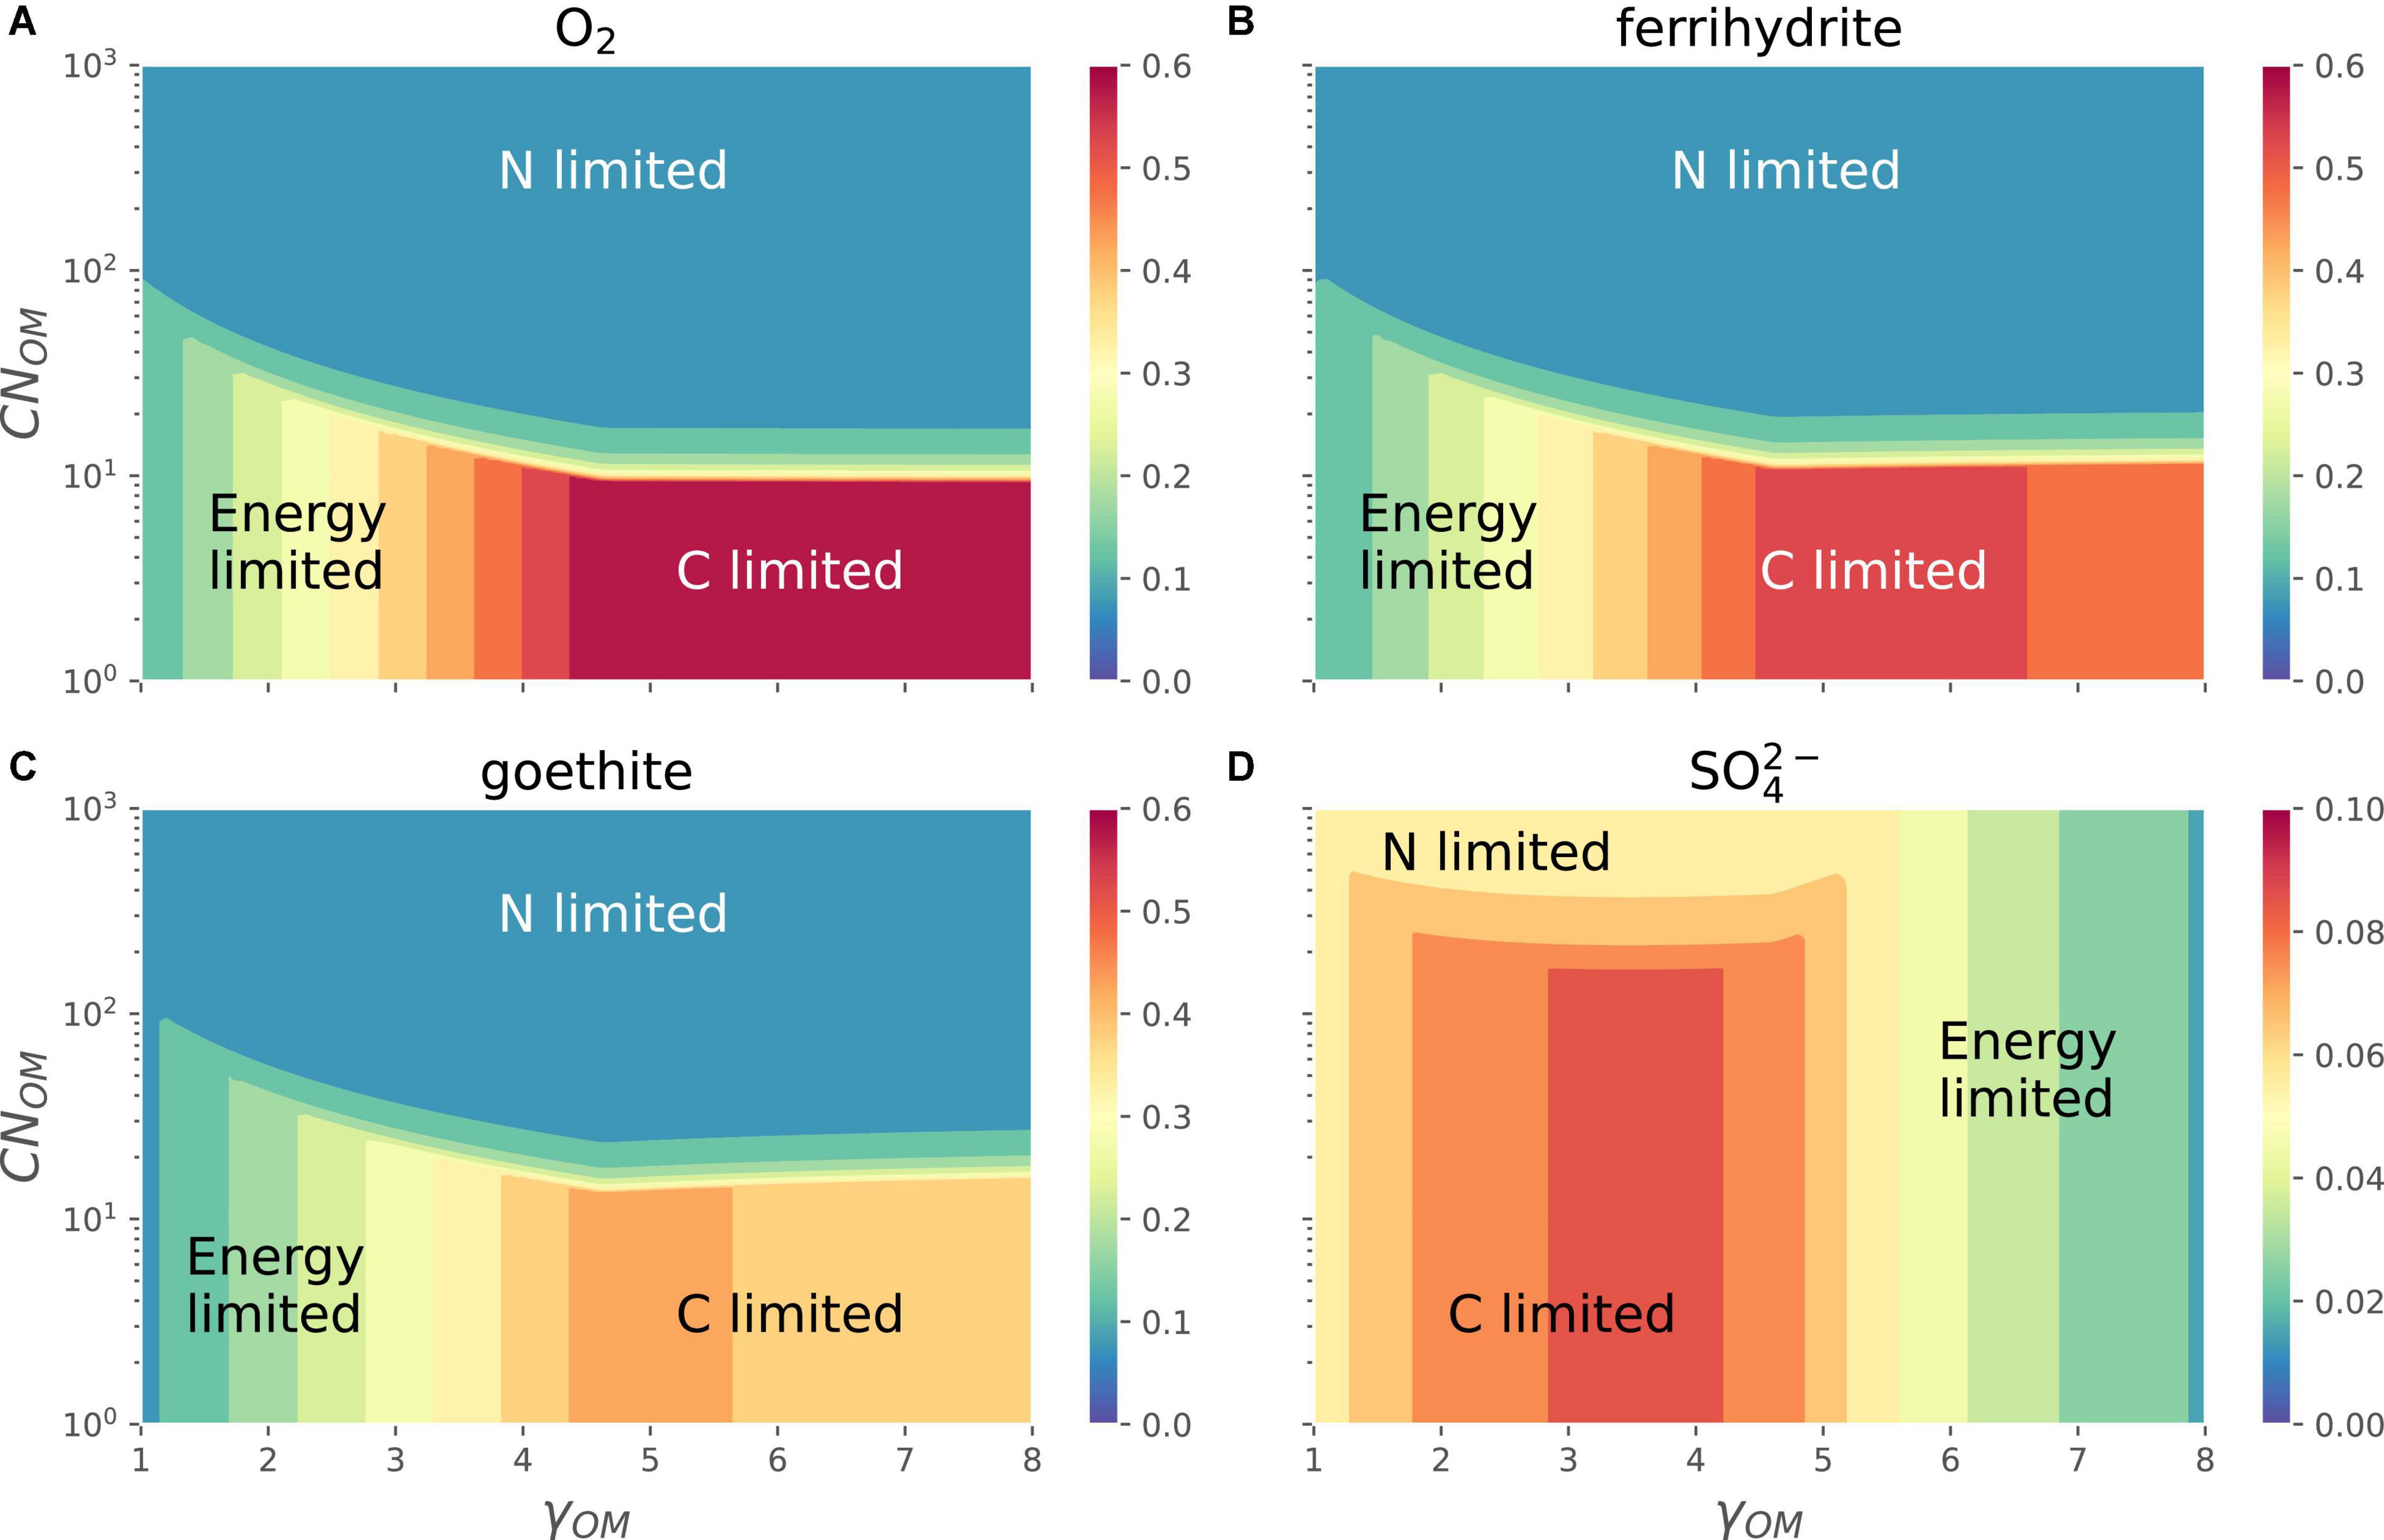
Figure 7. OM containing N: variation of normalized microbial growth rate (Gnorm; contours with different colors) along a gradient of OM C:N ratio [CNOM in C-mol (N-mol)–1] and OM degree of reduction (γOM) for different EAs [panels (A–D)]. A constant value of Inorm = 0.01 was assumed in all panels. Note that the color scale in the bottom right panel is different from those in the other three panels (A–C).
Discussion
Microbial Growth: Missing Link Between Bioenergetic and Stoichiometric Regulation in Biogeochemical Models
Traditionally, biogeochemical models assume that microbes are limited by C- or N-availability, depending on C:N ratio of OM and availability of NInorg (or ). These limitations regulate the rate of OM decomposition and the partitioning of C and N between growth and mineralized products (Cherif and Loreau, 2007; Manzoni et al., 2017). Similar stoichiometric constraints are implemented in models describing decomposition in litter and soil [e.g., Manzoni and Porporato (2009), Wutzler et al. (2017), and Zhang et al. (2018)], or in the water column or sediments of aquatic systems [e.g., Schultz and Urban (2008) and Webster et al. (2009)]. These models, except for recent developments (Song et al., 2020), tend to neglect energetic constraints on both C fluxes and their partitioning between growth and respiration, or implicitly assume that C- and energy-limitations are equivalent.
Building on previous bioenergetics theory, here we formulate microbial growth as a function of C and N stoichiometric constraints and include energy-limitation as an additional constraint acting via: (i) the change in Gibbs energy of OM oxidation, which is controlled by the degree of reduction of the OM (γOM), and (ii) the change in Gibbs energy of EA reduction (ΔredGEA). These factors affect the efficiency of OM conversion into biomass (i.e., CUE), thus determining the microbial growth rate. These two bioenergetic factors interact with two biogeochemical ones: (iii) availability of organic or NInorg for growth (measured by CNOM and IN, respectively) and (iv) availability of C for growth and catabolism (UOM). In natural environments, either of these four factors can become limiting and thus may reduce microbial activity. For example, when nutrients are not limiting, fluctuating soil moisture would change the redox status, forming zones of high or low microbial activity because of varying degree of the reduction potential of the local EA, even if the supply of organic C and its energetic content are spatially uniform (LaCroix et al., 2019). Notably, these four factors can interact. For instance, energy-limitation can lower N-demand, thereby reducing N-limitation, while N-limitation, when microbes metabolize oxidized N (such as ) for growth, creates an additional energy demand on the available OM.
In the following, we discuss our results regarding (i) C- and energy-limitation (section “C- and Energy-Limitations: Effects of Organic Matter Degree of Reduction and Electron Acceptor Energy Yield on Growth”; answering question 1 in the Introduction), (ii) N- and energy-limitation (section “N- and Energy-Limitations: Effects of Different NInorg-Sources on Growth” and “N- and Energy-Limitations: Using Nitrate as Both Electron Acceptor and NInorg-Source on Growth”; answering question 2 in the Introduction), and (iii) combined C-, N-, and energy-limitation (section “C-, N-, and Energy-Limitations: Effects of Combined Thermodynamic and Biogeochemical Factors on Microbial Growth”; answering question 3 in the Introduction). We then conclude with a broader discussion on the limitations and implications of the proposed bioenergetic framework (section “Outlook: Approach Limitations and Implications of Bioenergetics in Microbial Ecology”).
Interactions Among C-, N-, and Energy-Limitations
C- and Energy-Limitations: Effects of Organic Matter Degree of Reduction and Electron Acceptor Energy Yield on Growth
The overall patterns in normalized growth rate or CUE with the degree of reduction and type of NInorg-source for microbial growth are similar to those described in other studies (Roels, 1980b; Heijnen et al., 1992; Smeaton and Van Cappellen, 2018). When microorganisms catabolize OM using high energy yielding EA such as O2 or , their growth rate increases with the increasing energy content of the OM utilized, i.e., γOM (Figure 3). Garayburu-Caruso et al. (2020) showed decreased respiration rates under oxic conditions for more reduced OM (high γOM). Based on our framework, we interpreted their observations as low respiration rate coupled with high CUE (thus, high growth rate) when more reduced compounds are decomposed. However, if the catabolism is performed using low energy yielding EA (low values of |−ΔredGEA|), the growth rate increases with increasing γOM at first, but then decreases to a value close to zero for more reduced OM (Figure 3). The key to understanding this pattern is the variation of ΔcatGOM and ΔoxGOM with γOM (Supplementary Figure 2). ΔoxGOM (black curve, Supplementary Figure 2) is negative for γOM < 1.88 and positive for γOM > 1.88; therefore, for γOM < 1.88 a low energy yielding EA would result in overall negative ΔcatGOM (blue or orange curve Supplementary Figure 2A). This means that the catabolic reaction is still feasible, although with lower CUE because of the low magnitude of ΔcatGOM. For γOM > 1.88, ΔoxGOM is positive, so that a low energy yielding EA could result in overall positive ΔcatGOM values representing a non-spontaneous reaction, which means that the catabolic reaction is not feasible and uptake of OM stops. Such a reaction would lead to CUE = 0 in Figure 3. Moreover, for intermediate values of |−ΔredGEA| (e.g., EAs such as Fe3, ), the growth rate or CUE decreases with γOM above γOM > 4.7 (Figure 3) because microbes dissipate Gibbs energy (|ΔrGB| from the overall metabolic reaction) faster than it is produced from the catabolic reaction with increasing γOM (Supplementary Figure 2, panel C). However, this is not the case when O2 is the EA as CUE remains a monotonically increasing function of γOM. Thus, purely C-limited conditions are only attained when the substrate is reduced and oxygen is the EA; in other conditions, the energy-limitation reduces microbial growth, even though the reaction rates still scale with substrate C content (C-energy co-limitation).
Our results show an inhibition effect of reduced OM (high γOM) on growth when catabolism is coupled with low energy yielding EAs such as Fe3+ or , as an outcome of decreased growth rate caused by low CUE (Figures 3, 7). Under energy-limited environments, if microbial growth is not limited by the supply of C, then our framework would predict higher respiration for more reduced compounds caused by low CUE. For example, when sulfate reducing bacteria are grown in batch or chemostat with ethanol, acetate, or lactate as substrates, more hydrogen sulfide (a proxy for respiration) was produced with ethanol compared to the other two substrates (White and Gadd, 1996). This is expected because ethanol produces more electrons compared to acetate and lactate per C mol; therefore, more is used, resulting in higher respiration. Further, Zheng et al. (2019) showed that as O2 becomes limiting, growth is mainly controlled by CUE, and respiration remained unchanged since the supply of dissolved organic C did not change during their incubation experiment (Zheng et al., 2019). However, in some natural environments such as marine sediments or deep soil, the respiration rate of reduced OM can decrease under energy-limitation imposed by low energy yielding EA (Jin and Bethke, 2007; LaRowe et al., 2012; Boye et al., 2017; Keiluweit et al., 2017). This decrease in metabolic rates (respiration rate) is explained using a thermodynamic factor that decreases as the energy produced from catabolism decreases. Such natural environments are often limited in the availability of C as well, so the microbial metabolism is restricted to maintenance functions (or basal power requirement). In other words, microbes are under a physiological survival state without significant growth, while in our framework, we focus on respiration processes that are coupled to growth.
Furthermore, Worrall et al. (2018) showed that the Gibbs energy of formation of particulate OM decreases with depth in peatlands, which implies that the Gibbs energy of combustion (assuming O2 as EA) increases with depth. Worrall et al. (2018) related this observation to the accumulation of OM in peatlands, as OM becomes “thermodynamically inhibited” for microbial uptake and can thus remain in the system. In Figure 3, we showed a similar effect. With increasing depth, oxygen-availability decreases, other EAs become available, and when OM oxidation is coupled with low energy yielding EAs, Gibbs energy produced from catabolism decreases even if OM is composed of labile C such as glucose. As a result of energy-limitation, growth rate and CUE decrease with depth. Therefore, our approach provides an alternative explanation to Worrall et al. (2018) results, in which the thermodynamic factor proposed by Jin and Bethke (2007) was used to explain thermodynamic inhibition.
Understanding the interplay between C- and energy-limitations requires considering all components of bioenergetic regulation of OM decomposition, because the degree of reduction of OM (and thus its chemical nature) controls decomposition together with the coupled half-reaction of the EA reduction. The latter might constrain microbial growth even on energy-rich OM.
N- and Energy-Limitations: Effects of Different NInorg-Sources on Growth
The metabolism of varies across microorganisms and with environmental conditions (Lin and Stewart, 1997; Kraft et al., 2014; Kuypers et al., 2018). For example, CUE and growth rate are decreased if is used instead of as the sole N-source (Stouthamer, 1977; Wray et al., 1996) (Figure 4). Our model explains this decrease with the energetic cost of reduction, providing a complementary explanation to the inhibition of -uptake in the presence of Kobayashi and Ishimoto, 1973; Rice and Tiedje, 1989; Polcyn and Luciński, 2003). Moreover, the transition from N- to energy-limitation (or vice versa) depends on different processes under oxic and anoxic conditions. Under oxic conditions, the energy-limitation caused by a low degree of reduction of the OM alleviates N-limitation when N-availability decreases. In fact, the transition from energy to N-limitation occurs at lower N-availability when γOM decreases, because N-demand at low γOM is also lower (Figures 4, 6). Thus, under oxic conditions, shifts in N-demand driven by energy availability define the transition from energy- to N-limitation.
N- and Energy-Limitations: Using Nitrate as Both Electron Acceptor and NInorg-Source on Growth
Under anoxic conditions, when is used as both EA and NInorg-source for biomass, microorganisms compete for reduction via denitrification or DNRA pathway. As a result, the N metabolic pathway (e.g., denitrification vs. DNRA), by determining the N-demand for catabolic and anabolic processes, controls how the transition between energy- and N-limitations occurs (Figure 5).
On the one hand, denitrification may cause N-limitation by removing N from the system, whereas DNRA simply reduces to . In fact, under N-limited conditions, denitrifiers need to reduce an additional amount of to to meet their N-demand for growth compared to the DNRA pathway, which produces excess through catabolism. Therefore, when -availability is low, microbes performing DNRA would outcompete denitrifiers, as DNRA allows higher growth rate than denitrification for all values of γOM (Figure 5B, solid vs. dashed curves). On the other hand, denitrification produces more Gibbs energy per electron transferred to oxidation of OM compared to DNRA, which results in overall a higher Gibbs energy of catabolism for 1 C-mol of OM (Supplementary Table 1). Therefore, with abundant , microbial CUE for denitrification is higher than for the DNRA pathway (Figure 5B, dashed vs. solid black curves). As a result, microbial N-demand is always met, and growth is limited by the energy produced from catabolism; hence, denitrifiers have a higher growth rate than microbes performing DNRA for all values of γOM (Figure 5A, dashed vs. solid curves for Inorm = 1.5).
Between these two extreme cases of poor vs. rich conditions, the microbial growth rate of two pathways varies depending on γOM (Figure 5). At low values of γOM, growth is energy-limited and since denitrification produces more Gibbs energy, denitrifiers are likely dominant. In contrast, at high values of γOM, N-limitation becomes the controlling factor, so that microbes performing DNRA would dominate. With labile OM, such as glucose or acetate (both with degree of reduction 4), our theory would predict dominance of the DNRA pathway, because of higher growth rate at low nitrate concentration compared to dominance of denitrification pathway at high nitrate concentration (see Figure 5A). This prediction is similar to observations from field, lab or modeling studies (Kraft et al., 2014; van den Berg et al., 2016; Putz et al., 2018). However, most experimental studies ignore the role of OM degree of reduction as C is provided in labile form (e.g., glucose or acetate), and NInorg-availability is manipulated by adding or (van den Berg et al., 2016; Putz et al., 2018). Therefore, our results from Figures 4, 5 could be used to generate hypotheses or explain empirical results where the dominance of microbial communities is assessed by altering the quality of added substrates (its degree of reduction) under varying NInorg-availability. For example, we predicted higher denitrifier growth rate feeding on oxidized OM, but higher growth rate of microbes performing DNRA feeding on reduced OM under moderate nitrate-availability (Figure 5A, green lines).
C-, N-, and Energy-Limitations: Effects of Combined Thermodynamic and Biogeochemical Factors on Microbial Growth
When all three limitations—C, N, and energy—are considered, the overall patterns in microbial growth rate remain similar to those described in previous sections. Under oxic conditions, the effects of N-limitation on growth rate are decoupled from those arising under C- and energy-limitations (Figures 6, 7A). Under C-limitation, the growth rate is mainly determined by the CUE, which is controlled by γOM, whereas under N-limitation, the growth rate is determined by the N-imbalance, which is controlled by the C:N ratio of OM and NInorg-availability. The transition point between C- and N-limitations occurs at progressively higher N-availability as the N-demand increases with more reduced OM. Garayburu-Caruso et al. (2020) showed that observed respiration rates under C excess (high concentration of C-, N-limited) conditions were controlled by N-availability, whereas under C-limited (low concentration of C) conditions, they were controlled by the degree of reduction of OM, indicating bioenergetic regulation of OM decomposition only under C-limitation; however, this is only valid for oxic conditions. When the growth rate is analyzed in the CNOM−-γOM space, contrasting patterns emerged with the type of EA utilized [compare panels (A) and (D) in Figure 7]. For example, the dominating factors, C-, N-, or energy-limitation, controlling the growth rates are switched as the energy content of OM increases (γOM). This is explained by noting that when catabolism is coupled with low energy yielding EAs, the overall energy obtained from catabolism is very small; therefore, decreasing the growth rate as CUE is decreased (Figure 3).
The Case of Overflow Respiration Response Under N-Limited Conditions
We tested how energy-limitation would affect the growth rate, if microbes were to respire more rather than reducing OM-uptake during N-limitation. In fact, under N-limited conditions, the growth rate defined by Eq. (6) assumes that the growth is reduced by decreasing OM-uptake rate through the stoichiometric coefficients for N (Table 2), similar to the “N inhibition” mechanism described by Manzoni and Porporato (2009). This mechanism represents a downregulation of extracellular enzyme production. However, other strategies for microbial growth under N-limitation can have a different effect on the growth rate (Manzoni et al., 2021). One putative mechanism is overflow respiration or exudation of excess C, which suggests that under N-limitation, microbes do not reduce the uptake of OM; instead, they remove extra C by overflow respiration (Sistla et al., 2012; Wild et al., 2014; Wutzler et al., 2017), higher investment in extracellular enzymes, or possibly exuding more. This is mathematically achieved by reducing microbial CUE at a constant uptake rate of OM (Manzoni et al., 2017). We tested whether this mechanism would affect growth rate when varying γOM, CNOM, and availability of different EAs in Supplementary Figures 3, 4. As expected, the variation of growth rate with γOM under C-limited conditions remains the same as shown in Figures 6, 7. However, under N-limitation, the growth rate is much higher when overflow respiration is performed, because the supply of N from the OM is not lowered (compare Supplementary Figure 3 vs. Figure 6, and Supplementary Figure 4 vs. Figure 7). This metabolic regulation would thus appear to be “optimal” (Manzoni et al., 2017) because it allows higher growth rate compared to reducing the substrate uptake rate. As CNOM increases under N-limitation, the CUE itself decreases, so that all growth curves converge to a single curve for a given NInorg-availability and regardless of γOM.
Outlook: Approach Limitations and Implications of Bioenergetics in Microbial Ecology
While we studied microbial growth for given environmental conditions, in natural settings, amount and quality of OM, availability of oxygen and inorganic EAs, and microbial biomass stoichiometry and community composition vary through time and at different time scales. Applying bioenergetics in a dynamic context where both state variables (mass and energy of substrates and microbial compartments) and environmental conditions change through time would require complete mass and energy balance equations, including the definition of the rates of consumption and transport of mass and energy. For example, dynamic simulations show that DNRA and denitrification pathways coexist for a range of C:N ratio of OM and oxic/anoxic conditions (van de Leemput et al., 2011; van den Berg et al., 2016; Jia et al., 2020; Zakem et al., 2020); however, our study could not capture such behavior because our formulation is time implicit.
Moreover, in a dynamic system, the degree of reduction of degrading OM changes during decomposition, which provides a bioenergetic link to the continuous nature of chemical changes and OM stability (Williams and Plante, 2018). Systems with fluctuating redox status may face frequent changes from energy-rich to energy-limited conditions; therefore, more reduced OM can accordingly become energetically favorable or unfavorable, and C storage would depend on the time scale of such fluctuations (Santruckova et al., 2005; Bhattacharyya et al., 2018; LaCroix et al., 2019; Lin et al., 2021). Similarly, in energy-limited systems (anoxic conditions with lower availability of favorable EA), more reduced compounds are energetically unfavorable, which may lead to their longer turnover time, and thus accumulation (Boye et al., 2017; Keiluweit et al., 2017).
We also assumed standard conditions to simplify Gibbs energy calculations, whereas in natural systems the concentrations of reaction species change through time. Therefore, Gibbs energy calculations of catabolic and anabolic reactions, and the associated stoichiometric coefficients, would need to be time-dependent. Further, we assumed that microorganisms adapt to N-limitation based on their fixed elemental ratio, which has been reported to be one of the limitations of Liebig’s law of the minimum (Tang and Riley, 2021). Allowing microorganisms to change their elemental ratio (i.e., CNB) to balance resource acquisition would affect CUE as well as other stoichiometric coefficients [e.g., Eqs. (28) and (29)]. Flexible microbial C:N could also have long-term consequences in dynamic contexts such as during litter decomposition (Manzoni et al., 2021)—higher C:N could allow higher allocation of C to growth, resulting in more necromass that could be ultimately stabilized in soil. Thus, our formulation should be expanded to be used under non-standard and dynamic conditions.
Despite the limitations of our approach and the complexities inherent in coupling mass and energy balances, bioenergetic approaches are promising to explain patterns in microbial growth rate (Helton et al., 2015; Calabrese et al., 2021) and microbial community structure (Großkopf and Soyer, 2016; Seto and Iwasa, 2020; González-Cabaleiro et al., 2021). For example, Großkopf and Soyer (2016) showed how two microbial species can coexist at a steady state using a coupled kinetic and bioenergetic growth model under energy-limited conditions. Traditional kinetic models (Monod equation) could not predict such behavior. Furthermore, bioenergetics-based models provide tools to link genome to population scale models [Shapiro et al. (2018) and Ref. therein, Dukovski et al. (2021)]. New models are exploring the potential of bioenergetics to study how microbial metabolic diversity and spatial heterogeneity of resources interact and shape community dynamics and resource niches in the complex soil environment (Araujo Granda et al., 2016; Jayathilake et al., 2017; Borer et al., 2019; Gogulancea et al., 2019; Li et al., 2019; Ben Said et al., 2020; Calabrese et al., 2020; Dal Co et al., 2020; Desmond-Le Quéméner et al., 2021). Bioenergetics can thus be a useful complement to traditional biogeochemical models describing only the dynamics of C and nutrients.
Conclusion
The bioenergetic principles provide a unified theory for integrating kinetic and stoichiometric constraints on microbial growth. In this work, we showed how bioenergetics could be used to link the stoichiometry of microbial growth under different types of metabolisms and varying environmental conditions. Specifically, we quantified microbial growth rate in C-, N-, and energy-limited systems and used our theory to explain patterns in growth rate using two bioenergetic variables, i.e., the degree of reduction of the OM (γOM) and the energy yield of the EA reduction, and two biogeochemical ones, i.e., availability of organic N or NInorg for growth (CNOM, Inorm) and of C for growth and catabolism (UOM). In general, under C-rich and energy-limited conditions, the growth rate peaks at intermediate γOM and increases with high energy-yielding EA. Our analysis also qualitatively explains microbial activity patterns across a range of metabolic pathways (aerobic, denitrification, DNRA). We showed that energy-limitations could reduce N-limitation by decreasing CUE, and N-limitation exacerbates energy-limitation by imposing additional energy requirements such as nitrate reduction in denitrification. Applications of bioenergetics provide a powerful tool that can be used to study microbial growth dynamics and diverse metabolic pathways. Since metabolic diversity is closely related to microbial community diversity, bioenergetics could prove valuable to understand patterns in microbial ecology driven by gradients of energy- and nutrient-availabilities.
Data Availability Statement
The original contributions presented in the study are included in the article/Supplementary Material, further inquiries can be directed to the corresponding author.
Author Contributions
AC designed the study and developed the theory with feedback from SM and SC and implemented the framework, produced the results, and drafted the manuscript. All authors commented and revised the manuscript.
Funding
This work was supported by the Swedish Research Council Vetenskapsrådet (grant Nos. 2016–04146 and 2020–03910). SM has received funding from the European Research Council under the European Union’s Horizon 2020 Research and Innovation Programme Grant No. 101001608. SC acknowledges the support from the USDA National Institute of Food and Agriculture Hatch project 1023954. AH was supported by the Swedish Research Council for Sustainable Development (grant No. 2017-00932).
Conflict of Interest
The authors declare that the research was conducted in the absence of any commercial or financial relationships that could be construed as a potential conflict of interest.
Publisher’s Note
All claims expressed in this article are solely those of the authors and do not necessarily represent those of their affiliated organizations, or those of the publisher, the editors and the reviewers. Any product that may be evaluated in this article, or claim that may be made by its manufacturer, is not guaranteed or endorsed by the publisher.
Acknowledgments
We thank Björn Lindahl for his insights on nitrogen metabolism in microbial systems.
Supplementary Material
The Supplementary Material for this article can be found online at: https://www.frontiersin.org/articles/10.3389/fmicb.2022.859063/full#supplementary-material
References
Amend, J. P., and LaRowe, D. E. (2019). Minireview: demystifying microbial reaction energetics. Environ. Microbiol. 21, 3539–3547. doi: 10.1111/1462-2920.14778
Araujo Granda, P., Gras, A., Ginovart, M., and Moulton, V. (2016). INDISIM-Paracoccus, an individual-based and thermodynamic model for a denitrifying bacterium. J. Theor. Biol. 403, 45–58. doi: 10.1016/j.jtbi.2016.05.017
Battley, E. H. (2009). Is electron equivalence between substrate and product preferable to C-mol equivalence in representations of microbial anabolism applicable to “origin of life” environmental conditions? J. Theoret. Biol. 260, 267–275. doi: 10.1016/j.jtbi.2009.05.032
Bauchop, T., and Elseden, S. R. (1960). The Growth of Micro-organisms in Relation to their Energy Supply. Microbiology 23, 457–469. doi: 10.1099/00221287-23-3-457
Ben Said, S., Tecon, R., Borer, B., and Or, D. (2020). The engineering of spatially linked microbial consortia – potential and perspectives. Curr. Opin. Biotechnol. 62, 137–145. doi: 10.1016/j.copbio.2019.09.015
Bhattacharyya, A., Campbell, A. N., Tfaily, M. M., Lin, Y., Kukkadapu, R. K., Silver, W. L., et al. (2018). Redox Fluctuations Control the Coupled Cycling of Iron and Carbon in Tropical Forest Soils. Environ. Sci. Technol. 52, 14129–14139. doi: 10.1021/acs.est.8b03408
Bloom, A. J. (2010). Energetics of Nitrogen Acquisition. Annu. Plant Rev. 42, 63–81. doi: 10.1002/9781444328608.ch3
Bölscher, T., Wadsö, L., Börjesson, G., and Herrmann, A. M. (2016). Differences in substrate use efficiency: impacts of microbial community composition, land use management, and substrate complexity. Biol. Fertil. Soils 52, 547–559. doi: 10.1007/s00374-016-1097-5
Borer, B., Ataman, M., Hatzimanikatis, V., and Or, D. (2019). Modeling metabolic networks of individual bacterial agents in heterogeneous and dynamic soil habitats (IndiMeSH). PLoS Comput. Biol. 15:e1007127. doi: 10.1371/journal.pcbi.1007127
Boudart, M. (1976). Consistency between kinetics and thermodynamics. J. Phys. Chem. 80, 2869–2870. doi: 10.1021/j100567a012
Boye, K., Noël, V., Tfaily, M. M., Bone, S. E., Williams, K. H., Bargar, J. R., et al. (2017). Thermodynamically controlled preservation of organic carbon in floodplains. Nat. Geosci. 10, 415–419. doi: 10.1038/ngeo2940
Bradley, J. A., Arndt, S., Amend, J. P., Burwicz, E., Dale, A. W., Egger, M., et al. (2020). Widespread energy limitation to life in global subseafloor sediments. Sci. Adv. 6:eaba0697. doi: 10.1126/sciadv.aba0697
Burgin, A. J., Yang, W. H., Hamilton, S. K., and Silver, W. L. (2011). Beyond carbon and nitrogen: how the microbial energy economy couples elemental cycles in diverse ecosystems. Front. Ecol. Env. 9, 44–52. doi: 10.1890/090227
Calabrese, S., Barcellos, D., Thompson, A., and Porporato, A. (2020). Theoretical Constraints on Fe Reduction Rates in Upland Soils as a Function of Hydroclimatic Conditions. J. Geophys. Res. 125:e2020JG005894. doi: 10.1029/2020JG005894
Calabrese, S., Chakrawal, A., Manzoni, S., and Cappellen, P. V. (2021). Energetic scaling in microbial growth. PNAS 118:2107668118. doi: 10.1073/pnas.2107668118
Calabrese, S., and Porporato, A. (2019). Impact of ecohydrological fluctuations on iron-redox cycling. Soil Biol. Biochem. 133, 188–195. doi: 10.1016/j.soilbio.2019.03.013
Cherif, M., and Loreau, M. (2007). Stoichiometric Constraints on Resource Use, Competitive Interactions, and Elemental Cycling in Microbial Decomposers. Am. Natural. 169, 709–724. doi: 10.1086/516844
Dal Co, A., van Vliet, S., Kiviet, D. J., Schlegel, S., and Ackermann, M. (2020). Short-range interactions govern the dynamics and functions of microbial communities. Nat. Ecol. Evol. 4, 366–375. doi: 10.1038/s41559-019-1080-2
Delattre, H. Quéméner, E. D. -L., Duquennoi, C., Filali, A., and Bouchez, T. (2019). Consistent microbial dynamics and functional community patterns derived from first principles. ISME J. 13, 263. doi: 10.1038/s41396-018-0272-0
Desmond-Le Quéméner, E., Moscoviz, R., Bernet, N., and Marcus, A. (2021). Modeling of interspecies electron transfer in anaerobic microbial communities. Curr. Opin. Biotech. 67, 49–57. doi: 10.1016/j.copbio.2020.12.019
Ding, Y., Shi, Z., Ye, Q., Liang, Y., Liu, M., Dang, Z., et al. (2020). Chemodiversity of Soil Dissolved Organic Matter. Environ. Sci. Technol. 54, 6174–6184. doi: 10.1021/acs.est.0c01136
Dukovski, I., Bajić, D., Chacón, J. M., Quintin, M., Vila, J. C. C., Sulheim, S., et al. (2021). A metabolic modeling platform for the computation of microbial ecosystems in time and space (COMETS). Nat. Protoc. 16, 5030–5082. doi: 10.1038/s41596-021-00593-3
Ebrahimi, A., and Or, D. (2016). Microbial community dynamics in soil aggregates shape biogeochemical gas fluxes from soil profiles – upscaling an aggregate biophysical model. Glob. Change Biol. 22, 3141–3156. doi: 10.1111/gcb.13345
Fan, L., Dippold, M. A., Ge, T., Wu, J., Thiel, V., Kuzyakov, Y., et al. (2020). Anaerobic oxidation of methane in paddy soil: role of electron acceptors and fertilization in mitigating CH4 fluxes. Soil Biol. Biochem. 141:107685. doi: 10.1016/j.soilbio.2019.107685
Fanin, N., Fromin, N., Buatois, B., and Hättenschwiler, S. (2013). An experimental test of the hypothesis of non-homeostatic consumer stoichiometry in a plant litter–microbe system. Ecol. Lett. 16, 764–772. doi: 10.1111/ele.12108
Garayburu-Caruso, V. A., Stegen, J. C., Song, H.-S., Renteria, L., Wells, J., Garcia, W., et al. (2020). Carbon Limitation Leads to Thermodynamic Regulation of Aerobic Metabolism. Environ. Sci. Technol. Lett. 7, 517–524. doi: 10.1021/acs.estlett.0c00258
Gogulancea, V., González-Cabaleiro, R., Li, B., Taniguchi, D., Jayathilake, P. G., Chen, J., et al. (2019). Individual Based Model Links Thermodynamics, Chemical Speciation and Environmental Conditions to Microbial Growth. Front. Microb. 10:1871. doi: 10.3389/fmicb.2019.01871
González-Cabaleiro, R., Martinez-Rabert, E., Argiz, L., van Kessel, M. A., and Smith, C. J. (2021). A framework based on fundamental biochemical principles to engineer microbial community dynamics. Curr. Opin. Biotech. 67, 111–118. doi: 10.1016/j.copbio.2021.01.001
Graham, E. B., Tfaily, M. M., Crump, A. R., Goldman, A. E., Bramer, L. M., Arntzen, E., et al. (2017). Carbon Inputs From Riparian Vegetation Limit Oxidation of Physically Bound Organic Carbon Via Biochemical and Thermodynamic Processes. J. Geophys. Res. 122, 3188–3205. doi: 10.1002/2017JG003967
Großkopf, T., and Soyer, O. S. (2016). Microbial diversity arising from thermodynamic constraints. ISME J. 10, 2725–2733. doi: 10.1038/ismej.2016.49
Hall, S. J., McDowell, W. H., and Silver, W. L. (2013). When Wet Gets Wetter: decoupling of Moisture, Redox Biogeochemistry, and Greenhouse Gas Fluxes in a Humid Tropical Forest Soil. Ecosystems 16, 576–589. doi: 10.1007/s10021-012-9631-2
Heijnen, J. J., and Dijken, J. P. (1992). In search of a thermodynamic description of biomass yields for the chemotrophic growth of microorgansims. Pure App. Chem. 39, 833–852. doi: 10.1002/bit.260390806
Heijnen, J. J., van Loosdrecht, M. C. M., and Tijhuis, L. (1992). A black box mathematical model to calculate auto- and heterotrophic biomass yields based on Gibbs energy dissipation. Biotechnol. Bioeng. 40, 1139–1154. doi: 10.1002/bit.260401003
Helton, A. M., Ardón, M., and Bernhardt, E. S. (2015). Thermodynamic constraints on the utility of ecological stoichiometry for explaining global biogeochemical patterns. Ecol. Lett. 1049–1056. doi: 10.1111/ele.12487
Hoehler, T. M., and Jørgensen, B. B. (2013). Microbial life under extreme energy limitation. Nat. Rev. Microb. 11, 83–94. doi: 10.1038/nrmicro2939
Jayathilake, P. G., Gupta, P., Li, B., Madsen, C., Oyebamiji, O., González-Cabaleiro, R., et al. (2017). A mechanistic Individual-based Model of microbial communities. PLoS One 12:e0181965. doi: 10.1371/journal.pone.0181965
Jia, M., Winkler, M. K. H., and Volcke, E. I. P. (2020). Elucidating the Competition between Heterotrophic Denitrification and DNRA Using the Resource-Ratio Theory. Environ. Sci. Technol. 54, 13953–13962. doi: 10.1021/acs.est.0c01776
Jin, Q., and Bethke, C. M. (2007). The thermodynamics and kinetics of microbial metabolism. Am. J. Sci. 307, 643–677. doi: 10.2475/04.2007.01
Keiluweit, M., Nico, P. S., Kleber, M., and Fendorf, S. (2016). Are oxygen limitations under recognized regulators of organic carbon turnover in upland soils? Biogeochemistry 127, 157–171. doi: 10.1007/s10533-015-0180-6
Keiluweit, M., Wanzek, T., Kleber, M., Nico, P., and Fendorf, S. (2017). Anaerobic microsites have an unaccounted role in soil carbon stabilization. Nat. Comm. 8:1771. doi: 10.1038/s41467-017-01406-6
Kleerebezem, R., and Van Loosdrecht, M. C. (2010). A generalized method for thermodynamic state analysis of environmental systems. Crit. Rev. Env. Sci. Tech. 40, 1–54. doi: 10.1080/10643380802000974
Kobayashi, M., and Ishimoto, M. (1973). Aerobic inhibition of nitrate assimilation in Escherichia coli. Zeitschrift für allgemeine Mikrobiologie 13, 405–413. doi: 10.1002/jobm.19730130505
Kraft, B., Tegetmeyer, H. E., Sharma, R., Klotz, M. G., Ferdelman, T. G., Hettich, R. L., et al. (2014). The environmental controls that govern the end product of bacterial nitrate respiration. Science 345, 676–679. doi: 10.1126/science.1254070
Kuypers, M. M. M., Marchant, H. K., and Kartal, B. (2018). The microbial nitrogen-cycling network. Nat. Rev. Microbiol. 16, 263–276. doi: 10.1038/nrmicro.2018.9
LaCroix, R. E., Tfaily, M. M., McCreight, M., Jones, M. E., Spokas, L., and Keiluweit, M. (2019). Shifting mineral and redox controls on carbon cycling in seasonally flooded mineral soils. Biogeosciences 16, 2573–2589. doi: 10.5194/bg-16-2573-2019
LaRowe, D. E., and Amend, J. P. (2015). Catabolic rates, population sizes and doubling/replacement times of microorganisms in natural settings. Am. J. Sci. 315, 167–203. doi: 10.2475/03.2015.01
LaRowe, D. E., and Amend, J. P. (2016). The energetics of anabolism in natural settings. ISME J. 10, 1285–1295. doi: 10.1038/ismej.2015.227
LaRowe, D. E., and Amend, J. P. (2019). The Energetics of Fermentation in Natural Settings. Geomicrob. J. 36, 492–505. doi: 10.1080/01490451.2019.1573278
LaRowe, D. E., Arndt, S., Bradley, J. A., Estes, E. R., Hoarfrost, A., Lang, S. Q., et al. (2020). The fate of organic carbon in marine sediments - New insights from recent data and analysis. Earth-Sci. Rev. 204:103146. doi: 10.1016/j.earscirev.2020.103146
LaRowe, D. E., Dale, A. W., Amend, J. P., and Van Cappellen, P. (2012). Thermodynamic limitations on microbially catalyzed reaction rates. Geochimica et Cosmochimica Acta 90, 96–109. doi: 10.1016/j.gca.2012.05.011
LaRowe, D. E., and Van Cappellen, P. (2011). Degradation of natural organic matter: A thermodynamic analysis. Geochimica et Cosmochimica Acta 75, 2030–2042. doi: 10.1016/j.gca.2011.01.020
Lever, M. A., Rogers, K. L., Lloyd, K. G., Overmann, J., Schink, B., Thauer, R. K., et al. (2015). Life under extreme energy limitation: a synthesis of laboratory- and field-based investigations. FEMS Microb. Rev. 39, 688–728. doi: 10.1093/femsre/fuv020
Li, B., Taniguchi, D., Gedara, J. P., Gogulancea, V., Gonzalez-Cabaleiro, R., Chen, J., et al. (2019). NUFEB: a massively parallel simulator for individual-based modelling of microbial communities. PLoS Comp. Biol. 15:e1007125. doi: 10.1371/journal.pcbi.1007125
Li, Y., Shahbaz, M., Zhu, Z., Deng, Y., Tong, Y., Chen, L., et al. (2021). Oxygen availability determines key regulators in soil organic carbon mineralisation in paddy soils. Soil Biol. Biochem. 153:108106. doi: 10.1016/j.soilbio.2020.108106
Lin, J. T., and Stewart, V. (1997). “Nitrate Assimilation by Bacteria,” in Advances in Microbial Physiology, ed. R. K. Poole (Cambridge, MA: Academic Press), 1–30. doi: 10.1016/S0065-2911(08)60014-4
Lin, Y., Campbell, A. N., Bhattacharyya, A., DiDonato, N., Thompson, A. M., Tfaily, M. M., et al. (2021). Differential effects of redox conditions on the decomposition of litter and soil organic matter. Biogeochemistry 2V021:790. doi: 10.1007/s10533-021-00790-y
Liu, J. S., Vojinovic, V., Patiño, R., Maskow, T. H., and von Stockar, U. (2007). A comparison of various Gibbs energy dissipation correlations for predicting microbial growth yields. Thermochim. Acta 458, 38–46. doi: 10.1016/j.tca.2007.01.016
Manzoni, S., Čapek, P., Mooshammer, M., Lindahl, B. D., Richter, A., and Šantrůčková, H. (2017). Optimal metabolic regulation along resource stoichiometry gradients. Ecol. Lett. 20, 1182–1191. doi: 10.1111/ele.12815
Manzoni, S., Chakrawal, A., Spohn, M., and Lindahl, B. D. (2021). Modeling Microbial Adaptations to Nutrient Limitation During Litter Decomposition. Front. For. Glob. Change 4:686945. doi: 10.3389/ffgc.2021.686945
Manzoni, S., and Porporato, A. (2009). Soil carbon and nitrogen mineralization: theory and models across scales. Soil Biol. Biochem. 41, 1355–1379. doi: 10.1016/j.soilbio.2009.02.031
McCarty, P. L. (2007). Thermodynamic electron equivalents model for bacterial yield prediction: modifications and comparative evaluations. Biotechnol. Bioeng. 97, 377–388. doi: 10.1002/bit.21250
Mooshammer, M., Wanek, W., Zechmeister-Boltenstern, S., and Richter, A. A. (2014b). Stoichiometric imbalances between terrestrial decomposer communities and their resources: mechanisms and implications of microbial adaptations to their resources. Front. Microbiol. 2014:22. doi: 10.3389/fmicb.2014.00022
Mooshammer, M., Wanek, W., Hämmerle, I., Fuchslueger, L., Hofhansl, F., Knoltsch, A., et al. (2014a). Adjustment of microbial nitrogen use efficiency to carbon:nitrogen imbalances regulates soil nitrogen cycling. Nat. Comm. 5:3694. doi: 10.1038/ncomms4694
Ornes, S. (2017). Core Concept: How nonequilibrium thermodynamics speaks to the mystery of life. PNAS 114, 423–424. doi: 10.1073/pnas.1620001114
Polcyn, W., and Luciński, R. (2003). Aerobic and anaerobic nitrate and nitrite reduction in free-living cells of Bradyrhizobium sp. (Lupinus). FEMS Microbiol. Lett. 226, 331–337. doi: 10.1016/S0378-1097(03)00620-7
Prigogine, I. (1967). Introduction to thermodynamics of irreversible processes. Hoboken, NJ: John Wiley and Sons Inc.
Putz, M., Schleusner, P., Rütting, T., and Hallin, S. (2018). Relative abundance of denitrifying and DNRA bacteria and their activity determine nitrogen retention or loss in agricultural soil. Soil Biol. Biochem. 123, 97–104. doi: 10.1016/j.soilbio.2018.05.006
Rice, C. W., and Tiedje, J. M. (1989). Regulation of nitrate assimilation by ammonium in soils and in isolated soil microorganisms. Soil Biol. Biochem. 21, 597–602. doi: 10.1016/0038-0717(89)90135-1
Roels, J. A. (1980a). Application of macroscopic principles to microbial metabolism. Biotechnol. Bioeng. 22, 2457–2514. doi: 10.1002/bit.260221202
Roels, J. A. (1980b). Simple model for the energetics of growth on substrates with different degrees of reduction. Biotechnol. Bioeng. 22, 33–53. doi: 10.1002/bit.260220104
Santruckova, H., Kurbatova, J. A., Shibistova, O. B., Smejkalova, M., and Uhlirova, E. (2005). “Short-Term Kinetics of Soil Microbial Respiration — A General Parameter Across Scales?,” in Tree Species Effects on Soils: Implications for Global Change NATO Science Series IV: Earth and Environmental Sciences, eds D. Binkley and O. Menyailo (Dordrecht: Springer Netherlands), 229–246. doi: 10.1007/1-4020-3447-4_13
Schleuss, P.-M., Widdig, M., Heintz-Buschart, A., Guhr, A., Martin, S., Kirkman, K., et al. (2019). Stoichiometric controls of soil carbon and nitrogen cycling after long-term nitrogen and phosphorus addition in a mesic grassland in South Africa. Soil Biol. Biochem. 135, 294–303. doi: 10.1016/j.soilbio.2019.05.018
Schultz, P., and Urban, N. R. (2008). Effects of bacterial dynamics on organic matter decomposition and nutrient release from sediments: a modeling study. Ecol. Model. 210, 1–14. doi: 10.1016/j.ecolmodel.2007.06.026
Seto, M., and Iwasa, Y. (2020). How Thermodynamics Illuminates Population Interactions in Microbial Communities. Front. Ecol. Evol. 8:602809. doi: 10.3389/fevo.2020.602809
Shapiro, B., Hoehler, T. M., and Jin, Q. (2018). Integrating genome-scale metabolic models into the prediction of microbial kinetics in natural environments. Geochimica et Cosmochimica Acta 242, 102–122. doi: 10.1016/j.gca.2018.08.047
Sinsabaugh, R. L., Manzoni, S., Moorhead, D. L., and Richter, A. (2013). Carbon use efficiency of microbial communities: Stoichiometry, methodology and modelling. Ecol. Lett. 16, 930–939. doi: 10.1111/ele.12113
Sistla, S. A., Asao, S., and Schimel, J. P. (2012). Detecting microbial N-limitation in tussock tundra soil: Implications for Arctic soil organic carbon cycling. Soil Biol. Biochem. 55, 78–84. doi: 10.1016/j.soilbio.2012.06.010
Smeaton, C. M., and Van Cappellen, P. (2018). Gibbs Energy Dynamic Yield Method (GEDYM): Predicting microbial growth yields under energy-limiting conditions. Geochimica et Cosmochimica Acta 241, 1–16. doi: 10.1016/j.gca.2018.08.023
Song, H.-S., Stegen, J. C., Graham, E. B., Lee, J.-Y., Garayburu-Caruso, V. A., Nelson, W. C., et al. (2020). Representing Organic Matter Thermodynamics in Biogeochemical Reactions via Substrate-Explicit Modeling. Front. Microbiol. 11:531756. doi: 10.3389/fmicb.2020.531756
Stegen, J. C., Johnson, T., Fredrickson, J. K., Wilkins, M. J., Konopka, A. E., Nelson, W. C., et al. (2018). Influences of organic carbon speciation on hyporheic corridor biogeochemistry and microbial ecology. Nat. Comm. 9:585. doi: 10.1038/s41467-018-02922-9
Sterner, R. W., and Elser, J. J. (2002). Ecological Stoichiometry. Princeton University Press. Available online at: http://www.jstor.org/stable/j.ctt1jktrp3 (accessed date August 2, 2021).
Stockar, U. (2010). Biothermodynamics of live cells: a tool for biotechnology and biochemical engineering. J. Non-Equilib. Thermodyn. 35, 415–475. doi: 10.1515/jnetdy.2010.024
Stouthamer, A. H. (1977). Theoretical calculations on the influence of the inorganic nitrogen source on parameters for aerobic growth of microorganisms. Antonie van Leeuwenhoek 43, 351–367. doi: 10.1007/BF02313762
Strohm, T. O., Griffin, B., Zumft, W. G., and Schink, B. (2007). Growth Yields in Bacterial Denitrification and Nitrate Ammonification. Appl. Environ. Microbiol. 73, 1420–1424. doi: 10.1128/AEM.02508-06
Tang, J., and Riley, W. J. (2021). Finding Liebig’s law of the minimum. Ecol. Appl. 31:e02458. doi: 10.1002/eap.2458
Tiedje, J. M., Sørensen, J., and Chang, Y.-Y. L. (1981). Assimilatory and dissimilatory nitrate reduction: perspectives and methodology for simultaneous measurement of several nitrogen cycle processes. Ecol. Bull. 1981, 331–342.
van de Leemput, I. A., Veraart, A. J., Dakos, V., de Klein, J. J. M., Strous, M., and Scheffer, M. (2011). Predicting microbial nitrogen pathways from basic principles. Env. Microb. 13, 1477–1487. doi: 10.1111/j.1462-2920.2011.02450.x
van den Berg, E. M., Boleij, M., Kuenen, J. G., Kleerebezem, R., and van Loosdrecht, M. C. M. (2016). DNRA and Denitrification Coexist over a Broad Range of Acetate/N-NO3- Ratios, in a Chemostat Enrichment Culture. Front. Microbiol. 7:1842. doi: 10.3389/fmicb.2016.01842
Von Stockar, U., Maskow, T., Liu, J., Marison, I. W., and Patiño, R. (2006). Thermodynamics of microbial growth and metabolism: an analysis of the current situation. J. Biotechnol. 121, 517–533. doi: 10.1016/j.jbiotec.2005.08.012
von Stockar, U., Vojinović, V., Maskow, T., and Liu, J. (2008). Can microbial growth yield be estimated using simple thermodynamic analogies to technical processes? Chem. Eng. Proc. 47, 980–990. doi: 10.1016/j.cep.2007.02.016
Wang, Y., Wang, H., He, J.-S., and Feng, X. (2017). Iron-mediated soil carbon response to water-table decline in an alpine wetland. Nat. Comm. 8:15972. doi: 10.1038/ncomms15972
Webster, J. R., Newbold, J. D., Thomas, S. A., Valett, H. M., and Mulholland, P. J. (2009). Nutrient Uptake and Mineralization during Leaf Decay in Streams – a Model Simulation. Internat. Rev. Hydrob. 94, 372–390. doi: 10.1002/iroh.200811158
Westerhoff, H. V., Lolkema, J. S., Otto, R., and Hellingwerf, K. J. (1982). Thermodynamics of growth non-equilibrium thermodynamics of bacterial growth the phenomenological and the Mosaic approach. Biochimica et Biophysica Acta (BBA) 683, 181–220. doi: 10.1016/0304-4173(82)90001-5
White, C., and Gadd, G. M. (1996). A comparison of carbon/energy and complex nitrogen sources for bacterial sulphate-reduction: potential applications to bioprecipitation of toxic metals as sulphides. J. Indust. Microb. Biotechnol. 17, 116–123. doi: 10.1007/BF01570054
Wild, B., Schnecker, J., Alves, R. J. E., Barsukov, P., Bárta, J., Čapek, P., et al. (2014). Input of easily available organic C and N stimulates microbial decomposition of soil organic matter in arctic permafrost soil. Soil Biol. Biochem. 75, 143–151. doi: 10.1016/j.soilbio.2014.04.014
Williams, E. K., and Plante, A. F. (2018). A Bioenergetic Framework for Assessing Soil Organic Matter Persistence. Front. Earth Sci. 6:143. doi: 10.3389/feart.2018.00143
Worrall, F., Moody, C. S., Clay, G. D., Burt, T. P., Kettridge, N., and Rose, R. (2018). Thermodynamic Control of the Carbon Budget of a Peatland. J. Geophys. Res. 123, 1863–1878. doi: 10.1029/2017JG003996
Wray, L. V., Ferson, A. E., Rohrer, K., and Fisher, S. H. (1996). TnrA, a transcription factor required for global nitrogen regulation in Bacillus subtilis. Proc. Natl. Acad. Sci. U S A 93, 8841–8845. doi: 10.1073/pnas.93.17.8841
Wutzler, T., Zaehle, S., Schrumpf, M., Ahrens, B., and Reichstein, M. (2017). Adaptation of microbial resource allocation affects modelled long term soil organic matter and nutrient cycling. Soil Biol. Biochem. 115, 322–336. doi: 10.1016/j.soilbio.2017.08.031
Zakem, E. J., Mahadevan, A., Lauderdale, J. M., and Follows, M. J. (2020). Stable aerobic and anaerobic coexistence in anoxic marine zones. ISME J. 14, 288–301. doi: 10.1038/s41396-019-0523-8
Zhang, H., Goll, D. S., Manzoni, S., Ciais, P., Guenet, B., and Huang, Y. (2018). Modeling the effects of litter stoichiometry and soil mineral N availability on soil organic matter formation using CENTURY-CUE (v1.0). Geoscient. Model Dev. 11, 4779–4796. doi: 10.5194/gmd-11-4779-2018
Keywords: microbial growth, nitrogen limitation, energy limitation, thermodynamics, bioenergetics, stoichiometry, DNRA, denitrification
Citation: Chakrawal A, Calabrese S, Herrmann AM and Manzoni S (2022) Interacting Bioenergetic and Stoichiometric Controls on Microbial Growth. Front. Microbiol. 13:859063. doi: 10.3389/fmicb.2022.859063
Received: 20 January 2022; Accepted: 07 April 2022;
Published: 17 May 2022.
Edited by:
Eoin L. Brodie, Berkeley Lab (DOE), United StatesReviewed by:
Beate Kraft, University of Southern Denmark, DenmarkJinyun Tang, Berkeley Lab (DOE), United States
Copyright © 2022 Chakrawal, Calabrese, Herrmann and Manzoni. This is an open-access article distributed under the terms of the Creative Commons Attribution License (CC BY). The use, distribution or reproduction in other forums is permitted, provided the original author(s) and the copyright owner(s) are credited and that the original publication in this journal is cited, in accordance with accepted academic practice. No use, distribution or reproduction is permitted which does not comply with these terms.
*Correspondence: Arjun Chakrawal, YXJqdW4uY2hha3Jhd2FsQG5hdGdlby5zdS5zZQ==