
94% of researchers rate our articles as excellent or good
Learn more about the work of our research integrity team to safeguard the quality of each article we publish.
Find out more
ORIGINAL RESEARCH article
Front. Microbiol., 23 March 2022
Sec. Terrestrial Microbiology
Volume 13 - 2022 | https://doi.org/10.3389/fmicb.2022.834751
This article is part of the Research TopicGetting Down to the Mechanism of Biochar Effects on the Functioning of Plant-Soil SystemsView all 11 articles
 Izhar Ali1
 Pengli Yuan1
 Saif Ullah1
 Anas Iqbal2Quan Zhao1He Liang1
 Abdullah Khan1
 Imran3Hua Zhang1Xiaoyan Wu1Shanqing Wei1Minghua Gu1
 Ligeng Jiang1*
Biochar amendment can influence the abundance, activity, and community structure of soil microbes. However, scare information is present about the effect of the combined application of biochar with synthetic nitrogen (N) fertilizer under paddy field condition. We aimed to resolve this research gap in rice field conditions through different biochar in combination with N fertilizers on soil nutrients, soil microbial communities, and rice grain yield. The present study involves eight treatments in the form of biochar (0, 10, 20, and 30 t ha–1) and N (135 and 180 kg ha–1) fertilizer amendments. The soil microbial communities were characterized using high-throughput sequencing of 16S and Internal transcribed spacer (ITS) ribosomal RNA gene amplicons. Experiential findings showed that the treatments had biochar amendments along with N fertilizer significantly advanced soil pH, soil organic carbon (SOC), total nitrogen (TN), soil microbial carbon (SMBC), soil microbial nitrogen (SMBN), and rice grain yield in comparison to sole N application. Furthermore, in comparison with control in the first year (2019), biochar amendment mixed with N fertilizer had more desirable relative abundance of microorganism, phyla Acidobacteria, Actinobacteria, Proteobacteria, and Verrucomicrobia with better relative abundance ranging from 8.49, 4.60, 46.30, and 1.51% in T7, respectively. Similarly, during 2020, bacteria phyla Acidobacteria, Actinobacteria, Bacteroidetes, Gemmatimonadetes, Planctomycetes, and Verrucomicrobia were resulted in higher and ranging from 8.69, 5.18, 3.5, 1.9, 4.0, and 1.6%, in biochar applied treatments, respectively, as compared to control (T1). Among the treatments, Sphingopyxis and Thiobacillus bacterial genus were in higher proportion in T7 and T3, respectively, as compared to other treatments and Bacillus was higher in T6. Interestingly, biochar addition significantly decreased the soil fungi phyla Ascomycota, Basidiomycota, Chytridiomycota, and Rozellomycota, in 2020 as compared to 2019. Whereas biochar addition to soil decreased Echria, Kohlmeyeriopsis, and Westerdykella fungal genus as compared to non-biochar treatments. The redundancy analysis showed that soil biochemical traits were positively correlated with soil bacteria. In addition, correlation analysis showed that soil bacteria including Acidobacteria, Actinobacteria, Bacteroidetes, Planctomycetes, and Proteobacteria strongly correlated with rice grain yield. This study demonstrated that soil nutrients and bacteria contribute to an increase in rice yield in combined biochar amendment with lower N treatments.
Soil microorganisms play an important role in the soil ecosystem, which are important for soil quality and agricultural productivity. They have an impact on several critical and fundamental ecosystem processes, such as organic matter decomposition, nutrient mineralization, soil functionality, and plant nutrient uptake and growth (Bending et al., 2004; Khan et al., 2021). Soil management practices directly affect the abundance and structure of soil microbes (Li et al., 2012). Furthermore, bacteria are the most diverse and abundant group of soil microorganisms, which play a significant role in the decomposition and mineralization of organic matter and nutrients and the development of soil aggregates (Lian et al., 2019; Ali et al., 2020a; Bu et al., 2020), consequently, influencing soil fertility and plant growth (Tardy et al., 2015). Microorganisms have a distinct role in the decomposition and degradation of organic matter through extracellular enzyme and degrade the macromolecule to monomers to be utilized by the plant (Bending et al., 2004; Harris, 2009). Furthermore, the degradation of plant residues by microorganisms also leads to soil nutrient turnover and circulation, such as carbon (C) and nitrogen (N) cycling and soil aggregate formation (Brennan and Acosta-Martinez, 2017). Several studies reported that the soil pH, organic matter, and other soil properties influenced the soil community composition (Eldridge et al., 2015; Creamer et al., 2016; Pan et al., 2020). Previously, it is well reported that biochar application in combination with N fertilizer improves soil physiochemical properties and crop production (Ali et al., 2020a,b, 2021; Ullah et al., 2021a,b). However, the information on biochar in combination with synthetic N fertilizer on soil microbial and fungal community structure and composition under paddy field condition is not well reported.
Biochar is a carbon-rich, stable product that is produced by the burning of organic material (biomass) of agricultural and forestry wastes, animal bones, algae, and animal manures via a controlled process called pyrolysis (Lehmann and Joseph, 2015). Biochar has aromatic and heterocyclic C compounds in its chemical structure, making it resistant to microbial degradation (Ameloot et al., 2013; Anyika et al., 2015). As a soil amendment application, biochar has unique physical and chemical features. Biochar can increase crop growth, yield, and quality by improving soil chemical properties, boosting soil microbial biomass, and enhancing microbial growth and reproduction (Agegnehu et al., 2017; Yu et al., 2019). The addition of biochar to soil decreased soil compactness and affected soil water holding capacity and microbial growth (Liu et al., 2017; Li et al., 2018). Soil microbial populations, community structure, and physiological activity can be affected by biochar application to soil due to their sensitivity of soil microbes (Dempster et al., 2012; Dai et al., 2016). In addition, previous studies reported that application of biochar either increased or decreased the activities of the enzymes, which is related to the transformation of N, C, and P in soil (Bailey et al., 2011; Gomez et al., 2014). Furthermore, it is observed that increasing biochar rate proportionally increased soil microbial abundance (Gomez et al., 2014), whereas, Ameloot et al. (2014) reported the contrast results that 49 t biochar per hectare introverted microbial activity and condensed both extractable phospholipid fatty acid (PLFA) concentration and fungal abundance.
Biochar combined with N fertilizers not only significantly mitigated the problems of excessive fertilizer use such as environmental pollution but also improves soil microorganism abundance and soil enzymes (Ali et al., 2020a). This research is based on continuous long-term research in paddy fields under dual cropping systems, with the following research objectives: (i) characterize the influence of biochar and N application on rice grain yield, soil biochemical properties, and microbial community composition and function; (ii) examine the effect of fertilization on the relationships between microbial community and soil environmental factors; and (iii) measure the contributions of different fertilization regimes, soil biochemical traits, and microorganisms to enhance in rice production. The primary goal of this research is to provide a theoretical framework for sustainable agriculture practices to improve rice production with the use of biochar under lower chemical fertilizers.
The study was conducted at the research farm of Guangxi University, China (22°49′12″ N, 108°19′11″ E; 75 m), in 2019–2020. The climate is classified as subtropical monsoon, and the mean temperature and mean precipitation values of both years are shown in Table 1 (local weather station). The soil (0–20 cm) is graded as Ultisols and is slightly acidic (pH 5.94), soil organic carbon (SOC) 15.10 g kg–1, soil organic matter 25.8 g kg–1, total N (TN) 1.35 g kg–1, available N (AN) 134.7 mg kg–1, available phosphorous (23.1 mg kg–1), and available potassium (AK 233.6 mg kg–1, with 1.36 g cm–3 soil bulk density (BD).
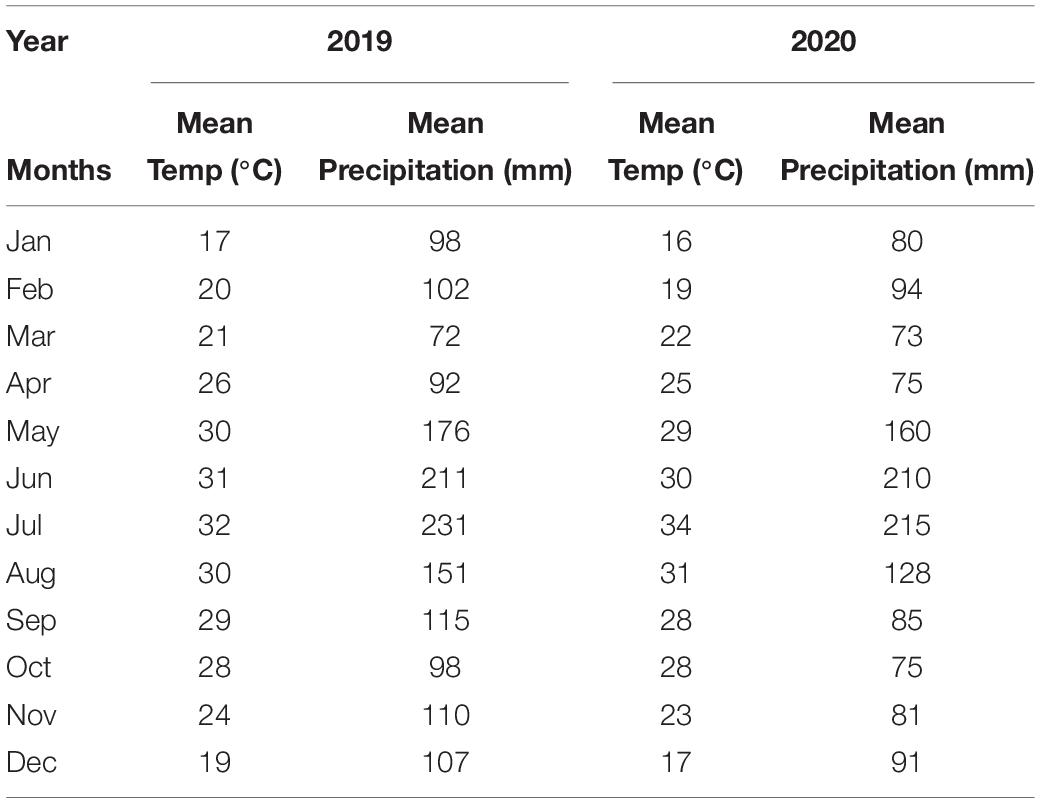
Table 1. Mean temperature and mean precipitation during both year.
Cassava straw was used in kilns with the temperature ranging 300–500°C by following the method previously documented by Mia et al. (2015). The properties of biochar were C (674.00 g kg–1), H (3.81 g kg–1), P (46.33 g kg–1), N (5.43 g kg–1), K (48.33 g kg–1), S (2.39 g kg–1), specific area (2.46 m2 g–1), and pore diameter (3.37 nm) with C:N ratio (124.12.) and are presented in our previous study (Ali et al., 2020a).
The field experiment was conducted in a randomized complete block (RCB) design having three replications and a plot size of 3.9 by 6 m (23 m–2) during 2019 and 2020. The experiment consisted of four biochar rates (0, 10, 20, and 30 ton ha–1) and two N levels (135 and 180 kg ha–1). Biochar amendment was applied once in 2019, whereas N application was applied in both years. The treatments combinations were as follows: T1 = 0 t B + N135 kg ha–1, T2 = 0 t B + N180 kg ha–1, T3 = 10 t B + N135 kg ha–1, T4 = 20 t B + N135 kg ha–1, T5 = 30 t B + N135 kg ha–1, T6 = 10 t B + N180 kg ha–1, T7 = 20 t B + N180 kg ha–1, and T8 = 30 t B + N180 kg ha–1. The cultivar “Zhenguiai” of noodle rice was utilized as a test crop. Plastic trays were used for the nursery and uniform seedlings were transplanted as two seedlings per hill and 13 rows per plot after 25 days. The locally recommended doses of phosphorus and potassium were applied at the rate of 75 and 150 kg ha–1, respectively. The biochar was introduced to the field 25 days before the transplantation of seedlings. At the panicle initiation stage, when plant growth is at its highest, soil samples were collected near the rhizosphere. The soil samples were transported to the lab in an icebox and stored at −80°C for later use.
Soil samples were taken by a core sampler at depth 0–20 cm after the late-season rice harvest in 2019–2020. Soil sampling was done at different locations within each plot and combined to make a composite sample. The composite samples were divided into two parts, with one part frozen at −80°C for later DNA extraction and microbial biomass C and N measurement, and the second half was air-dried and utilized to determine soil chemical characteristics.
SOC was measured by the K2Cr2O7-H2SO4 oxidation process followed by titration (Wang et al., 2014). To determine soil TN, a subsample of 200 mg was treated using the salicylic acid–sulfuric acid–hydrogen peroxide method previously described by Ohyama et al. (1991), and TN was determined using the micro-Kjeldahl technique according to Jackson (1956). In addition, soil pH and available N, P, and K were assessed by the methods of Lu et al. (2015). The fumigation extraction method was used to measure microbial biomass carbon (MBC) as defined by Brookes et al. (1985) and microbial biomass nitrogen (MBN) according to the method of Vance et al. (1987).
DNA samples were extracted using the Fast DNA™ spin kit for soil (MP Biomedicals, US) following the manufacturer’s instructions. The DNA concentration was measured using NanoDrop 2000 (Thermo Fisher Scientific, Wilmington, DE, United States), and the quality of PCR products was detected by 2% agarose gel electrophoresis. The V3–V4 region of the 16S rRNA gene was amplified with primer pairs 515F (GTGCCAGCMGCCGCGG) and 907R (CCGTCAATTCMTTTRAGTTT). The primer pair Internal transcribed spacer (ITS) 1F (CTTGGTCA- TTTAGAGGAAGTAA) and ITS 2R (GCTGCGTTC- TTCATCGATGC) was used to amplify the ITS 1 region of fungi. The PCR and sequencing processes were performed by Majorbio Bio-Pharm Technology Co., Ltd. (Shanghai, China) using the Illumina MiSeq PE300 platform. The data were analyzed on the free Majorbio Cloud Platform.1
The paired reads were spliced using FLASH (version 1.2.3) software to merge the sequences before assembling a gene segment (Magoc and Salzberg, 2011). Chimeric sequences were identified and removed with a de novo method using USEARCH (version 8.1.1861) (Edgar, 2010). After the removal of the chimera, high-quality bacterial sequences were collected for subsequent analysis.
Effective bacterial sequences were separately subsampled for each sample for the subsequent statistical analysis. After subsampling, the data were processed using a modified SOP pipeline on the basis of USEARCH and the software package QIIME (Quantitative Insights Into Microbial Ecology v1.8.0) (Tian et al., 2015). Briefly, the selected sequences were clustered to operational taxonomic units (OTU) using a two-stage clustering algorithm with USEARCH (version 8.1.1861) at 97% sequence identity (Edgar, 2010). Representative sequences in each OTU were aligned to the SILVA reference alignment (Yilmaz et al., 2014). Taxonomy was assigned to each representative sequence using RDP with a minimum confidence of 85%.
An OTU-based analysis method was used to evaluate the bacterial diversities in each sample from each plant (alpha diversity). To estimate the diversity index and species richness (alpha diversity) among the genotypes for each sample, OTU richness and Chao1, Simpson, and Shannon indices were calculated using QIIME software (v1.8.0), concerning a sequencing depth of 3%. Statistical analysis was performed using ANOVA with p-values to determine the significant differences in the diversity indices or species richness among the plant rhizosphere soil samples. The rarefaction curve and rank abundance curves were calculated at a 97% level of similarity of the OTUs.
Beta diversity analysis was used among all the samples for the similarity index determination of the community structure. At the OTU level of genotypes, beta diversity was calculated using weighted UniFrac distances and was visualized through PCoA (principal coordinate analysis). The weighted UniFrac distance matrices were clustered and evaluated by QIIME software (v1.8.0) and showed phylogenetic relationships among various communities and their abundance in the respective samples.
At maturity, the rice plants were harvested from the whole plot and rice grain yields was weighed. The dry weight of the rice grain was determined assuming adjusted 14% moisture content in rice grains.
Statistics 8.1 analytical software was used to determine the analysis of variance among the treatments for each variable. Alpha diversity of bacteria and fungi including Simpson, Shannon, Chao1, and ACE indices was calculated using QIIME software (v1.8.0). Rarefaction curves of the species richness were plotted against the number of sequences, and the analysis of the dominant phyla was done using the Microbiome Analyst (Dhariwal et al., 2017). Redundancy analysis (RDA) was performed using the software package CANOCO5 (Microcomputer Power, Ithaca, United States) to measure soil properties and soil microbial diversity relationship. R (3.2) software was used to conduct correlation analysis among treatments for soil microbial abundance, soil properties, and grain yield. SmartPls3 software was used to analyze consistence multi-group analysis (MGAc) among the treatments for all attributes.
Co-application of biochar and mineral N significantly improved the soil pH, SOC, TN, MBC, and MBN in 0–20 cm soil depth, compared with sole chemical N fertilizer application (Table 2). In all measured traits, the effect was highest under high biochar amendment input with no significant differences between 20 and 30 t ha–1 of biochar application. Across the years, the treatments exhibited the same behavior. Compared to sole N-treated plots (T1 and T2), higher biochar applied treatments (T4 and T8) improved soil pH, TN, SOC, SMBN, and SMBC by 15, 38, 26.17, 94, and 129% respectively, during 2019. Similarly, in 2020, soil pH, TN, SOC, SMBN, and SMBC were increased by 16, 44, and 32% in T4, respectively, as compared to T1. Whereas soil BD was decreased by 7.5 and 9% in non-biochar treatments (T1 and T2) as compared to higher biochar applied treatment (T4). SMBN was averagely increased in T4, T7, and T8 by 50, 80, and 95%, respectively, during both years as compared to T1. Similarly, SMBC was averagely enhanced by 134, 126, and 128% in T4, T7, and T8, respectively, as compared to T1 during both years.

Table 2. Response of soil properties to different biochar and nitrogen fertilizer treatments.
After screening, pre-clustering, and chimera removal, a total of 1,318,797 reads of high-quality bacterial 16S rRNA from the V3–V4 region were obtained, with an average of 54,949 reads per sample, having 32 phyla, 75 classes, 107 orders, 168 families, and 250 genera during 2019. Whereas, during 2020, a total of 763,986 reads were amplified with an average reads of 31,832 per sample, having 25 phyla, 66 classes, 100 orders, 170 families, and 253 genera during 2020. The unique numbers of OTUs were 76, 66, 64, 65, 76, 99, 175, and 58 in T1, T2, T3, T4, T5, T6, T7, and T8, respectively (Figure 1A). In 2020, the unique numbers of OTUs were 1, 1, 1, 1 and 10 in T1, T5, T6, T7, and T8, respective (Figure 1B).
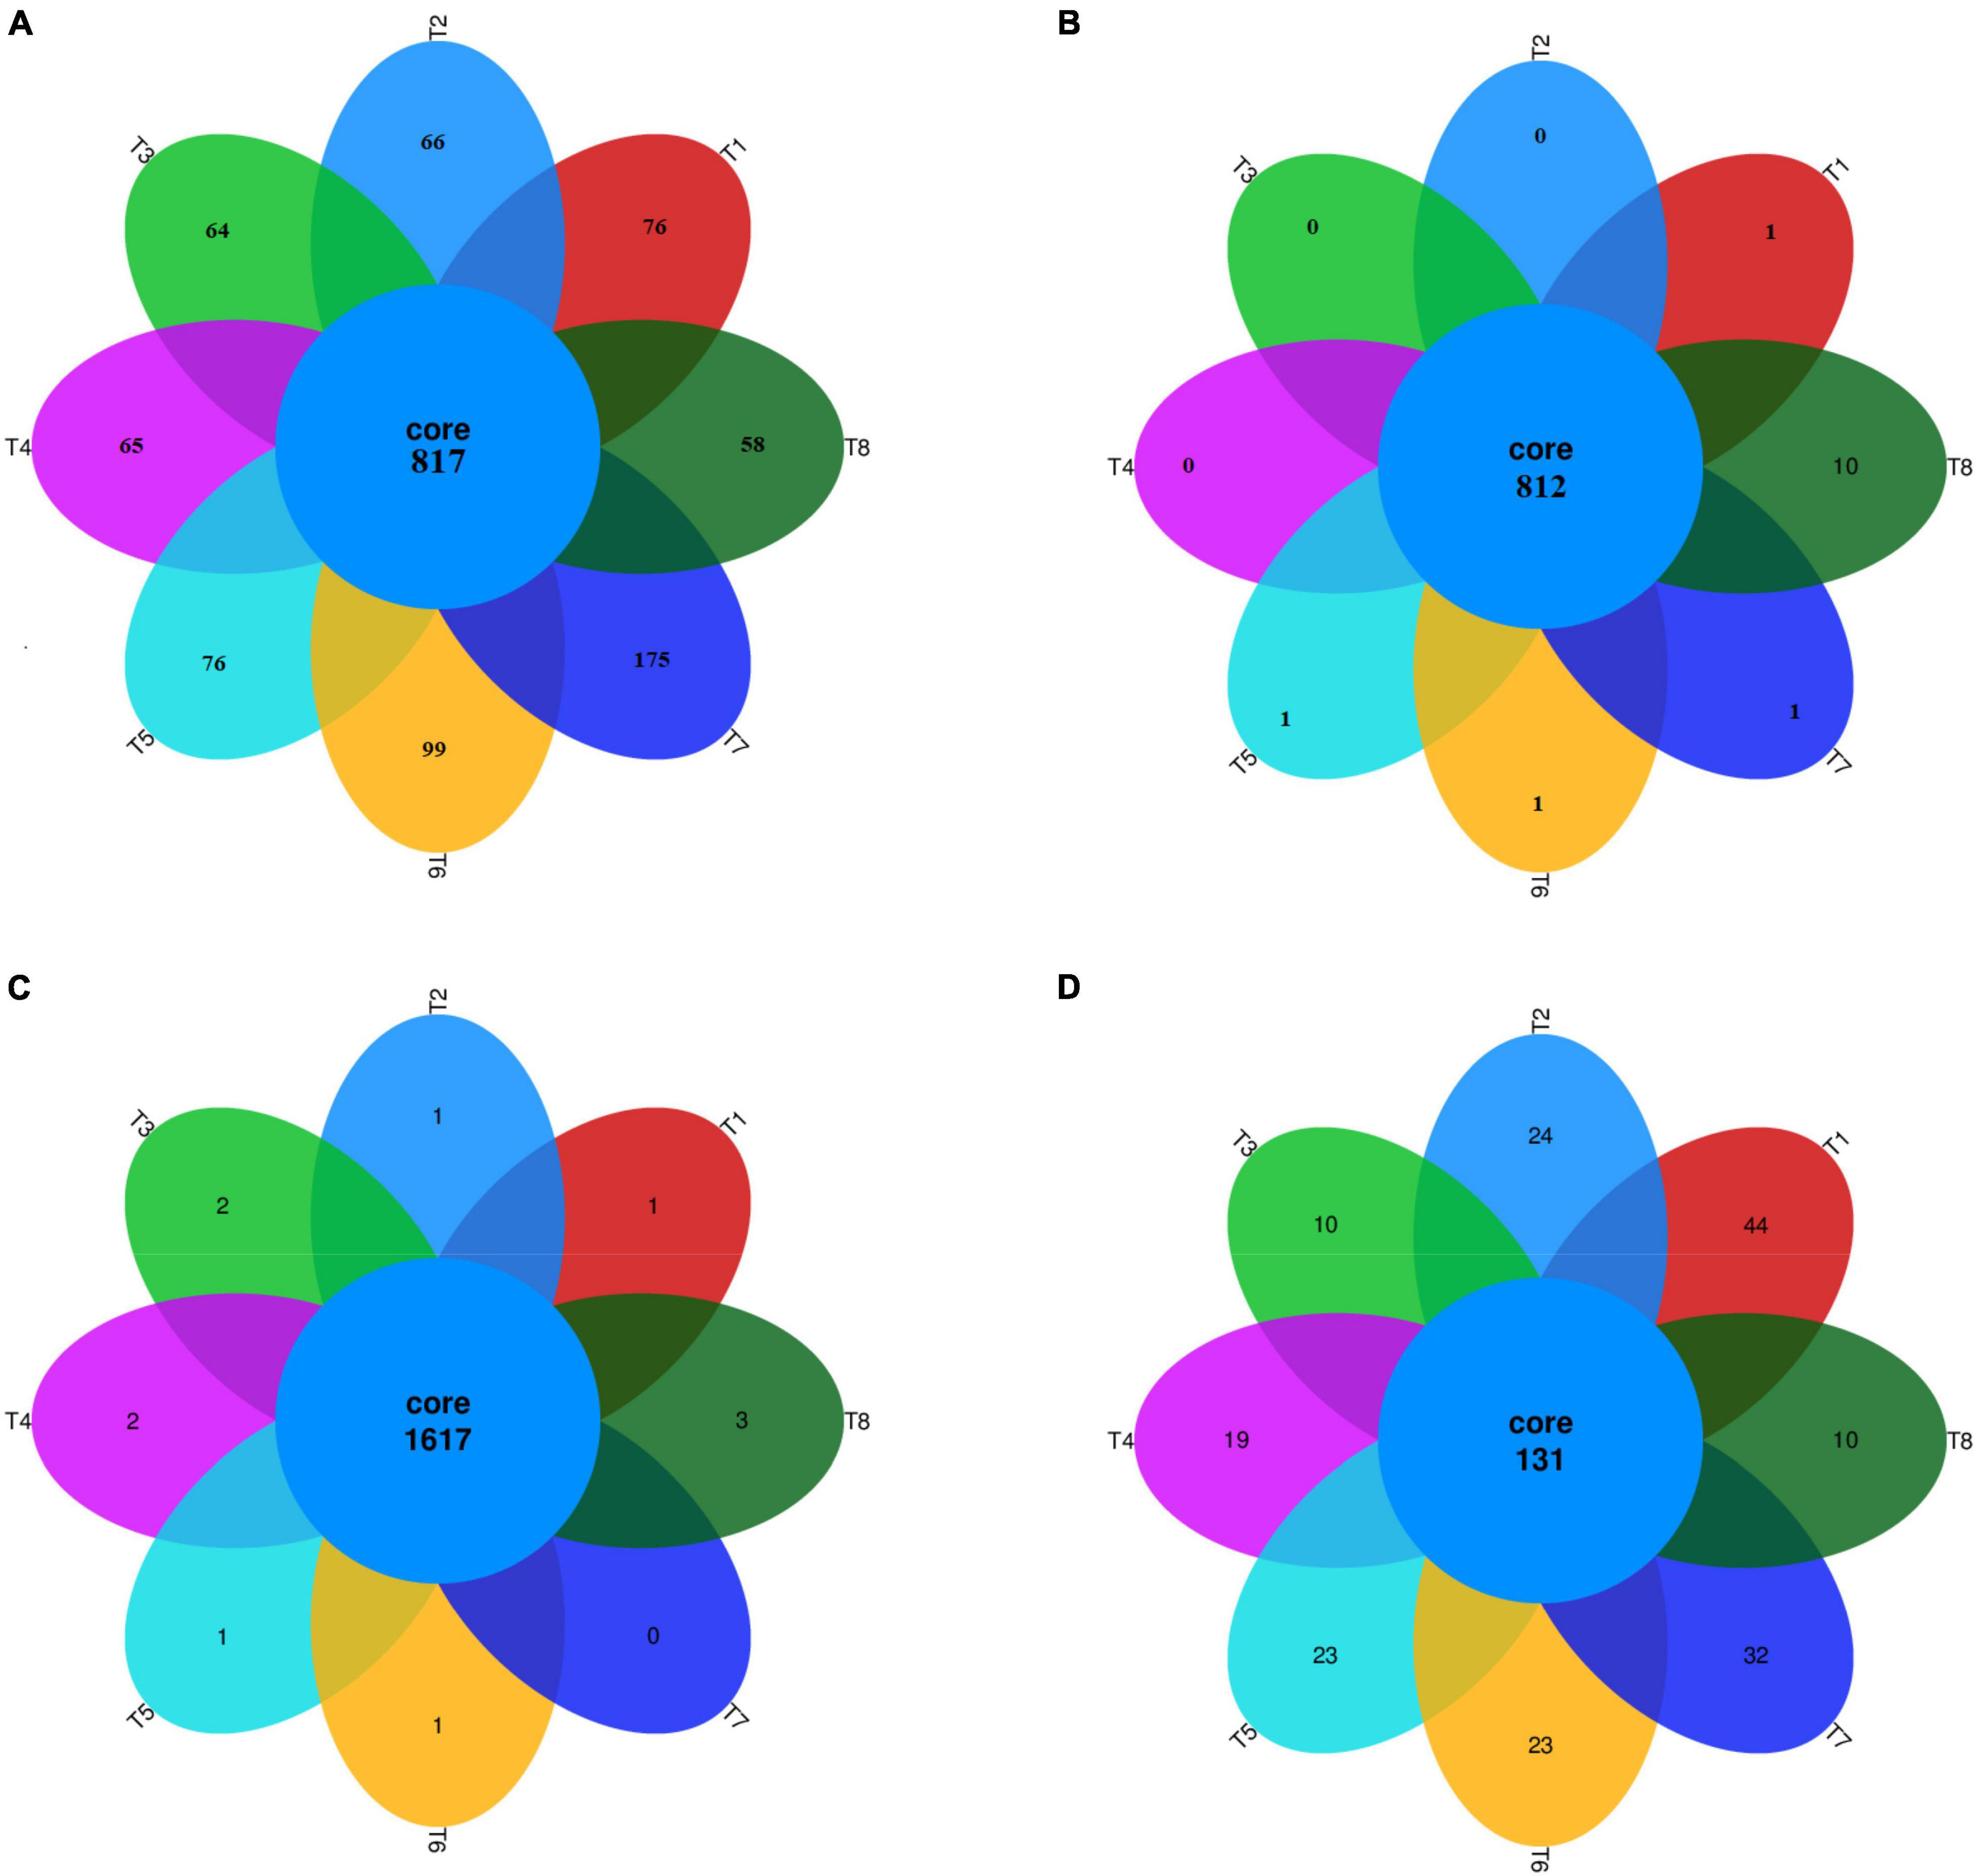
Figure 1. Venn diagram. A Venn diagram representing unique and shred OTU’s of bacteria and fungi during 2019 (A,C) and 2020 (B,D), respectively, among the different treatments. T1 = 0 t B + N135 kg ha1, T2 = 0 t B + N180 kg ha1, T3 = 10 t B + N135 kg ha–1, T4 = 20 t B + N135 kg ha–1, T5 = 30 t B + N135 kg ha1, T6 = 10 t B + N180 kg ha1, T7 = 20 t B + N180 kg ha–1, and T8 = 30 t B + N180 kg ha–1.
A total of 756,790 reads were amplified for the fungal population, with an average reads per sample 31,532, having 10 phyla, 22 classes, 50 orders, 74 families, 94 genera, and 102 species, during 2019. The unique numbers of OTUs were 1, 1, 2, 2, 1, 1, 0, and 3 in T1, T2, T3, T4, T5, T6, T7, and T8, respectively (Figure 1C). Similarly, during 2020, a total of 404,210 reads were amplified with an average reads per sample of 16,842, having 10 phyla, 20 classes, 47 orders, 69 families, 84 genera, and 94 species. The unique numbers of OTUs were 44, 24, 10, 19, 23, 23, 32, and 10 in T1, T2, T3, T4, T5, T6, T7, and T8, respectively (Figure 1D). The results showed that the fungal OTU numbers were significantly decreased in biochar applied treatments as compared to other treatments (Supplementary Files-Presentation 1- and Table 1).
The bacterial relative abundance of major bacterial phylum in each treatment is shown in Figure 2. The dominant bacterial phylum across all the treatments was Proteobacteria, Acidobacteria, Actinobacteria, Bacteroidetes, Gemmatimonadetes, Planctomycetes, Verrucomicrobia, and Chloroflexi among the others. The results showed that Proteobacteria were more (> 5%) abundant in all the treatments. Higher relative abundance of Proteobacteria was found in T7 and T3 during 2019 and 2020, respectively, compared to other treatments. The second most abundant bacteria were Chloroflexi and were not significantly influenced by biochar and N fertilizer. Among the treatments, Actinobacteria, Proteobacteria, and Verrucomicrobia were higher in relative abundance ranging from 4.3, 47.98, and 1.3% in T7 as compared to control treatment (T1) in 2019. Similarly, compared to control (T1), Acidobacteria and unclassified bacteria were observed higher in relative abundance ranging from 17.56 and 10.23% in T6 and T4, respectively, during 2019 as compared to the control treatments. Furthermore, the relative abundance of Bacteroidetes, Gemmatimonadetes, and Planctomycetes were higher ranging from 20.64, 7.85, and 6.96%, respectively, in T5 over control treatment (T1) in 2019. Chloroflexi and Firmicutes resulted in higher relative abundance by 9.85 and 9.81%, respectively, in T8 and then control treatment (T1) during 2019. Whereas, during 2020, Acidobacteria, Actinobacteria, Bacteroidetes, Gemmatimonadetes, Planctomycetes, and Verrucomicrobia resulted higher in biochar plots by 12.4, 7.15, 99.41, 62.7, 74.92, and 20.6%, respectively, as compared to control (T1) (Figure 2). Chloroflexi, Firmicutes, Proteobacteria, and unclassified bacteria were not significantly influenced by biochar and N application during 2020, where between the years, Chloroflexi, Firmicutes, and Proteobacteria were decreased in 2020 as compared to 2019.
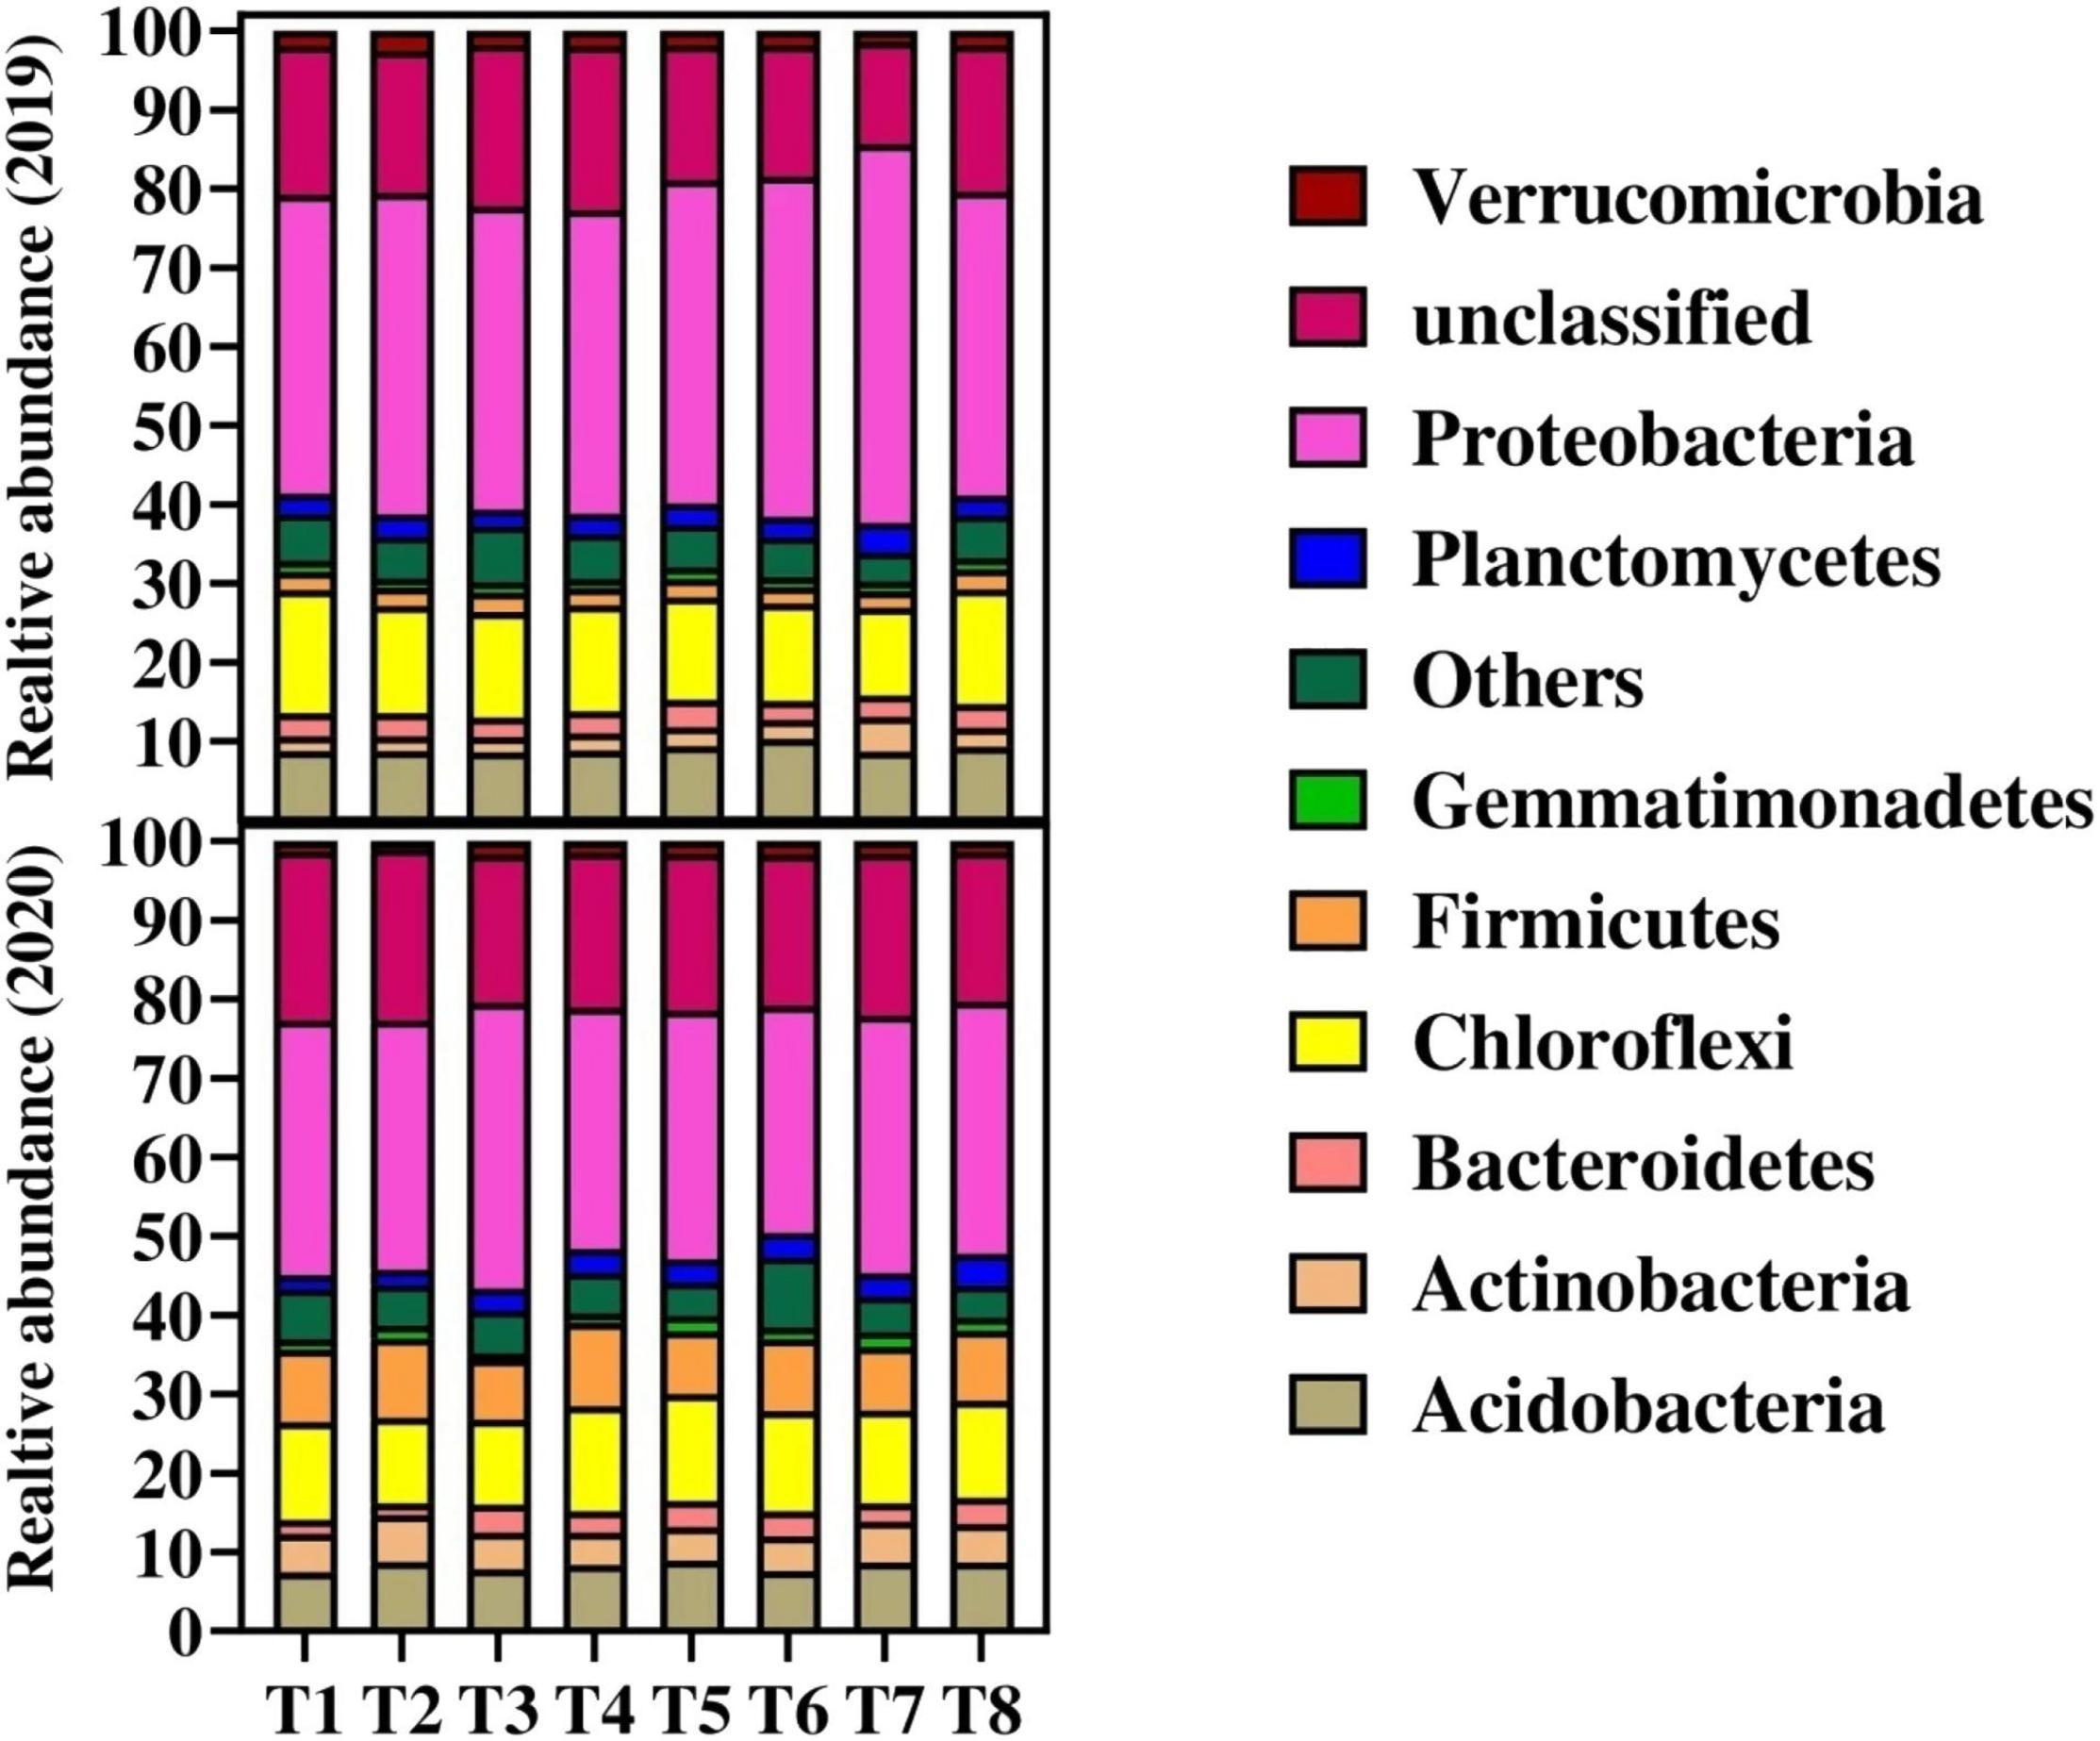
Figure 2. Changes in relative abundance on bacterial species on phylum level in response to different treatments. Distinct colored columns represent different species, and the length of the columns represents the species’ proportion. For treatment combination details (see Table 1).
The relative abundance of fungal species at phylum level among all the treatments during 2019 and 2020 is shown in Figure 3. The results showed that the relative abundance of major fungal phylum was decreased with the increase in biochar application in the second year. During both years, the Ascomycota fungi were the most abundant fungi followed by Rozellomycota, Basidiomycota, Mortierellomycota, Chytridiomycota, Zoopagomycota, and Glomeromycota across the treatments. The overall results showed that the relative abundance of phylum Ascomycota, Rozellomycota, and Basidiomycota fungi were significantly decreased in 2020 as compared to 2019. Among the treatments, the results showed that the lowest 5 and 17% relative abundance of Ascomycota was recorded in T3 (20 t B ha–1 under + 135 kg N ha–1) and T4 (30 t B ha–1 under + 135 kg N ha–1), respectively, as compared to control and other treatments during 2019. Similarly, a Chytridiomycota fungus was recorded less of relative abundance ranging from 0.34 and 1.91% in T3 and T4, respectively, as compared the rest treatments during 2019. Whereas during 2020, unclassified fungi were higher in T3, T4, T5, and T8 with the abundance of 50.08, 50.46, 50.44, and 51.46%, respectively. The lowest values of 48, 49.92, and 48.56% were recorded in T1, T2, and T6, respectively, for unclassified fungal abundance. Furthermore, the higher fungal species at phylum level followed the order Ascomycota > unclassified fungi > Rozellomycota > Basidiomycota > Mortierellomycota > Chytridiomycot Zoopagomycot > Glomeromycota > Aphelidiomycota across the samples.
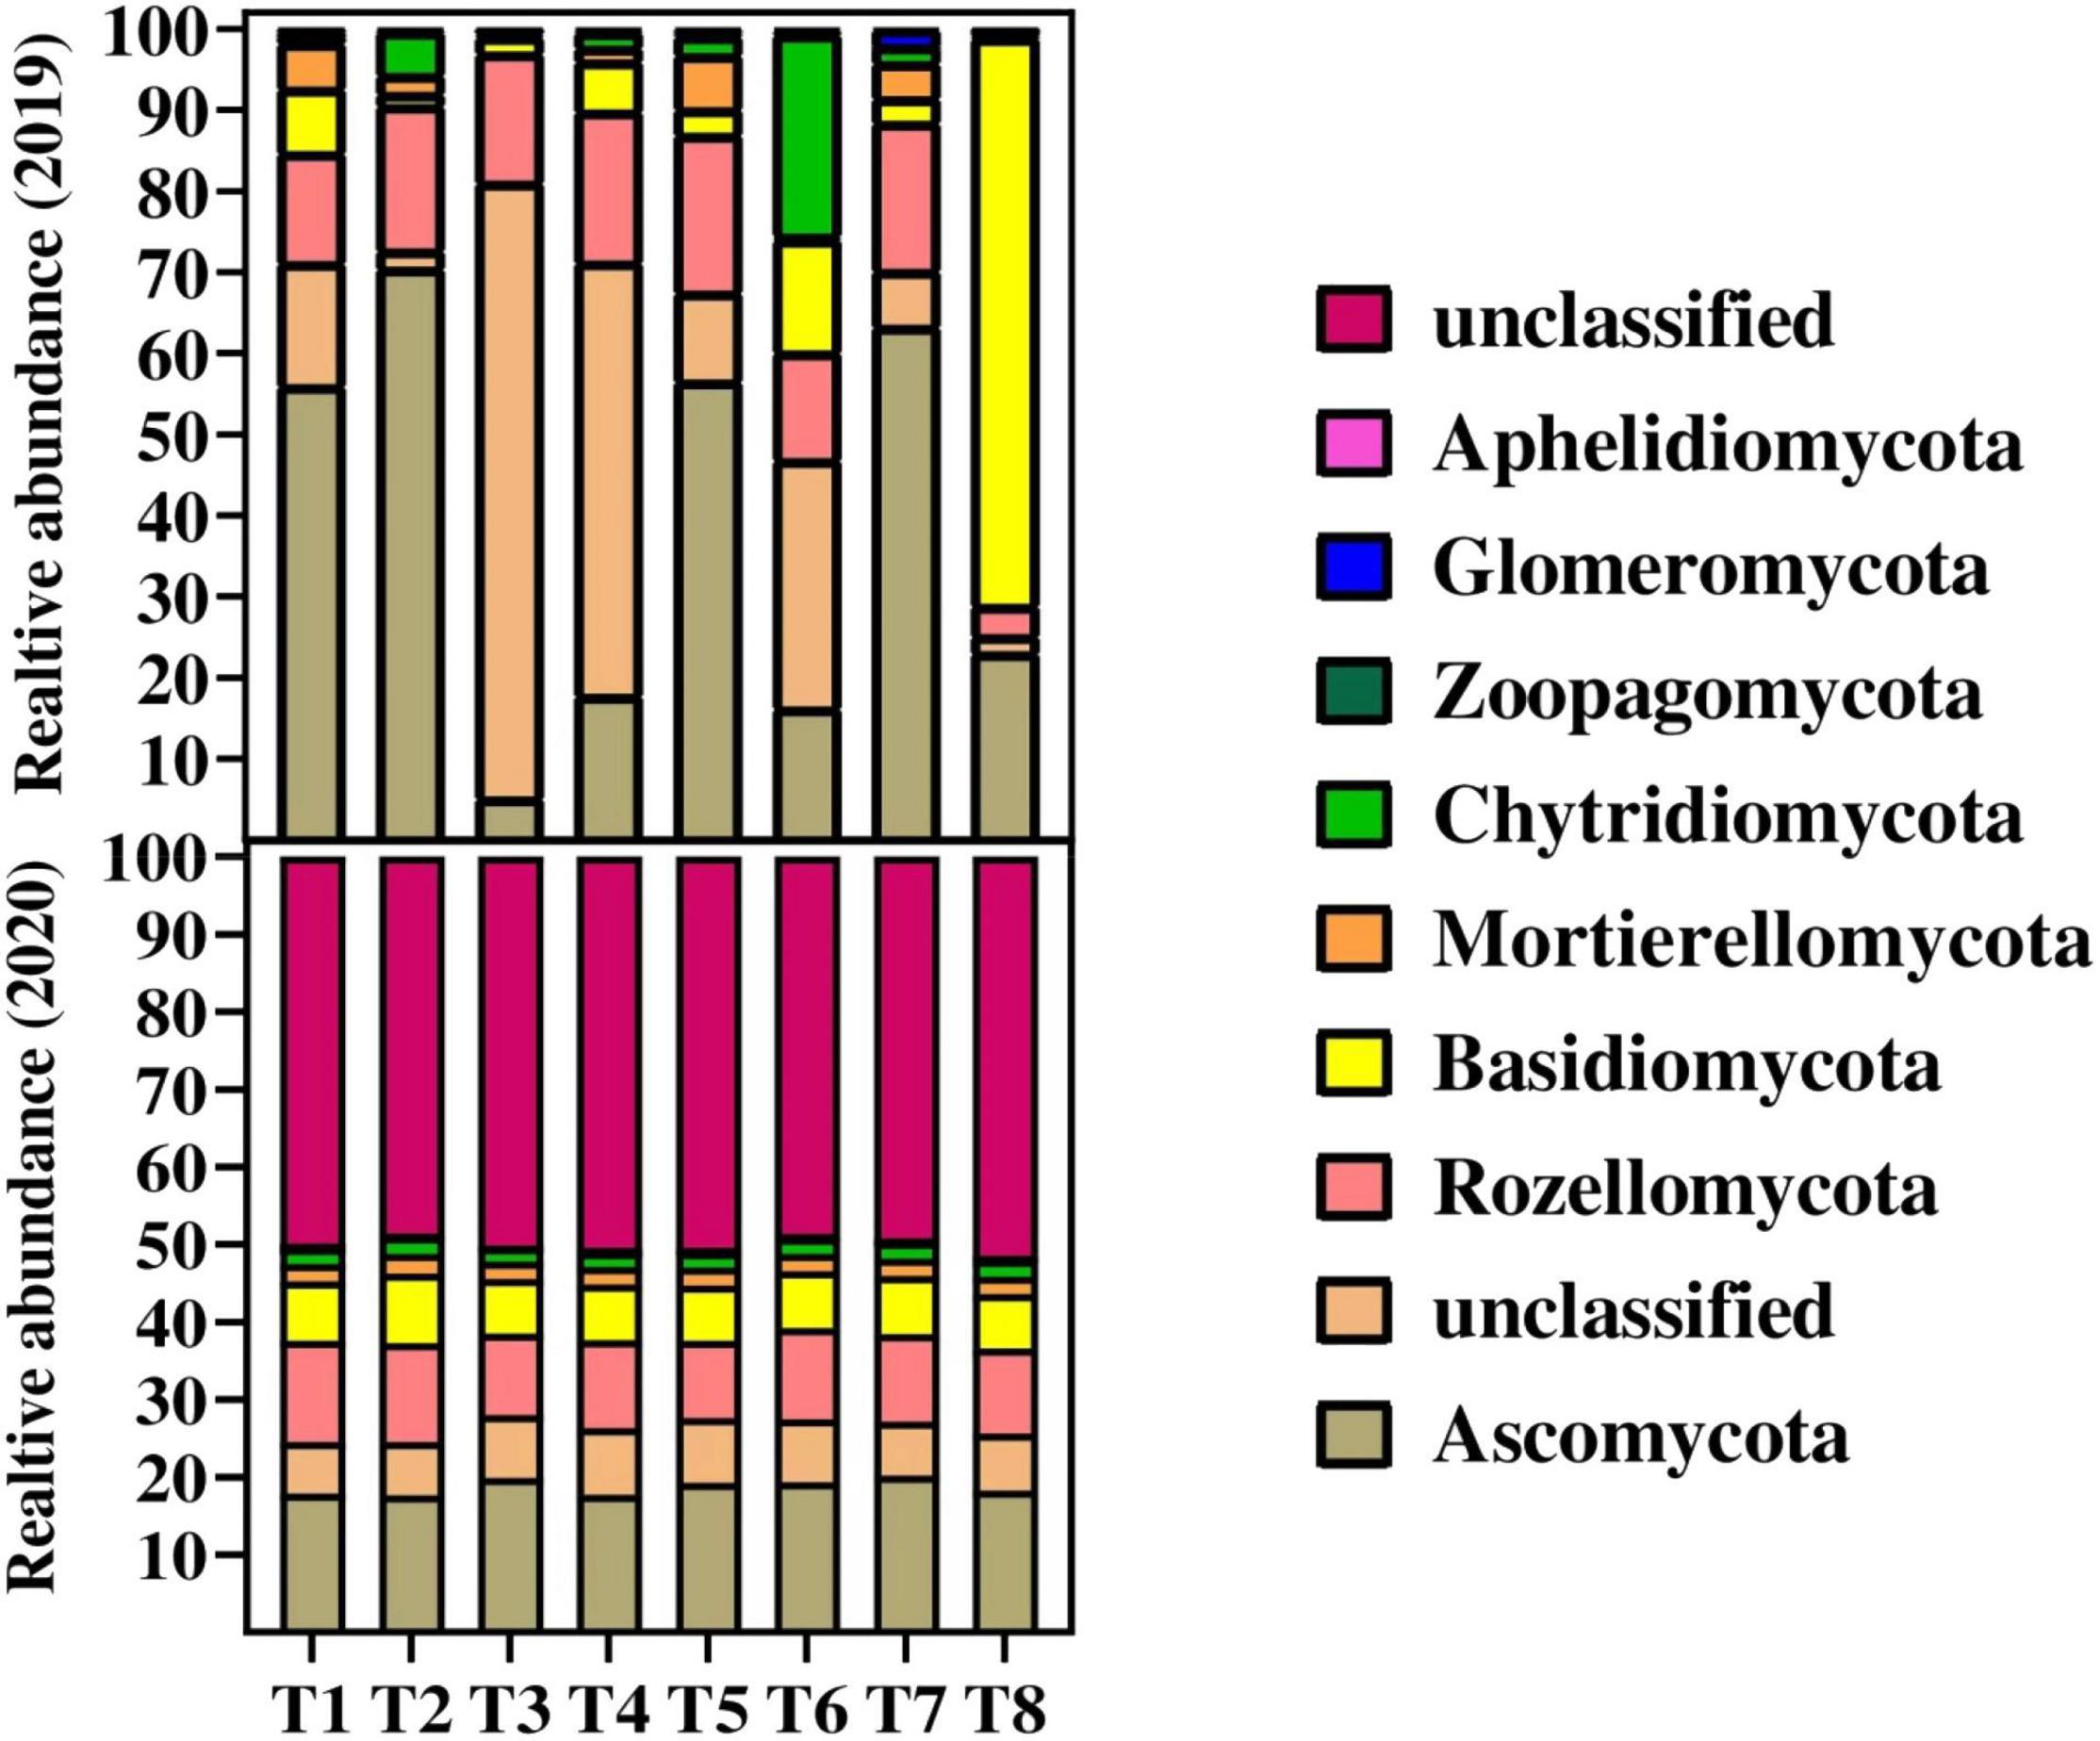
Figure 3. Changes in relative abundance on fungal species on phylum level in to different treatments. Distinct colored columns represent different species, and the length of the columns represents the species’ proportion. For treatment combination details (see Table 1).
The bacterial diversity at genus level influenced by different biochar and N fertilizer during 2019 is represented in Supplementary File 1. Presentation 1 and Figure 1. A total of 250 classified species were found among all soil samples. Thiobacter was the most abundant bacteria at genus level after unclassified bacteria, followed by Sphingopyxis, GP6, Geobacter Povalibacter, Sphingosinicella, Gemmatimonas, Aminicenantes genera incertae sedis, Gp18, Bellilinea, and Kofleria. Among the treatments, T7 resulted in higher percent of Sphingopyxis, whereas T3 resulted in maximum percent of Thiobacter bacteria. Whereas, during 2020, a total number of classified bacteria species at genus level were 179, and the most abundant bacteria after unclassified were Novosphingobium followed by Fictibacillus, Bacillus, Sphingomonas, Gp6, Clostridiumsensu stricto, Gemmatimonas, Aminicenantes genera incertae sedis, Thiobacillus, Spartobacteria genera incertae sedis, Gp16, Reyranella, Geobacter, Gp17, Streptomyces, Novosphingobium, Fictibacillus, Methanothrix, and Lysinibacillus (Supplementary File 1. Presentation 1 and Figure 2). Among the treatments, T7 and T5 resulted in higher percent of Bacillus bacteria. Furthermore, Sphingomonas was higher in T3 as compared to other treatments. The overall results showed that the classified fungi were decreased in 2020 as compared to 2019. Similarly, for fungal genus abundance, the top 10 fungi at genus level were Gaeumannomyces, Myrothecium, Zopfiella, unclassified Pleosporales, Mortierella, Pyrenochaetopsis, Aspergillus, unclassified Mortierellales, Fusarium, and Cladosporium among 49 species during 2019 (Supplementary File 1. Presentation 1 and Figure 3). Whereas in 2020, the top 10 most abundant fungal species at genus level were Echria, Panaeolus, Westerdykella, Tomentellopsis, Calocybella, Kohlmeyeriopsis, Mortierella, Zopfiella, Gaeumannomyces, and Schizothecium among 37 species (Supplementary File 1. Presentation 1 and Figure 4).
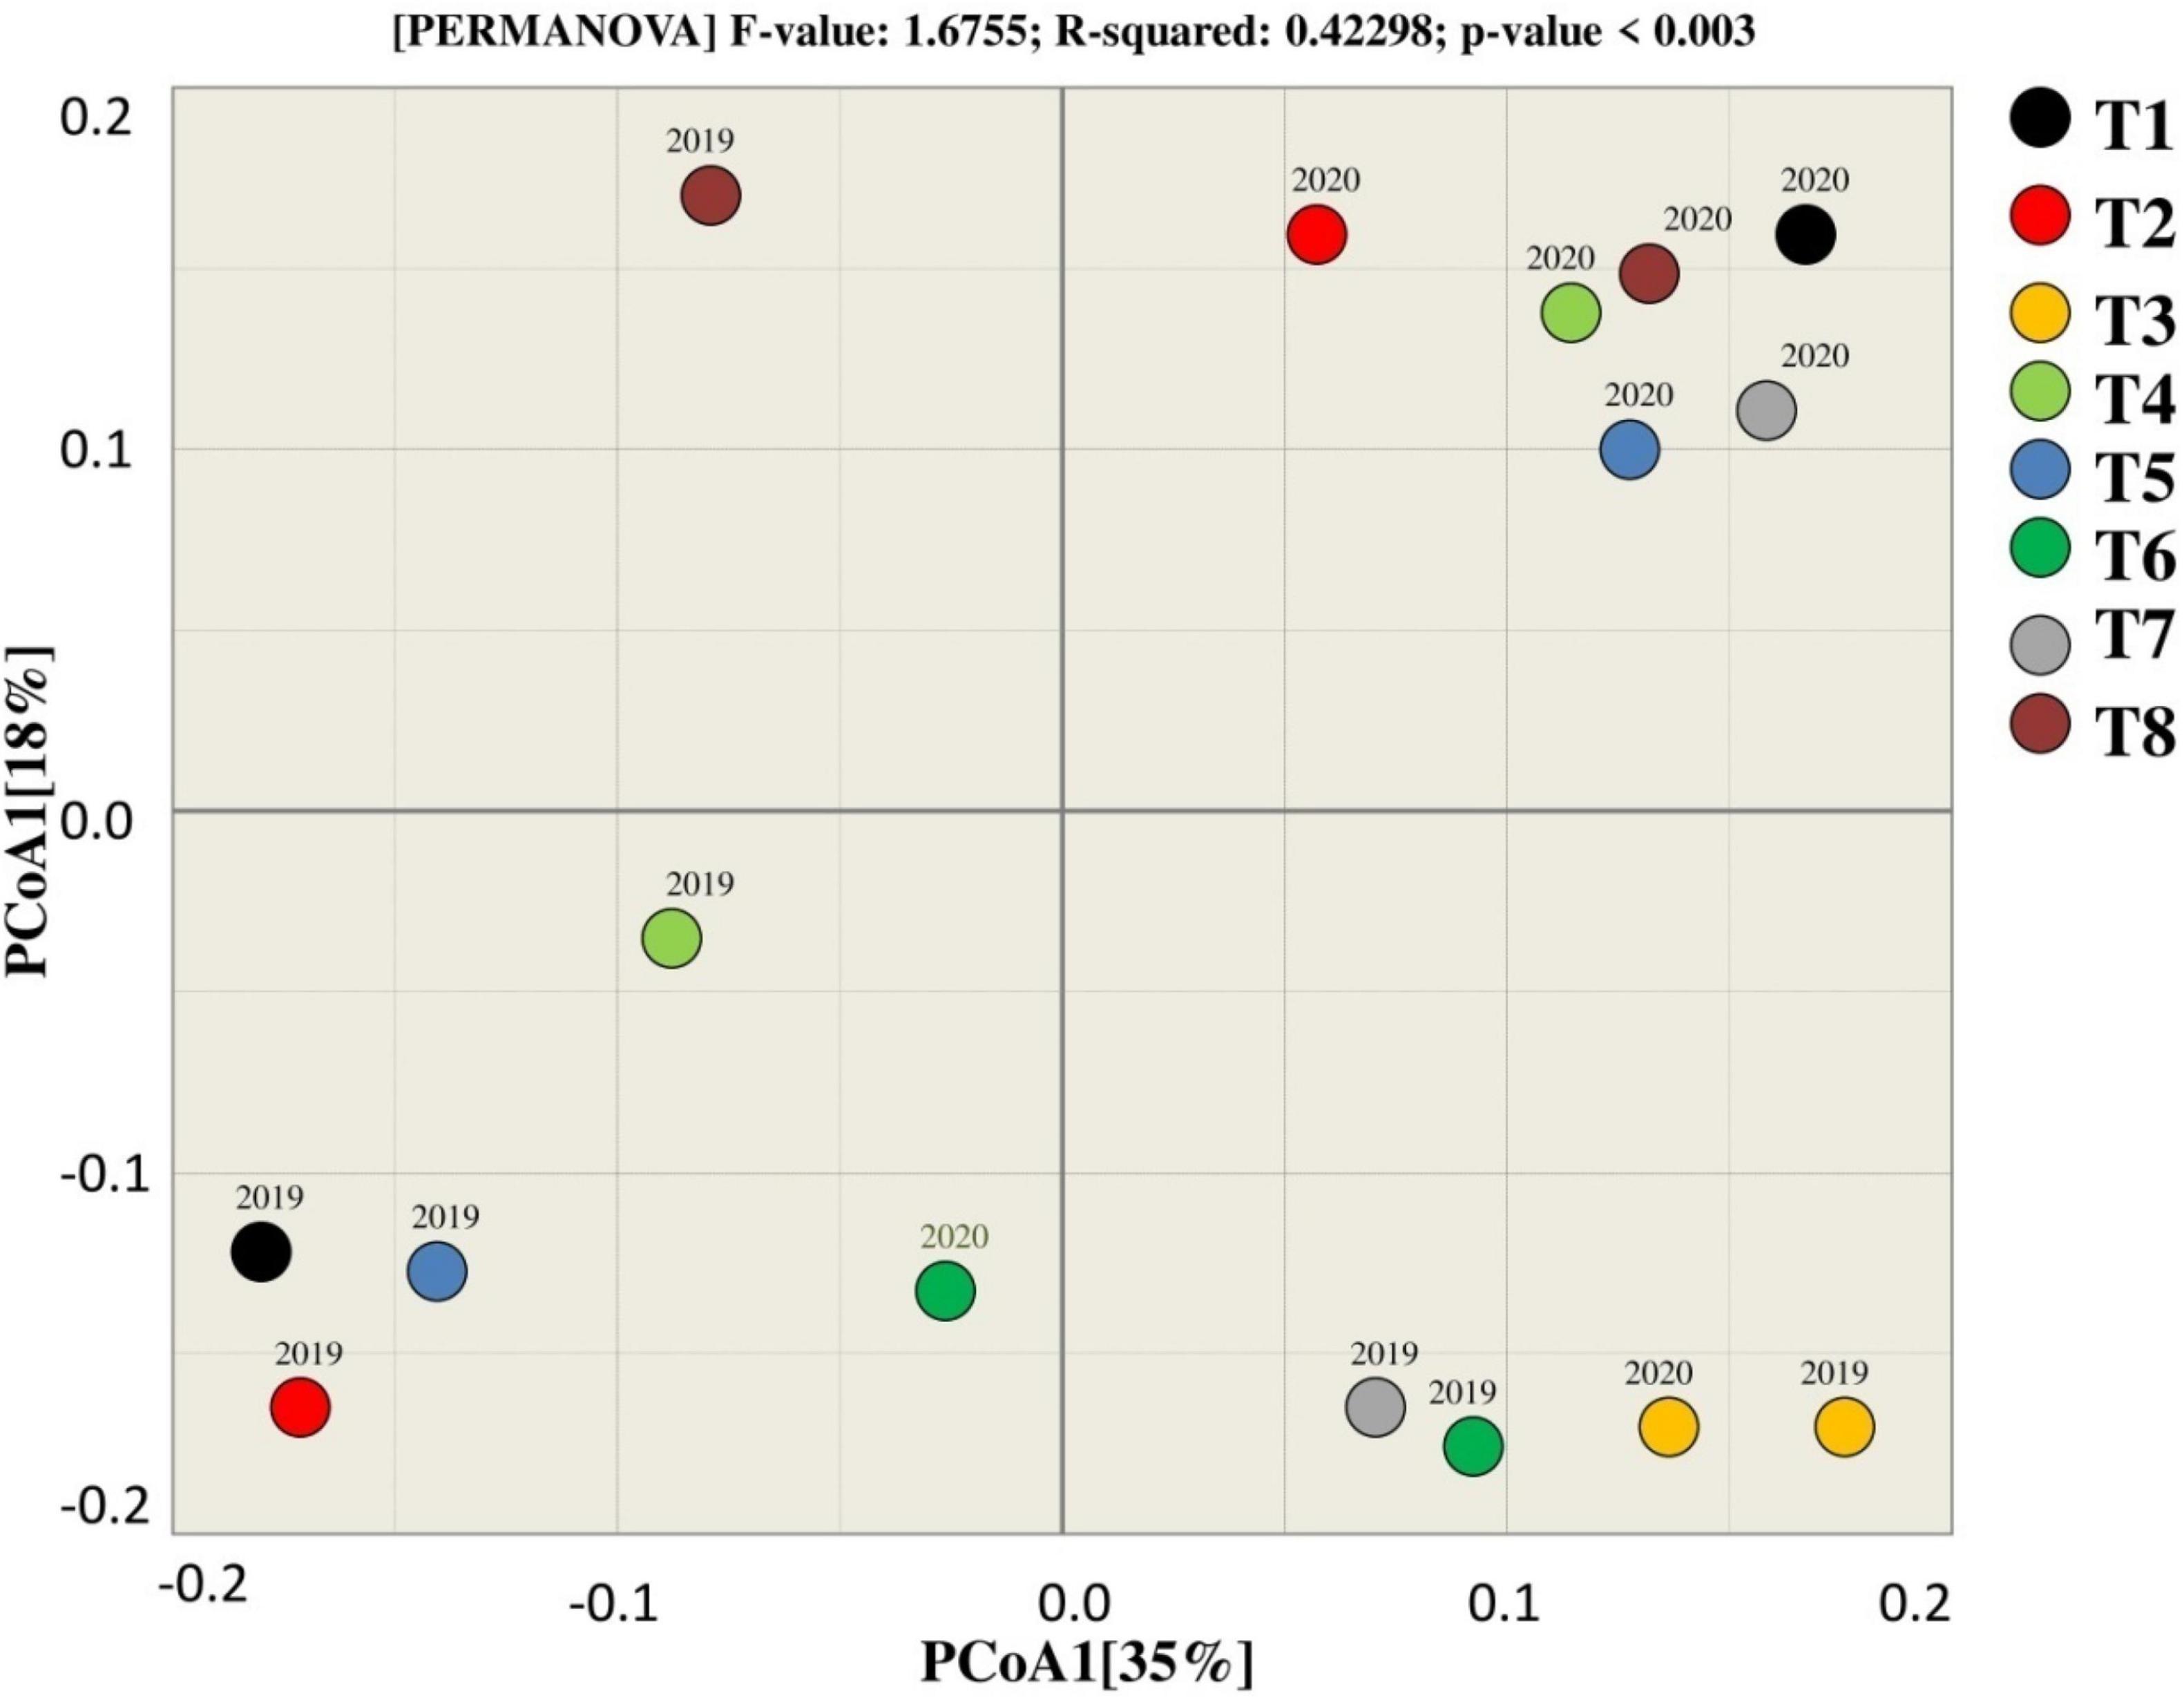
Figure 4. Beta diversity analysis for estimating similarity and dissimilarity among the treatments for the fungal community.
To assess the diversity among the treatments, alpha diversity indices were calculated for each samples (Supplementary File 1. Presentation 1, Table 2 and Figures 5–6). The rarefaction curve illustrated enough richness of observed OUTs and sequencing depth to examine microbial alpha diversity (Supplementary File 1. Presentation 1 and Figures 7–10). According to the results Chao1, ACE, Shannon, and Simpson indices were decreased in 2020 as compared to 2019. In 2019, the control treatment showed slightly higher OTU richness (Chao1 = 15,459.03) as compared other treatments. The lowest OTU richness (Chao1 = 13,678.0) observed in T7 as compared to the rest of treatments (Supplementary File 1. Presentation 1-Table 2 and Figures 6A–D). Whereas during 2020, the OTU richness was higher in T7 (Chao1 = 1,467.1), and the lowest OTU richness (Chao1 = 1,425.67) in T2. The higher ACE index of 2,299.07 and 1,459.30 was recorded in T2 in 2019 and 2020, respectively. The lowest ACE index of 2,205.90 and 1,417.06 was recorded in T6 and T7 during 2019 and 2020, respectively. Shannon and Simpson indices were recorded lowest in T6 (6.88) and T7 (0.995) as compared to the rest of treatments in 2019, whereas, in 2020, the Shannon and Simpson indices increased with biochar application as compared to control treatments.
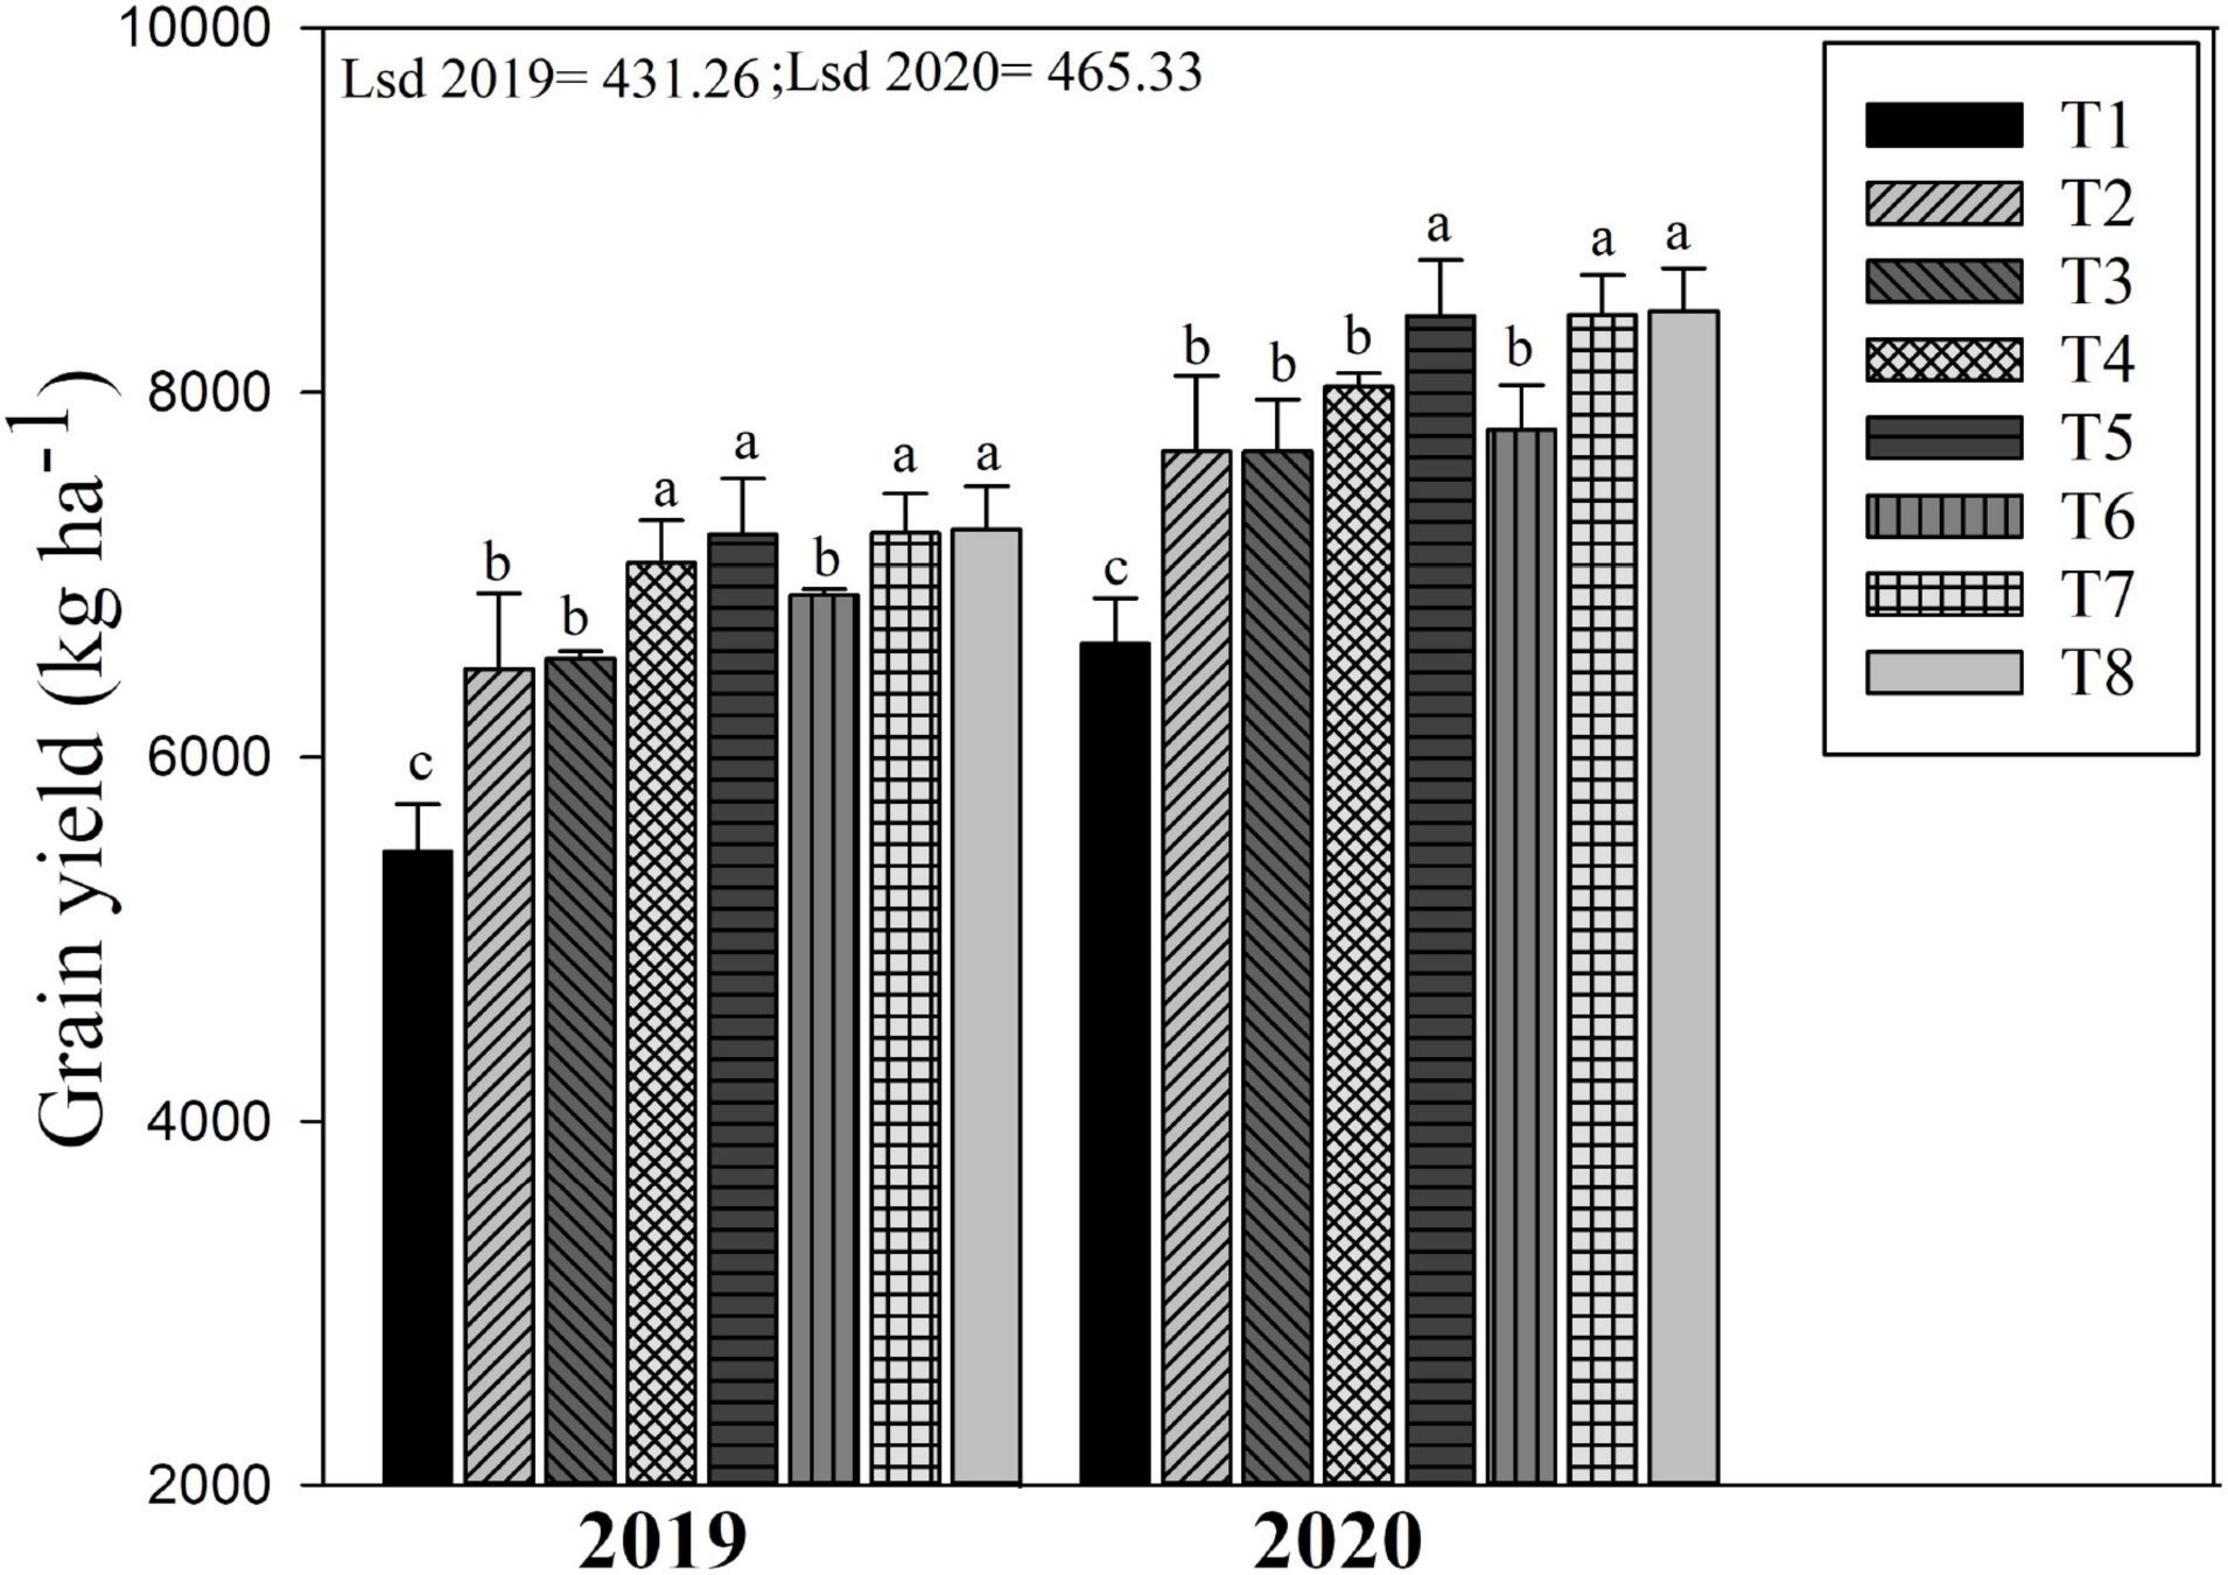
Figure 5. Changes in grain yield of rice as influenced by different biochar rates in combination with different N fertilizers. The mean comparison was made using the least significant difference (LSD) test for treatments means based on the LSD test at 5%. Different letters on bars are not significantly different at p < 0.05. For treatment combination details (see Table 1).
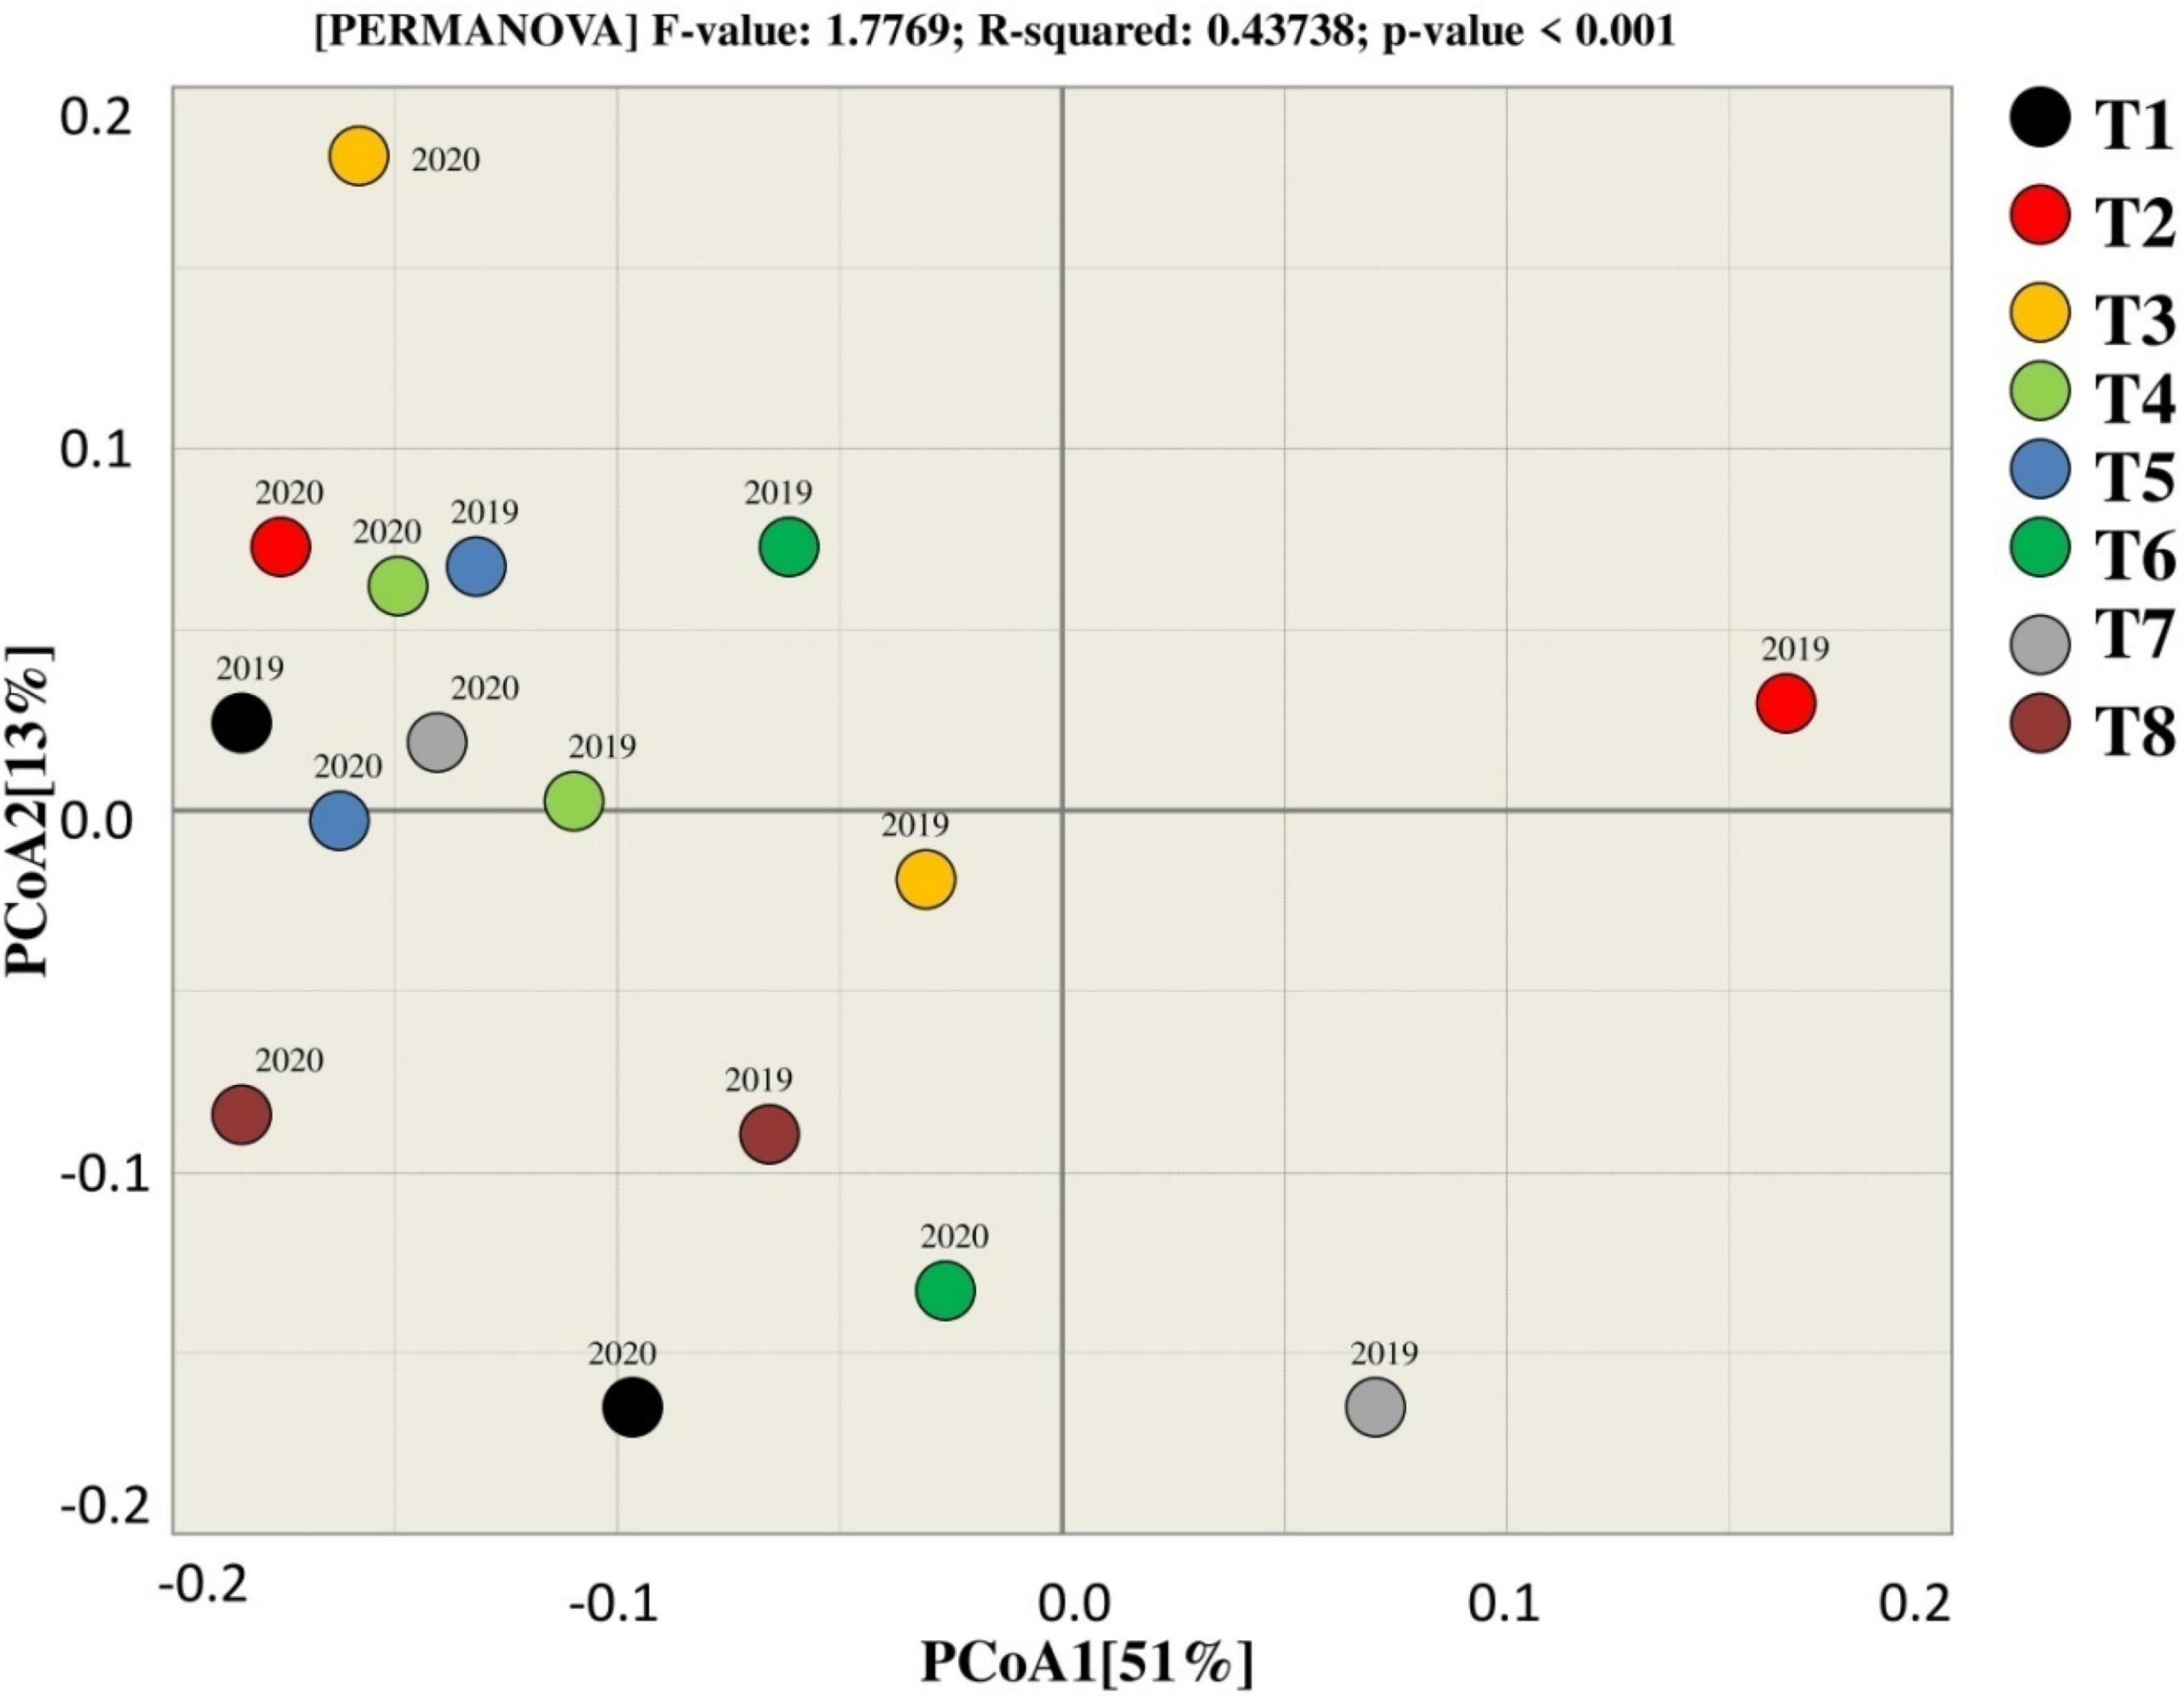
Figure 6. Beta diversity analysis for estimating similarity and dissimilarity among the treatments for bacterial.
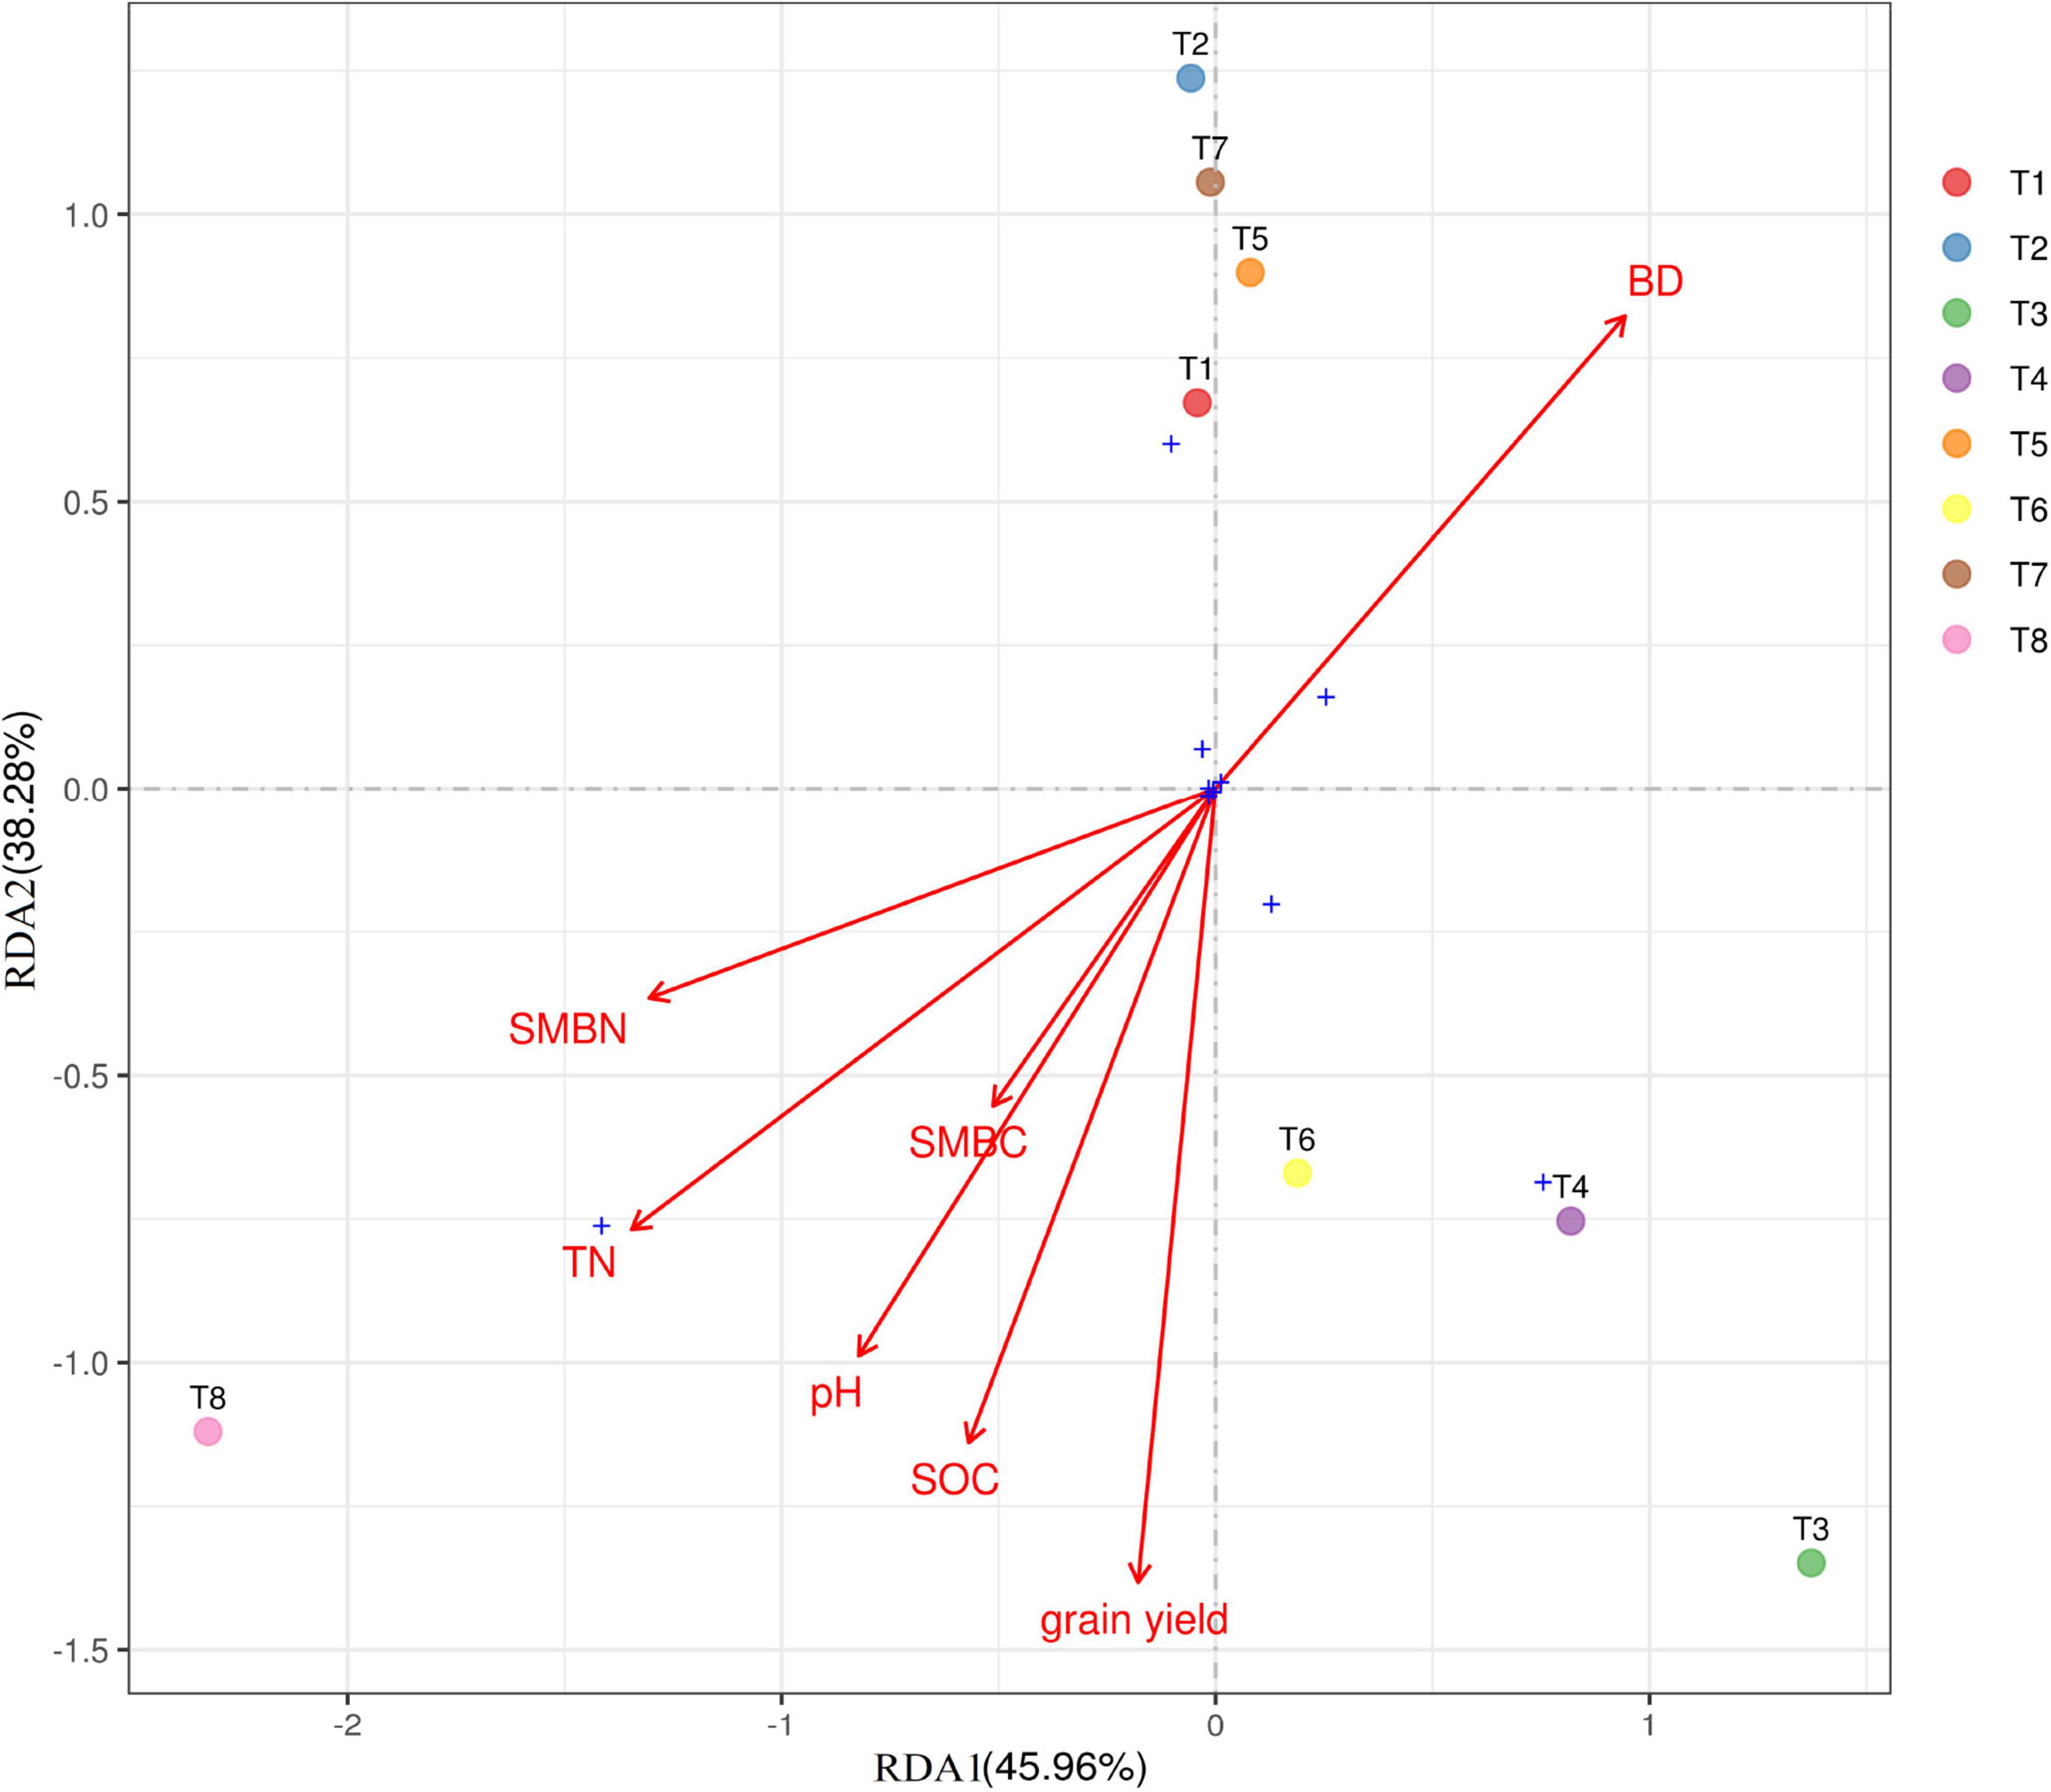
Figure 7. Ordination plot of results from redundancy analysis to identify relationship between soil properties, grain yield (GY), and dominant bacterial phylum among the treatments. SMBN, soil microbial nitrogen; SMC, soil microbial carbon; TN, total nitrogen; SOC, soil organic carbon. For treatment combination details (see Table 1).
In addition, the results of alpha diversity for fungi showed the opposite trend as compared to bacterial. The diversity indices among fungal samples were higher in 2019 and lower in 2020. Among the treatments, T4 resulted in a higher OTU richness (Choa1 = 190.36) in 2019, whereas T5 resulted in higher OTU richness (Chao1 = 956.51) in 2020. The lowest OTU richness for fungal taxonomic feature level was recorded in T6 (Chao1 = 151.05) and T2 (Chao1 = 920.3) during 2019 and 2020, respectively. Shannon and Simpson indices were not significantly affected by biochar and N treatments as compared to control treatments. However, variation do exist among the samples, for example, the higher Shannon index was recorded in T5 during 2019 and T4 during 2020.
PCoA was used to assess the similarity and dissimilarity for bacterial beta diversity among the treatments. According to the results, most of the samples of corresponding treatments tend to group, indicating that there is a similarity between the treatments as they clustered near to each other except T7 that tends to differ from other treatments in terms of rhizosphere microbial community. Moreover, 51% variation among the treatments was explained by PCoA1, whereas PCoA2 explains 13% of the total variation among the treatments during both years (Figure 6).
Beta diversity analysis (PCoA) of fungal community showed that the treatments tend to the group, presenting that there is a connection among the treatments as they clustered near to each other except T8 that tends to differ from other treatments in terms of rhizosphere during 2019. The results showed that treatments in 2019 and 2020 clustered in different quadrate that indicates that the difference among the treatments of in both years. T3, T6, and T2 were observed together in two different groups, which represents that these treatments were dissimilar for the fungal community in 2019. The variation among the treatments by PCoA1 and PCoA2 was explained by 35 and 18%, respectively, for the fungal community in both years.
The biochar and N fertilizer combined application considerably affect the rice yield in both years (Figure 5). Biochar applied treatment including T8, T7, and T5 improved rice yield by 32.4, 31.8, and 31.7% as compared to non-biochar applied treatments (T1) in 2019. Similarly, in 2020, the grain yield of rice was higher in T8, T7, and T5 by 27.2, 23.5, and 27.6%, respectively, as compared to T1. Compared to T2 (no biochar + 180 kg ha–1), the treatments T8, T7, and T5 significantly increased grain yield by 10.46, 10.56, and 10.87%, respectively, during both years. The lowest grain yield of rice during both years was recorded in non-biochar–treated plots (T1 and T2).
RDA was performed to determine the strength of the association between the soil pH, SOC, TN, BD, SMBN, and SMBC contents and the diversity of the soil bacterial composition. Figure 7 shows the relationship between bacterial communities (at phylum level) and the soil properties for the different treatments. Soil pH, TN, SOC, SMBN, SMBC, and grain yield occurred in same quadrant, which indicates that biochar has significant effect soil physiochemical properties and grain yield. The eight treatments took place in four different quadrants, showing that the fertilization treatments had a substantial effect on the composition of soil bacterial composition. Biochar applied at higher rate (T8) showed significant correlation with soil properties.
Figure 8 shows the Pearson correlation heatmap among the most abundant bacteria’s, soil properties, and grain yield. Soil properties including soil pH (R = 0.82), TN (0.72), SOC (0.71), SMBC (0.64), and SMBN (0.76) were strongly positively correlated with grain yield. However, the relationship between soil BD (−0.75) and grain yield was strongly negatively correlated. Furthermore, the abundance of soil bacteria including Acidobacteria (0.37), Actinobacteria (0.24), Bacteroidetes (0.39), Planctomycetes (0.71), and Proteobacteria (0.32) strongly positively correlated with the grain yield of paddy rice, whereas, the abundance of Chloroflexi, Firmicutes, Gemmatimonadetes, and Verrucomicrobia showed no significant relationship with grain yield of rice. The relationship between the soil biochemical properties and soil bacteria abundance were also positively correlated, except soil BD.
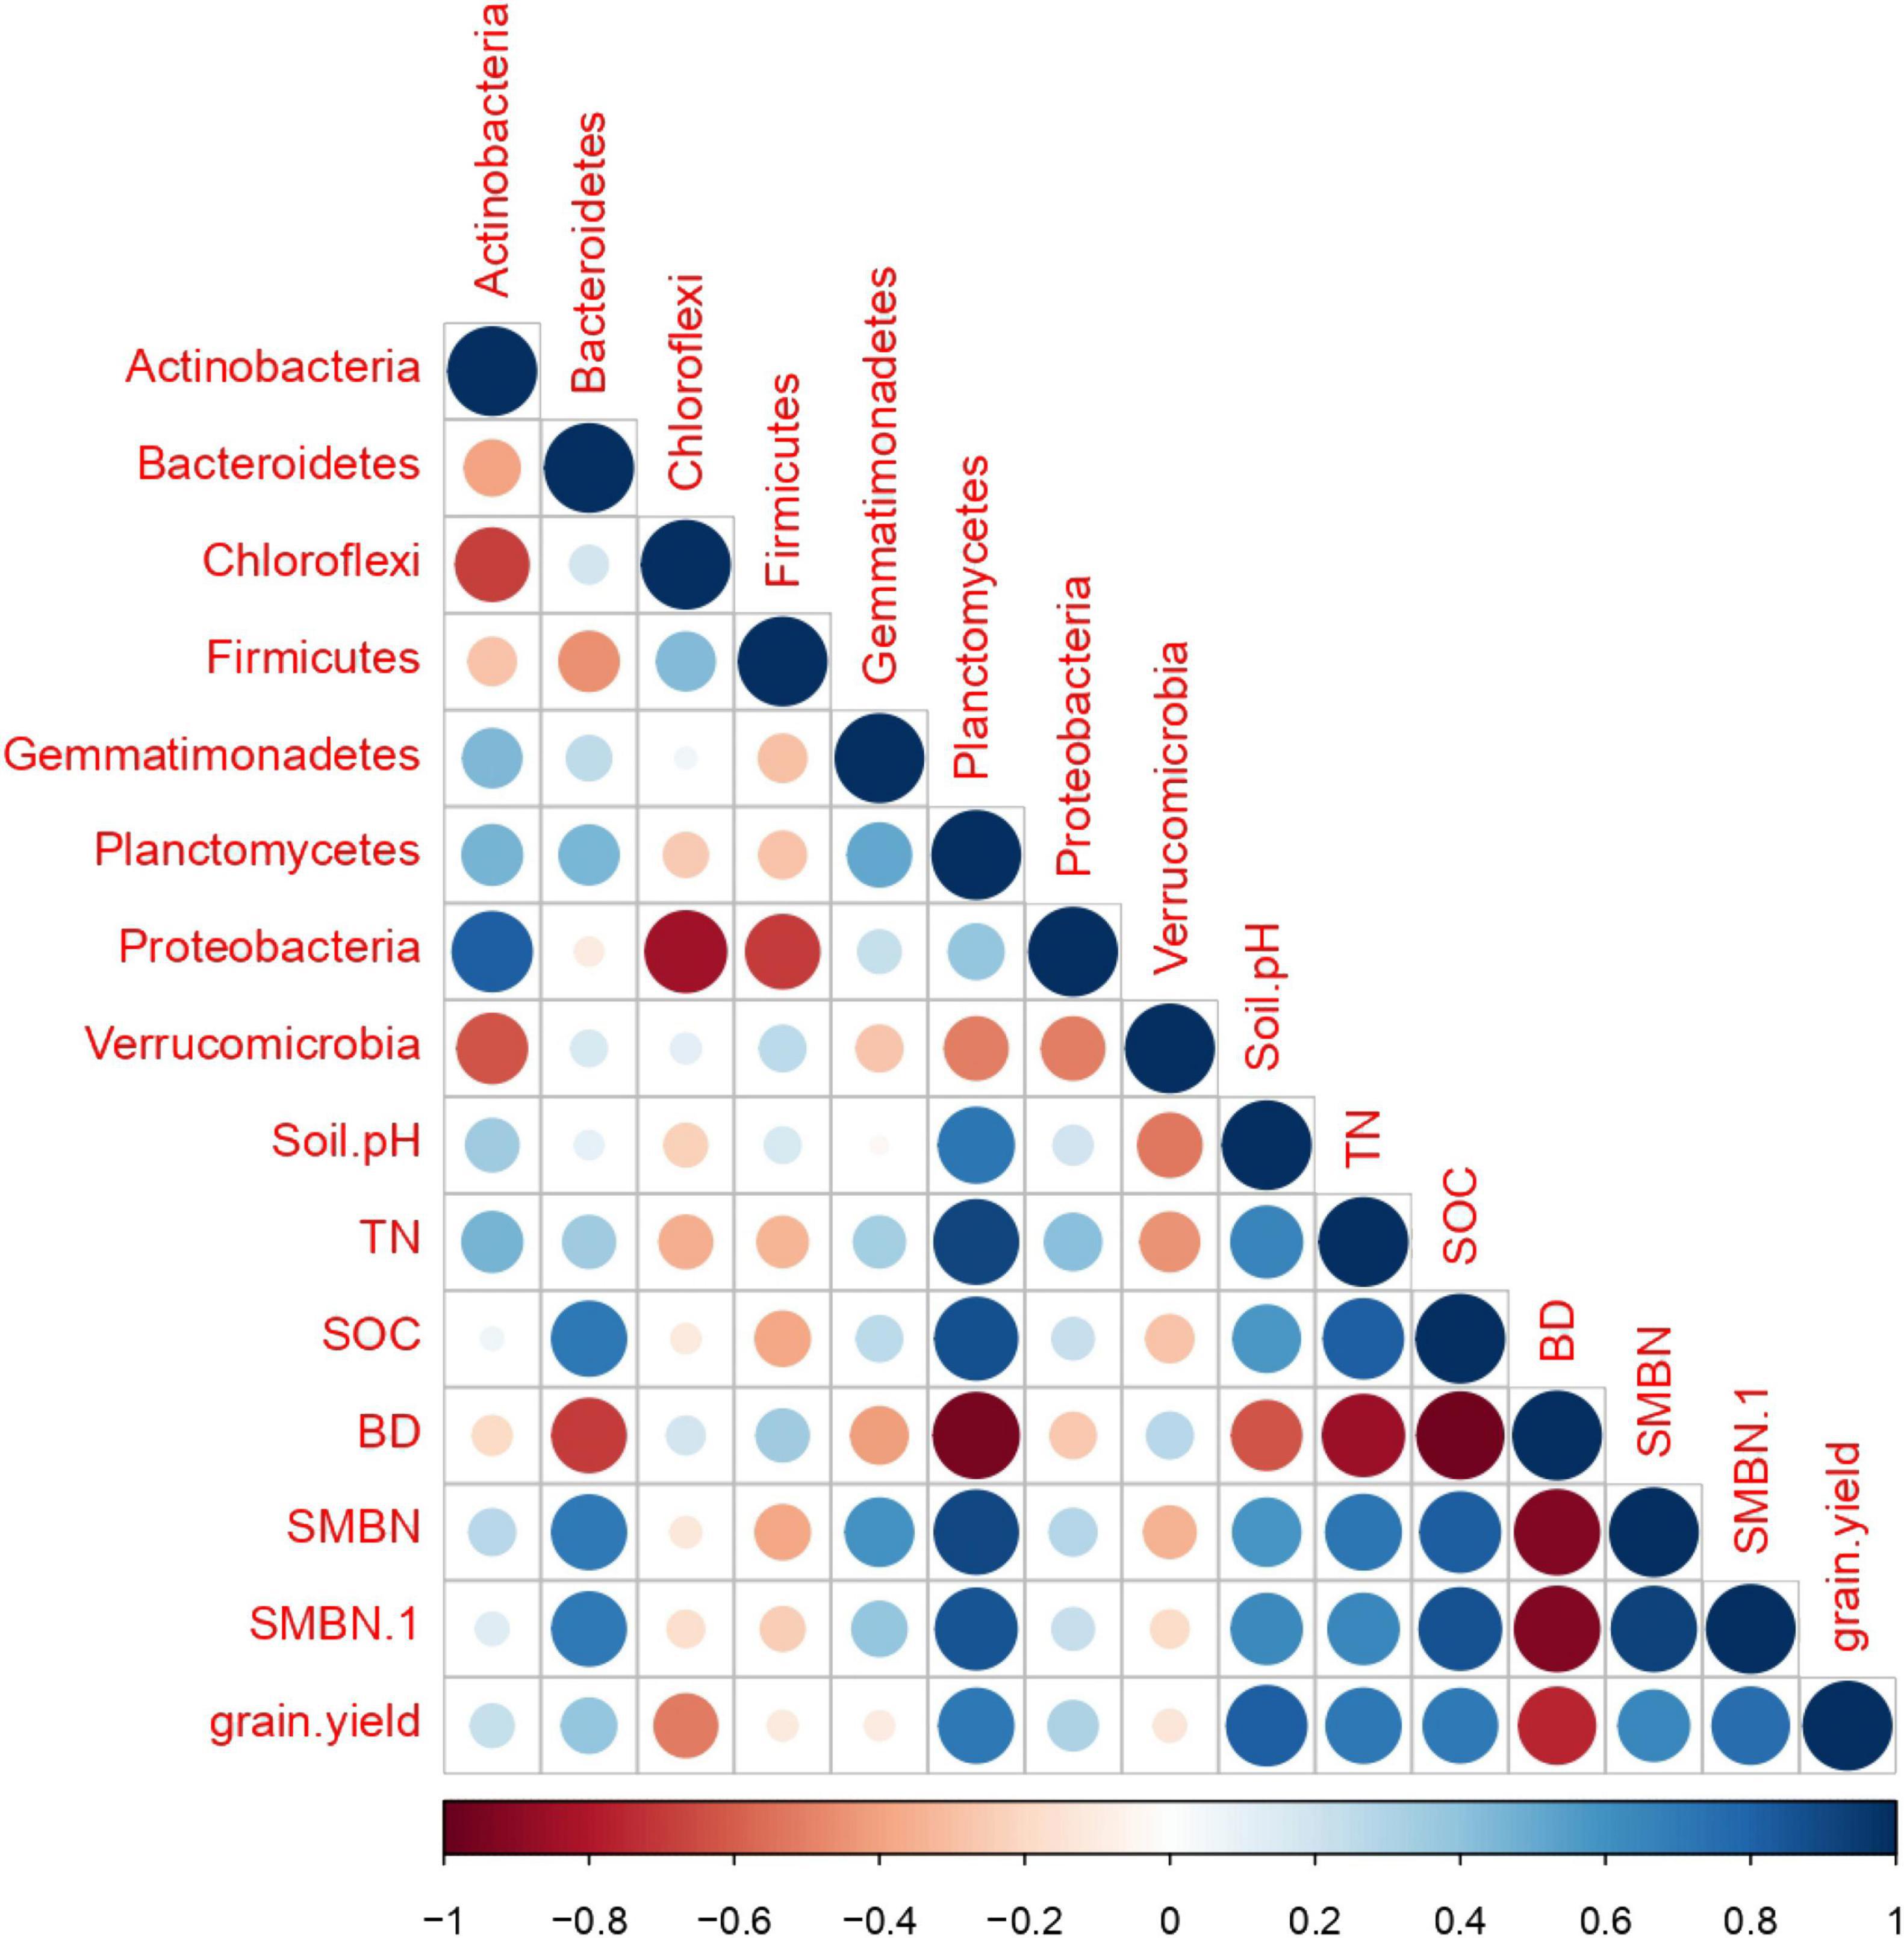
Figure 8. Correlation analysis among treatments for soil microbial abundance, soil properties, and grain yield.
For the measured indicators of all soil bacterial abundance, soil properties, and grain yield, a network plot (MGAc) among the treatments was created to understand the relationship among the treatments using SmartPls3 software (Figure 9). The results showed that, for all measured traits, the treatments without biochar applications (T1 and T2) were significantly dissimilar from the treatments with biochar application, whereas the treatments had biochar rate from 20 to 30 ton ha–1 under both N fertilizers (T4, T5, T6, and T8) were resulted in the same outputs for all traits across the years.
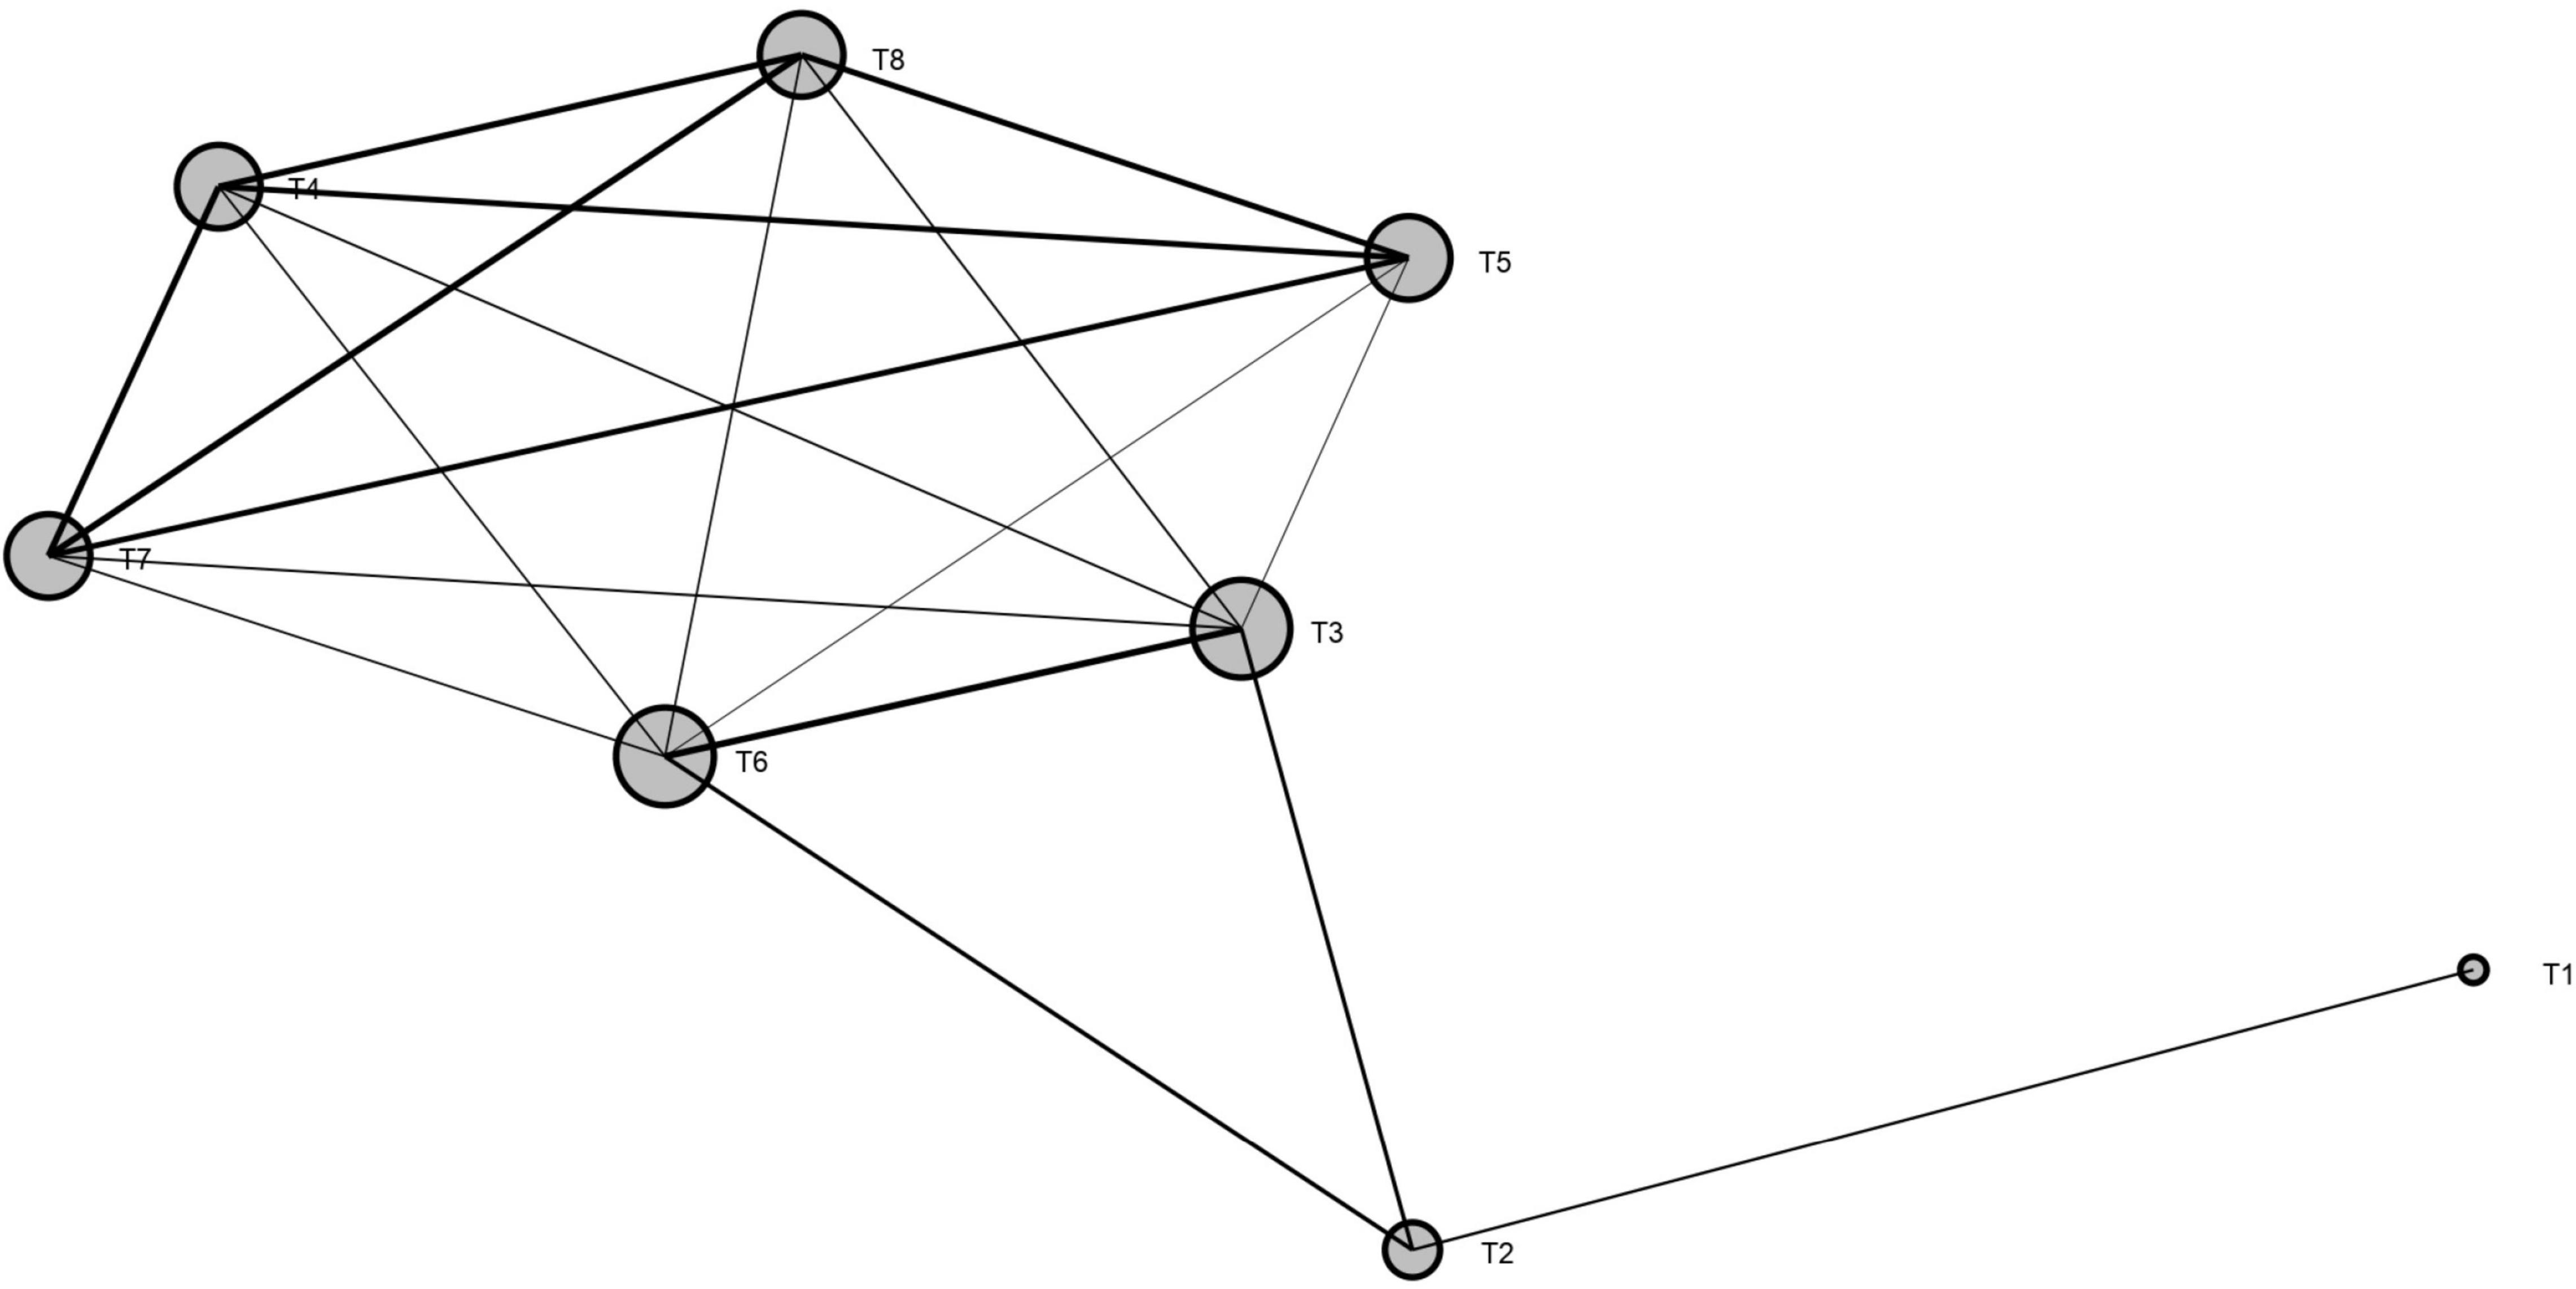
Figure 9. Network plot (MGAc analysis) among the treatments for soil microbial abundance, soil properties, and grain yield. Size of the ball represents the variation among the treatments, and lines represent the interaction among the treatments. Note: T1 = 0 t B + N135 kg ha1, T2 = 0 t B + N180 kg ha1, T3 = 10 t B + N135 kg ha–1, T4 = 20 t B + N135 kg ha–1, T5 = 30 t B + N135 kg ha1, T6 = 10 t B + N180 kg ha1, T7 = 20 t B + N180 kg ha–1, and T8 = 30 t B + N180 kg ha–1.
Biochar application and the use of N fertilizer are important agricultural management practices in sustainable development. Several reports have concluded that the use of biochar considerably improves soil health and crops yield. However, the effect of long-term biochar application in combination with chemical N fertilizer on paddy field soil properties and microbial community composition during 2 years is still unclear. This research explored the effect of biochar in combination with N fertilizer on paddy field soil properties, microbial functions, and bacterial community composition. The soil bacterial community is the essential component of soil ecology, responsible for enhancing soil health, and plants production (Luo et al., 2020).
In the present study, biochar amendment in combination with N fertilizer significantly improved soil biochemical indicators (i.e., MBC, MBN, pH, SOC, and TN) compared with sole N fertilization (Table 2), whereas soil DB was decreased in biochar-treated soil as compared to sole N-applied treatments. The possible explanation for this increment might due to the biochar’s higher porosity, higher surface area, and its large number of microspores (Ali et al., 2020a,b, 2021). Our results were in line with our previous study (Ali et al., 2021), showing that the biochar addition in combination with urea considerably improved the pH by 14%. Numerous studies have shown that soil pH can increase when biochar is applied, particularly in acidic soils, which can ameliorate the nutrient supply to plants (Ali et al., 2020a,b; Ullah et al., 2021a,b). Similarly, SMBN and SMBC were increased might due to the alkaline nature of biochar. Biochar amendment addition to acidic soils can improved the microbial activities and increases the microbe populations as documented in our previous study (Ali et al., 2021). The other possible explanation might be due to the inhibition of denitrification inhibitors, which are the major regulators of nitrification. Our findings are supported by the previous results of Zhou et al. (2017), who documented that SMBC and SMBN can be increased by 26 and 21% in biochar-treated soil as compared to control. Liu et al. (2016) also reported that biochar application improved soil MBN and MBC as compared to non-biochar applied treatments. However, in contrast to our results, Castaldi et al. (2011), Zavalloni et al. (2011), and Dempster et al. (2012) have documented that biochar has no significant effects on soil MBC.
The microbial population’s diversity and richness are regarded critical for soil integrity, functionality, and sustainability, yet they are commonly diminished by current farming practices (Zhao et al., 2014; Khan et al., 2021). In the present study, the different biochar rates in combination with N fertilizer significantly affected the soil bacterial and fungal abundance (Table 2). Compared to control (T1), biochar application at the rate of 20–30 t ha–1 significantly increased soil bacterial abundance. The possible reason for these increments due to the increase in soil pH in biochar applied treatments. Several studies reported that soil physical and chemical properties indirectly affect soil microbial abundance (Lehmann et al., 2011; Cole et al., 2019). For example, soil pH is the most important factor for the change in bacterial abundance of soil (Yao et al., 2017; Liu et al., 2019; Zheng et al., 2019; Sun et al., 2020). Thus, biochar in combination with N fertilizer improved soil pH in our experiment, which consequently improved soil bacterial abundance. A similar study was reported by Yao et al. (2017) in that the addition of a higher rate of biochar increases bacterial abundance. Likewise, Chen et al. (2015) also reported that 40 tons of biochar ha–1 significantly increased bacterial 16S rRNA gene copy numbers by 35–62%. However, Luo et al. (2017) and Gao et al. (2021) reported that that biochar fertilizer in alkaline soil did not affect soil pH or bacterial abundance. Thus, our results suggested that an appropriate rate of biochar application in combination with N fertilizer improved soil bacterial abundance in the paddy field.
In this study, fungal abundance was decreased in the biochar-treated soil as compared to control. This increase might be due to an increase in soil pH as compared to control in biochar-treated soil. Yao et al. (2017) reported a similar finding that changes in soil fungus might be caused by changes in soil pH and nutrient content due to biochar addition. Because biochar has a higher pH, its effect would be exacerbated in acidic soil, where the changes in soil pH after applying biochar amendment would be more significant (Paz-Ferreiro et al., 2015; Xu et al., 2018). In contrast, Steinbeiss et al. (2009), Jones et al. (2012), Luo et al. (2017), and Gao et al. (2021), reported that biochar amendment could promote fungal growth as compared with the control soil.
Many studies have shown that biochar has a short- or long-term impact on bacterial and fungal community compositions (Yao et al., 2017; Li et al., 2020). However, the effects of biochar on community composition remain unclear. In the present study, the abundance of Proteobacteria, Actinobacteria, and Verrucomicrobia were observed higher in biochar-treated soil as compared to control. In terms of community composition and relative abundance, Proteobacteria accounted for the highest fraction in the soil, which is consistent with the findings (Ji et al., 2016; Yin et al., 2021). For a possible explanation, Proteobacteria are a eutrophic bacterium (Fierer et al., 2007), and, previously, it is well documented that biochar amendment improves soil properties (Ali et al., 2020a,b, 2021), leading to an increase in the Proteobacteria population.
The relative abundance of Acidobacteria, Chloroflexi, Actinobacteria, Bacteroidetes, Gemmatimonadetes, Planctomycetes, Verrucomicrobia, and Chloroflexiwas higher in the first year of the experiment. However, in 2020, the frequency of these microbes has reduced. Most Acidobacteria are acidophilic bacteria, and their relative abundance is negatively correlated with soil pH. In our study, biochar increased soil pH as compared to control, which consequently decreased Acidobacteria. Similar reducing results of Acidobacteria abundance in higher soil pH (8.50 and 7.87) compared to low soil pH (5.35) were reported by Yin et al. (2021).
The relative abundance of Actinobacteria was increased in biochar-treated soil as compared to control. As gram-positive bacteria, Actinobacteria play a significant role in organic matter turnover, including cellulose and chitin decomposition (Ali et al., 2019). Bacteroidetes abundance was improved in the second year as compared to first year and was higher in biochar applied treatments as compared to control. The application of biochar to the soil as a carbon source promotes an increase in the relative abundance of Bacteroidetes in the soil, because Bacteroidetes bacteria are strongly correlated with the conversion of organic materials such as DNA, proteins, and lipids (Cottrell and Kirchman, 2000).
Biochar in combination with N fertilizer significantly affected the abundance of fungal community structure (Figure 3). In the present study, the dominant fungal phyla across the treatments were Ascomycota, Rozellomycota, Basidiomycota, Mortierellomycota, Chytridiomycota, Zoopagomycota, and Glomeromycota during both years. Compared to control, biochar application in combination with N fertilizer significantly decreases the relative abundance of Ascomycota, Rozellomycota, and Basidiomycota phyla, whereas, between the years, these phyla were more decreased in 2020 over 2019. The possible explanation for these condense in fungal phyla might due to changes in soil chemical and physicochemical properties, especially soil pH. Furthermore, (Heitkötter and Marschner, 2015), Ullah et al. (2020) and Ali et al. (2020a,b), reported that biochar changes in soil physicochemical properties alter soil enzyme activities, which consequently resulted in the abundance and composition of soil fungi abundance and composition. Compared to 2019, reduction in Ascomycota during 2020 might be attributed to that biochar as a slow-release fertilizer can frequently take up to a year to see results. Further explanation for these changes might be that biochar as a microbial C source; the Dissolved organic carbon (DOC) probably promotes saprotroph growth and enhances their competitive capacity, leading to an overall decrease in diversity and a decline in fungal pathogens (Dai et al., 2018). Similar results to our finding were reported by Yin et al. (2021) that biochar decreased the relative abundance of Ascomycota, Basidiomycota, and Mortierellomycota. Another study reported that these fungi decompose organic matter, symbiotic fungi, parasitic or pathogenic fungi, and even other fungi (Hang et al., 2020; Liu et al., 2020). Furthermore, Chen et al. (2013) and Hale et al. (2014) documented that because of biochar porous nature protects soil from a variety of biological rivals. In addition, our study also reported that Mortierellomycota phyla were decreased in biochar-treated soil during both years. The possible reason for this change due to biochar provides carbon supply to the soil, and it is hypothesized that dominant fungal genera in soil are competing for carbon source, leading to a decrease in Mortierellomycota. Same results to our findings were observed by Yin et al. (2021) that Mortierella abundance was observed lesser in biochar-treated soil as compared to control.
Co-incorporation of biochar and synthetic N fertilizer significantly increased rice grain yield compared to non-biochar applied plots (Figure 5). The enhancements in rice yield could be attributed to enhancement in soil pH, TN, SOC, MBC, and MBN (Table 2), which ultimately enhanced rice growth and biomass accretion by providing enough nutrients during the growing period. The results of the Pearson correlation heatmap confirmed that that the variations in soil nutrients were the factors that elucidated the greatest proportion of the difference in rice grain yield (Figure 8). Moreover, Akhtar et al. (2018), Iqbal et al. (2019) and Iqbal et al. (2020) reported that changes in crop yields are strongly allied with soil biogeochemical properties and microbial biomass production.
Biochar application in combination with N fertilizer can cause physiochemical changes in soil, which can lead to changes in the composition of the bacterial community (Li et al., 2019). In the present study, we observed that biochar amendment considerably influenced soil quality traits as shown in Table 2. Furthermore, it is also reported that soil quality traits were positively correlated with the structure and composition of the bacterial community (Wu et al., 2020). Figure 8 showed the relationship of bacterial community at phylum level and soil traits including soil pH, TN, SOC, MBN, and MBC for different biochar and N rates. In our findings, RDA showed that biochar amendments in combination with N fertilizer had substantial effects on soil bacterial community and soil quality indicators compared with control (Figure 7). The dominant bacteria at the phylum level, i.e., Proteobacteria, Chloroflexi, and Acidobacteria, were positively correlated with soil properties, but the Proteobacteria were strongly associated with pH, SOC, and TN. It can be said that bacterial growth is strongly associated to the kind of fertilizer, and regulating the type and proportion of biochar amendment is an operative strategy for increasing bacterial growth. From what has been debated above, the application of biochar amendment in conjunction with reduced synthetic fertilizer may provide a faster growth environment for bacteria, thereby improving the bacterial community structure and soil fertility.
The results showed that biochar amendment in combination with N fertilizer increased soil physio-biochemical properties, improved rice grain yield, increased soil bacteria, and altered fungi abundance and community structure. The bacterial Chao1, ACE, and Shannon indices were increased and fungal Chao1, ACE, and Shannon indices were decreased in biochar applied treatments as compared to sole N-applied treatments. Biochar along with N fertilizer increased number of unique OTUs of bacteria and decreased number of unique OTUs of fungi in 2020. The relationship among soil properties and soil bacteria in the combined application of biochar and N were stronger than sole N-treated soil. Furthermore, the variation in soil bacteria and fungi was closely associated with soil properties (pH, SOC, BD, TN, MBC, and MBN) and rice grain yield, which suggested that the effects of biochar in combination with N on soil bacteria and fungi community were ultimately driven by the changes in soil chemical and physical properties. These results aimed to provide a reference and basic understanding for paddy soil improvement by combined application of biochar and N with good application prospects.
The datasets presented in this study can be found in the NCBI under accession number PRJNA797522.
IA and LJ designed the study and wrote the manuscript. PY, IA, AI, Imran, HL, AK, SU, QZ, and MG performed the data analysis and revised the manuscript. HZ, SW, XW, AK, and QZ performed the data curation. All authors approved the submission.
The National Key Research and Development Project of China (2016YFD030050902) provided funding for this study.
The authors declare that the research was conducted in the absence of any commercial or financial relationships that could be construed as a potential conflict of interest.
All claims expressed in this article are solely those of the authors and do not necessarily represent those of their affiliated organizations, or those of the publisher, the editors and the reviewers. Any product that may be evaluated in this article, or claim that may be made by its manufacturer, is not guaranteed or endorsed by the publisher.
The Supplementary Material for this article can be found online at: https://www.frontiersin.org/articles/10.3389/fmicb.2022.834751/full#supplementary-material
Agegnehu, G., Srivastava, A., and Bird, M. I. (2017). The role of biochar and biochar-compost in improving soil quality and crop performance: a review. Appl. Soil Ecol. 119, 156–170.
Akhtar, K., Wang, W., Ren, G., Khan, A., Feng, Y., and Yang, G. (2018). Changes in soil enzymes, soil properties, and maize crop productivity under wheat straw mulching in Guanzhong. China. Soil Till. Res. 182, 94–102.
Ali, I., He, L., Ullah, S., Quan, Z., Wei, S., Iqbal, A., et al. (2020a). Biochar addition coupled with nitrogen fertilization impacts on soil quality, crop productivity, and nitrogen uptake under double-cropping system. Food Energy Secur. 9:e208.
Ali, I., Ullah, S., He, L., Zhao, Q., Iqbal, A., Wei, S., et al. (2020b). Combined application of biochar and nitrogen fertilizer improves rice yield, microbial activity and N-metabolism in a pot experiment. PeerJ 8:e10311. doi: 10.7717/peerj.10311
Ali, I., Zhao, Q., Wu, K., Ullah, S., Iqbal, A., Liang, H., et al. (2021). Biochar in combination with nitrogen fertilizer is a technique: to enhance physiological and morphological traits of rice (Oryza sativa L.) by improving soil physio-biochemical properties. J. Plant Growth Regul. 1–15. doi: 10.1007/s00344-021-10454-8
Ali, N., Khan, S., Li, Y., Zheng, N., and Yao, H. (2019). Influence of biochars on the accessibility of organochlorine pesticides and microbial community in contaminated soils. Sci. Total Environ. 647, 551–560. doi: 10.1016/j.scitotenv.2018.07.425
Ameloot, N. (2013). Biochar Additions to Soil: Effects on Soil Microorganisms and Carbon Stability. Ph.D. thesis. Ghent: Ghent University.
Ameloot, N., De Neve, S., Jegajeevagan, K., Yildiz, G., Buchan, D., Funkuin, Y. N., et al. (2013). Short-term CO2 and N2O emissions and microbial properties of biochar amended sandy loam soils. Soil Biol. Biochem. 57, 401–410. doi: 10.1016/j.soilbio.2012.10.025
Ameloot, N., Sleutel, S., Case, S. D., Alberti, G., Mcnamara, N. P., Zavalloni, C., et al. (2014). C mineralization and microbial activity in four biochar field experiments several years after incorporation. Soil Biol. Biochem. 78, 195–203.
Anyika, C., Majid, Z. A., Ibrahim, Z., Zakaria, M. P., and Yahya, A. (2015). The impact of biochars on sorption and biodegradation of polycyclic aromatic hydrocarbons in soils—a review. Environ. Sci. Pollut. Res. 22, 3314–3341. doi: 10.1007/s11356-014-3719-5
Bailey, V. L., Fansler, S. J., Smith, J. L., and Bolton, H. Jr. (2011). Reconciling apparent variability in effects of biochar amendment on soil enzyme activities by assay optimization. Soil Biol. Biochem. 43, 296–301.
Bending, G. D., Turner, M. K., Rayns, F., Marx, M.-C., and Wood, M. (2004). Microbial and biochemical soil quality indicators and their potential for differentiating areas under contrasting agricultural management regimes. Soil Biol. Biochem. 36, 1785–1792.
Brennan, E. B., and Acosta-Martinez, V. (2017). Cover cropping frequency is the main driver of soil microbial changes during six years of organic vegetable production. Soil Biol. Biochem. 109, 188–204. doi: 10.1016/j.dib.2018.09.013
Brookes, P. C., Landman, A., Pruden, G., and Jenkinson, D. S. (1985). Chloroform fumigation and the release of soil nitrogen: a rapid direct extraction method for measuring microbial biomass nitrogen in soil. Soil Biol. Biochem. 17, 837–842.
Bu, R., Ren, T., Lei, M., Liu, B., Li, X., Cong, R., et al. (2020). Tillage and straw-returning practices effect on soil dissolved organic matter, aggregate fraction and bacteria community under rice-rice-rapeseed rotation system. Agric. Ecosyst. Environ. 287:106681. doi: 10.1016/j.agee.2019.106681
Castaldi, S., Riondino, M., Baronti, S., Esposito, F. R., Marzaioli, R., Rutigliano, F. A., et al. (2011). Impact of biochar application to a Mediterranean wheat crop on soil microbial activity and greenhouse gas fluxes. Chemosphere 85, 1464–1471. doi: 10.1016/j.chemosphere.2011.08.031
Chen, J. H., Liu, X. Y., Zheng, J. W., Zhang, B., Lu, H. F., Chi, Z. Z., et al. (2013). ‘Biochar soil amendment increased bacterial but decreased fungal gene abundance with shifts in community structure in a slightly acid rice paddy from Southwest China’. Appl. Soil Ecol. 71, 33–44. doi: 10.1016/j.apsoil.2013.05.003
Chen, T., Zhou, Z., Xu, S., Wang, H., and Lu, W. (2015). Adsorption behavior comparison of trivalent and hexavalent chromium on biochar derived from municipal sludge. Bioresour. Technol. 190, 388–394. doi: 10.1016/j.biortech.2015.04.115
Cole, E. J., Zandvakili, O. R., Blanchard, J., Xing, B., Hashemi, M., and Etemadi, F. (2019). Investigating responses of soil bacterial community composition to hardwood biochar amendment using high-throughput PCR sequencing. Appl. Soil Ecol. 136, 80–85.
Cottrell, M. T., and Kirchman, D. L. (2000). Natural assemblages of marine proteobacteria and members of the Cytophaga-Flavobacter cluster consuming low-and high-molecular-weight dissolved organic matter. Appl. Environ. Microbiol. 66, 1692–1697. doi: 10.1128/AEM.66.4.1692-1697.2000
Creamer, R., Hannula, S., Van Leeuwen, J., Stone, D., Rutgers, M., Schmelz, R., et al. (2016). Ecological network analysis reveals the inter-connection between soil biodiversity and ecosystem function as affected by land use across Europe. Appl. Soil Ecol. 97, 112–124. doi: 10.1016/j.apsoil.2015.08.006
Dai, Z. M., Enders, A., Rodrigues, J., Hanley, K., Brookes, P., Xu, J. M., et al. (2018). Soil fungal taxonomic and functional community composition as affected by biochar properties. Soil Biol. Biochem. 126, 159–167. doi: 10.1007/s10482-018-1191-9
Dai, Z., Hu, J., Xu, X., Zhang, L., Brookes, P. C., He, Y., et al. (2016). Sensitive responders among bacterial and fungal microbiome to pyrogenic organic matter (biochar) addition differed greatly between rhizosphere and bulk soils. Sci. Rep. 6:36101. doi: 10.1038/srep36101
Dempster, D., Gleeson, D., Solaiman, Z. I., Jones, D., and Murphy, D. (2012). Decreased soil microbial biomass and nitrogen mineralisation with Eucalyptus biochar addition to a coarse textured soil. Plant Soil 354, 311–324.
Dhariwal, A., Chong, J., Habib, S., King, I. L., Agellon, L. B., and Xia, J. (2017). Microbiome analyst: a web-based tool for comprehensive statistical, visual and meta-analysis of microbiome data. Nucleic Acids Res. 45, W180–W188. doi: 10.1093/nar/gkx295
Edgar, R. C. (2010). Search and clustering orders of magnitude faster than BLAST. Bioinformatics 26, 2460–2461. doi: 10.1093/bioinformatics/btq461
Eldridge, D. J., Woodhouse, J. N., Curlevski, N. J., Hayward, M., Brown, M. V., and Neilan, B. A. (2015). Soil-foraging animals alter the composition and co-occurrence of microbial communities in a desert shrubland. ISME J. 9, 2671–2681. doi: 10.1038/ismej.2015.70
Fierer, N., Bradford, M. A., and Jackson, R. B. (2007). Toward an ecological classification of soil bacteria. Ecology 88, 1354–1364. doi: 10.1890/05-1839
Gao, M., Yang, J., Liu, C., Gu, B., Han, M., Li, J., et al. (2021). Effects of long-term biochar and biochar-based fertilizer application on brown earth soil bacterial communities. Agric. Ecosyst. Environ. 309:107285.
Gomez, J., Denef, K., Stewart, C., Zheng, J., and Cotrufo, M. (2014). Biochar addition rate influences soil microbial abundance and activity in temperate soils. Eur. J. Soil Sci. 65, 28–39. doi: 10.1111/ejss.12097
Hale, L., Luth, M., Kenney, R., and Crowley, D. (2014). Evaluation of pinewood biochar as a carrier of bacterial strain Enterobacter cloacae UW5 for soil inoculation. Appl. Soil Ecol. 84, 192–199. doi: 10.1016/j.apsoil.2014.08.001
Hang, L. I. U., Pan, F. J., Han, X. Z., Song, F. B., Zhang, Z. M., Jun, Y. A. N., et al. (2020). A comprehensive analysis of the response of the fungal community structure to long-term continuous cropping in three typical upland crops. J. Integr. Agric. 19, 866–880. doi: 10.1016/s2095-3119(19)62630-4
Harris, J. (2009). Soil microbial communities and restoration ecology: facilitators or followers? Science 325, 573–574. doi: 10.1126/science.1172975
Heitkötter, J., and Marschner, B. (2015). Interactive effects of biochar ageing in soils related to feedstock, pyrolysis temperature, and historic charcoal production. Geoderma 245, 56–64. doi: 10.1016/j.geoderma.2015.01.012
Iqbal, A., He, L., Ali, I., Ullah, S., Khan, A., Khan, A., et al. (2020). Manure combined with chemical fertilizer increases rice productivity by improving soil health, post-anthesis biomass yield, and nitrogen metabolism. PLos One 15:e0238934. doi: 10.1371/journal.pone.0238934
Iqbal, A., He, L., Khan, A., Wei, S., Akhtar, K., Ali, I., et al. (2019). Organic manure coupled with inorganic fertilizer: an approach for the sustainable production of rice by improving soil properties and nitrogen use efficiency. Agronomy 9:651. doi: 10.3390/agronomy9100651
Jackson, M. L. (1956). Soil Chemical Analysis—Advanced Course. Madison, WI: University of Wisconsin.
Ji, F., Ming, H., Li, H., Zan, S., Wang, J., Su, J., et al. (2016). Diversity of CO2 fixation gene in the surface waters of northern South China Sea in the Calvin cycle. Acta Sci. Circum. 36, 4037–4043. (In Chinese),
Jones, D. L., Rousk, J., Edwards-Jones, G., DeLuca, T. H., and Murphy, D. V. (2012). Biochar-mediated changes in soil quality and plant growth in a three year field trial. Soil Biol. Biochem. 45, 113–124.
Khan, A., Wang, Z., Chen, Z., Bu, J., Adnan, M., and Zhang, M. (2021). Investigation of soil nutrients and associated rhizobacterial communities in different sugarcane genotypes in relation to sugar content. Chem. Biol Technol. Agric. 8, 1–13.
Lehmann, J., and Joseph, S. (2015). Biochar for Environmental Management: An Introduction. London: Routledge.
Lehmann, J., Rillig, M. C., Thies, J., Masiello, C. A., Hockaday, W. C., and Crowley, D. (2011). Biochar effects on soil biota–a review. Soil biology and biochemistry 43, 1812–1836.
Li, H., Wang, J., Liu, Q., Zhou, Z., Chen, F., and Xiang, D. (2019). Effects of consecutive monoculture of sweet potato on soil bacterial community as determined by pyrosequencing. J. Basic Microbiol. 59, 181–191. doi: 10.1002/jobm.201800304
Li, Q., Bao, X., Lu, C., Zhang, X., Zhu, J., Jiang, Y., et al. (2012). Soil microbial food web responses to free-air ozone enrichment can depend on the ozone-tolerance of wheat cultivars. Soil Biol. Biochem. 47, 27–35.
Li, S., Wang, S., Fan, M., Wu, Y., and Shangguan, Z. (2020). Interactions between biochar and nitrogen impact soil carbon mineralization and the microbial community. Soil Till. Res. 196:104437.
Li, Y., Hu, S., Chen, J., Müller, K., Li, Y., Fu, W., et al. (2018). Effects of biochar application in forest ecosystems on soil properties and greenhouse gas emissions: a review. J. Soils Sediments 18, 546–563. doi: 10.1007/s11368-017-1906-y
Liu, H., Pan, F. J., Han, X. Z., Song, F. B., Zhang, Z. M., Yan, J., et al. (2020). A comprehensive analysis of the response of the fungal community structure to long-term continuous cropping in three typical upland crops. J. Integr. Agric. 19, 866–880.
Liu, M., Sui, X., Hu, Y., and Feng, F. (2019). Microbial community structure and the relationship with soil carbon and nitrogen in an original Korean pine forest of Changbai Mountain, China. BMC Microbiol. 19:218. doi: 10.1186/s12866-019-1584-6
Lian, T., Mu, Y., Jin, J., Ma, Q., Cheng, Y., Cai, Z., et al. (2019). Impact of intercropping on the coupling between soil microbial community structure, activity, and nutrient-use efficiencies. PeerJ 7:e6412. doi: 10.7717/peerj.6412
Liu, Q., Liu, B., Zhang, Y., Lin, Z., Zhu, T., Sun, R., et al. (2017). Can biochar alleviate soil compaction stress on wheat growth and mitigate soil N2O emissions? Soil Biol. Biochem. 104, 8–17.
Liu, S., Zhang, Y., Zong, Y., Hu, Z., Wu, S., Zhou, J., et al. (2016). Response of soil carbon dioxide fluxes, soil organic carbon and microbial biomass carbon to biochar amendment: a meta-analysis. GCB Bioenergy 8, 392–406.
Lu, H., Li, Z., Fu, S., Méndez, A., Gascó, G., and Paz-Ferreiro, J. (2015). Effect of biochar in cadmium availability and soil biological activity in an anthrosol following acid rain deposition and aging. Water Air Soil Pollut. 226:164.
Luo, S., Wang, S., Tian, L., Li, S., Li, X., Shen, Y., et al. (2017). Long-term biochar application influences soil microbial community and its potential roles in semiarid farmland. Appl. Soil Ecol. 117, 10–15.
Luo, Y., Iqbal, A., He, L., Zhao, Q., Wei, S., Ali, I., et al. (2020). Long-term no-tillage and straw retention management enhances soil bacterial community diversity and soil properties in Southern China. Agronomy 10:1233. doi: 10.3390/agronomy10091233
Mia, S., Uddin, N., Hussain, M., Amin, B., and Mete, F. Z. (2015). Production of biochar for soil application: a comparative study of three kiln models. Pedosphere 20, 23–24.
Magoc, T., and Salzberg, S. L. (2011). FLASH: fast length adjustment of short reads to improve genome assemblies. Bioinformatics 27, 2957–2963. doi: 10.1093/bioinformatics/btr507
Ohyama, T., Ito, M., Kobayashi, K., Araki, S., Yasuyoshi, S., and Sasaki, O. (1991). Analytical procedures of N, P, K contents in plant and manure materials using H2SO4-H2O2 Kjeldahl digestion method. Bull. Fac. Agric. 43, 110–120.
Pan, H., Chen, M., Feng, H., Wei, M., Song, F., Lou, Y., et al. (2020). Organic and inorganic fertilizers respectively drive bacterial and fungal community compositions in a fluvo-aquic soil in northern China. Soil Till. Res. 198:104540. doi: 10.1016/j.still.2019.104540
Paz-Ferreiro, J., Liang, C., Fu, S., Mendez, A., and Gasco, G. (2015). The effect of biochar and its interaction with the earthworm Pontoscolex corethrurus on soil microbial community structure in tropical soils. PLoS One 10:e0124891. doi: 10.1371/journal.pone.0124891
Steinbeiss, S., Gleixner, G., and Antonietti, M. (2009). Effect of biochar amendment on soil carbon balance and soil microbial activity. Soil Biol. Biochem. 41, 1301–1310. doi: 10.1016/j.soilbio.2009.03.016
Sun, Y., Chen, H. Y., Jin, L., Wang, C., Zhang, R., Ruan, H., et al. (2020). Drought stress induced increase of fungi: bacteria ratio in a poplar plantation. Catena 193:104607. doi: 10.1016/j.catena.2020.104607
Tardy, V., Spor, A., Mathieu, O., Lévèque, J., Terrat, S., Plassart, P., et al. (2015). Shifts in microbial diversity through land use intensity as drivers of carbon mineralization in soil. Soil Biol. Biochem. 90, 204–213. doi: 10.1016/j.soilbio.2015.08.010
Tian, B. Y., Cao, Y., and Zhang, K. Q. (2015). Metagenomic insights into communities, functions of endophytes and their associates with infection by root-knot nematode, Meloidogyne incognita, in tomato roots. Sci. Rep. 5:17087. doi: 10.1038/srep17087
Ullah, S., Ali, I., Liang, H., Zhao, Q., Wei, S., Muhammad, I., et al. (2021a). An approach to sustainable agriculture by untangling the fate of contrasting nitrogen sources in double-season rice grown with and without biochar. GCB Bioenergy 13, 382–392. doi: 10.1111/gcbb.12789
Ullah, S., Liang, H., Ali, I., Zhao, Q., Iqbal, A., Wei, S., et al. (2020). Biochar coupled with contrasting nitrogen sources mediated changes in carbon and nitrogen pools, microbial and enzymatic activity in paddy soil. J. Saudi Chem. Soc. 24, 835–849. doi: 10.1016/j.jscs.2020.08.008
Ullah, S., Zhao, Q., Wu, K., Ali, I., Liang, H., Iqbal, A., et al. (2021b). Biochar application to rice with 15N-labelled fertilizers, enhanced leaf nitrogen concentration and assimilation by improving morpho-physiological traits and soil quality. Saudi J. Biol. Sci. 28, 3399–3413. doi: 10.1016/j.sjbs.2021.03.003
Vance, E. D., Brookes, P. C., and Jenkinson, D. S. (1987). An extraction method for measuring soil microbial biomass-C. Soil Biol. Biochem. 19, 703–707.
Wang, Q., Wang, Y., Wang, Q., and Liu, J. (2014). Impacts of 9 years of a new conservational agricultural management on soil organic carbon fractions. Soil Till. Res. 143, 1–6.
Wu, L., Ma, H., Zhao, Q., Zhang, S., Wei, W., and Ding, X. (2020). Changes in soil bacterial community and enzyme activity under five years straw returning in paddy soil. Eur. J. Soil Biol. 100:103215. doi: 10.1016/j.ejsobi.2020.103215
Xu, Y., Seshadri, B., Sarkar, B., Wang, H., Rumpel, C., Sparks, D., et al. (2018). Biochar modulates heavy metal toxicity and improves microbial carbon use efficiency in soil. Sci. Total Environ. 621, 148–159. doi: 10.1016/j.scitotenv.2017.11.214
Yao, Q., Liu, J., Yu, Z., Li, Y., Jin, J., Liu, X., et al. (2017). Changes of bacterial community compositions after three years of biochar application in a black soil of northeast China. Appl. Soil Ecol. 113, 11–21.
Yilmaz, P., Parfrey, L. W., Yarza, P., Gerken, J., Pruesse, E., Quast, C., et al. (2014). The SILVA and “all-species living tree project (LTP)” taxonomic frameworks. Nucleic Acids Res. 42, D643–D648. doi: 10.1093/nar/gkt1209
Yin, D., Li, H., Wang, H., Guo, X., Wang, Z., Lv, Y., et al. (2021). Impact of different biochars on microbial community structure in the rhizospheric soil of rice grown in albic soil. Molecules 26:4783. doi: 10.3390/molecules26164783
Yu, H., Zou, W., Chen, J., Chen, H., Yu, Z., Huang, J., et al. (2019). Biochar amendment improves crop production in problem soils: a review. J. Environ. Manag. 232, 8–21. doi: 10.1016/j.jenvman.2018.10.117
Zavalloni, C., Alberti, G., Biasiol, S., Delle Vedove, G., Fornasier, F., Liu, J., et al. (2011). Microbial mineralization of biochar and wheat straw mixture in soil: a short-term study. Appl. Soil Ecol. 50, 45–51.
Zhao, J., Zhang, R., Xue, C., Xun, W., Sun, L., Xu, Y., et al. (2014). Pyrosequencing reveals contrasting soil bacterial diversity and community structure of two main winter wheat cropping systems in China. Microb. Ecol. 67, 443–453. doi: 10.1007/s00248-013-0322-0
Zheng, B. X., Zhang, D. P., Wang, Y., Hao, X. L., Wadaan, M. A., Hozzein, W. N., et al. (2019). Responses to soil pH gradients of inorganic phosphate solubilizing bacteria community. Sci. Rep. 9:25. doi: 10.1038/s41598-018-37003-w
Keywords: soil properties, biochar, soil fungi and bacteria, rice rhizosphere, grain yield
Citation: Ali I, Yuan P, Ullah S, Iqbal A, Zhao Q, Liang H, Khan A, Imran, Zhang H, Wu X, Wei S, Gu M and Jiang L (2022) Biochar Amendment and Nitrogen Fertilizer Contribute to the Changes in Soil Properties and Microbial Communities in a Paddy Field. Front. Microbiol. 13:834751. doi: 10.3389/fmicb.2022.834751
Received: 13 December 2021; Accepted: 21 January 2022;
Published: 23 March 2022.
Edited by:
Xi-En Long, Nantong University, ChinaReviewed by:
Shahzad Munir, Yunnan Agricultural University, ChinaCopyright © 2022 Ali, Yuan, Ullah, Iqbal, Zhao, Liang, Khan, Imran, Zhang, Wu, Wei, Gu and Jiang. This is an open-access article distributed under the terms of the Creative Commons Attribution License (CC BY). The use, distribution or reproduction in other forums is permitted, provided the original author(s) and the copyright owner(s) are credited and that the original publication in this journal is cited, in accordance with accepted academic practice. No use, distribution or reproduction is permitted which does not comply with these terms.
*Correspondence: Ligeng Jiang, amlhbmdAZ3h1LmVkdS5jbg==
Disclaimer: All claims expressed in this article are solely those of the authors and do not necessarily represent those of their affiliated organizations, or those of the publisher, the editors and the reviewers. Any product that may be evaluated in this article or claim that may be made by its manufacturer is not guaranteed or endorsed by the publisher.
Research integrity at Frontiers
Learn more about the work of our research integrity team to safeguard the quality of each article we publish.