 Yiyi Dong1†
 Qianquan Chen1†Zheng Fang1Qingshan Wu1Lan Xiang2Xiaojuan Niu1
 Qiuping Liu1
 Leitao Tan1
 Qingbei Weng1,2*
- 1School of Life Sciences, Guizhou Normal University, Guiyang, Guizhou, China
- 2Qiannan Normal University for Nationalities, Duyun, Guizhou, China
The gut microbiota is essential for the nutrition, growth, and adaptation of the host. Diestrammena japanica, a scavenger that provides energy to the cave ecosystem, is a keystone species in the karst cave in China. It inhabits every region of the cave, regardless of the amount of light. However, its morphology is dependent on the intensity of light. Whether the gut bacteria reflect its adaptation to the cave environment remains unknown. In this research, D. japanica was collected from the light region, weak light region, and dark region of three karst caves. The gut bacterial features of these individuals, including composition, diversity, potential metabolism function, and the co-occurrence network of their gut microbiota, were investigated based on 16S rRNA gene deep sequencing assay. The residues of amino acids in the ingluvies were also evaluated. In addition, we explored the contribution of gut bacteria to the cave adaptation of D. japanica from three various light zones. Findings showed that gut bacteria were made up of 245 operational taxonomic units (OTUs) from nine phyla, with Firmicutes being the most common phylum. Although the composition and diversity of the gut bacterial community of D. japanica were not significantly different among the three light regions, bacterial groups may serve different functions for D. japanica in differing light strengths. D. japanica has a lower rate of metabolism in cave habitats than in light regions. We infer that the majority of gut bacteria are likely engaged in nutrition and supplied D. japanica with essential amino acids. In addition, gut bacteria may play a role in adapting D. japanica’s body size. Unveiling the features of the gut bacterial community of D. japanica would shed light on exploring the roles of gut bacteria in adapting hosts to karst cave environments.
Introduction
Microorganisms are abundant in the guts of animals, and most of them are beneficial for their hosts’ health and various physiological processes (Douglas, 2011; Engel and Moran, 2013), including nutrition, development, reproduction, defense, and detoxification (Douglas, 2015). For example, they provide nutrients that hosts cannot synthesize, such as essential amino acids, B vitamins, and sterols (Douglas, 2009, 2015). In contrast to mammals, the diversity of gut microbiota in insects varies considerably among different taxa, possibly as the consequence of complex diets, variation in life span, and gut physiology (Douglas, 2011). Apis mellifera, for instance, harbored 14 species; however, Reticulitermes speratus harbored 254 operational taxonomic units (OTUs) (Colman et al., 2012).
Karst is a soluble rock that dissolves in water to form stone forests on the ground and caves under the earth. It accounts for around 20% of the land on the earth that is not covered by ice and provides water to approximately 25% of the world’s population (Bystriakova et al., 2019). The karst area in southwestern China, the largest karst area in the world, is one of the 25 global biodiversity hotspots (Luo et al., 2016). The karst cave is characterized by darkness, moistness, constant temperature, poor air circulation, a high concentration of carbon dioxide, a lack of food, and low biomass (Lavoie et al., 2007). Multiple features of insect adaptations to cave environments include morphological adaptations (loss of vision and body color changes), physiological adaptations (low metabolic rate and CO2 tolerance), and behavioral adaptations (loss of circadian rhythm and variations in mating behavior) (Howarth and Moldovan, 2018). Therefore, cave inhabitants are an ideal model for exploring the environmental adaptations of organisms.
Diestrammena japanica Blatchley (Orthoptera: Rhaphidophoridae) is the dominant insect species in karst caves and is found in all regions of caves. However, individuals from different light strength exhibit distinct morphological features. Previous reports on D. japanica primarily focused on its population composition (Li et al., 2001; Li, 2006), the influence of environmental factors on its population structure (Li, 2006), and the heavy metal concentration in its body in caves with heavy metal pollution (Xu et al., 2010; Ye and Li, 2011). D. japanica has access to different foods depending on light strength. Specifically, species in the light region consume more moss and fern, while species in weak light and dark regions feed on more animal carcasses and fungi (Li, 2007). However, the gut bacterial compositions and their roles in the adaptation of D. japanica to cave habitats remain unknown.
In the study, 16S rRNA gene deep sequencing was utilized to unveil the composition and structure of gut microbiota in D. japanica near the entrance of karst caves (light region) and in cave habitats (weak light and dark regions). Results showed that Firmicutes were the most dominant phylum, and Lactobacillus was the most abundant genus. The community composition and diversity indices were not influenced by light strength. Phylogenetic investigation of communities by the reconstruction of unobserved states analysis implied that many gut bacteria were involved in nutrition, such as several amino acid biosynthesis pathways. Gut bacteria of D. japanica exhibit low diversity but strong cooperation interactions in the dark region. These results indicated that the gut bacteria may help D. japanica adapt to the poor nutrient cave environment. Exploring the diversity and function of gut bacteria from cave insects can help understand species adaptation in extreme environments.
Materials and methods
Sample collection
Diestrammena japanica was collected from three karst caves in Libo county, Guizhou province, China. The locations of the caves are shown in Supplementary Table 1. Based on the habitat categories, light strength in the cave environment, and the presence of D. japanica, the zone was divided into the light region (the areas with direct sunlight are near the cave’s entrance and distance from the entrance within 10 m), the weak light region (transition twilight areas distance from the entrance within 10–30 m), and the dark region (deep zones of the cave are entirely dark and distance from the entrance beyond 50 m), according to the light strength and distance from the cave entrance (Culver and Pipan, 2019). Species of D. japanica were caught and stored separately in sterile tubes at −20°C, and samples were subsequently transferred to the laboratory in 12 h. To quantify the individual size of D. japanica, a ruler with a 0.1-mm scale was used to measure trait features, including body length, hind leg length, front leg length, middle leg length, and head width, with 24 individual repetitions for each region. The least significant difference (LSD) test in agricolae package (de Mendiburu, 2014) was employed to examine whether there were significant differences in these morphological traits.
Amino acid titer determination in ingluvies of Diestrammena japanica
Ten fresh species from each light region were dissected with dissection forceps. The inclusion from the ingluvies where food was stored was extracted in a 2-ml sterile vial and then stored at −80°C. An amino acid analyzer (Sykam S433, Fürstenfeldbruck, Germany) was used to assess the concentration of amino acids in foods.
DNA extraction and 16S rRNA gene sequencing
The ethanol-treated samples were rinsed three times with enough sterile water in plates. The gut was then isolated from other tissues and placed in a sterile tube. A total of 15 guts from each light-strength region of the caves were pooled together as one biological replication. Guts were ground into a powder with a pestle. To avoid the contamination of microorganisms from the air in the laboratory, the above operations were carried out in a biosafety cabinet. DNA was extracted using the DNeasy PowerSoil Kit (Qiagen, Hilden, Germany) according to the manufacturer’s protocol. The DNA quality and quantity were measured with the BioTek Epoch 2 Microplate Spectrophotometer (Agilent, Palo Alto, USA). The bacterial V3–V4 hypervariable region of the 16S rRNA gene was amplified by the universal primers 338F (ACTCCTACGGGAGGCAGCAG) and 806R (GGACTACHVGGGTWTCTAAT) using TransStart FastPfu DNA polymerase (TransGen, Beijing, China) according to the manufacturer’s protocol. Each sample was amplified in triplicate, and then all polymerase chain reaction (PCR) products were checked by 2% agarose gel electrophoresis. High-quality PCR reaction products that were amplified from the same sample were pooled together and subjected to purification with AxyPrep DNA Gel Extraction Kit (Axygen Biosciences, Union City, CA, United States). Purified products were quantified with QuantiFluorTM-ST (Promega, United States) following the manufacturer’s protocol. The paired-end libraries were synthesized with the TruSeqTM DNA Sample Prep Kit (Illumina, San Diego, CA, United States) following the manufacturer’s protocol. Sequencing was conducted with Illumina MiSeq platform sequencing technology with a maximum read length of 2 × 300 bp at Shanghai Majorbio Bio-pharm Technology Co., Ltd.
Analysis of 16S rRNA gene sequencing data
The quality of raw reads was assessed with FASTP (version 0.19.6) (Chen S. et al., 2018). High-quality reads were assembled with Flash (version 1.2.11) (Magoc and Salzberg, 2011) and analyzed with QIIME (version 1.9.1) and Mothur (version 1.30.2) (Schloss et al., 2009; Caporaso et al., 2010; Schloss, 2020). Furthermore, bacterial operational taxonomic units (OTUs) were grouped with 97% similarity to the SILVA (version 132) and Greengenes (version 135) database with the Ribosomal Database Project Classifier (version 2.11) (DeSantis et al., 2006; Edgar, 2013; Quast et al., 2013). OTUs with more than 20 reads for all samples and distribution across three samples (at least five reads for each sample) were retained for further analysis.
Function prediction of gut bacterial communities
The function of gut bacteria was predicted by searching against the Clusters of Orthologous Groups (COGs) database with the Phylogenetic Investigation of Communities by Reconstruction of Unobserved States (PICRUSt) (Langille et al., 2013). These analyses were performed using the Majorbio Cloud Platform. 1 The Kruskal–Wallis test was used for multiple group comparisons. Differences were considered significant if the p-value was <0.05.
Analysis of network for gut bacterial communities
To compare the structure and existence pattern of the gut bacterial communities of D. japanica, we performed the bacterial co-occurrence network for each light-strength region separately. Each co-occurrence network was conducted based on the top 50 relative abundance genera that occurred in eight phyla in the network analysis. Only the strong correlations in these groups were visualized in the co-occurrence network. Thus, the bacterial interactions comprised only significant correlations (p < 0.01) of the correlative coefficient (the absolute value of r > 0.8) in the network. Moreover, we calculated the edge, connectance, clustering coefficient, average degree, and modularity for each co-occurrence network. We also detected that the links per species in each network were significantly different (p < 0.001) in the random network using the r2dtable null model. All relative network analyses were performed in R software (R Development Core Team, 2018), using the packages igraph (Csardi and Nepusz, 2006), bipartite (Dormann et al., 2008), psych (Revelle and Revelle, 2015), and statnet (Handcock et al., 2008).
Statistical analysis
First, the LSD test was conducted to assess whether there were significant differences in the morphological traits of D. japanica among the three light-strength regions. Mothur and R software were used to build rarefaction curves to determine if the sequencing depth (reads) was sufficient to capture the majority of gut bacteria (Schloss et al., 2009; Schloss, 2020). The top 35 abundance genera were used to generate a heatmap with ggplot2 (Ginestet, 2011), and the Kruskal–Wallis test was used to test the differences in the abundances of the 35 genera among three light regions. The Venn diagram, which exhibited the overlap of OTUs among groups, was generated with the R package VennDiagram (Chen and Boutros, 2011). To decipher whether the gut bacterial composition was affected by regions with different light-strength regions, the Shannon and Simpson diversity indexes were calculated with Mothur, and then the pairwise Wilcox test was used to test for significant differences in the bacterial diversity indices, with a p-value adjusted for false discovery rate (fdr-adjusted). Subsequently, the beta diversity of bacterial communities was compared via ANOSIM and permutational multivariate analysis of variance (PERMANOVA, permutation 9,999 times, based on the Bray–Curtis matrix), respectively. The analyses were conducted via MicrobiotaProcess (Xu et al., 2022) and Vegan (Oksanen et al., 2013) packages in R (version 4.1.2).2 A PERMANOVA test uncovered that the compositions of gut bacteria were not significant differences among the three light regions, and then we tested the differences between two groups (light region as one group, and weak and dark regions as another group); abund_jaccard matrix (considering both OTUs’ availability and abundance) was used for principal component analysis (PCA), combining with the Adonis analysis (permutation 9,999 times).
Results
Morphological adaptations of Diestrammena japanica
Diestrammena japanica is distributed in all regions of caves, independent of light strength. However, the LSD test showed that species from light regions were significantly larger than those from weak light and dark regions (Figure 1A and Table 1). However, the species from weak and dark regions were not significantly different in body size (Table 1).
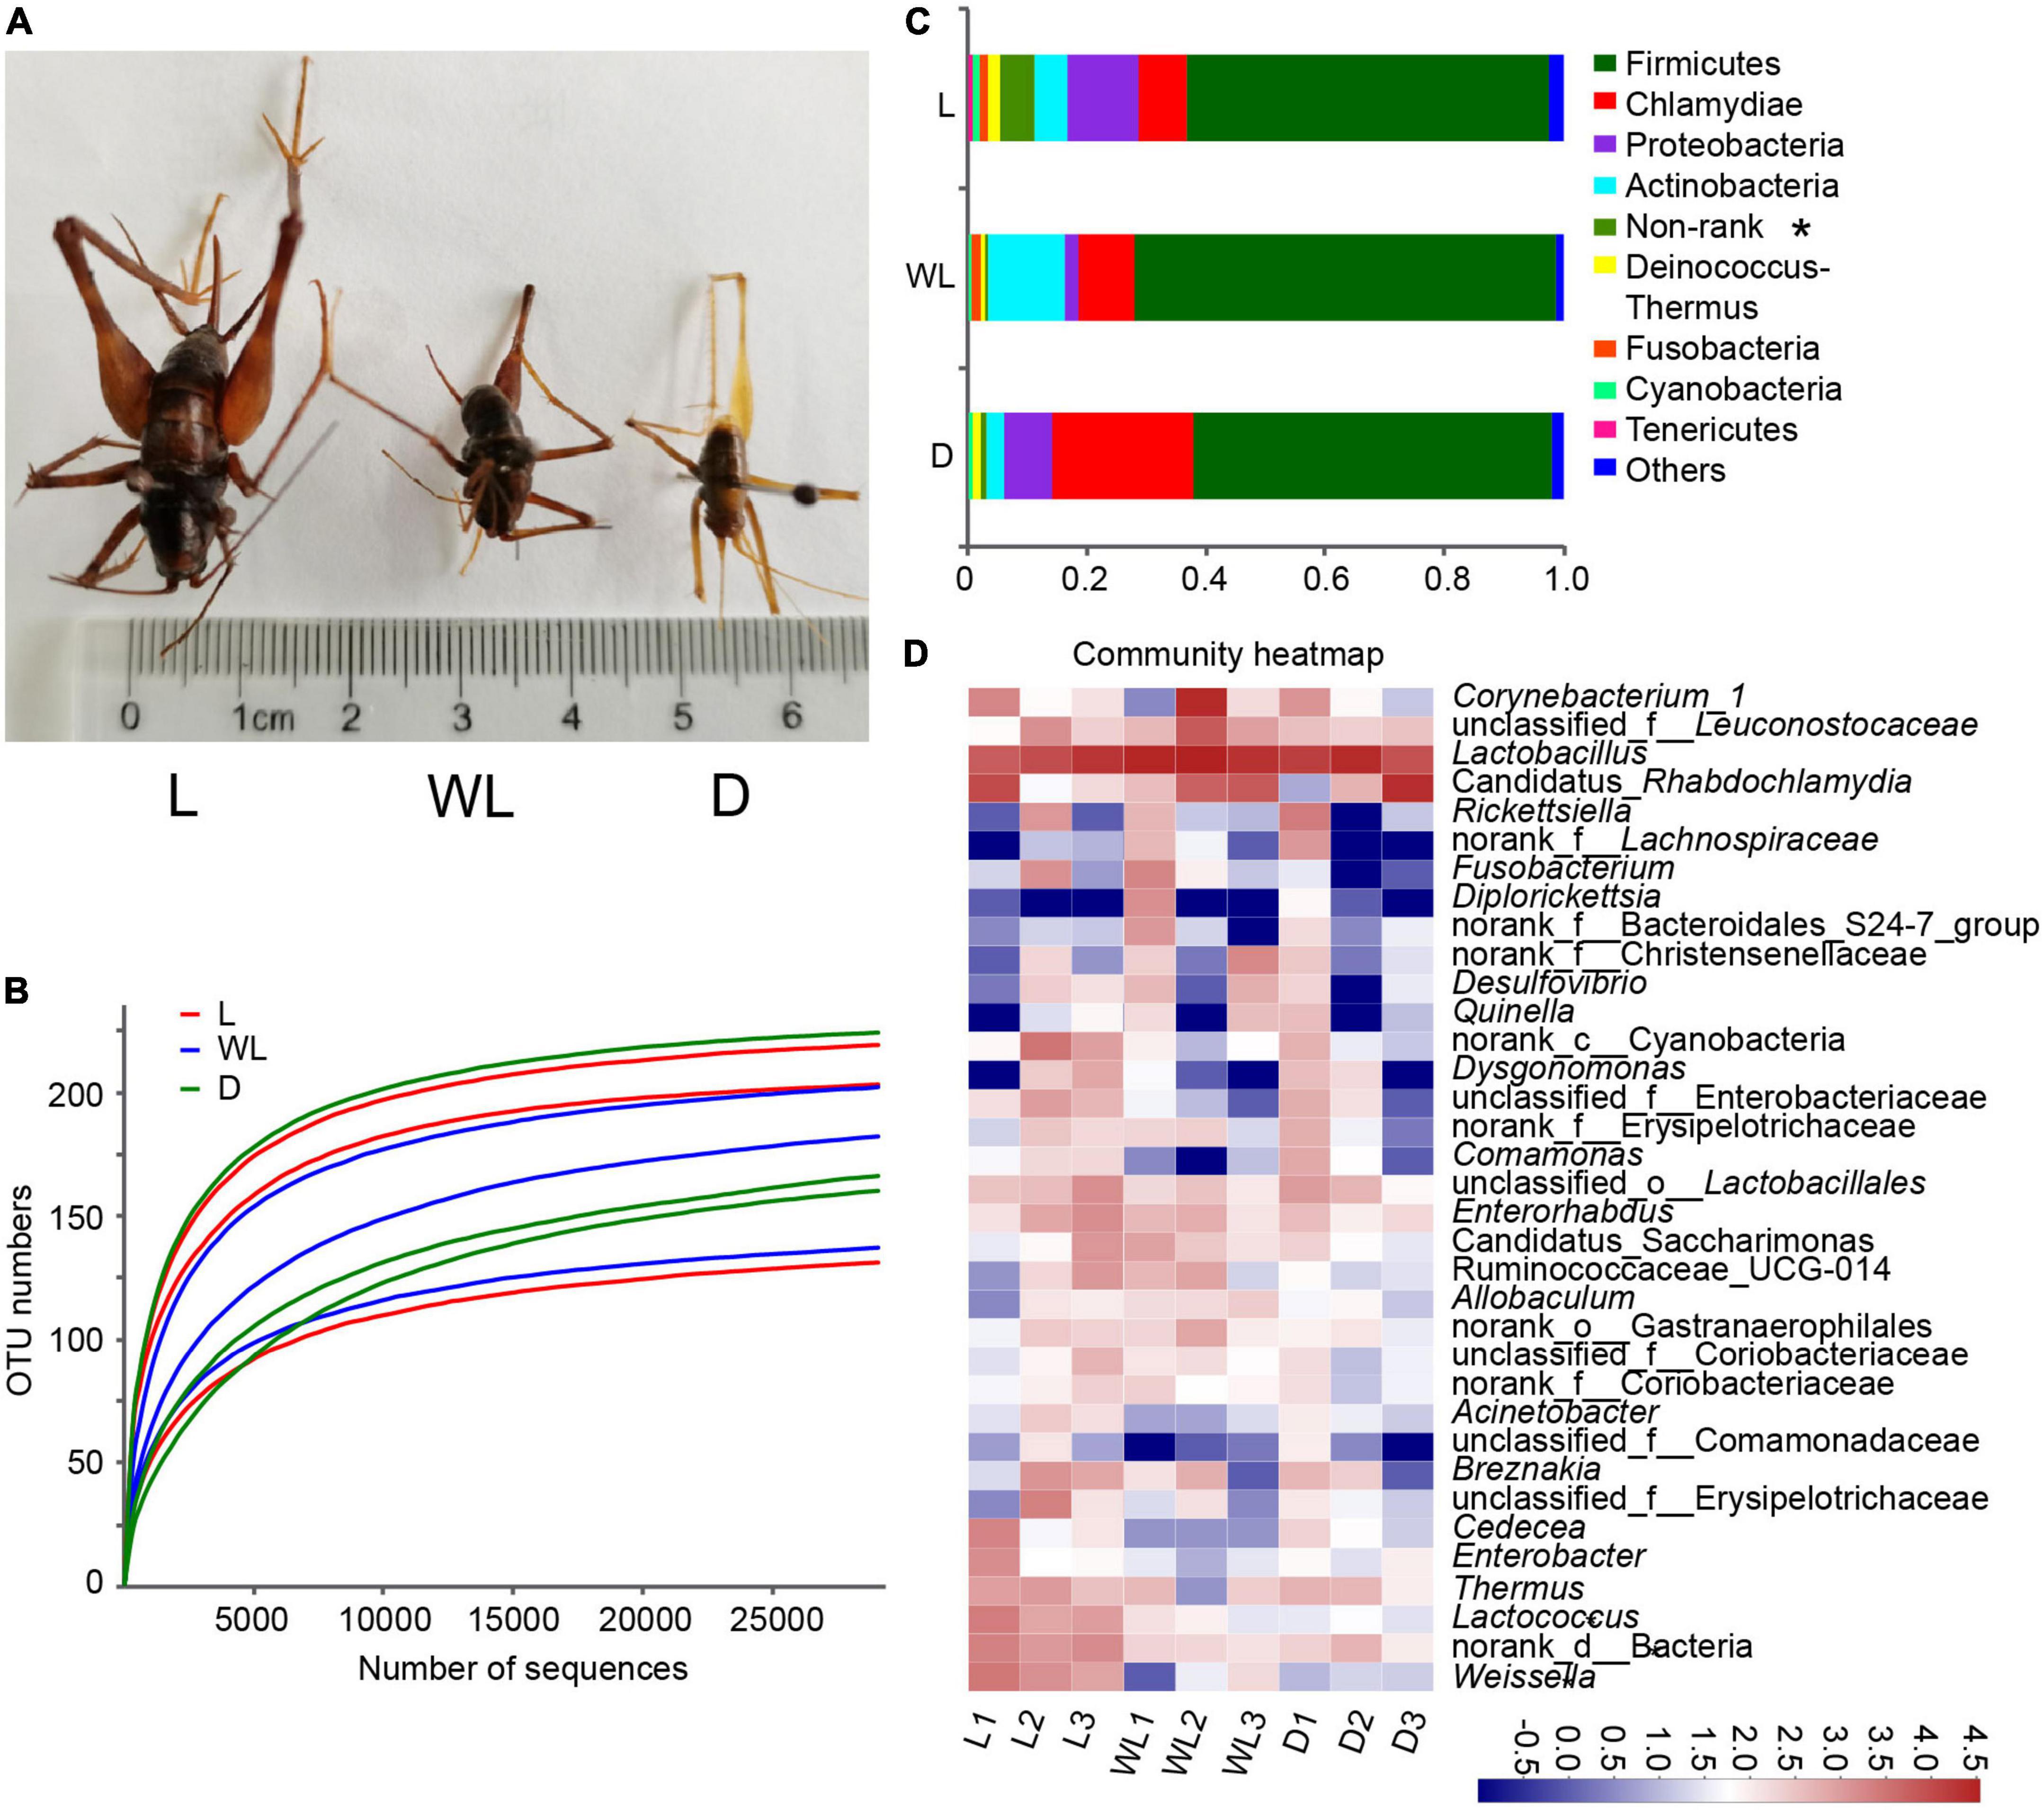
Figure 1. Gut bacteria dynamics among different light-strength regions in Diestrammena japanica. (A) Morphology of D. japanica from different light-strength regions. (B) Rarefaction curves generated from randomly subsampled data sets with the same number of 16S rRNA gene deep sequencing. (C) Relative abundance of gut bacteria at the phylum level. (D) Relative abundance of the top 35 abundance genera gut bacteria, the color scales display the bacterial relative abundance (log10 transformed). L, light region; WL, weak light region; D, dark region. These labels are the same as in the other figures.
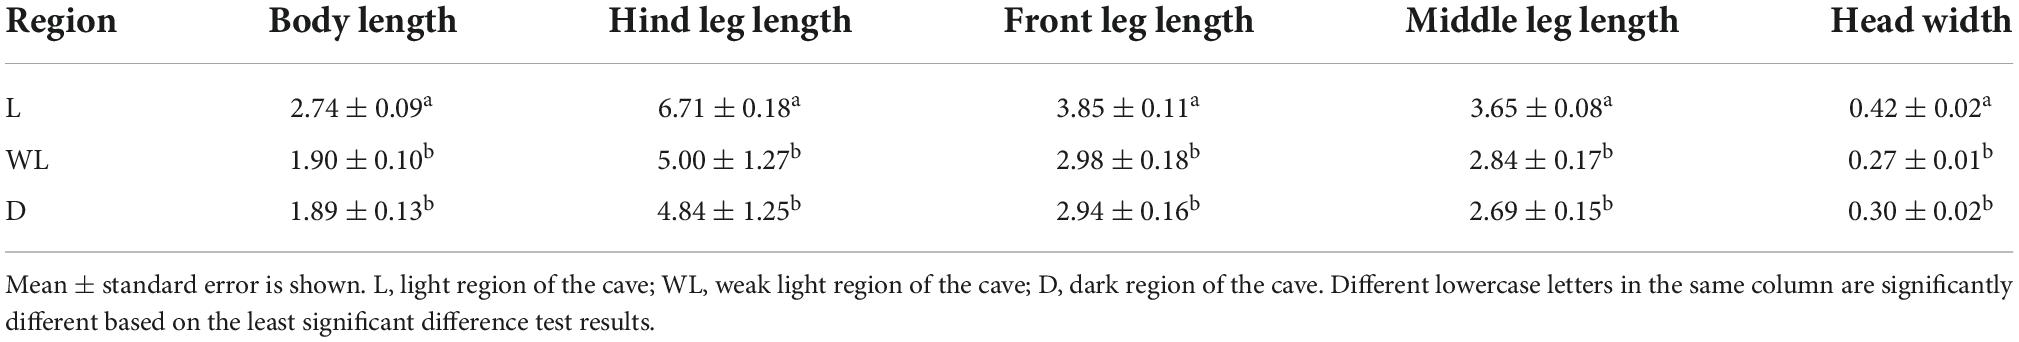
Table 1. The morphological traits of Diestrammena japanica in different light-strength regions (N = 24, Unit: mm).
The sequencing overview of gut bacteria from Diestrammena japanica
Sequencing was performed on a total of nine samples from three distinct light-strength regions in three caves. Following filtering, the number of high-quality reads and bases was 388,019 and 172,857,092, respectively (Supplementary Table 2). The average read length ranged from 442 to 449 (Supplementary Table 2). The minimum number of reads per sample was 32,208. The rarefaction curve verified that the depth of sequencing was sufficient to capture the majority of bacterial species (Figure 1B). The reads were clustered into 245 OTUs, which shared >97% sequence identity (Supplementary Table 3). In addition to Firmicutes, Proteobacteria, Actinobacteria, Cyanobacteria, Tenericutes, Deinococcus-Thermus, Fusobacteria, Chlamydiae, and one non-rank phylum were detected in the gut of D. japanica (Figure 1C and Supplementary Table 3).
Compositions and diversities of gut bacteria among different light-strength regions in Diestrammena japanica
Firmicutes were the most abundant in all samples, accounting for 60.87, 70.79, and 60.18% of bacterial groups of species from light, weak light, and dark regions, respectively (Figure 1C). Chlamydiae accounted for 8.05–23.77% of the bacterial composition from different light-strength regions. Proteobacteria accounted for 2.36–12.07% of the total bacterial sequences, of which Rickettsiella, including one unclassified OTU, was the most abundant genus of Proteobacteria. The top two genera of Actinobacteria were Corynebacterium and Enterorhabdus.
The top 35 abundance genera were used to generate the heatmap (Figure 1D). Lactobacillus was the most abundant genus, accounting for 37.35, 59.89, and 52.72% of bacteria found in species from light, weak light, and dark regions, respectively (Figure 1D and Supplementary Table 3). Among the 16 OTUs belonging to the genus Lactobacillus, L. amylovorus and L. oligofermentans were the most abundant, accounting for 66.38–85.46% and 2.43–10.41% of the abundance of the genus Lactobacillus. The abundance of Candidatus Rhabdochlamydia and Corynebacterium ranged from 8.05 to 23.77% and 1.43 to 11.20%, respectively.
Among the top 35 genera, Lactococcus (Kruskal–Wallis test, df = 2, p = 0.0376), Weissella (Kruskal–Wallis test, df = 2, p = 0.0358), and non-rank bacteria (Kruskal–Wallis test, df = 2, p = 0.0302) were more abundant in species from the light region than in those from weak light and dark regions (Figure 1D), and remailing bacterial groups were not significantly different among the three light regions.
Furthermore, the diversity analysis of bacterial community revealed that the Shannon index exhibited the following pattern: light (2.96) > weak light (2.14) > dark (1.19), and the Simpson index exhibited the opposite pattern to the Shannon index (Figure 2A). The two diversity indices were not significantly different among light-strength regions (all fdr-adjusted p-values from the pairwise Wilcox test were greater than 0.05, Supplementary Table 4).
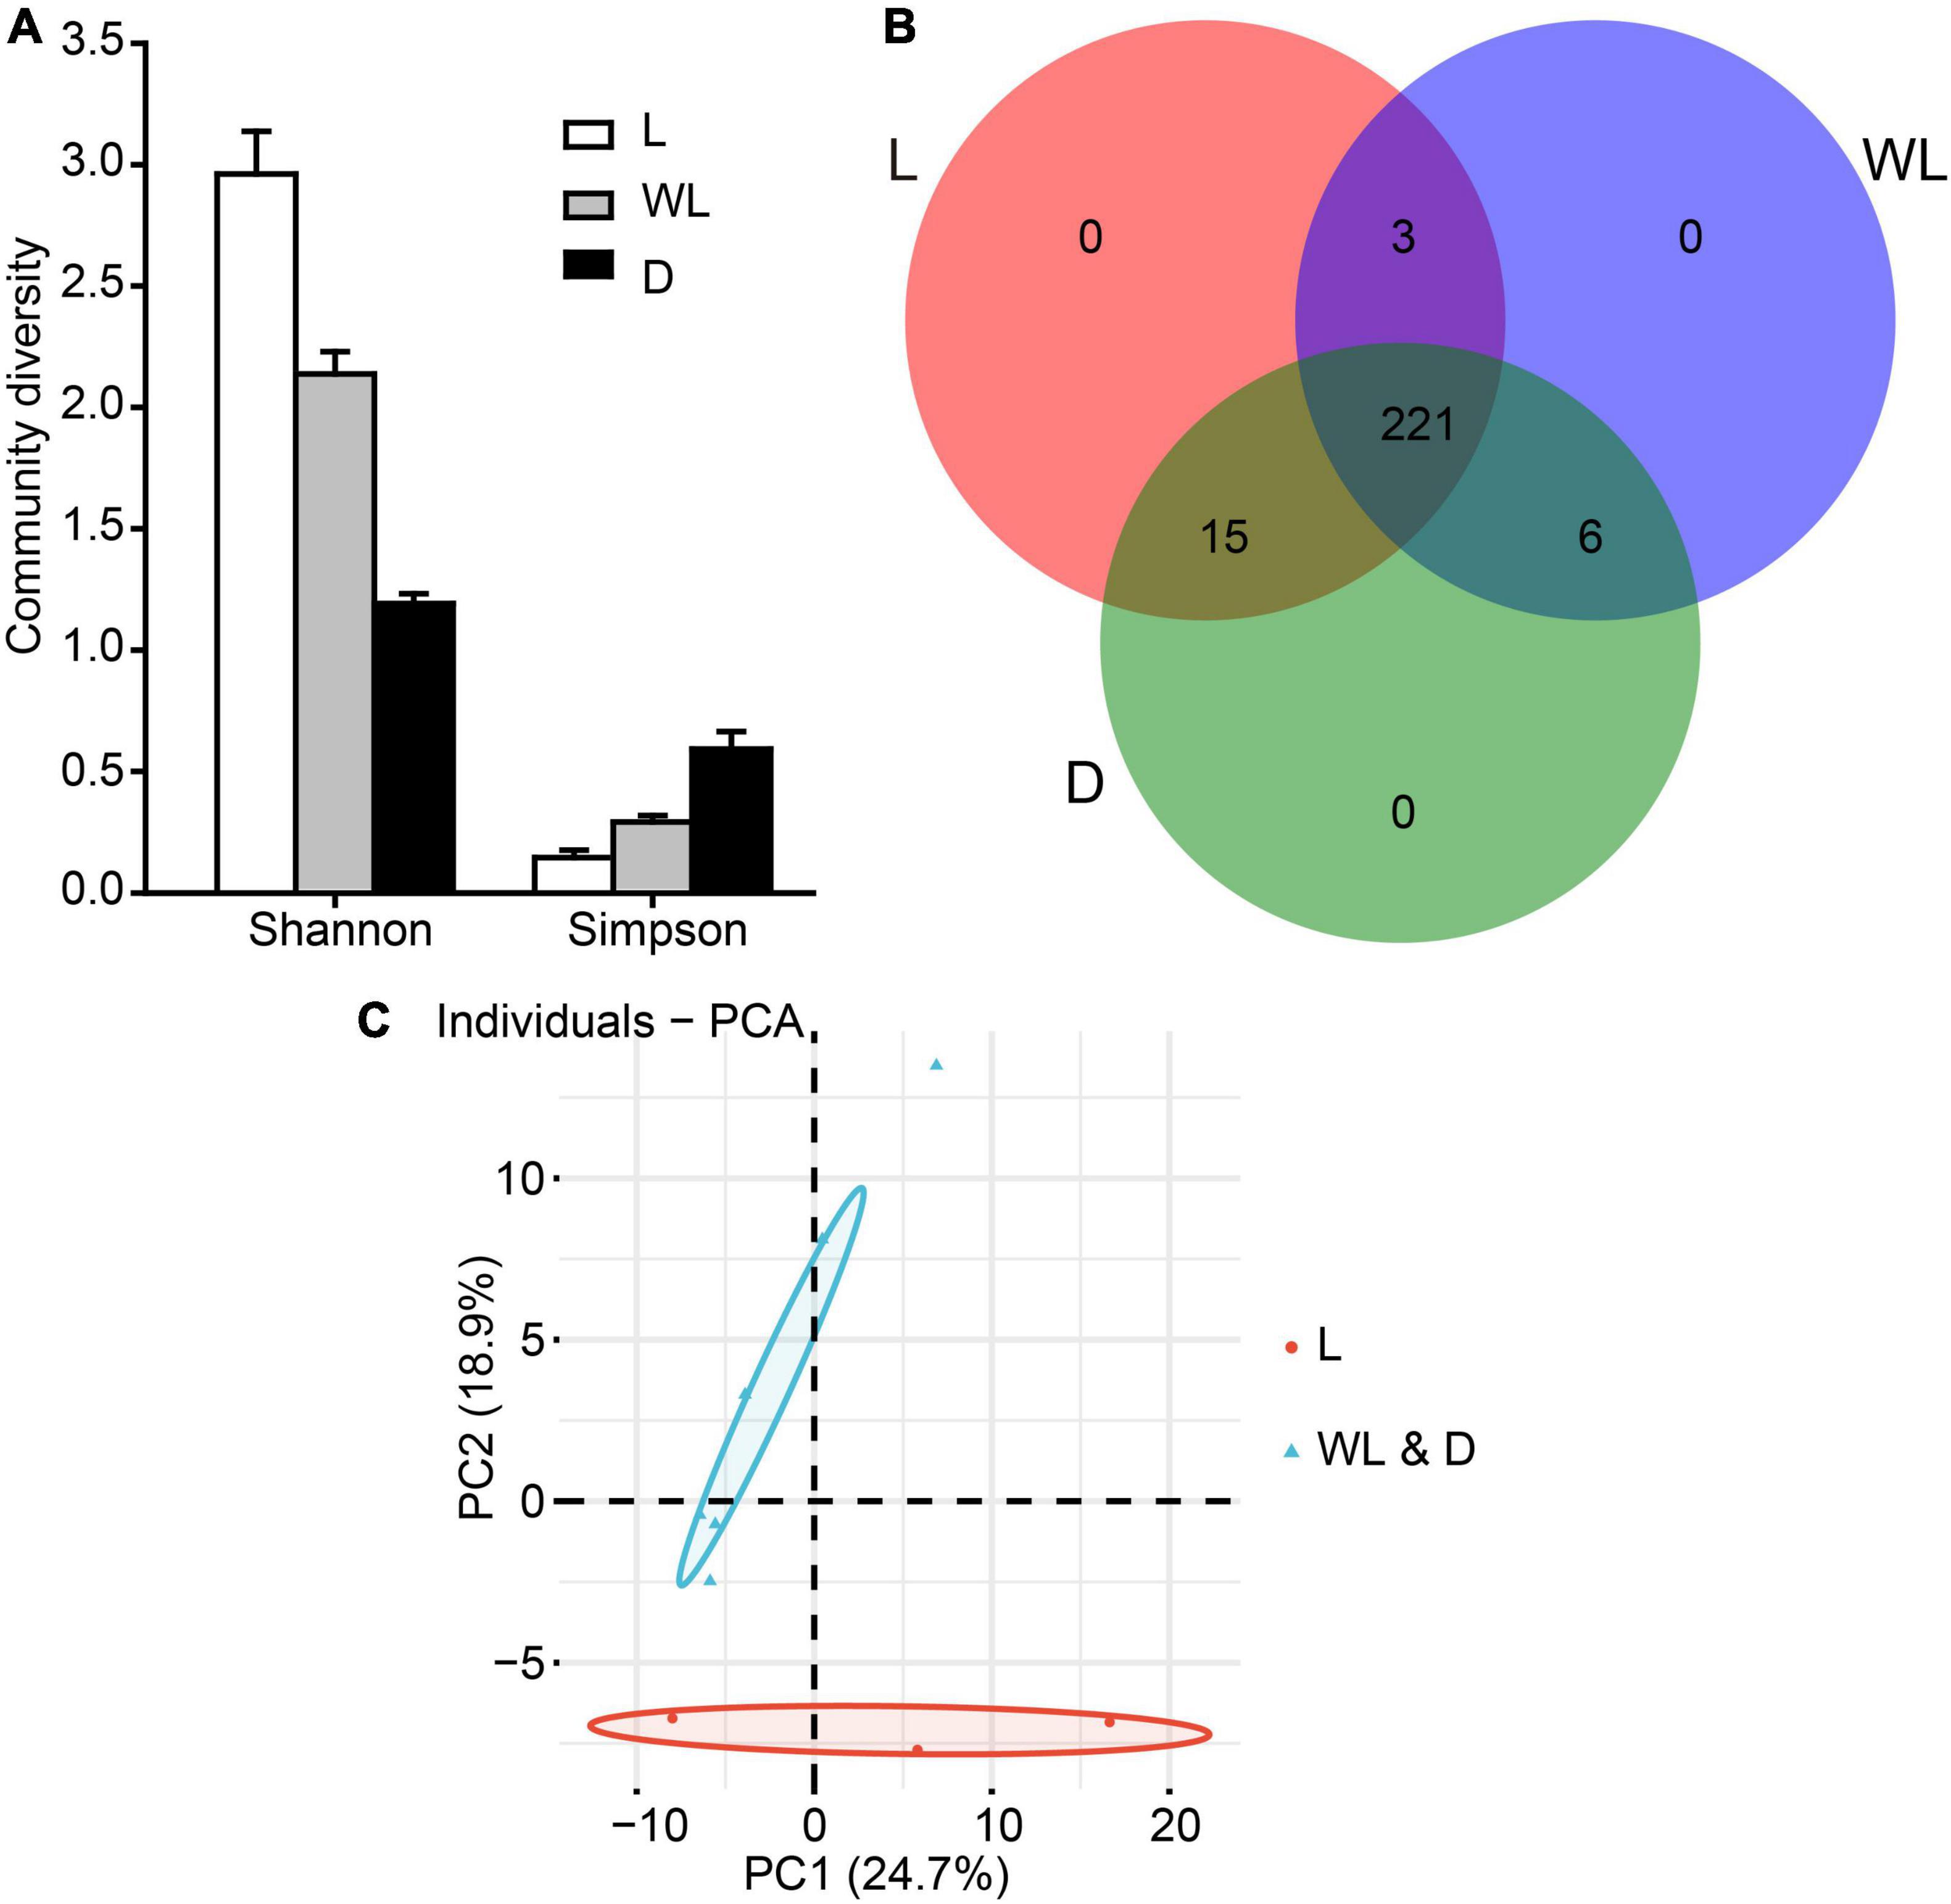
Figure 2. Gut bacterial community dynamics among different light-strength regions in D. japanica. (A) Community diversity measured by the Shannon index and Simpson index. (B) Overlap of OTUs from different light-strength regions. (C) Principal component analysis showed gut bacteria were clustered into two groups according to light strengths, based on the Adonis testing result (R = 0.3457, p = 0.049); the different colors show different groups with the boundaries of the 95% confidence ellipses. The red represents the species from weak light and dark regions.
Composition similarity of gut bacteria among different light-strength regions in Diestrammena japanica
A total of 239, 230, and 242 OTUs, respectively, were detected in the species from light, weak light, and dark regions (Figure 2B). The Venn diagram analysis revealed that 221 OTUs were shared by species from three regions. species from the dark and weak light regions shared six OTUs, while species from the light region shared three and 15 OTUs with species from the weak light and dark regions, respectively (Figure 2B). At bacterial species levels, the samples from three light-strength regions revealed consistent patterns (no significant differences in bacterial composition) from ANOSIM (statistic R = 0.004, p = 0.43). However, the PERMANOVA test uncovered that the bacterial community did not have significant changes in three light-strength regions (Supplementary Table 5, PERMANOVA Pseudo-F = 1.39, R2 = 0.32, p = 0.13). Intriguingly, the PCA analysis with abund_jaccard matrix indicated that bacterial communities of species from weak light and dark regions were clustered as one group, and the remaining species from the light region were clustered as another group (Adonis test, R = 0.3457, p = 0.049; the first two axes explaining 43.60% of the total variability) (Figure 2C).
Co-occurrence network analysis of gut bacteria among different light-strength regions in Diestrammena japanica
A co-occurrence network analysis was carried out to unveil the interaction and structure of gut bacterial communities. Compared with gut bacteria in the species from the light region (edge: 138), the interactions among gut bacteria in the species from the weak light and dark region (edge: 363 and 385 separately) were more complex (Figure 3 and Table 2). Moreover, we observed that the network only included the positive interaction (gray line) in the dark region; the network from the weak light consisted of 233 positive edges and 130 negative edges (red line). However, there were 83 positive interactions and 55 negative interactions in the gut bacterial community from the light region. In addition, the connectance and average degree of the network highlighted the pattern of dark > weak light > light, while the modularity exhibited the reverse pattern (light > weak light > dark).
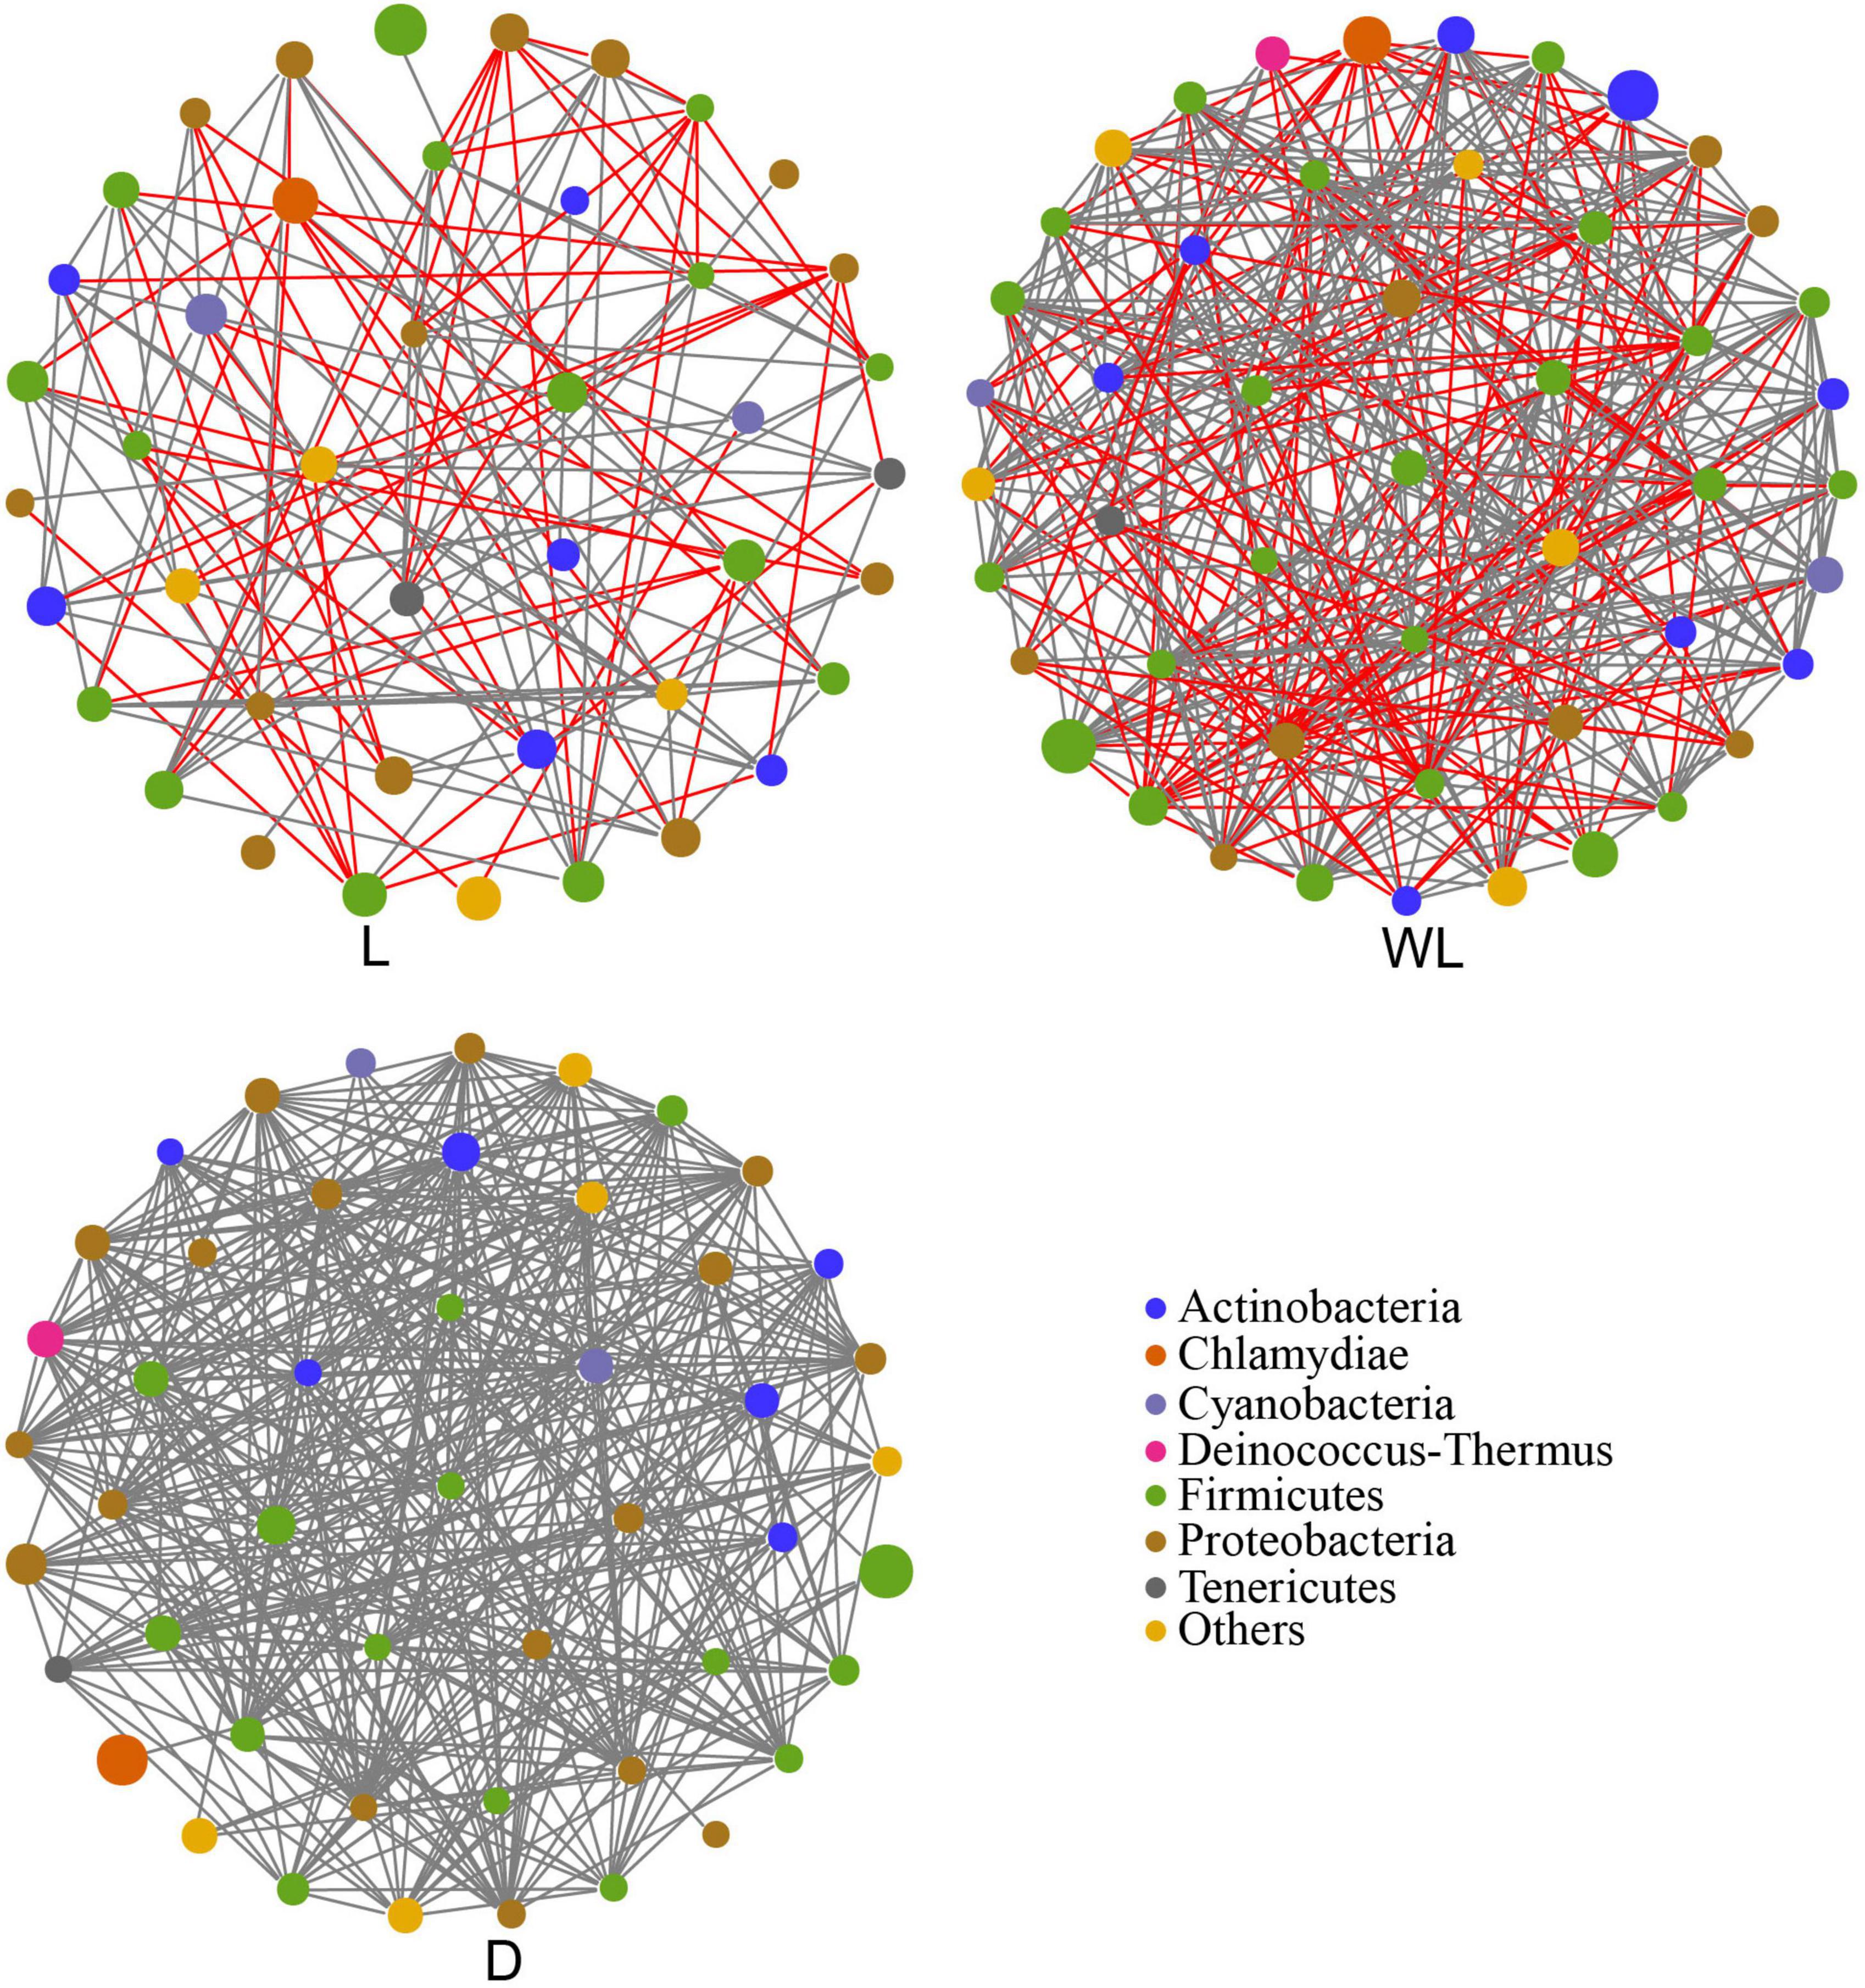
Figure 3. Co-occurrence network analysis of gut bacteria community in D. japanica. The size of the node represents the relative abundance. Positive interaction, gray line; negative interaction, red line.
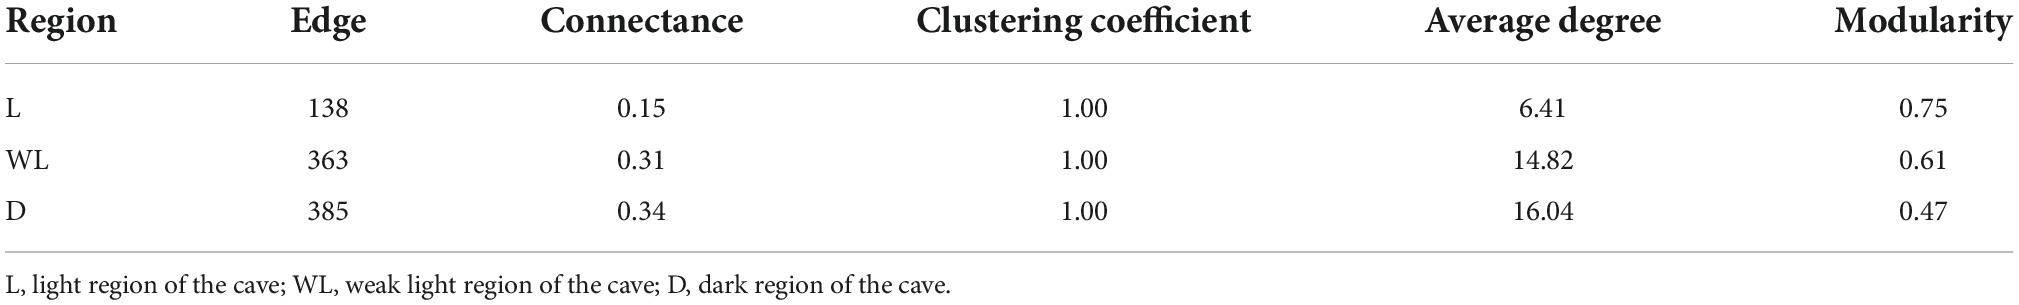
Table 2. The co-occurrence network parameter in different light-strength regions.
Function prediction of gut bacteria among different light-strength regions in Diestrammena japanica
The PICRUSt prediction was conducted to reveal the role of the gut bacterial community in D. japanica. The results uncovered that 34.96% of gut bacteria were involved in the nutritional function of the host. Specifically, 8.40, 8.21, 5.90, 5.26, 4.04, and 3.15% of bacteria, respectively, were involved in amino acid transport and metabolism, carbohydrate transport and metabolism, inorganic ion transport and metabolism, energy production and conversion, nucleotide transport and metabolism, and lipid transport and metabolism (Figure 4). Moreover, 2.52% of gut microorganisms were implicated in defense.
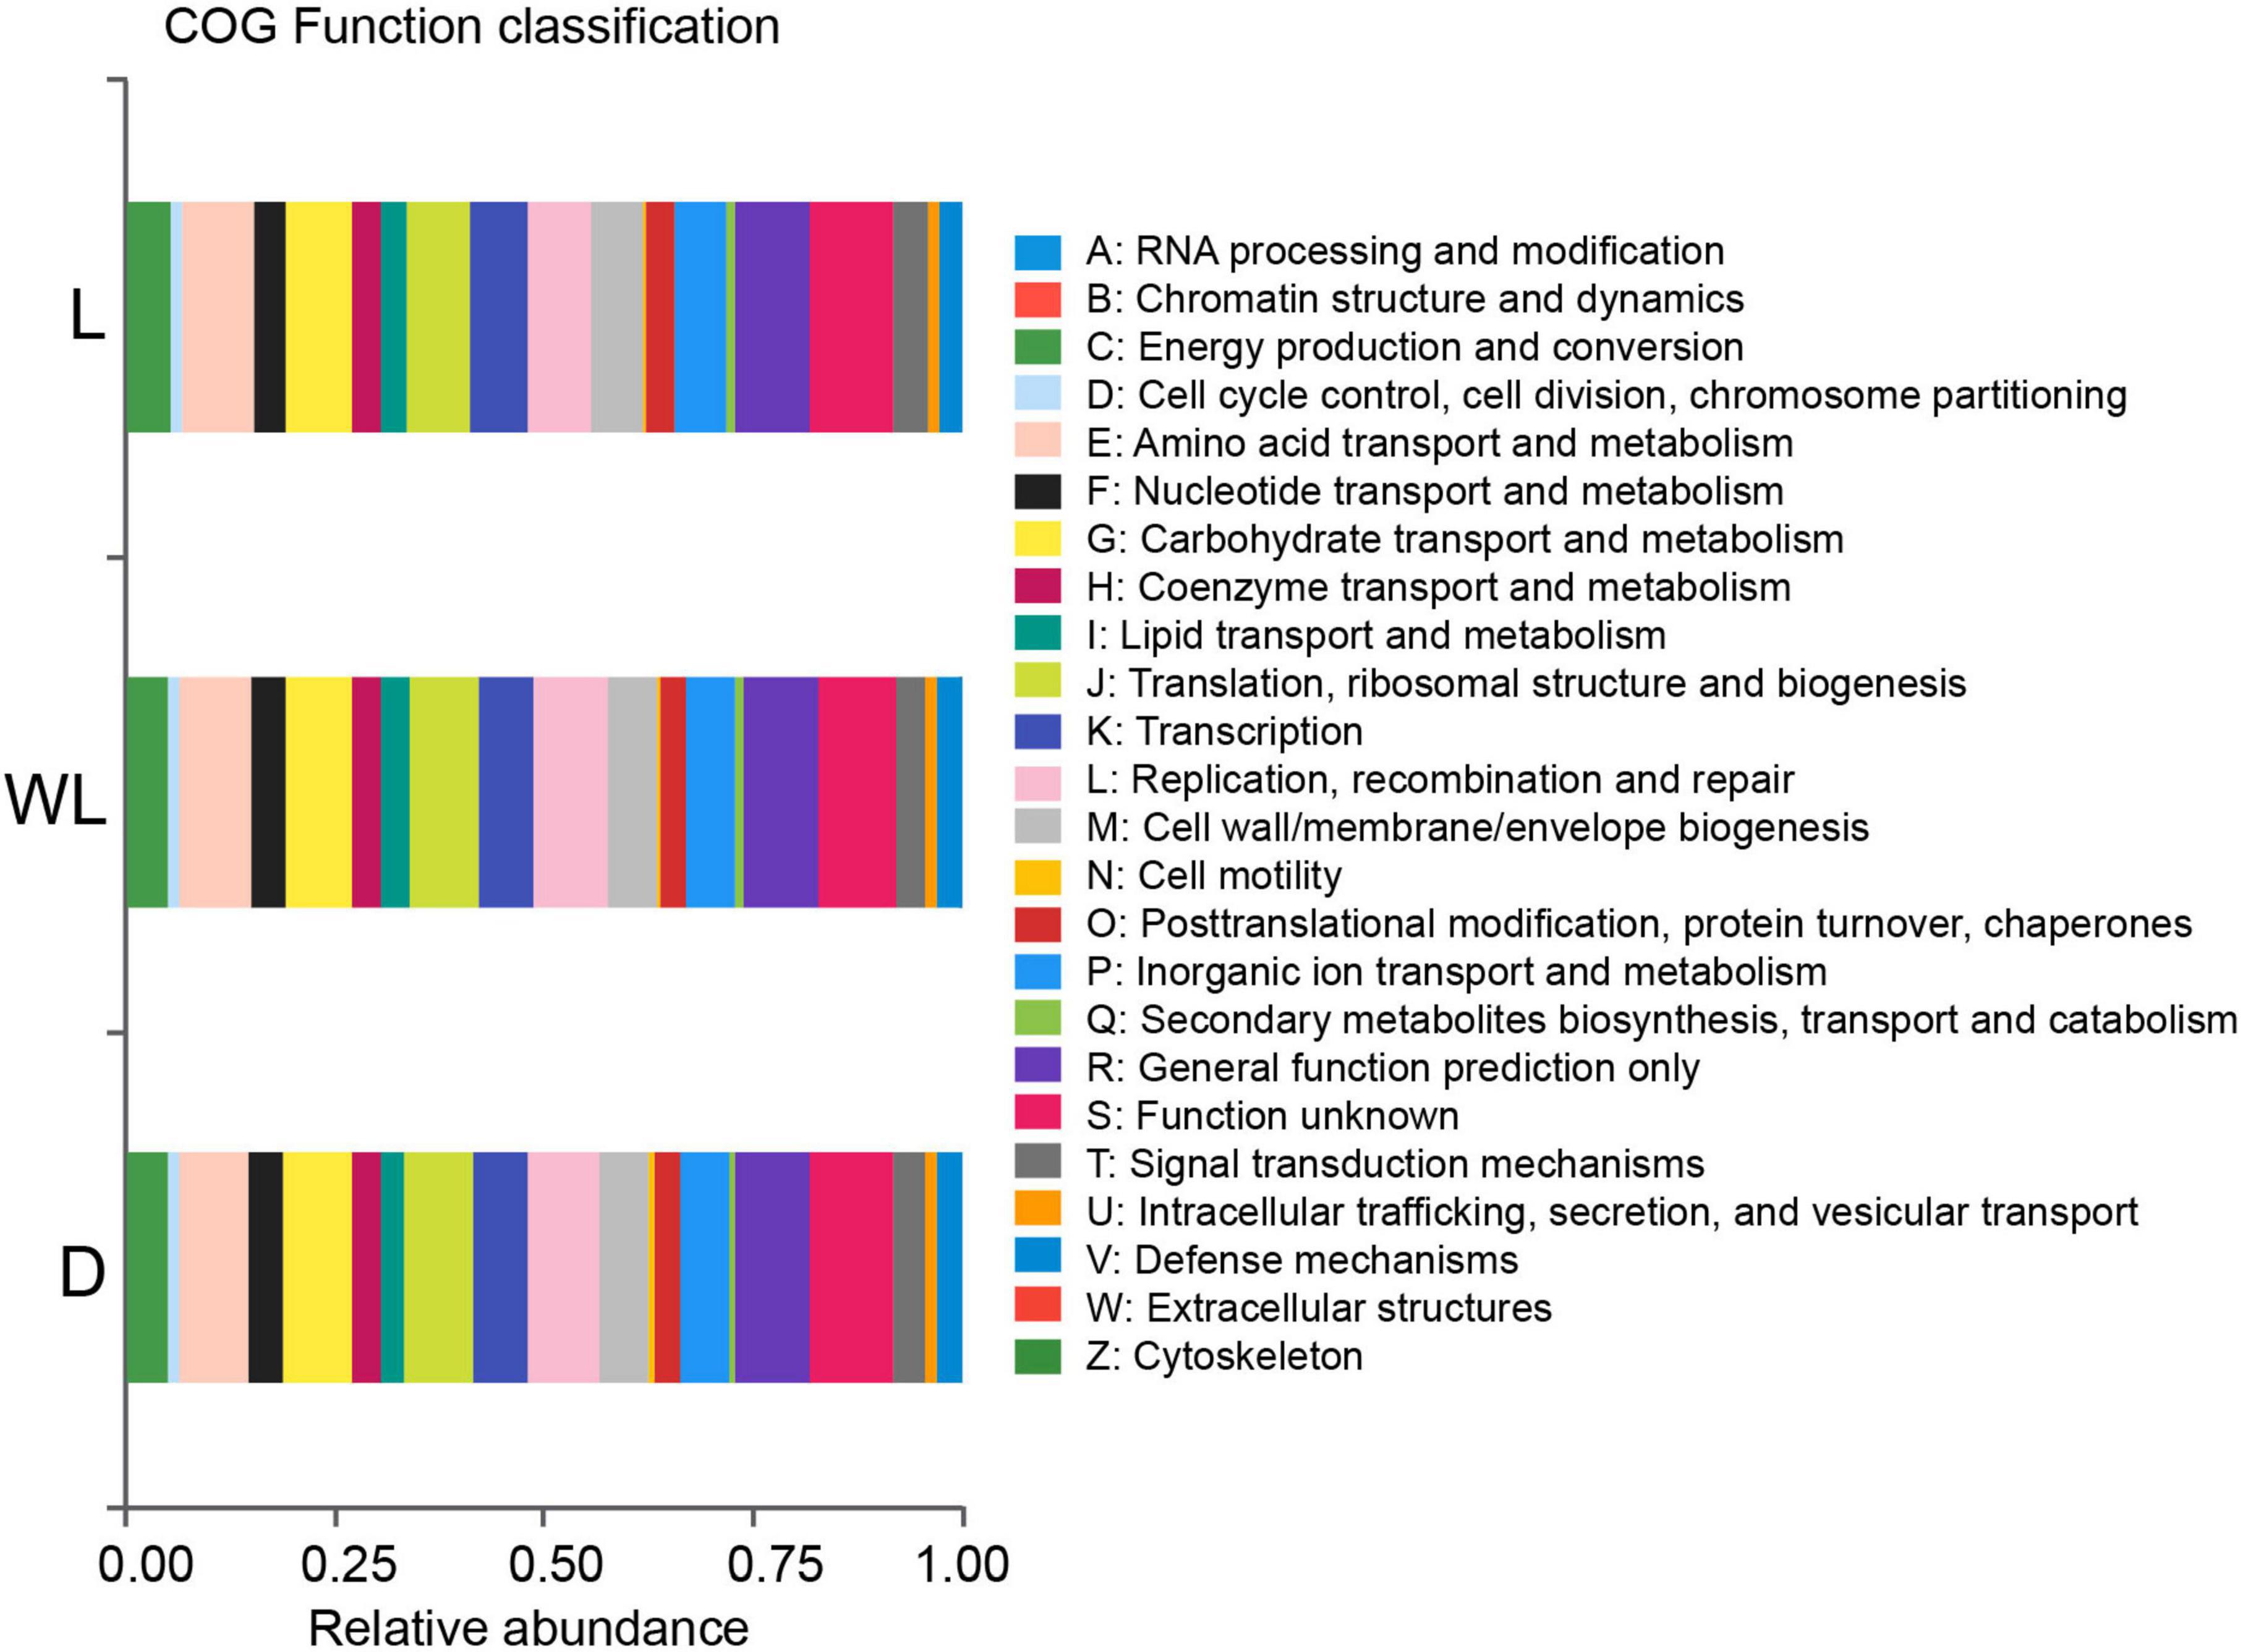
Figure 4. Relative abundance of gut bacterial function classification, inferred from PICRUSt analysis prediction.
At the same time, several pathways involved in methionine biosynthesis, including L-methionine biosynthesis I (Kruskal–Wallis test, df = 2, p = 0.0107) and L-methionine biosynthesis III (Kruskal–Wallis test, df = 2, p = 0.0107) were more abundant in species from the light region than in those from weak light and dark regions (Figure 5A). The titers of amino acid content in the food-storing ingluvies of D. japanica were further investigated. The titers of aspartic acid (Kruskal–Wallis test, df = 2, p = 0.0250) and methionine (Kruskal–Wallis test, df = 2, p = 0.0500) in the species from the light region were lower than in those from weak light and dark regions (Figure 5B). Moreover, the amino acid biosynthesis I (r = −0.8605, p = 0.0061) and III (r = −0.8388, p = 0.0092) pathways of gut bacteria were negatively correlated with the contents of methionine in food.
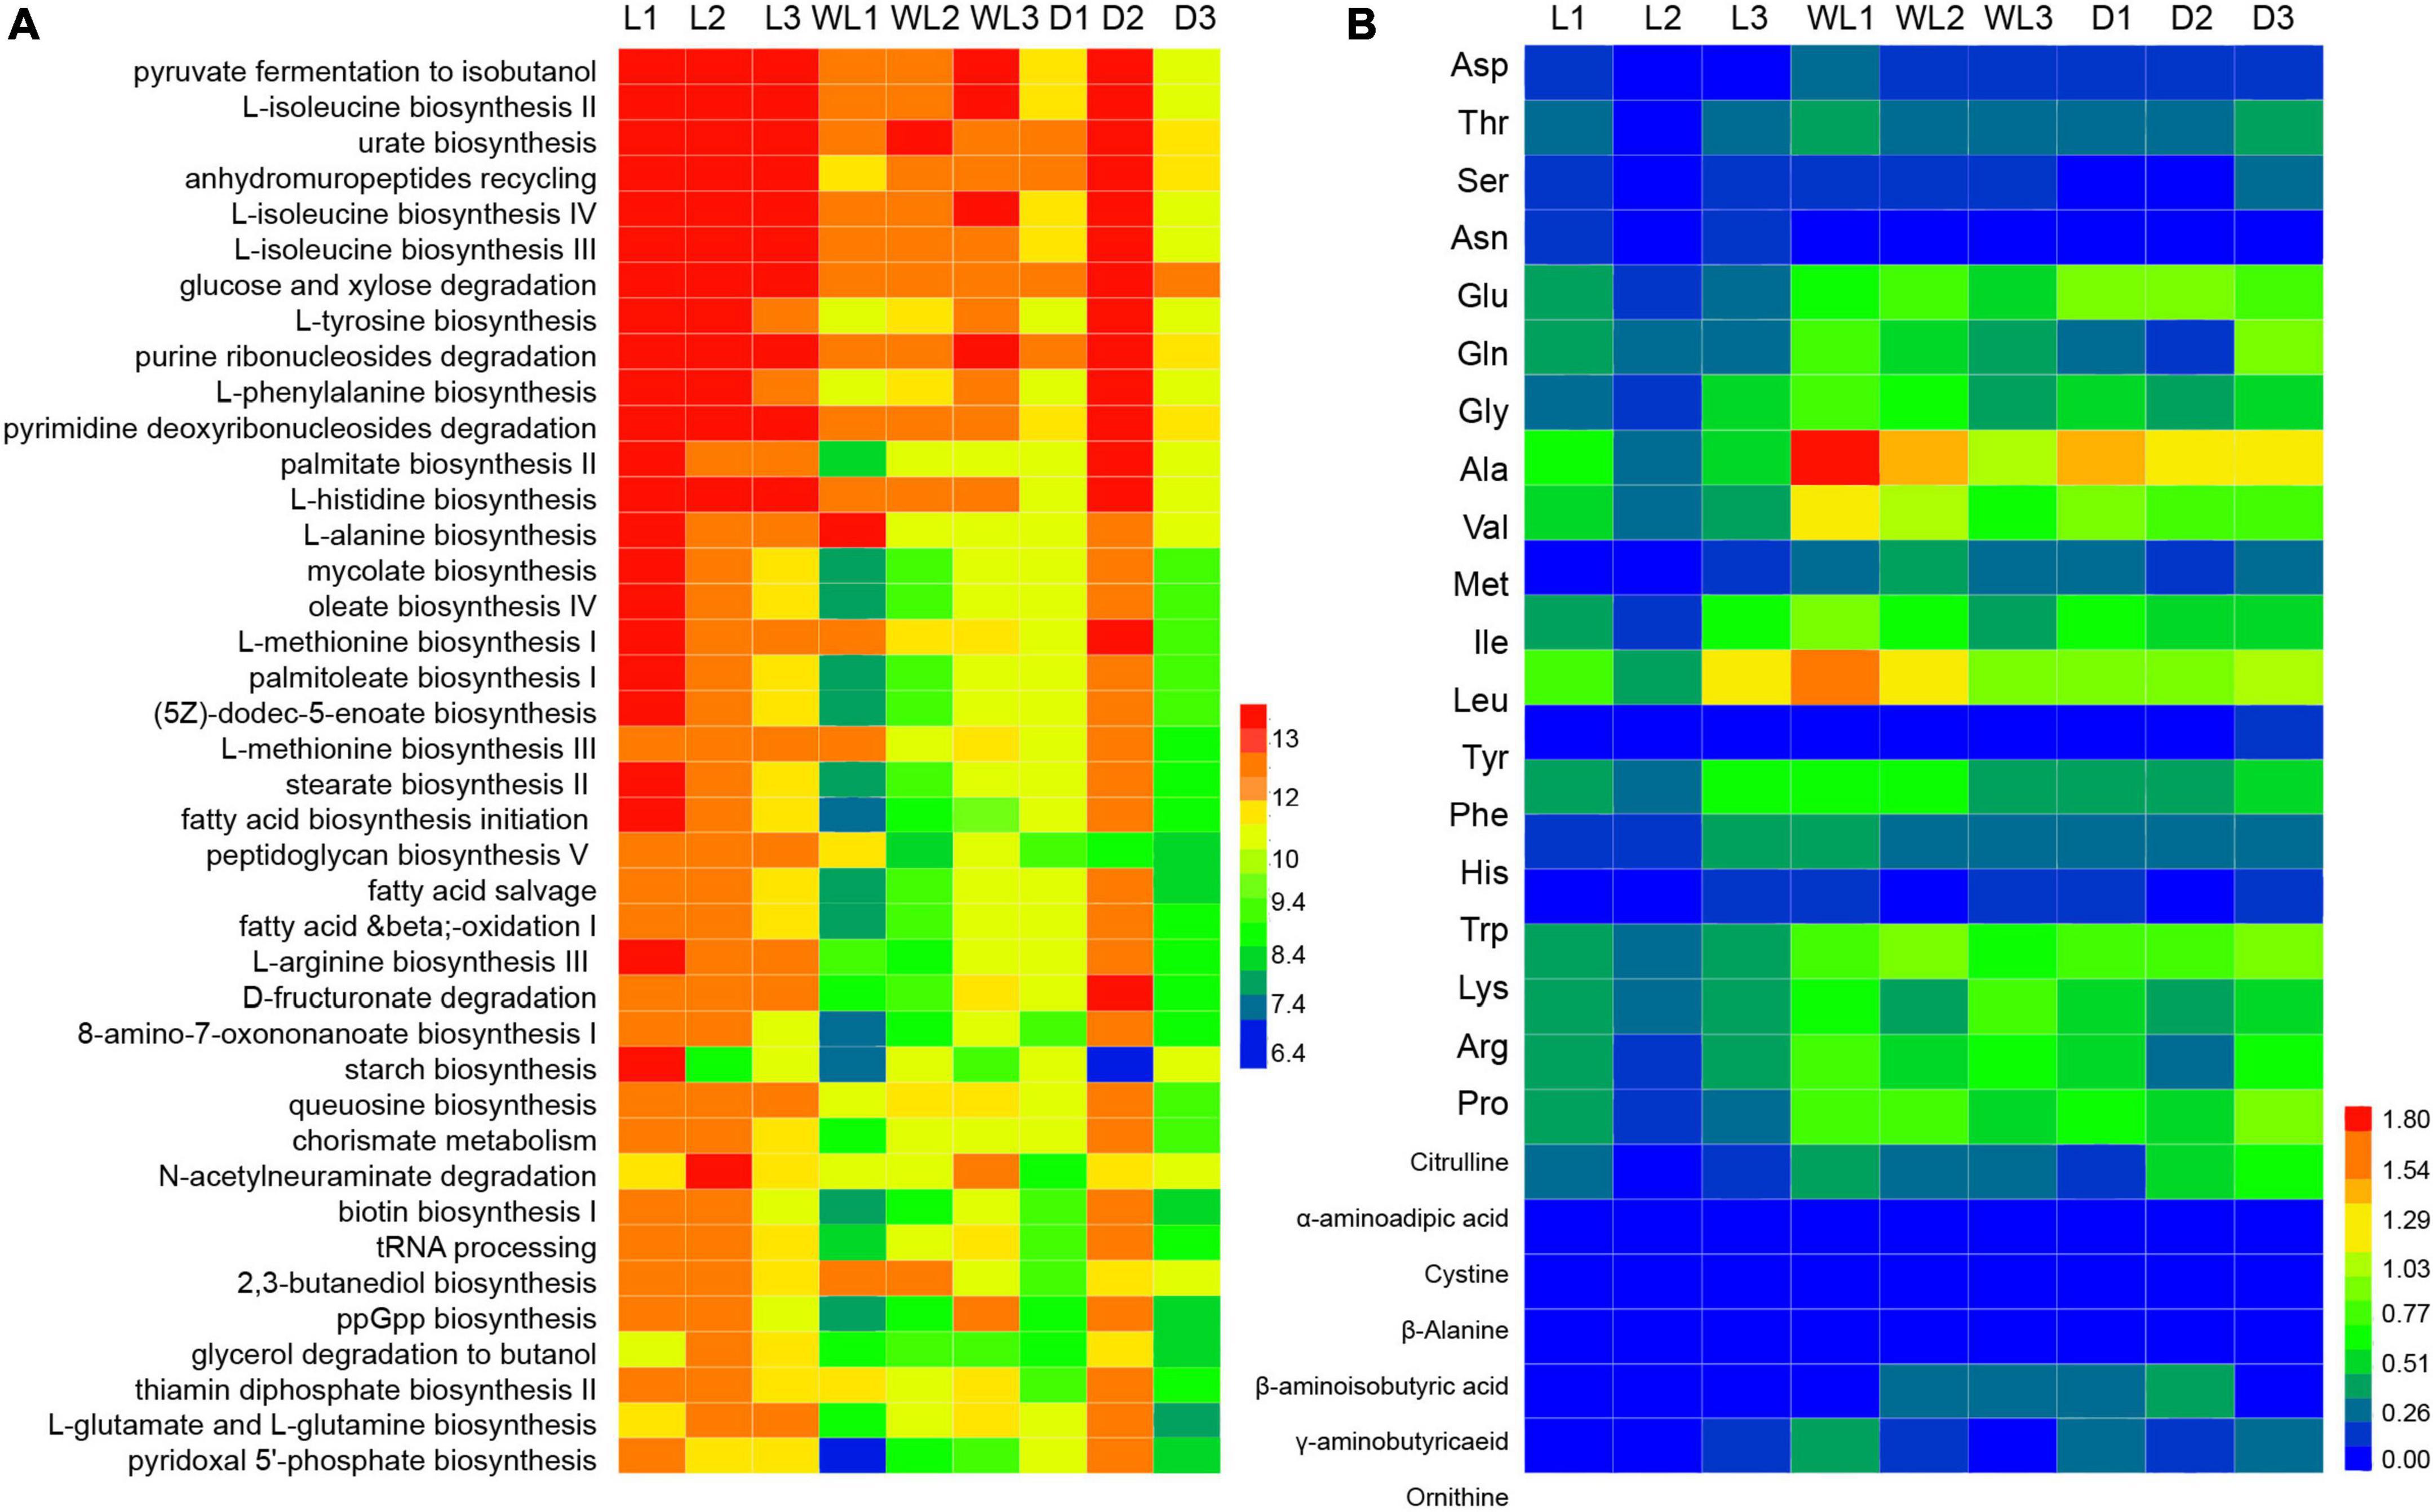
Figure 5. Abundance of metabolism pathway (A) and titer of amino acids (B), the three letter codes represent the different amino acids, following the general amino acid code list, and the color scales indicate the abundances of metabolism pathways and amino acids.
Discussion
Diverse gut bacteria are potentially involved in many physiological processes of insects, which contribute to the adaptation of the host insects to the environment. In this study, the gut bacteria character of D. japanica in karst caves was determined by 16S rRNA gene deep sequencing. The compositions and diversity indices of gut bacteria of D. japanica did not exhibit convergent patterns influenced by light-strength regions in the caves. However, bacterial groups may provide diverse functions to D. japanica in regions of varying light strengths. Moreover, gut bacteria may have roles in the nutritional metabolism processes (amino acids and carbohydrates) and morphological adaptation of D. japanica in karst caves. Altogether, this study facilitates a step forward in understanding the roles of gut bacteria in the adaptation of insects in the nutrient-poor and dark cave environment.
The overall feature of gut bacteria of Diestrammena japanica
In comparison to Drosophila melanogaster (139 OTUs), xylophagous long-horned beetles (average 103 OTUs), Bombyx mori (90 OTUs), and several wild mosquito species (5–71 OTUs) (Chandler et al., 2011; Engel et al., 2012; Chen B. et al., 2018; Zhao et al., 2019), D. japanica harbors more diverse gut bacterial composition. Each D. japanica sample from different light-strength regions was detected with more than 200 OTUs, covering eight bacterial phyla.
Host insects’ diets can affect gut bacteria composition (Colman et al., 2012; Paoletti et al., 2013; Yun et al., 2014). As a type of omnivorous insect with complex food structures, D. japanica has access to different food structures depending on the different light-strength regions. For example, species in the light region consume more moss and fern, whereas those in weak light and dark regions feed on animal carcasses and fungi (Li, 2007). Previous reports have shown a positive correlation between the complexity of diet structures and the diversity of gut bacteria (Zheng et al., 2021). Therefore, it is not unexpected that more numerous bacterial taxa were observed in the gut habitat of D. japanica than other insect taxa previously mentioned since they contribute to the decomposition of diverse food resources.
Generally, Firmicutes and Proteobacteria are the prominent groups of gut bacteria in insects (Yun et al., 2014; Chen et al., 2016; Vilanova et al., 2016; van Schooten et al., 2018). Similar to D. japanica of this study, the gut bacterial communities of Epicauta longicollis, Megetra cancellata, and Bactrocera dorsalis were dominated by Firmicutes (Colman et al., 2012; Andongma et al., 2015). However, in the intestinal habitat of some species, such as Bombyx mori and Chrysoperla sinica, Proteobacteria was the dominating phylum (Chen B. et al., 2018; Zhao et al., 2019). Consistent with an earlier report on the gut bacterial communities of 58 insect taxa (Colman et al., 2012), these results indicated that the predominant phylum of gut bacteria varies across insect taxa.
The morphological adaptation of Diestrammena japanica to the cave environment
To adapt to the cave environment, cave animals are often small in bodily size. There was a strong positive correlation between oxygen concentration and insect body size. For instance, hypoxic insects exhibited smaller (Harrison et al., 2010). The bodily size of D. japanica in the cave regions (weak light and dark regions) was significantly smaller than that in the light regions. In addition, species of D. japanica in the cave consume animal feces (Li, 2007), which implies that more pathogens could be introduced by food resources (Busvine, 1980; Hassan et al., 2021). This is consistent with the high abundance of pathogenic Chlamydiae (Candidatus Rhabdochlamydia porcellionis) in gut bacteria of D. japanica in the dark regions (Busvine, 1980; Hassan et al., 2021), which could damage the digestive system of host insect (Kostanjsek and Pirc Marolt, 2015). Thus, we inferred that the small bodily size of D. japanica is relevant to the pathogen presence and lower oxygen concentration inside the cave.
The contribution of gut bacteria to cave adaptation of Diestrammena japanica
Firmicutes were the prominent group of gut bacteria of D. japanica, and they may play a significant role in the food digestion and energy metabolism of hosts (Chen et al., 2016), for instance, Clostridia thermocellum and C. ljungdahlii can degrade the cellulose and hemicellulose (Fonknechten et al., 2010). Enterococcus has the ability to mediate the pH of the gut environment, thereby enhancing the host’o resistance to toxins from foods (Wilson and Benoit, 1993; Xia et al., 2018). Lactobacillus amylovorus and L. oligofermentans were prevalent in our results, with the former exhibiting proteolytic activity and lactose metabolic capacity, producing lactate and carbohydrate assimilation (Mok et al., 2002; Hynönen et al., 2014; Cardarelli et al., 2016), and the latter engaging in the fermentation of xylose, ribose, and hexose (Andreevskaya et al., 2016). Thus, we have reason to believe that a high abundance of Firmicutes in gut bacteria probably supplies D. japanica with nutrition substrates via involvement in the energy-absorbing processes.
Insects have lost the capacity to independently synthesize essential amino acids throughout their evolutionary history, implying that they rely on gut bacteria or diet to apply these amino acids and nutrients (McCutcheon et al., 2009; Luan et al., 2015). For instance, the artificial diet treatment showed that Anoplophora glabripennis (Coleoptera: Cerambycidae) larvae rely on gut bacteria for essential amino acids (Ayayee et al., 2016). Duplais et al. demonstrated that gut bacteria are involved in the cuticular formation of turtle ants Duplais et al. (2021). In this case, the PICRUSt analysis uncovered that gut bacteria of D. japanica have the ability to involve in various amino acid biosynthesis and nutritional functions. Generally, compared to herbivorous insects, omnivorous D. japanica consume moss, animal carcasses, and fungus (Li, 2007), suggesting that they need a more diverse gut microbiota to decompose foods (Yun et al., 2014; Salcedo-Porras et al., 2020).
Moreover, in gut bacterial communities of species from cave habitats (weak light and dark regions), higher values of connectance and average degree but lower values of modularity represented that each group had more links with other species and fewer subgroups than those in light regions (Wood et al., 2017). This is also supported by the abundance of positive links in the gut bacterial community of D. japanica, exhibiting lots of cooperative interactions and lower efficiency of substrate transportation. Gut bacteria with a low abundance of amino acid biosynthesis pathways and more residual amino acids in the ingluvies of D. japanica indicated that species in cave habitats tend to have lower metabolism rates in cave habitats than in light regions. To reduce the rate of energy consumption, insects show activity, and mobility tends to be lower in cave environments than outside caves (Howarth and Moldovan, 2018), which is an adaptation of insects to the cave habitats where food and nitrogen are oligotrophic (Barton and Jurado, 2007; White and Culver, 2011).
This research aggregated 15 individual guts from each light region of each cave as a sample, which has the potential to decrease the number of species in the community with skewed compositions and to boost the convergence of patterns in bacterial compositions and network structures. Compared to the metagenomic data of bacterial communities, the 16S rRNA gene data can provide a biased similarity of bacterial communities among samples (Ellegaard et al., 2020). In addition, the identical environment acting as a filter factor can result in a convergent co-occurrence network pattern (Freilich et al., 2018). Thus, microbiome analysis with more replicates would provide more clear patterns for functional predictions of gut bacteria in insect adaptations to cave environments. In addition, more than 40% of gut bacteria may be involved in the nutrient transport and transformation, lipid metabolism, energy metabolism, and amino acid transport processes of D. japanica, uncovered by PICRUSt analysis. It is worth noting that these data do not indicate that the gut microbes associated with D. japanica do, indeed, perform various important metabolic processes, which would require further experimental studies to be demonstrated. Nevertheless, the characteristics of the gut bacterial community of D. japanica revealed in this study provide a basis for exploring the roles of gut bacteria in adapting hosts to caves.
Data availability statement
The datasets presented in this study can be found in online repositories. The names of the repository/repositories and accession number(s) can be found below: https://doi.org/10.6084/m9.figshare.20522079.v1.
Author contributions
YD and QC: conceptualization, data curation, and writing the original draft. ZF: visualization and investigation. QWu: formal analysis and validation. LX and XN: data curation and software. QL: methodology and visualization. LT: conceptualization and reviewing. QWe: reviewing, supervising, and funding acquisition. All authors contributed to the article and approved the submitted version.
Funding
This work was supported by the Joint Fund of the National Natural Science Foundation of China and the Karst Science Research Center of Guizhou Province (U1812401), as well as the Provincial Program on Platform and Talent Development of the Department of Science and Technology of Guizhou China (Grant Nos. [2019]5617 [2019]5655 and [2017]5726-21).
Conflict of interest
The authors declare that the research was conducted in the absence of any commercial or financial relationships that could be construed as a potential conflict of interest.
Publisher’s note
All claims expressed in this article are solely those of the authors and do not necessarily represent those of their affiliated organizations, or those of the publisher, the editors and the reviewers. Any product that may be evaluated in this article, or claim that may be made by its manufacturer, is not guaranteed or endorsed by the publisher.
Supplementary material
The Supplementary Material for this article can be found online at: https://www.frontiersin.org/articles/10.3389/fmicb.2022.1016608/full#supplementary-material
Supplementary Table 1 | Detail information of sample location.
Supplementary Table 2 | Statistical information of 16S rRNA gene deep sequencing.
Supplementary Table 3 | OTUs table based on 97% sequence similarity.
Supplementary Table 4 | The pairwise Wilcox test of alpha diversity indexes of the gut bacterial community.
Supplementary Table 5 | Summary table for the PERMANOVA testing of bacterial compositions in three light-strength regions.
Footnotes
References
Andongma, A. A., Wan, L., Dong, Y. C., Desneux, N., White, J. A., and Niu, C. Y. (2015). Pyrosequencing reveals a shift in symbiotic bacteria populations across life stages of Bactrocera dorsalis. Sci. Rep. 5:9470. doi: 10.1038/srep09470
Andreevskaya, M., Johansson, P., Jaaskelainen, E., Ramo, T., Ritari, J., Paulin, L., et al. (2016). Lactobacillus oligofermentans glucose, ribose and xylose transcriptomes show higher similarity between glucose and xylose catabolism-induced responses in the early exponential growth phase. BMC Genomics 17:539. doi: 10.1186/s12864-016-2840-x
Ayayee, P. A., Larsen, T., Rosa, C., Felton, G. W., Ferry, J. G., and Hoover, K. (2016). Essential amino acid supplementation by gut microbes of a wood-feeding cerambycid. Environ. Entomol. 45, 66–73. doi: 10.1093/ee/nvv153
Barton, H. A., and Jurado, V. (2007). What’s up down there? Microbial diversity in caves. Microbiome 2, 132–138.
Busvine, J. R. (1980). Insects and hygiene. New York, NY: Springer, 1–20. doi: 10.1007/978-1-4899-3198-6_1
Bystriakova, N., Alves De Melo, P. H., Moat, J., Lughadha, E. N., and Monro, A. K. (2019). A preliminary evaluation of the karst flora of Brazil using collections data. Sci. Rep. 9:17037. doi: 10.1038/s41598-019-53104-6
Caporaso, J. G., Kuczynski, J., Stombaugh, J., Bittinger, K., Bushman, F. D., Costello, E. K., et al. (2010). QIIME allows analysis of high-throughput community sequencing data. Nat. Methods 7, 335–336. doi: 10.1038/nmeth.f.303
Cardarelli, H. R., Martinez, R. C., Albrecht, S., Schols, H., Franco, B. D., Saad, S. M., et al. (2016). In vitro fermentation of prebiotic carbohydrates by intestinal microbiota in the presence of Lactobacillus amylovorus DSM 16998. Benef. Microbes 7, 119–133. doi: 10.3920/BM2014.0151
Chandler, J. A., Morgan Lang, J., Bhatnagar, S., Eisen, J. A., and Kopp, A. (2011). Bacterial communities of diverse Drosophila species: Ecological context of a host-microbe model system. PLoS Genet. 7:e1002272. doi: 10.1371/journal.pgen.1002272
Chen, B., Teh, B.-S., Sun, C., Hu, S., Lu, X., Boland, W., et al. (2016). Biodiversity and activity of the gut microbiota across the life history of the insect herbivore Spodoptera littoralis. Sci. Rep. 6:29505. doi: 10.1038/srep29505
Chen, B., Du, K. Q., Sun, C., Vimalanathan, A., Liang, X. L., Li, Y., et al. (2018). Gut bacterial and fungal communities of the domesticated silkworm (Bombyx mori) and wild mulberry-feeding relatives. ISME J. 12, 2252–2262. doi: 10.1038/s41396-018-0174-1
Chen, H., and Boutros, P. C. (2011). VennDiagram: A package for the generation of highly-customizable Venn and Euler diagrams in R. BMC Bioinformatics 12:35. doi: 10.1186/1471-2105-12-35
Chen, S., Zhou, Y., Chen, Y., and Gu, J. (2018). fastp: An ultra-fast all-in-one FASTQ preprocessor. Bioinformatics 34, i884–i890. doi: 10.1093/bioinformatics/bty560
Colman, D. R., Toolson, E. C., and Takacs-Vesbach, C. D. (2012). Do diet and taxonomy influence insect gut bacterial communities? Mol. Ecol. 21, 5124–5137. doi: 10.1111/j.1365-294X.2012.05752.x
Csardi, G., and Nepusz, T. (2006). The igraph software package for complex network research. InterJournal Complex Syst. 1695, 1–9.
Culver, D. C., and Pipan, T. (2019). The biology of caves and other subterranean habitats. Oxford: Oxford University Press. doi: 10.1093/oso/9780198820765.001.0001
de Mendiburu, F. (2014). Agricolae: Statistical procedures for agricultural research. R package version, 2021.1.3-5. Available Online at: http://CRAN.R-project.org/package=agricolae
DeSantis, T. Z., Hugenholtz, P., Larsen, N., Rojas, M., Brodie, E. L., Keller, K., et al. (2006). Greengenes, a chimera-checked 16S rRNA gene database and workbench compatible with ARB. Appl. Environ. Microbiol. 72, 5069–5072. doi: 10.1128/AEM.03006-05
Dormann, C. F., Gruber, B., and Fründ, J. (2008). Introducing the bipartite package: Analysing ecological networks. R News 8, 8–11.
Douglas, A. E. (2009). The microbial dimension in insect nutritional ecology. Funct. Ecol. 23, 38–47. doi: 10.1371/journal.pone.0170332
Douglas, A. E. (2011). Lessons from studying insect symbioses. Cell Host Microbe 10, 359–367. doi: 10.1016/j.chom.2011.09.001
Douglas, A. E. (2015). “Multiorganismal insects: Diversity and function of resident microorganisms,” in Annual review of entomology, Vol. 60, ed. M. R. Berenbaum (Palo Alto, CA: Annual Reviews), 17–34. doi: 10.1146/annurev-ento-010814-020822
Duplais, C., Sarou-Kanian, V., Massiot, D., Hassan, A., Perrone, B., Estevez, Y., et al. (2021). Gut bacteria are essential for normal cuticle development in herbivorous turtle ants. Nat. Commun. 12:676. doi: 10.1038/s41467-021-21065-y
Edgar, R. C. (2013). UPARSE: Highly accurate OTU sequences from microbial amplicon reads. Nat. Methods 10, 996–998. doi: 10.1038/nmeth.2604
Ellegaard, K. M., Suenami, S., Miyazaki, R., and Engel, P. (2020). Vast differences in strain-level diversity in the gut microbiota of two closely related honey bee species. Curr. Biol. 30, 2520–2531. doi: 10.1016/j.cub.2020.04.070
Engel, P., Martinson, V. G., and Moran, N. A. (2012). Functional diversity within the simple gut microbiota of the honey bee. Proc. Natl. Acad. Sci. U.S.A. 109, 11002–11007. doi: 10.1073/pnas.1202970109
Engel, P., and Moran, N. A. (2013). Functional and evolutionary insights into the simple yet specific gut microbiota of the honey bee from metagenomic analysis. Gut Microbes 4, 60–65. doi: 10.4161/gmic.22517
Fonknechten, N., Chaussonnerie, S., Tricot, S., Lajus, A., Andreesen, J. R., Perchat, N., et al. (2010). Clostridium sticklandii, a specialist in amino acid degradation: Revisiting its metabolism through its genome sequence. BMC Genomics 11:555. doi: 10.1186/1471-2164-11-555
Freilich, M. A., Wieters, E., Broitman, B. R., Marquet, P. A., and Navarrete, S. A. (2018). Species co-occurrence networks: Can they reveal trophic and non-trophic interactions in ecological communities? Ecology 99, 690–699. doi: 10.1002/ecy.2142
Ginestet, C. (2011). ggplot2: Elegant graphics for data analysis. J. R. Stat. Soc. Ser. A Stat. Soc. 174, 245–246. doi: 10.1111/j.1467-985X.2010.00676_9.x
Handcock, M. S., Hunter, D. R., Butts, C. T., Goodreau, S. M., and Morris, M. (2008). statnet: Software tools for the representation, visualization, analysis and simulation of network data. J. Stat. Softw. 24, 1548–7660. doi: 10.18637/jss.v024.i01
Harrison, J. F., Kaiser, A., and VandenBrooks, J. M. (2010). Atmospheric oxygen level and the evolution of insect body size. Proc. R. Soc. B Biol. Sci. 277, 1937–1946. doi: 10.1098/rspb.2010.0001
Hassan, A., Uyigue, P., Akinleye, A., and Oyeromi, O. (2021). The role of common housefly as a mechanical vector of pathogenic microorganisms. Achievers J. Sci. Res. 3, 261–269. doi: 10.3390/microorganisms9112185
Howarth, F. G., and Moldovan, O. T. (2018). “The ecological classification of cave animals and their adaptations,” in Cave ecology. Ecological studies, Vol. 235, eds O. Moldovan, L’ Kováč, and S. Halse (Cham: Springer), 41–67. doi: 10.1007/978-3-319-98852-8_4
Hynönen, U., Kant, R., Lähteinen, T., Pietilä, T. E., Beganović, J., Smidt, H., et al. (2014). Functional characterization of probiotic surface layer protein-carrying Lactobacillus amylovorus strains. BMC Microbiol. 14:199. doi: 10.1186/1471-2180-14-199
Kostanjsek, R., and Pirc Marolt, T. (2015). Pathogenesis, tissue distribution and host response to Rhabdochlamydia porcellionis infection in rough woodlouse Porcellio scaber. J. Invertebr. Pathol. 125, 56–67. doi: 10.1016/j.jip.2015.01.001
Langille, M. G., Zaneveld, J., Caporaso, J. G., McDonald, D., Knights, D., Reyes, J. A., et al. (2013). Predictive functional profiling of microbial communities using 16S rRNA marker gene sequences. Nat. Biotechnol. 31, 814–821. doi: 10.1038/nbt.2676
Lavoie, K. H., Helf, K. L., and Poulson, T. L. (2007). The biology and ecology of North American cave crickets. J. Cave Karst Stud. 69, 114–134.
Li, D. (2007). Correlation between the animal community structure and environmental factors in Jialiang and Boduo caves of Guizhou Province, China. Acta Ecol. Sin. 27, 2167–2176.
Li, D., Rong, L., and Hu, C. (2001). Study on the animal communities in Dadongkou Cave, Guizhou Province. Acta Ecol. Sin. 21, 126–130.
Li, D. H. (2006). Correlation between the animal community structure and environmental factors in Dongbei Cave and Shuijiang Cave of Guizhou Province. Zool. Res. 27, 481–488.
Luan, J. B., Chen, W., Hasegawa, D. K., Simmons, A. M., Wintermantel, W. M., Ling, K. S., et al. (2015). Metabolic coevolution in the bacterial symbiosis of whiteflies and related plant sap-feeding insects. Genome Biol. Evol. 7, 2635–2647. doi: 10.1093/gbe/evv170
Luo, Z., Tang, S., Jiang, Z., Chen, J., Fang, H., and Li, C. (2016). Conservation of terrestrial vertebrates in a global hotspot of karst area in Southwestern China. Sci. Rep. 6:25717. doi: 10.1038/srep25717
Magoc, T., and Salzberg, S. L. (2011). FLASH: Fast length adjustment of short reads to improve genome assemblies. Bioinformatics 27, 2957–2963. doi: 10.1093/bioinformatics/btr507
McCutcheon, J. P., McDonald, B. R., and Moran, N. A. (2009). Convergent evolution of metabolic roles in bacterial co-symbionts of insects. Proc. Natl. Acad. Sci. U.S.A. 106, 15394–15399. doi: 10.1073/pnas.0906424106
Mok, J. S., Song, K. C., Kim, Y. M., and Chang, D. S. (2002). Cultural characteristics of Lactobacillus amylovorus IMC-1 producing antibacterial substance. Korean J. Food Sci. Technol. 34, 249–254.
Oksanen, J., Blanchet, F. G., Kindt, R., Legendre, P., Minchin, P. R., O’hara, R. B., et al. (2013). Package ‘vegan’. Community ecology package, version, 2, 1–295.
Paoletti, M. G., Mazzon, L., Martinez-Sañudo, I., Simonato, M., Beggio, M., Dreon, A. L., et al. (2013). A unique midgut-associated bacterial community hosted by the cave beetle Cansiliella servadeii (Coleoptera: Leptodirini) reveals parallel phylogenetic divergences from universal gut-specific ancestors. BMC Microbiol. 13:129. doi: 10.1186/1471-2180-13-129
Quast, C., Pruesse, E., Yilmaz, P., Gerken, J., Schweer, T., Yarza, P., et al. (2013). The SILVA ribosomal RNA gene database project: Improved data processing and web-based tools. Nucleic Acids Res. 41, D590–D596. doi: 10.1093/nar/gks1219
R Development Core Team (2018). R: A language and environment for statistical computing. Vienna: R foundation for statistical computing.
Salcedo-Porras, N., Umaña-Diaz, C., de Oliveira Barbosa Bitencourt, R., and Lowenberger, C. (2020). The role of bacterial symbionts in triatomines: An evolutionary perspective. Microorganisms 8:1438. doi: 10.3390/microorganisms8091438
Schloss, P. D. (2020). Reintroducing mothur: 10 years later. Appl. Environ. Microbiol. 86:e02343-19. doi: 10.1128/AEM.02343-19
Schloss, P. D., Westcott, S. L., Ryabin, T., Hall, J. R., Hartmann, M., Hollister, E. B., et al. (2009). Introducing mothur: Open-source, platform-independent, community-supported software for describing and comparing microbial communities. Appl. Environ. Microbiol. 75, 7537–7541. doi: 10.1128/AEM.01541-09
van Schooten, B., Godoy-Vitorino, F., McMillan, W. O., and Papa, R. (2018). Conserved microbiota among young Heliconius butterfly species. PeerJ 6:e5502. doi: 10.7717/peerj.5502
Vilanova, C., Baixeras, J., Latorre, A., and Porcar, M. (2016). The generalist inside the specialist: Gut bacterial communities of two insect species feeding on toxic plants are dominated by Enterococcus sp. Front. Microbiol. 7:1005. doi: 10.3389/fmicb.2016.01005
Wilson, G. R., and Benoit, T. G. (1993). Alkaline pH activates Bacillus thuringiensis spores. J. Invertebr. Pathol. 62, 87–89. doi: 10.1006/jipa.1993.1079
Wood, S. A., Gilbert, J. A., Leff, J. W., Fierer, N., D’Angelo, H., Bateman, C., et al. (2017). Consequences of tropical forest conversion to oil palm on soil bacterial community and network structure. Soil Biol. Biochem. 112, 258–268. doi: 10.1016/j.soilbio.2017.05.019
Xia, X., Sun, B., Gurr, G. M., Vasseur, L., Xue, M., and You, M. (2018). Gut microbiota mediate insecticide resistance in the diamondback moth, Plutella xylostella (L.). Front. Microbiol. 9:25. doi: 10.3389/fmicb.2018.00025
Xu, C., Li, D., and Me, J. (2010). Heavy metal content in animal body and its relations with soil and water in the Zhengjia small cave, Guizhou Province. Carsologica Sin. 29, 48–54.
Xu, S., Li, Z., Tang, W., Dai, Z., Zhou, L., Feng, T., et al. (2022). MicrobiotaProcess: A comprehensive R package for managing and analyzing microbiome and other ecological data within the tidy framework. Durham, NC: Research Square. doi: 10.21203/rs.3.rs-1284357/v1
Ye, Z. T., and Li, D. H. (2011). Research on enrichment of five heavy metals in cave animals from Tunshang cave of Guizhou. Sichuan J. Zool. 3, 372–376.
Yun, J.-H., Roh, S. W., Whon, T. W., Jung, M.-J., Kim, M.-S., Park, D.-S., et al. (2014). Insect gut bacterial diversity determined by environmental habitat, diet, developmental stage, and phylogeny of host. Appl. Environ. Microbiol. 80, 5254–5264. doi: 10.1128/AEM.01226-14
Zhao, C. C., Zhao, H., Zhang, S., Luo, J. Y., Zhu, X. Z., Wang, L., et al. (2019). The developmental stage symbionts of the pea aphid-feeding Chrysoperla sinica (Tjeder). Front. Microbiol. 10:2454. doi: 10.3389/fmicb.2019.02454
Keywords: insect, gut microbiota, adaptation, cave, 16S rRNA gene sequencing, light strength, amino acid metabolism
Citation: Dong Y, Chen Q, Fang Z, Wu Q, Xiang L, Niu X, Liu Q, Tan L and Weng Q (2022) Gut bacteria reflect the adaptation of Diestrammena japanica (Orthoptera: Rhaphidophoridae) to the cave. Front. Microbiol. 13:1016608. doi: 10.3389/fmicb.2022.1016608
Received: 11 August 2022; Accepted: 18 November 2022;
Published: 21 December 2022.
Edited by:
Cesareo Saiz-Jimenez, Institute of Natural Resources and Agrobiology of Seville (CSIC), SpainReviewed by:
Junaid Ali Siddiqui, South China Agricultural University, ChinaMassimiliano Virgilio, Royal Museum for Central Africa, Belgium
Wouter Hendrycks, University of Antwerp, Belgium, in collaboration with reviewer MV
Copyright © 2022 Dong, Chen, Fang, Wu, Xiang, Niu, Liu, Tan and Weng. This is an open-access article distributed under the terms of the Creative Commons Attribution License (CC BY). The use, distribution or reproduction in other forums is permitted, provided the original author(s) and the copyright owner(s) are credited and that the original publication in this journal is cited, in accordance with accepted academic practice. No use, distribution or reproduction is permitted which does not comply with these terms.
*Correspondence: Qingbei Weng, d2VuZ3FpbmdiZWlAZ3pudS5lZHUuY24=
†These authors have contributed equally to this work