 Yu-Hang Zhang1,2†
 Wei Guo3†
 Tao Zeng4†
 ShiQi Zhang5
 Lei Chen6
 Margarita Gamarra7
 Romany F. Mansour8José Escorcia-Gutierrez9*
 Tao Huang4,10*
 Yu-Dong Cai1*
- 1School of Life Sciences, Shanghai University, Shanghai, China
- 2Channing Division of Network Medicine, Brigham and Women’s Hospital, Harvard Medical School, Boston, MA, United States
- 3Key Laboratory of Stem Cell Biology, Shanghai Institutes for Biological Sciences, Chinese Academy of Sciences (CAS) and Shanghai Jiao Tong University School of Medicine, Shanghai, China
- 4Bio-Med Big Data Center, CAS Key Laboratory of Computational Biology, Shanghai Institute of Nutrition and Health, University of Chinese Academy of Sciences, Chinese Academy of Sciences, Shanghai, China
- 5Department of Biostatistics, University of Copenhagen, Copenhagen, Denmark
- 6College of Information Engineering, Shanghai Maritime University, Shanghai, China
- 7Department of Computational Science and Electronic, Universidad de la Costa, CUC, Barranquilla, Colombia
- 8Department of Mathematics, Faculty of Science, New Valley University, El-Kharga, Egypt
- 9Electronic and Telecommunications Engineering Program, Universidad Autónoma del Caribe, Barranquilla, Colombia
- 10CAS Key Laboratory of Tissue Microenvironment and Tumor, Shanghai Institute of Nutrition and Health, University of Chinese Academy of Sciences, Chinese Academy of Sciences, Shanghai, China
Type 2 diabetes (T2D) is a systematic chronic metabolic condition with abnormal sugar metabolism dysfunction, and its complications are the most harmful to human beings and may be life-threatening after long-term durations. Considering the high incidence and severity at late stage, researchers have been focusing on the identification of specific biomarkers and potential drug targets for T2D at the genomic, epigenomic, and transcriptomic levels. Microbes participate in the pathogenesis of multiple metabolic diseases including diabetes. However, the related studies are still non-systematic and lack the functional exploration on identified microbes. To fill this gap between gut microbiome and diabetes study, we first introduced eggNOG database and KEGG ORTHOLOGY (KO) database for orthologous (protein/gene) annotation of microbiota. Two datasets with these annotations were employed, which were analyzed by multiple machine-learning models for identifying significant microbiota biomarkers of T2D. The powerful feature selection method, Max-Relevance and Min-Redundancy (mRMR), was first applied to the datasets, resulting in a feature list for each dataset. Then, the list was fed into the incremental feature selection (IFS), incorporating support vector machine (SVM) as the classification algorithm, to extract essential annotations and build efficient classifiers. This study not only revealed potential pathological factors for diabetes at the microbiome level but also provided us new candidates for drug development against diabetes.
Introduction
Type 2 diabetes (T2D) is a systematic chronic metabolic condition with abnormal sugar metabolism dysfunction (Chatterjee et al., 2017; Zheng et al., 2018). Glucose, as an essential sugar subtype for human beings, is abnormally metabolized during T2D (Zheng et al., 2018), failing to properly transform or be stored in cells but accumulating in the circulatory system. Insulin resistance has been summarized as the general pathological cause for T2D in early studies (Goldstein, 2002; Kahn et al., 2006). However, the major concerns of T2D are not restricted to a disabled sugar storage capacity or an extremely-up-regulated blood sugar level. The complications of T2D are the most harmful to human beings and may be life-threatening after long-term durations (Schlienger, 2013). With an extremely high blood sugar, multiple diseases, including stroke and high blood pressure as blood vessel diseases (Sanahuja et al., 2016), abnormal pains and tingling as nerve dysfunctions (Yan et al., 2020), kidney damage (Bakris et al., 2020), and vision loss (Li et al., 2019), have been confirmed to be tightly correlated with long-term diabetes.
Type 2 diabetes is a common disease. According to the recent updated data, more than 27 million Americans and more than 400 million people all over the world suffered from diabetes (Bullard et al., 2018; Deputy et al., 2018). As a long-term disease, patients with pre-diabetes or early-stage diabetes may lack symptoms. One-third of all adult Americans are assumed to be in pre-diabetes status (Arthur et al., 2017). Considering the high incidence and severity at late stage, researchers have been focusing on the identification of specific biomarkers and potential drug targets for T2D. Biomarkers of diabetes at the genomic, epigenomic, and transcriptomic levels have been systematically studied (Zou et al., 2018), and multiple biomarkers, such as HbA1c (Lai et al., 2019), fructosamine (Vergès et al., 2021), and adiponectin (Liu et al., 2016), at multi-omics levels have already been identified and applied in clinical usage.
With the development of gut microbiome, the pathogenesis studies for complex diseases especially for metabolism associated diseases have been extended from traditional host genetics level to microenvironment-associated microbiome level. Microbes participate in the pathogenesis of multiple metabolic diseases including diabetes. In 2019, a summary for the microbiome role in T2D confirmed that Bifidobacterium, Bacteroides, Faecalibacterium, Akkermansia, and Roseburia can prevent the progression of diabetes, whereas Ruminococcus, Fusobacterium, and Blautia promote its development (Gurung et al., 2020). Therefore, microbial factors in gut, whose dysfunctions are underlying conditions of diabetes, may be an additional regulatory factor for the maintenance of sugar metabolism. However, current studies face two limitations in investigating the microbial influences on diabetes pathogenesis. Firstly, such studies are non-systematic, focusing on one or several significant microbes/proteins/genes. Next, they overlook the functional exploration of identified microbes, focusing only on the identification of potential diabetes-associated microbes.
To fill this gap between gut microbiome and diabetes studies, we first introduced the eggNOG (Powell et al., 2014) and KEGG ORTHOLOGY (KO) databases (Mao et al., 2005) for orthologous (protein/gene) annotations. Considering the systematic connection between KOs and related functions, these databases may help in the exploration of the potential general biological functions of identified microbes. Then, based on previously reported gut microbiome sequencing data, we applied multiple machine-learning models to identify significant microbiota biomarkers for T2D. The feature selection method, Max-Relevance and Min-Redundancy (mRMR) (Peng et al., 2005), was first applied to the data for producing a feature list. Then, the incremental feature selection (IFS) (Liu and Setiono, 1998), incorporating support vector machine (SVM) (Cortes and Vapnik, 1995) as the classification algorithm, adopted such list to extract essential annotations and construct efficient classifiers. The essential annotations can be novel biomarkers of T2D and the classifiers can be useful tools for identification of T2D samples. The identified biomarkers not only revealed potential pathological factors for diabetes at the microbiome level but also provided us new candidates for drug development against diabetes.
Materials and Methods
Data
We downloaded the eggNOG and KO annotations of gut microbiome in 75 T2D and 277 control from the work of Forslund et al. (2015) at http://vm-lux.embl.de/∼kultima/share/gene_catalogs/620mhT2D/620.mhT2D.RefGeneCatalog.eggnog3.annotations and http://vm-lux.embl.de/∼kultima/share/gene_catalogs/620mhT2D/620.mhT2D.RefGeneCatalog.kegg62.annotations. Within each sample, 21,902 eggNOG and 6971 KO terms were found. We aimed to investigate the functional differences of gut microbiome between T2D and normal conditions.
Max-Relevance and Min-Redundancy (mRMR) Feature Selection
Max-Relevance and Min-Redundancy (Peng et al., 2005) is a feature selection method that can select relevant features and filter redundant features simultaneously, which has wide applications in analysis of various biological and medical systems (Zhao et al., 2018; Chen et al., 2019; Zhang S. et al., 2019; He et al., 2020; Zhang et al., 2020, 2021a). mRMR uses mutual information (MI) to estimate the feature relevance and redundancy. For variables x and y, their MI values can be computed by
where p(x, y) stands for the joint probabilistic density of x and y, whereas p(x) and p(y) stand for the marginal probabilistic densities of x and y, respectively. The mRMR method can output two feature lists, named MaxRel and mRMR feature lists, respectively. To obtain the former list, mRMR method calculates the MI value between each feature and class labels. Such list ranks features by the decreasing order of their MI values to class labels. Evidently, a feature with a high rank means that it is highly related to the class labels. However, redundancies between some top features in this list may exist. Thus, these features cannot always comprise the compact and optimum feature subspace for a certain classification algorithm. In view of this, mRMR method generates the later list, mRMR feature list, which further considers the redundancies between features. Such list is an empty one initially. Features are added to this list one by one. In each round, a feature with maximum relevance to class labels and minimum redundancies to already-selected features is selected and appended to the current list. Clearly, some top-ranked features in this list have larger feature relevance and less feature redundancy than other features. They can constitute the optimum feature subspace for a certain classification algorithm. This study only adopted the mRMR feature list because we want to build efficient classifiers for identification of T2D samples.
The mRMR program used in this study was sourced from http://penglab.janelia.org/proj/mRMR/. Default parameters were adopted to execute this program.
Incremental Feature Selection (IFS)
Incremental feature selection (Liu and Setiono, 1998) aims to determine the optimal number of features to build a classifier for discriminating diseases, such as diabetes, by integrating a supervised classification algorithm (e.g., SVM; Cortes and Vapnik, 1995). According to the mRMR feature list generated by the mRMR method, IFS produces several feature subsets with a given interval s (i.e., 1 or 10). For example, the first feature subset would have the first s features in the mRMR feature list, then the second feature subset can have the first 2 × s features, and so forth. On the basis of these candidate feature subsets, a classifier can be learnt on the samples within each feature subset from the training dataset. Each classifier is evaluated by a cross-validation method (Kohavi, 1995). A classifier that can yield the best performance measurement, such as Matthews correlation coefficient (MCC) (Matthews, 1975), is found. Such classifier was called the optimal classifier in this study and the corresponding feature subset was termed as the optimal feature subset.
SVM
Support vector machine (Cortes and Vapnik, 1995) is a supervised machine learning model for classification, which is always an important candidate for constructing efficient classifiers (Chen et al., 2017; Tahir and Idris, 2020; Zhou et al., 2020; Liu et al., 2021; Pan et al., 2021; Zhang et al., 2021b; Zhu et al., 2021). This machine can transform the original sample data with a non-linear pattern in low-dimensional space to new sample data with a linear pattern in high-dimensional space. Then, the SVM divides the data points by maximizing the point interval among different supervised classes in such a new space. Finally, SVM can predict the class label of a new sample by determining which interval this new data point belongs to.
To date, several types of SVMs have been proposed to tackle different kinds of problems. This study used the SVM optimized by the sequential minimal optimization (SMO) algorithm (Platt, 1998a,b). The tool “SMO” in Weka (Witten and Frank, 2005) implements this type of SVM and it was directly adopted in this study. It was performed with its default parameters. In detail, the kernel was a polynomial function and the regularization parameter C was set to one.
Measurements
In this study, a binary classification problem (normal versus diabetes) was analyzed for each dataset with eggNOG or KO annotations. The normal samples were termed as positive samples and T2D samples were considered as negative samples. Generally, four entries: true-positive (TP), true-negative (TN), false-positive (FP), and false-negative (FN) are always counted for the predicted results of a binary classification. Accordingly, several measurements can be calculated. They are sensitivity (SN), specificity (SP), accuracy (ACC), precision, F1-measure, and MCC (Matthews, 1975; Jia et al., 2020; Liang et al., 2020; Zhang et al., 2021c), which can be computed by
The SN, SP, and precision can only evaluate the quality of predicted results in one aspect, whereas ACC, F1-measure, and MCC can fully evaluate the performance of the classifiers. Considering the fact that normal samples were much than T2D samples, MCC was selected as the key measurement in this study because it is a balanced measurement when the class sizes are of great differences. MCC has values ranging from −1 to + 1, and when MCC is equivalent to + 1, the classifier achieves the best performance.
Results
Two datasets were investigated in this work: T2D microbiome data with function features from eggNOG database and T2D microbiome data with alternative function features from KO. For each dataset, a similar analysis was carried out. The whole procedures are illustrated in Figure 1. This section gives the detailed results.
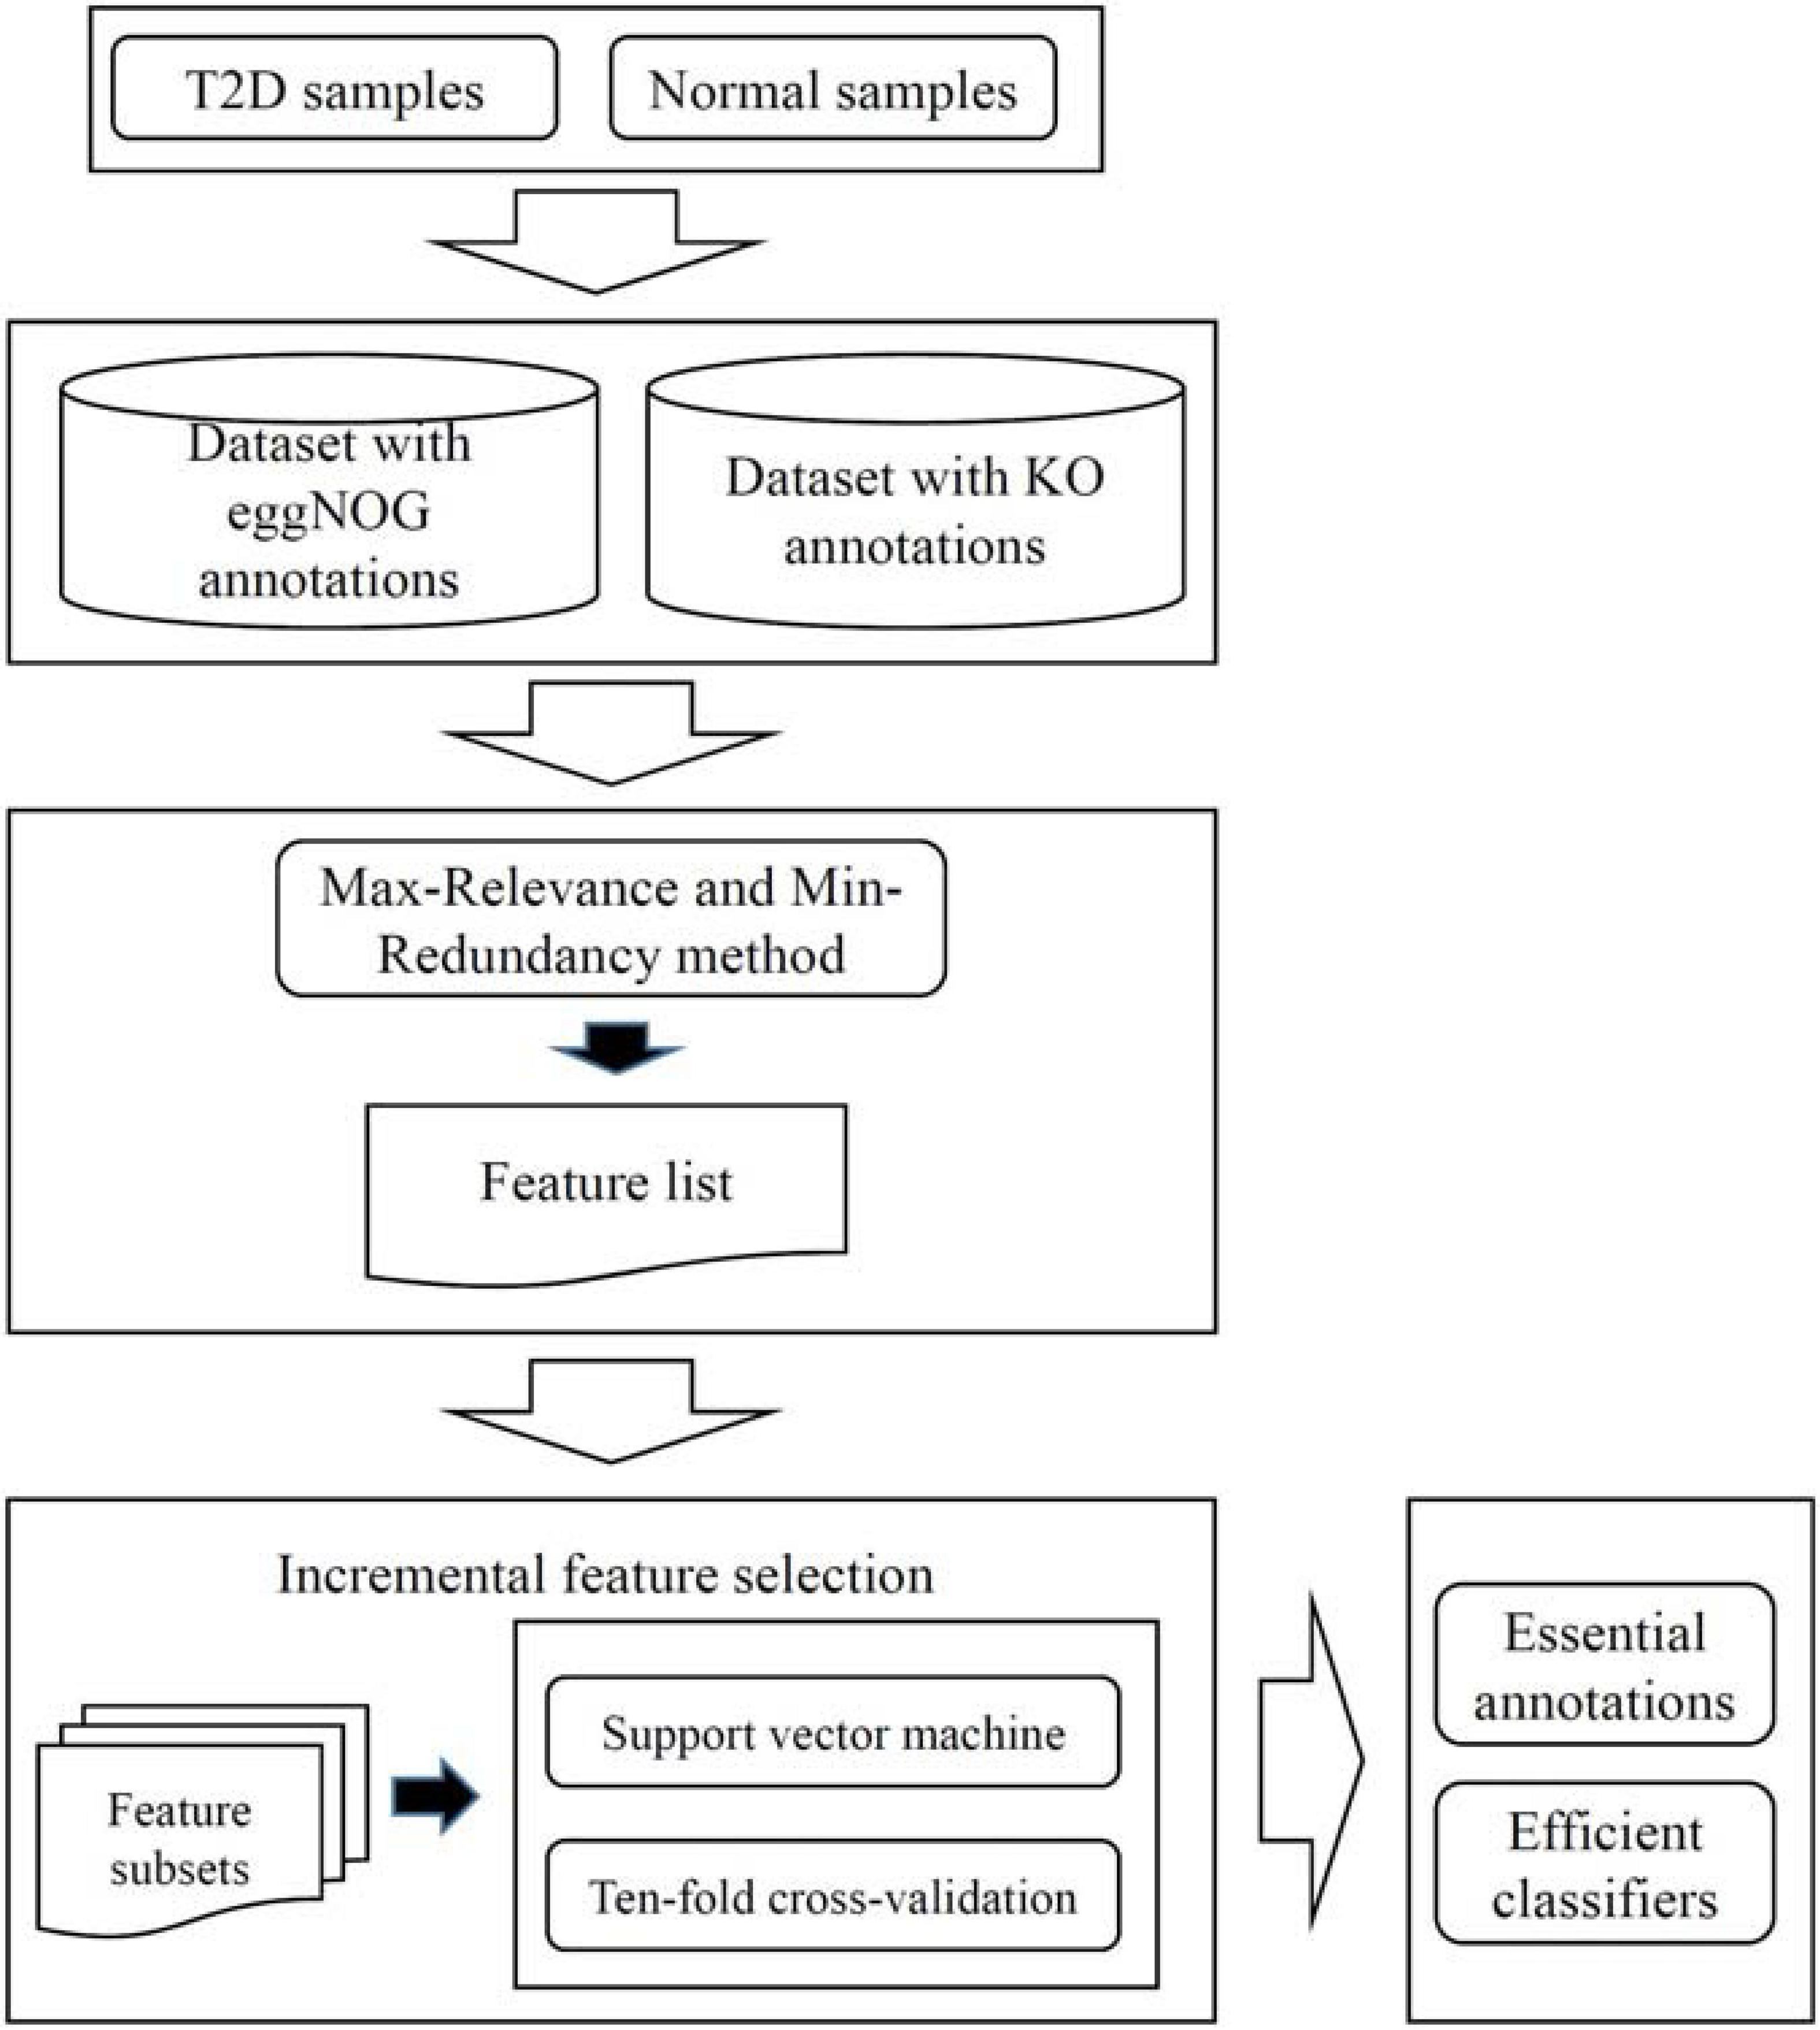
Figure 1. Entire procedures to investigate the T2D datasets with eggNOG or KO annotations. The dataset is first analyzed by the Max-Relevance and Min-Redundancy method, resulting in a feature list. This list is fed into the incremental feature selection method, incorporating support vector machine as the classification algorithm, to extract essential annotations and construct efficient classifiers.
Results of mRMR Method
The mRMR method was first applied on each of two datasets to analyze the importance of each feature. A feature list, named mRMR feature list, was generated for each dataset, which is provided in Supplementary Tables 1, 2, respectively. These two lists would be used in the following IFS method.
Results of the IFS Method
Based on an mRMR feature list, IFS was employed to give further analysis. However, there were lots of eggNOG or KO features in the corresponding dataset. If all possible feature subsets were considered, it would be time-consuming due to our limited computer power. In view of this, we designed a two-stage IFS method. In the first stage, we constructed feature subsets with an interval of 10 for each dataset. On each feature subset, an SVM classifier was built and evaluated by 10-fold cross-validation. The predicted results were counted as measurements listed in Section “Measurements.”
For the dataset with eggNOG annotations, obtained measurements are available in Supplementary Table 3. For an easy observation, an IFS curve was plotted, as shown in Figure 2A, where the number of features was set as X-axis and MCC was set as Y-axis. It can be observed that when top 2090 features were adopted, the SVM classifier produced the highest MCC of 0.844. As for the dataset with KO annotations, the performance of all constructed SVM classifiers is listed in Supplementary Table 4. Likewise, an IFS curve was plotted, as illustrated in Figure 3A. When top 200 features were used, the SVM yielded the highest MCC of 0.687.
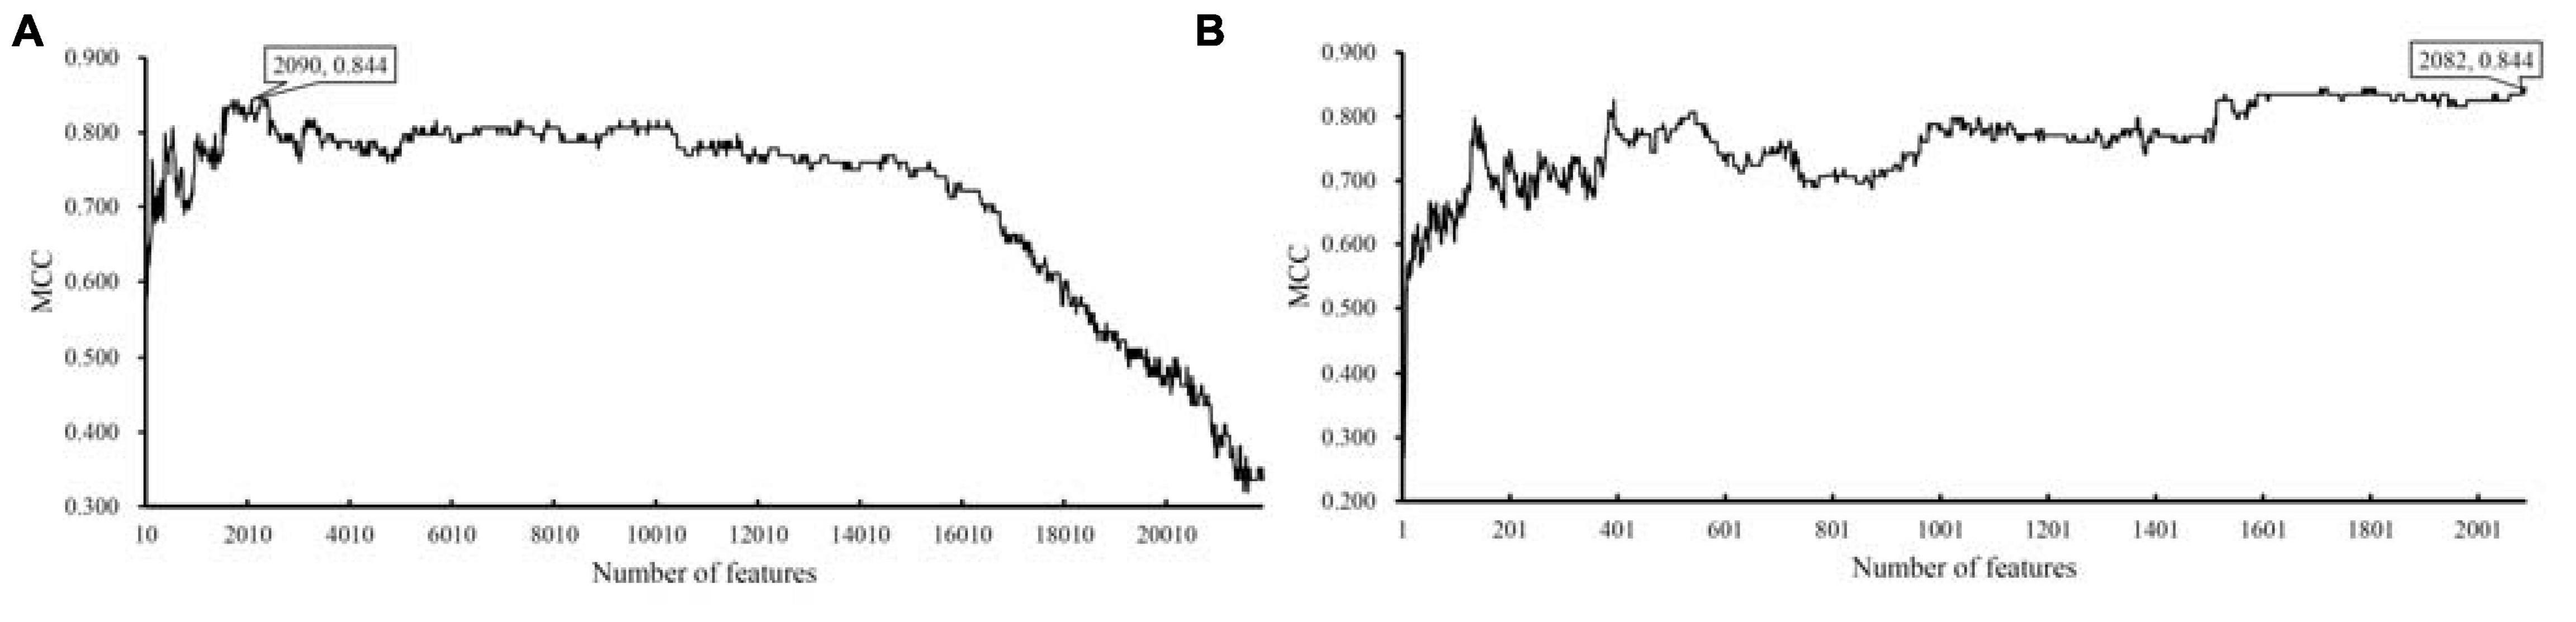
Figure 2. IFS curves with support vector machine (SVM) classifiers on different numbers of eggNOG features. (A) IFS curve with an interval of 10, the highest MCC is 0.844 when top 2090 features are adopted. (B) IFS curve with an interval of one, the highest MCC is still 0.844, however, it can be obtained by only using top 2082 features.
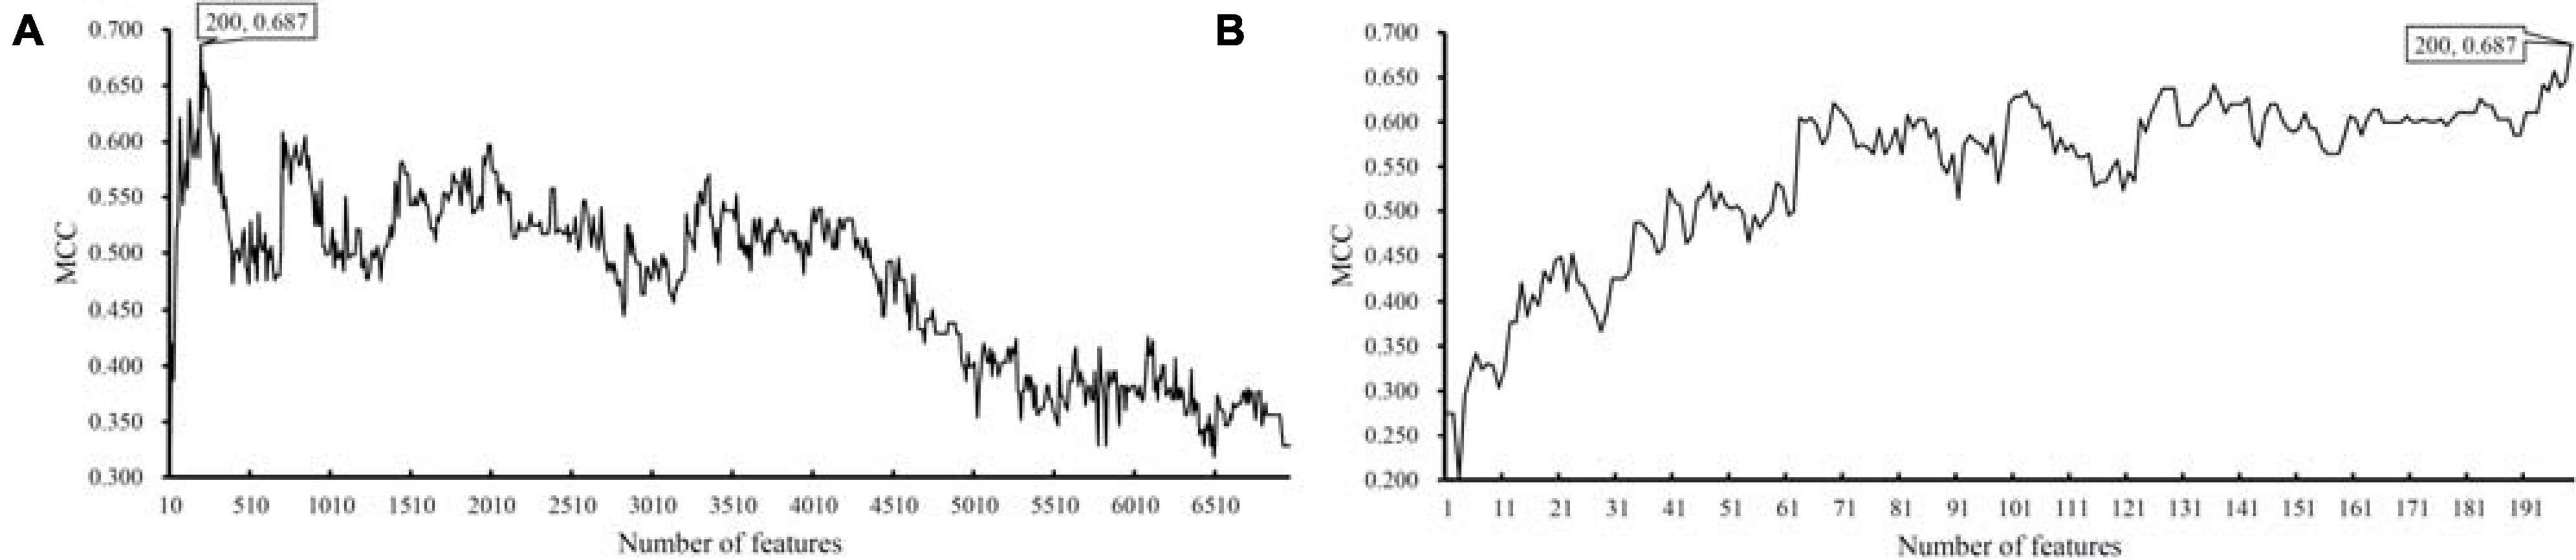
Figure 3. IFS curves with support vector machine (SVM) classifiers on different numbers of KO features. (A) IFS curve with an interval of 10, the highest MCC is 0.687 when top 200 features are adopted. (B) IFS curve with an interval of one, the highest MCC is still 0.687, which is obtained by the same top 200 features.
To further determine the optimum feature subspace of SVM on two datasets, the second stage of IFS method was performed. For the dataset with eggNOG annotations, top 2090 features yielded the best performance of SVM in the first stage. In view of this, we did the same procedure for all possible feature subsets containing less than 2090 features. The performance of SVM classifiers on all these feature subsets is available in Supplementary Table 5. The IFS curve is displayed in Figure 2B, from which we can see that the highest MCC was still 0.844. However, it can be obtained by using top 2082 features. Thus, these features comprised the optimal feature subset and the SVM classifier with these features was called the optimal SVM classifier. The MCC of such classifier is listed in Table 1 and other measurements are provided in Figure 4. Except SP, SN, ACC, precision, and F1-measure were all quite high (>0.900). These results indicated the good performance of such optimal SVM classifier.
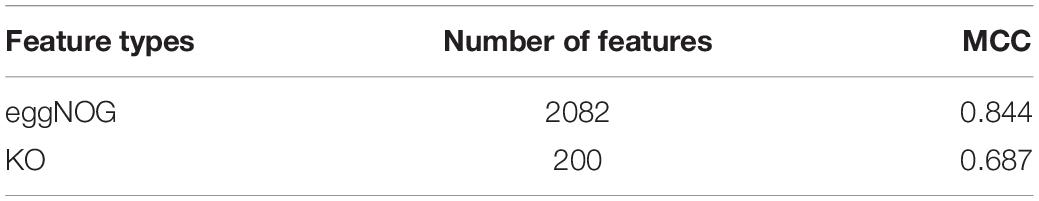
Table 1. MCC performance of classifiers with different features.
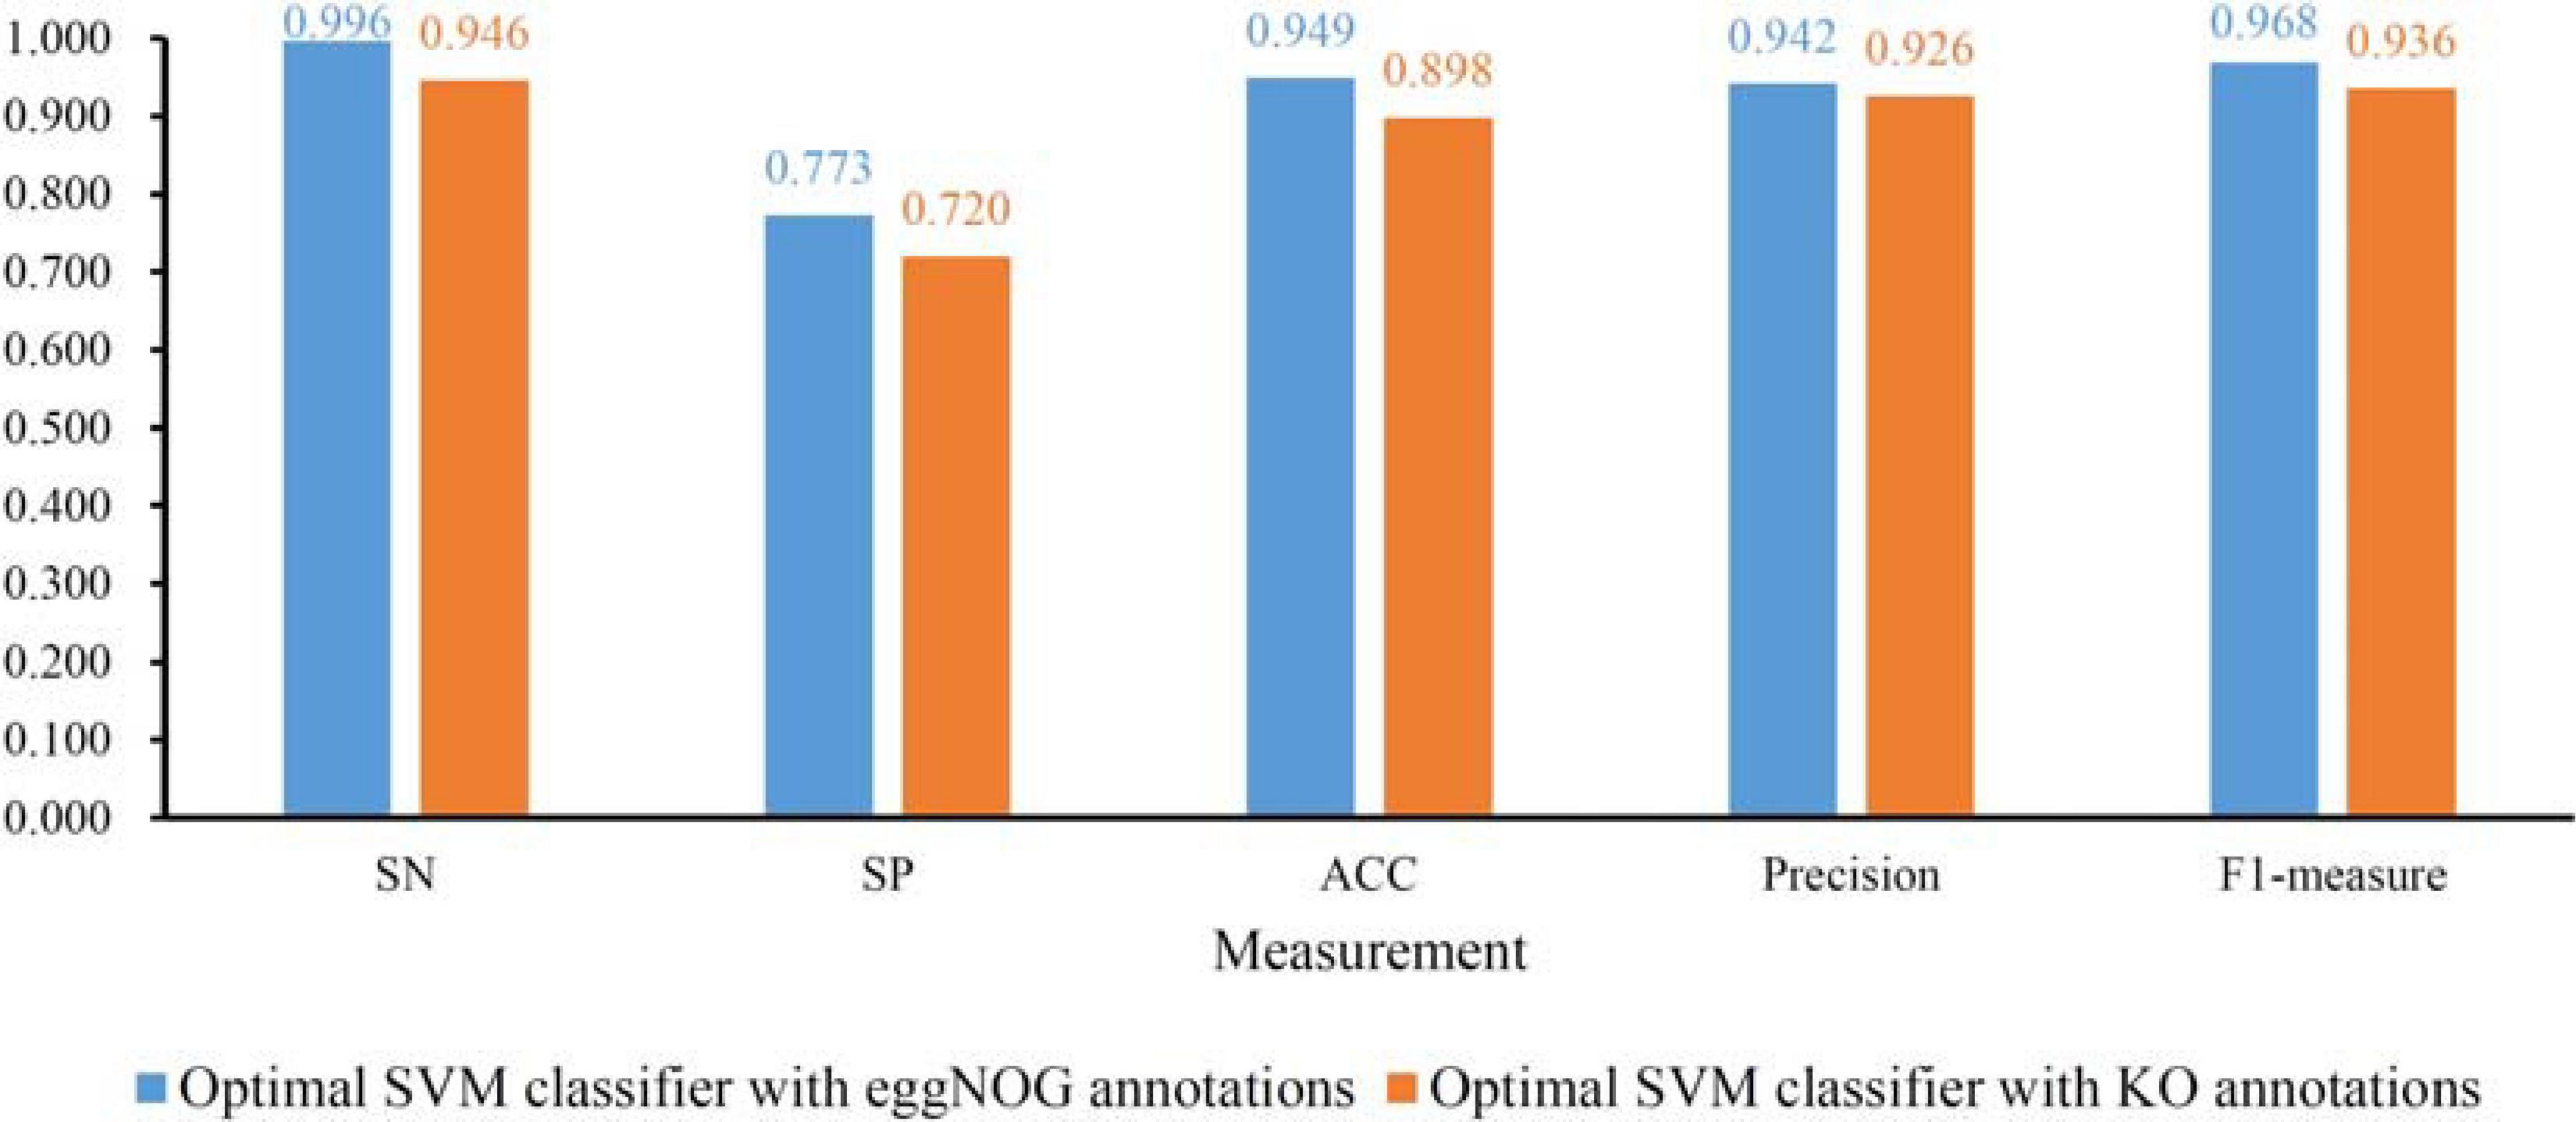
Figure 4. Detailed performance of the optimal support vector machine (SVM) with eggNOG or KO annotations. Except SP, other four measurements are all quite high.
As for the dataset with KO annotations, top 200 features produced the highest MCC in the first stage of IFS method. In the second stage, all possible feature subsets with less than 200 features were considered. The performance of SVM classifiers on all these feature subsets is provided in Supplementary Table 6. Similarly, an IFS curve was plotted, as shown in Figure 3B. Interestingly, the top 200 features still yielded the highest MCC. Thus, we can determine that these top 200 features comprised the optimal feature subset. The SVM with these features was the optimal SVM classifier. The MCC yielded by such classifier is listed in Table 1 and other measurements are illustrated in Figure 4. Similar to the optimal SVM classifier with eggNOG annotations, the SP was still not very high, whereas other measurements were satisfied. It is indicated that such classifier also provided good performance.
Discussion
As analyzed above, we constructed two optimal SVM classifiers to distinguish T2D patients from normal controls. The features used in these two classifiers can be potential biomarkers to distinguish T2D patients from normal controls at the gut microbiome level. Features describing the orthologous (proteins/genes annotation from eggNOG and KO database) with functional interpretation have been screened out and optimized to identify significant microbes together with their summarized functions associated with the pathogenesis of T2D. According to recent publications, some top functional features have been validated, and some representative features, listed in Table 2, from each database have detailed interpretations and are summarized below.

Table 2. Top annotations from eggNOG or KO databases.
Optimal Orthologous Gene/Protein Features Annotated by eggNOG Database
The first functional term identified is NOG275679, describing the S-layer proteins derived from multiple organisms, including Bacillus thuringiensis and Caldicellulosiruptor saccharolyticus. According to recent publications, 4-hydroxyisoleucine (4-HIL) is one of the most significant compounds for treating T2D with specific blood glucose control capacity (Zafar and Gao, 2016); 4-HIL is also a major metabolite of B. thuringiensis (Kodera et al., 2009; Zafar and Gao, 2016). Therefore, using NOG275679 as a biomarker may help us identify important functional microbes, such as B. thuringiensis, that may further assist in distinguishing diabetes patients from normal controls.
The next functional term is COG4678 describing muramidase (phage lambda lysozyme) from multiple organisms, including Escherichia coli. Muramidase has been previously reported to be correlated with multiple complications of T2D. In 1989, muramidase had been shown to be correlated with tubular dysfunction (Tanaka et al., 1989), triggering diabetic nephropathy. Further in 1992, the enzyme was shown to be associated with diabetic mastopathy (Tomaszewski et al., 1992); this enzyme, which is triggered by T2D, is also associated with chronic inflammation all over the body (Maes et al., 2013). Therefore, COG4678 is a microbe-associated biomarker for T2D.
NOG70379 as the next identified potential biomarker describes the ATP-binding proteins in five organisms, including four Leptospira species and Helicobacter hepaticus. Given that ATP-binding proteins are essential for Leptospira and H. hepaticus, the identification of such protein from these species indicates the potential significant role of such species for T2D pathogenesis. In 2020, a systematic analysis confirmed the potential association between autoimmune disorders (including T2D) and Leptospira infection (Teh et al., 2020). Another independent research also validated that the infection of Leptospira is associated with diabetic chronic kidney disease (Carrillo-Larco et al., 2019). These tight correlations between Leptospira infection and diabetes support microbe NOG70379 as a potential biomarker for T2D.
Although the next identified protein NOG10530 is typically a hypothetical protein, the organisms from which such protein is derived from have also been linked with T2D. According to the eggNOG database, such gene/protein is mainly derived from E. coli and Burkholderia glumae. According to a systematic gut microbiome analysis on patients with T2D (Wu et al., 2017), the distributions of different strains of E. coli are significantly altered due to diabetes pathogenesis. Therefore, as a signature protein from E. coli, NOG10530 may have a predictive potential for T2D patients.
The next identified biomarker (COG0810) describes the TonB-like protein in multiple organisms, including Acidovorax citrulli, Acinetobacter baumannii, and Koribacter versatilis. TonB-like protein is associated with the microbe-assistant vitamin B12 metabolism (Fischer et al., 1989; Gherasim et al., 2013). The majority of patients with T2D suffer from vitamin B12 deficiency (Kibirige and Mwebaze, 2013). Therefore, as a mediator for vitamin B12 metabolism, COG0810 is a potential biomarker for distinguishing T2D patients and normal controls.
Optimal Orthologous Gene/Protein Features Together With Functional Interpretations Annotated by KO Database
As discussed above, multiple genes/proteins from microbes have been identified and associated with T2D. For further functional exploration and summarization, we predicted another group of gene/protein features with functional annotation from KO database.
The first identified functional term K00244 describes the fumarate reductase flavor-protein subunit. Such term has been functionally annotated with citrate cycle, oxidative phosphorylation, and carbon fixation pathways in prokaryotes. In 2019, a mouse-based study (Beli et al., 2019) confirmed that carbon metabolism, including the carbon fixation of prokaryotes, is altered during the initiation and progression of T2D. Therefore, K00244 is predicted as a potential diabetes-associated protein at the microbial level.
The second functional term K14744 (rzpD, prophage endopeptidase) has also been predicted to participate in distinguishing T2D patients and normal controls. Although no direct evidence confirms its pathological role for T2D, the specific role of the phage from which such protein is mainly derived from has been validated during T2D progression, participating in the regulation of chronic inflammatory environment (Górski et al., 2016; Ma et al., 2018). Therefore, K14744 may also be a potential biomarker for the identification of T2D, playing the specific role of prophage endopeptidase for phage-mediated biological processes.
The next functional term K03367 describes the D-alanine—ploy (phospho-ribitol) ligase subunit 1, which has further been associated with the Staphylococcus infection and D-alanine metabolism. For staphylococci, in 2015, a research confirmed that patients with T2D have different abundances and kinds of Staphylococcus in the gut microbiome compared with normal controls (Gan, 2013; Farnsworth et al., 2015), indicating that Staphylococcus infection is associated with the initiation and progression of T2D. Further, key metabolites of D-alanine metabolism are gut microbiome markers of T2D mellitus (Wang et al., 2017), corresponding with our prediction.
Other functional terms like K03201 describing protein VirB6, and K01006 describing pyruvate, orthophosphate dikinase have also been predicted to be associated with type 2 diabetes via microbiome level regulation. Recent publications have also linked these proteins with the pathogenesis of T2D, indicating that they may also be potential biomarkers. Vir86 was identified in a long-read metagenomics exploration of human gut and is functionally correlated with inflammatory bowel disease and T2D (Suzuki et al., 2019). Pyruvate, orthophosphate dikinase is a potential pharmacological target of hypoglycemic agents (Zhang F. et al., 2019), with altered expression level from gut microbiome in response to the pharmacological effects of drugs. Therefore, these proteins with their functional annotations may be potential biomarkers distinguishing T2D at the gut microbiome level.
Overall, the identified optimal eggNOG and KO terms, which can be used to describe effective genes/proteins together with their potential biological functions and pathways, have all been associated with T2D pathogenesis and sugar metabolism-associated pathways. Therefore, on the basis of eggNOG orthologous and KO functional annotations, the machine learning models that we applied can identify optimal biomarkers or drug targets for further translational medicine studies on T2D and lay a solid foundation for studies of the detailed pathogenesis of T2D.
Conclusion
This study investigated two T2D microbiome datasets. One was annotated by eggNOG annotations, whereas the other one was annotated by KO annotations. Several machine learning models were applied to these two datasets. Some latent biomarkers were extracted and efficient classifiers were constructed. They can be useful for identifying T2D patients from normal controls and improving our understanding on T2D at the gut microbiome level.
Data Availability Statement
Publicly available datasets were analyzed in this study. These data can be found here: http://vm-lux.embl.de/~kultima/share/gene_catalogs/620mhT2D/.
Author Contributions
JE-G, TH, and Y-DC designed the study. Y-HZ, WG, TZ, SZ, and LC performed the experiments. Y-HZ, TZ, MG, and RM analyzed the results. Y-HZ, WG, and TZ wrote the manuscript. All authors contributed to the research and reviewed the manuscript.
Funding
This research was funded by the Strategic Priority Research Program of Chinese Academy of Sciences (XDB38050200), National Key R&D Program of China (2017YFC1201200), Shanghai Municipal Science and Technology Major Project (2017SHZDZX01), National Key R&D Program of China (2018YFC0910403), National Natural Science Foundation of China (31701151), Shanghai Sailing Program (16YF1413800), the Youth Innovation Promotion Association of Chinese Academy of Sciences (CAS; 2016245), and the Fund of the Key Laboratory of Tissue Microenvironment and Tumor of Chinese Academy of Sciences (202002).
Conflict of Interest
The authors declare that the research was conducted in the absence of any commercial or financial relationships that could be construed as a potential conflict of interest.
Supplementary Material
The Supplementary Material for this article can be found online at: https://www.frontiersin.org/articles/10.3389/fmicb.2021.711244/full#supplementary-material
Supplementary Table 1 | Ranked eggNOG features by mRMR.
Supplementary Table 2 | Ranked KO features by mRMR.
Supplementary Table 3 | Performance of IFS for eggNOG features with an interval of 10.
Supplementary Table 4 | Performance of IFS for KO features with an interval of 10.
Supplementary Table 5 | Performance of IFS for NOG features with an interval of one.
Supplementary Table 6 | Performance of IFS for KO features with an interval of one.
References
Arthur, R., Rohrmann, S., Møller, H., Selvin, E., Dobs, A. S., Kanarek, N., et al. (2017). Pre-diabetes and serum sex steroid hormones among US men. Andrology 5, 49–57. doi: 10.1111/andr.12287
Bakris, G. L., Agarwal, R., Anker, S. D., Pitt, B., Ruilope, L. M., Rossing, P., et al. (2020). Effect of finerenone on chronic kidney disease outcomes in type 2 diabetes. N. Engl. J. Med. 383, 2219–2229. doi: 10.1056/nejmoa2025845
Beli, E., Prabakaran, S., Krishnan, P., Evans-Molina, C., and Grant, M. B. (2019). Loss of diurnal oscillatory rhythms in gut microbiota correlates with changes in circulating metabolites in type 2 diabetic db/db mice. Nutrients 11:2310. doi: 10.3390/nu11102310
Bullard, K. M., Cowie, C. C., Lessem, S. E., Saydah, S. H., Menke, A., Geiss, L. S., et al. (2018). Prevalence of diagnosed diabetes in adults by diabetes type—United States, 2016. Morb. Mortal. Wkly. Rep. 67:359. doi: 10.15585/mmwr.mm6712a2
Carrillo-Larco, R. M., Altez-Fernandez, C., Acevedo-Rodriguez, J. G., Ortiz-Acha, K., and Ugarte-Gil, C. (2019). Leptospirosis as a risk factor for chronic kidney disease: a systematic review of observational studies. PLoS Neglect. Trop. Dis. 13:e0007458. doi: 10.1371/journal.pntd.0007458
Chen, L., Wang, S., Zhang, Y.-H., Li, J., Xing, Z.-H., Yang, J., et al. (2017). Identify key sequence features to improve CRISPR sgRNA efficacy. IEEE Access 5, 26582–26590. doi: 10.1109/access.2017.2775703
Chen, L., Zeng, T., Pan, X., Zhang, Y. H., Huang, T., and Cai, Y. D. (2019). Identifying methylation pattern and genes associated with breast cancer subtypes. Int. J. Mol. Sci. 20:4269. doi: 10.3390/ijms20174269
Deputy, N. P., Kim, S. Y., Conrey, E. J., and Bullard, K. M. (2018). Prevalence and changes in preexisting diabetes and gestational diabetes among women who had a live birth—United States, 2012–2016. Morb. Mortal. Wkly. Rep. 67:1201. doi: 10.15585/mmwr.mm6743a2
Farnsworth, C. W., Shehatou, C. T., Maynard, R., Nishitani, K., Kates, S. L., Zuscik, M. J., et al. (2015). A humoral immune defect distinguishes the response to Staphylococcus aureus infections in mice with obesity and type 2 diabetes from that in mice with type 1 diabetes. Infect. Immun. 83, 2264–2274. doi: 10.1128/iai.03074-14
Fischer, E., Günter, K., and Braun, V. (1989). Involvement of ExbB and TonB in transport across the outer membrane of Escherichia coli: phenotypic complementation of exb mutants by overexpressed tonB and physical stabilization of TonB by ExbB. J. Bacteriol. 171, 5127–5134. doi: 10.1128/jb.171.9.5127-5134.1989
Forslund, K., Hildebrand, F., Nielsen, T., Falony, G., Le Chatelier, E., Sunagawa, S., et al. (2015). Disentangling type 2 diabetes and metformin treatment signatures in the human gut microbiota. Nature 528, 262–266.
Gan, Y.-H. (2013). Host susceptibility factors to bacterial infections in type 2 diabetes. PLoS Pathog. 9:e1003794. doi: 10.1371/journal.ppat.1003794
Gherasim, C., Lofgren, M., and Banerjee, R. (2013). Navigating the B12 road: assimilation, delivery, and disorders of cobalamin. J. Biol. Chem. 288, 13186–13193. doi: 10.1074/jbc.r113.458810
Goldstein, B. J. (2002). Insulin resistance as the core defect in type 2 diabetes mellitus. Am. J. Cardiol. 90, 3–10. doi: 10.1016/s0002-9149(02)02553-5
Górski, A., Międzybrodzki, R., Weber-Da̧browska, B., Fortuna, W., Letkiewicz, S., Rogóż, P., et al. (2016). Phage therapy: combating infections with potential for evolving from merely a treatment for complications to targeting diseases. Front. Microbiol. 7:1515. doi: 10.3389/fmicb.2016.01515
Gurung, M., Li, Z., You, H., Rodrigues, R., Jump, D. B., Morgun, A., et al. (2020). Role of gut microbiota in type 2 diabetes pathophysiology. EBioMedicine 51:102590. doi: 10.1016/j.ebiom.2019.11.051
He, S., Guo, F., Zou, Q., and Ding, H. (2020). MRMD2.0: a python tool for machine learning with feature ranking and reduction. Curr. Bioinform. 15, 1213–1221. doi: 10.2174/1574893615999200503030350
Jia, Y., Zhao, R., and Chen, L. (2020). Similarity-based machine learning model for predicting the metabolic pathways of compounds. IEEE Access 8, 130687–130696. doi: 10.1109/access.2020.3009439
Kahn, S. E., Hull, R. L., and Utzschneider, K. M. (2006). Mechanisms linking obesity to insulin resistance and type 2 diabetes. Nature 444, 840–846. doi: 10.1038/nature05482
Kibirige, D., and Mwebaze, R. (2013). Vitamin B12 deficiency among patients with diabetes mellitus: is routine screening and supplementation justified? J. Diabetes Metab. Disord. 12:17.
Kodera, T., Smirnov, S. V., Samsonova, N. N., Kozlov, Y. I., Koyama, R., Hibi, M., et al. (2009). A novel L-isoleucine hydroxylating enzyme, L-isoleucine dioxygenase from Bacillus thuringiensis, produces (2S, 3R, 4S)-4-hydroxyisoleucine. Biochem. Biophys. Res. Commun. 390, 506–510. doi: 10.1016/j.bbrc.2009.09.126
Kohavi, R. (1995). “A study of cross-validation and bootstrap for accuracy estimation and model selection,” in Proceedings of the International joint Conference on Artificial Intelligence, (London: Lawrence Erlbaum Associates Ltd), 1137–1145.
Lai, Y.-R., Chiu, W.-C., Huang, C.-C., Tsai, N.-W., Wang, H.-C., Lin, W.-C., et al. (2019). HbA1C variability is strongly associated with the severity of peripheral neuropathy in patients with type 2 diabetes. Front. Neurosci. 13:90. doi: 10.3389/fnins.2019.00090
Li, T., Xu, X., Xu, Y., Jin, P., Chen, J., Shi, Y., et al. (2019). PPARG polymorphisms are associated with unexplained mild vision loss in patients with type 2 diabetes mellitus. J. Ophthalmol. 2019:5284867.
Liang, H., Chen, L., Zhao, X., and Zhang, X. (2020). Prediction of drug side effects with a refined negative sample selection strategy. Comput. Math. Methods Med. 2020:1573543.
Liu, C., Feng, X., Li, Q., Wang, Y., Li, Q., and Hua, M. (2016). Adiponectin, TNF-α and inflammatory cytokines and risk of type 2 diabetes: a systematic review and meta-analysis. Cytokine 86, 100–109. doi: 10.1016/j.cyto.2016.06.028
Liu, H., Hu, B., Chen, L., and Lu, L. (2021). Identifying protein subcellular location with embedding features learned from networks. Curr. Proteom. [Epub ahead of print].
Ma, Y., You, X., Mai, G., Tokuyasu, T., and Liu, C. (2018). A human gut phage catalog correlates the gut phageome with type 2 diabetes. Microbiome 6:24.
Maes, M., Kubera, M., Leunis, J. C., Berk, M., Geffard, M., and Bosmans, E. (2013). In depression, bacterial translocation may drive inflammatory responses, oxidative and nitrosative stress (O&NS), and autoimmune responses directed against O&NS-damaged neoepitopes. Acta Psychiatr. Scand. 127, 344–354. doi: 10.1111/j.1600-0447.2012.01908.x
Mao, X., Cai, T., Olyarchuk, J. G., and Wei, L. (2005). Automated genome annotation and pathway identification using the KEGG Orthology (KO) as a controlled vocabulary. Bioinformatics 21, 3787–3793. doi: 10.1093/bioinformatics/bti430
Matthews, B. (1975). Comparison of the predicted and observed secondary structure of T4 phage lysozyme. Biochim. Biophys. Acta Protein Struct. 405, 442–451. doi: 10.1016/0005-2795(75)90109-9
Pan, X., Li, H., Zeng, T., Li, Z., Chen, L., Huang, T., et al. (2021). Identification of protein subcellular localization with network and functional embeddings. Front. Genet. 11:626500. doi: 10.3389/fgene.2020.626500
Peng, H., Long, F., and Ding, C. (2005). Feature selection based on mutual information: criteria of max-dependency, max-relevance, and min-redundancy. IEEE Trans. Pattern Anal. Mach. Intellig. 27, 1226–1238. doi: 10.1109/tpami.2005.159
J. Platt (ed.) (1998a). Fast Training of Support Vector Machines Using Sequential Minimal Optimization. Cambridge, MA: MIT Press.
Platt, J. (1998b). Sequential Minimal Optimizaton: A Fast Algorithm for Training Support Vector Machines. Technical Report MSR-TR-98–14. Redmond: Microsoft Corporation.
Powell, S., Forslund, K., Szklarczyk, D., Trachana, K., Roth, A., Huerta-Cepas, J., et al. (2014). eggNOG v4. 0: nested orthology inference across 3686 organisms. Nucleic Acids Res. 42, D231–D239.
Sanahuja, J., Alonso, N., Diez, J., Ortega, E., Rubinat, E., Traveset, A., et al. (2016). Increased burden of cerebral small vessel disease in patients with type 2 diabetes and retinopathy. Diabetes Care 39, 1614–1620. doi: 10.2337/dc15-2671
Suzuki, Y., Nishijima, S., Furuta, Y., Yoshimura, J., Suda, W., Oshima, K., et al. (2019). Long-read metagenomic exploration of extrachromosomal mobile genetic elements in the human gut. Microbiome 7:119.
Tahir, M., and Idris, A. (2020). MD-LBP: an efficient computational model for protein subcellular localization from hela cell lines using SVM. Curr. Bioinform. 15, 204–211. doi: 10.2174/1574893614666190723120716
Tanaka, A., Shima, K., Fukuda, M., Tahara, Y., Yamamoto, Y., and Kumahara, Y. (1989). Tubular dysfunction in the early stage of diabetic nephropathy. Med. J. Osaka Univ. 38, 57–63.
Teh, S.-H., You, R.-I., Yang, Y.-C., Hsu, C. Y., and Pang, C.-Y. (2020). A cohort study: the association between autoimmune disorders and leptospirosis. Sci. Rep. 10:3276.
Tomaszewski, J. E., Brooks, J. S. J., Hicks, D., and Livolsi, V. A. (1992). Diabetic mastopathy: a distinctive clinicopathologic entity. Hum. Pathol. 23, 780–786. doi: 10.1016/0046-8177(92)90348-7
Vergès, B., Rouland, A., Baillot-Rudoni, S., Brindisi, M. C., Duvillard, L., Simoneau, I., et al. (2021). Increased body fat mass reduces the association between fructosamine and glycated hemoglobin in obese type 2 diabetes patients. J. Diabetes Investig. 12, 619–624. doi: 10.1111/jdi.13383
Wang, X., Xu, X., and Xia, Y. (2017). Further analysis reveals new gut microbiome markers of type 2 diabetes mellitus. Antonie Van Leeuwenhoek 110, 445–453. doi: 10.1007/s10482-016-0805-3
Witten, I. H., and Frank, E. (eds) (2005). Data Mining:Practical Machine Learning Tools and Techniques. San Francisco: Kaufmann.
Wu, H., Esteve, E., Tremaroli, V., Khan, M. T., Caesar, R., Mannerås-Holm, L., et al. (2017). Metformin alters the gut microbiome of individuals with treatment-naive type 2 diabetes, contributing to the therapeutic effects of the drug. Nat. Med. 23:850. doi: 10.1038/nm.4345
Yan, A., Issar, T., Tummanapalli, S., Markoulli, M., Kwai, N., Poynten, A., et al. (2020). Relationship between corneal confocal microscopy and markers of peripheral nerve structure and function in Type 2 diabetes. Diabet. Med. 37, 326–334. doi: 10.1111/dme.13952
Zafar, M. I., and Gao, F. (2016). 4-hydroxyisoleucine: a potential new treatment for type 2 diabetes mellitus. BioDrugs 30, 255–262. doi: 10.1007/s40259-016-0177-2
Zhang, F., Wang, M., Yang, J., Xu, Q., Liang, C., Chen, B., et al. (2019). Response of gut microbiota in type 2 diabetes to hypoglycemic agents. Endocrine 66, 485–493. doi: 10.1007/s12020-019-02041-5
Zhang, S., Pan, X., Zeng, T., Guo, W., Gan, Z., Zhang, Y. H., et al. (2019). Copy number variation pattern for discriminating MACROD2 states of colorectal cancer subtypes. Front. Bioeng. Biotechnol. 7:407. doi: 10.3389/fbioe.2019.00407
Zhang, S., Zeng, T., Hu, B., Zhang, Y. H., Feng, K., Chen, L., et al. (2020). Discriminating origin tissues of tumor cell lines by methylation signatures and Dys-methylated rules. Front. Bioeng. Biotechnol. 8:507. doi: 10.3389/fbioe.2020.00507
Zhang, Y. H., Li, H., Zeng, T., Chen, L., Li, Z., Huang, T., et al. (2021a). Identifying transcriptomic signatures and rules for SARS-CoV-2 infection. Front. Cell Dev. Biol. 8:627302. doi: 10.3389/fcell.2020.627302
Zhang, Y.-H., Zeng, T., Chen, L., Huang, T., and Cai, Y.-D. (2021b). Detecting the multiomics signatures of factor-specific inflammatory effects on airway smooth muscles. Front. Genet. 11:599970. doi: 10.3389/fgene.2020.599970
Zhang, Y.-H., Zeng, T., Chen, L., Huang, T., and Cai, Y.-D. (2021c). Determining protein–protein functional associations by functional rules based on gene ontology and KEGG pathway. Biochim. Biophys. Acta Proteins Proteom. 1869:140621. doi: 10.1016/j.bbapap.2021.140621
Zhao, X., Chen, L., and Lu, J. (2018). A similarity-based method for prediction of drug side effects with heterogeneous information. Math. Biosci. 306, 136–144. doi: 10.1016/j.mbs.2018.09.010
Zheng, Y., Ley, S. H., and Hu, F. B. (2018). Global aetiology and epidemiology of type 2 diabetes mellitus and its complications. Nat. Rev. Endocrinol. 14:88. doi: 10.1038/nrendo.2017.151
Zhou, J.-P., Chen, L., Wang, T., and Liu, M. (2020). iATC-FRAKEL: a simple multi-label web-server for recognizing anatomical therapeutic chemical classes of drugs with their fingerprints only. Bioinformatics 36, 3568–3569. doi: 10.1093/bioinformatics/btaa166
Zhu, Y., Hu, B., Chen, L., and Dai, Q. (2021). iMPTCE-Hnetwork: a multi-label classifier for identifying metabolic pathway types of chemicals and enzymes with a heterogeneous network. Comput. Math. Methods Med. 2021:66 83051.
Keywords: type 2 diabetes, gut microbiome, machine learning, feature selection, support vector machine, microbiota biomarkers
Citation: Zhang Y-H, Guo W, Zeng T, Zhang S, Chen L, Gamarra M, Mansour RF, Escorcia-Gutierrez J, Huang T and Cai Y-D (2021) Identification of Microbiota Biomarkers With Orthologous Gene Annotation for Type 2 Diabetes. Front. Microbiol. 12:711244. doi: 10.3389/fmicb.2021.711244
Received: 18 May 2021; Accepted: 21 June 2021;
Published: 09 July 2021.
Edited by:
Qi Zhao, University of Science and Technology Liaoning, ChinaReviewed by:
Yuhua Yao, Hainan Normal University, ChinaPingan He, Zhejiang Sci-Tech University, China
Copyright © 2021 Zhang, Guo, Zeng, Zhang, Chen, Gamarra, Mansour, Escorcia-Gutierrez, Huang and Cai. This is an open-access article distributed under the terms of the Creative Commons Attribution License (CC BY). The use, distribution or reproduction in other forums is permitted, provided the original author(s) and the copyright owner(s) are credited and that the original publication in this journal is cited, in accordance with accepted academic practice. No use, distribution or reproduction is permitted which does not comply with these terms.
*Correspondence: José Escorcia-Gutierrez, am9zZS5lc2NvcmNpYTQ3QHVhYy5lZHUuY28=; Tao Huang, dG9odWFuZ3Rhb0AxMjYuY29t; Yu-Dong Cai, Y2FpX3l1ZEAxMjYuY29t
†These authors have contributed equally to this work