
95% of researchers rate our articles as excellent or good
Learn more about the work of our research integrity team to safeguard the quality of each article we publish.
Find out more
ORIGINAL RESEARCH article
Front. Microbiol. , 14 July 2021
Sec. Microbial Physiology and Metabolism
Volume 12 - 2021 | https://doi.org/10.3389/fmicb.2021.705012
This article is part of the Research Topic Microbial Stress Responses: Antioxidants, the Plasma Membrane, and Beyond View all 11 articles
 Ilaria Camponeschi1Arianna Montanari1
 Marzia Beccaccioli2
 Massimo Reverberi2
 Cristina Mazzoni1
 Michele M. Bianchi1*
In unicellular organisms like yeasts, which do not have specialized tissues for protection against environmental challenges, the presence of cellular mechanisms to respond and adapt to stress conditions is fundamental. In this work, we aimed to investigate the response to environmental light in Kluyveromyces lactis. Yeast lacks specialized light-sensing proteins; however, Saccharomyces cerevisiae has been reported to respond to light by increasing hydrogen peroxide level and triggering nuclear translocation of Msn2. This is a stress-sensitive transcription factor also present in K. lactis. To investigate light response in this yeast, we analyzed the different phenotypes generated by the deletion of the hypoxia responsive and lipid biosynthesis transcription factor KlMga2. Alterations in growth rate, mitochondrial functioning, ROS metabolism, and fatty acid biosynthesis provide evidence that light was a source of stress in K. lactis and that KlMga2 had a role in the light-stress response. The involvement of KlMsn2 and KlCrz1 in light stress was also explored, but the latter showed no function in this response.
Studies on yeast lipid metabolism have been mainly conducted on S. cerevisiae (Natter and Kohlwein, 2013): in this yeast, fatty acid (FA) biosynthesis is restricted to saturated and monounsaturated FAs (MUFAs) and essentially accomplished by acetyl-CoA carboxylase (Acc1) and FA synthase (Fas1 and Fas2) enzymes and by the unique Δ9 desaturase enzyme (Ole1) that produces the monounsaturated (MUFA) palmitoleic and oleic acids. In the lactose-utilizing yeast Kluyveromyces lactis, the composition of FAs is enriched with the polyunsaturated (PUFA) linoleic and α-linolenic acids generated by the Δ12 (Fad2) and ω3 (Fad3) desaturases (Kainou et al., 2006; Santomartino et al., 2017). Environmental conditions regulate the expression of desaturases and have therefore effects on the synthesis and abundance of different (mono- and poly-) unsaturated FA molecules (Rossi et al., 2009) and on properties of membranes.
Mga2 is the S. cerevisiae transcription factor that regulates the expression of desaturase gene OLE1 (Zhang et al., 1999; Chellappa et al., 2001; Jiang et al., 2001) in low-oxygen conditions. Mga2 is constitutively expressed as inactive form bound into endoplasmic reticulum (ER). It is activated in hypoxic conditions by proteasome cleavage (Hoppe et al., 2000): the 90 kDa N-terminal soluble fragment moves then into the nucleus where it induces the expression of low-oxygen responsive genes. In K. lactis, studies on KlMGA2 gene, which is the ortholog gene of S. cerevisiae MGA2 and/or SPT23, revealed multiple cellular roles of this regulator, including response to hypoxia, respiration, glucose metabolism, response to ROS, life span, and general cellular fitness (Micolonghi et al., 2012; Ottaviano et al., 2015; Santomartino et al., 2019a). In detail, the genetic targets of KlMga2 in FA biosynthesis are KlACC1 and FAD2 genes and phenotypes generated by KlMGA2 deletion are restored by the addition of unsaturated FAs (UFA).
Light is a common environmental source of heat and energy, essential for biosynthetic organisms. Yeasts, on the other hand, lack specialized light sensing proteins such as phytochromes, opsins, and cryptochromes (Idnurm et al., 2010), but studies of light-induced stress conducted in S. cerevisiae have shown a response to blue light via activation of the stress-regulated transcription factors Msn2 and Crz1. Both factors control gene expression through nucleo-cytoplasmic translocations (Cai et al., 2008; Bodvard et al., 2011), and the homologs of these two stress-sensitive transcription factors were identified also in K. lactis (Bussereau et al., 2006; Barsoum et al., 2011). In S. cerevisiae, Ca2+ signaling, mediated by the Ca2+/calmodulin dependent phosphatase calcineurin, is required for cell survival during environmental stresses. These conditions cause an increase in cytosolic Ca2+ that induces calcineurin activation (Cyert, 2003). The phosphatase, in turn, dephosphorylates Crz1, which rapidly translocates from the cytosol to the nucleus, where it activates the transcription of genes involved in adaptation to stress (Bodvard et al., 2013; Thewes, 2014).
The second stress-response transcription factor, Msn2, exhibits similar behaviors; it moves to the nucleus where it affects the expression of target genes with STREs (stress response elements) in their promoters (Estruch, 2000). Several stresses are known to induce nucleocytoplasmic oscillations of Msn2, including high concentrations of extracellular Ca2+ (Cai et al., 2008), caloric restriction (low glucose levels 0.1%) (Medvedik et al., 2007), oxidative stress (Hao and O’Shea, 2011), as well as light (Bodvard et al., 2011, 2013, 2017), but the overall activation pathway is less clear than Crz1. Nuclear localization of Msn2 is contrasted by cyclic AMP-controlled protein kinase A (PKA) (Görner et al., 1998) and promoted by the phosphatases PP1 and PP2A (Görner et al., 1998; Santhanam et al., 2004). Another important feature is that light stimulates hydrogen peroxide production in cultured mouse, monkey, and humans cells via photoreduction of flavin-containing oxidases (Hockberger et al., 1999). The intermediates and the mechanism by which PKA senses light remain unclear, but it has been shown that in S. cerevisiae a conserved peroxisomal oxidase (Pox1) converts light into a H2O2 signal, which is sensed by the peroxiredoxin Tsa1 and then transduced to thioredoxin (Trx1) to inhibit PKA activity (Bodvard et al., 2017).
To our knowledge, studies on response to light have never been reported in K. lactis except the resonance response to light–dark 12 + 12 hour cycles generating an increase of phenotypic suppression in KlMGA2 deletion mutant (Camponeschi et al., 2020). Interestingly, the desaturase gene FAD2 is a light-dependent gene in plants (Kargiotidou et al., 2008; Dar et al., 2017) and its transcription is increased also at low temperatures (Byfield and Upchurch, 2007). Desaturase level and lipid unsaturation index were both light-dependent in cold stress (Yuan et al., 2012). As reported above, in K. lactis FAD2 gene is a hypoxic target of KlMga2, suggesting that it could be possible for an overlap between light response and other conditions affecting the regulation of FA biosynthetic metabolism, such as hypoxia, also in non-photosynthetic organism.
In this work we aimed to investigate the role of the yeast multi-functional mediator KlMga2 in light response and connection with the other putative stress factors KlMsn2 and KlCrz1 in this yeast. Effects of light on oxidative stress and lipid biosynthesis were also studied.
The yeast strains used are listed in Table 1. The YPD medium was composed of 1% Yeast Extract (Becton Dickinson and Company), 1% Peptone (Becton Dickinson), and 2% glucose. Solid media contained 2% Bacto-Agar (Becton Dickinson). For selection of transformed cells, we used YPD solid medium supplemented with Geneticin 100 μ/ml (G418; Sigma-Aldrich) or SD solid medium, composed of 0.67% Yeast Nitrogen Base (Becton Dickinson), 2% glucose, and auxotrophic requirements as needed, without uracil. GAA medium, used to select rag + phenotype cells, was composed of YP medium with 5% glucose and 5 μM Antimycin A (Sigma-Aldrich). Except when otherwise specified, culture growth was performed at 28 ± 1°C in complete darkness or in light (134 μM/s/m2) under white LED lamps (4500K, 400–700 nm range). Cell density was determined by optical density at 600 nm or by cell counting in Burker chamber.
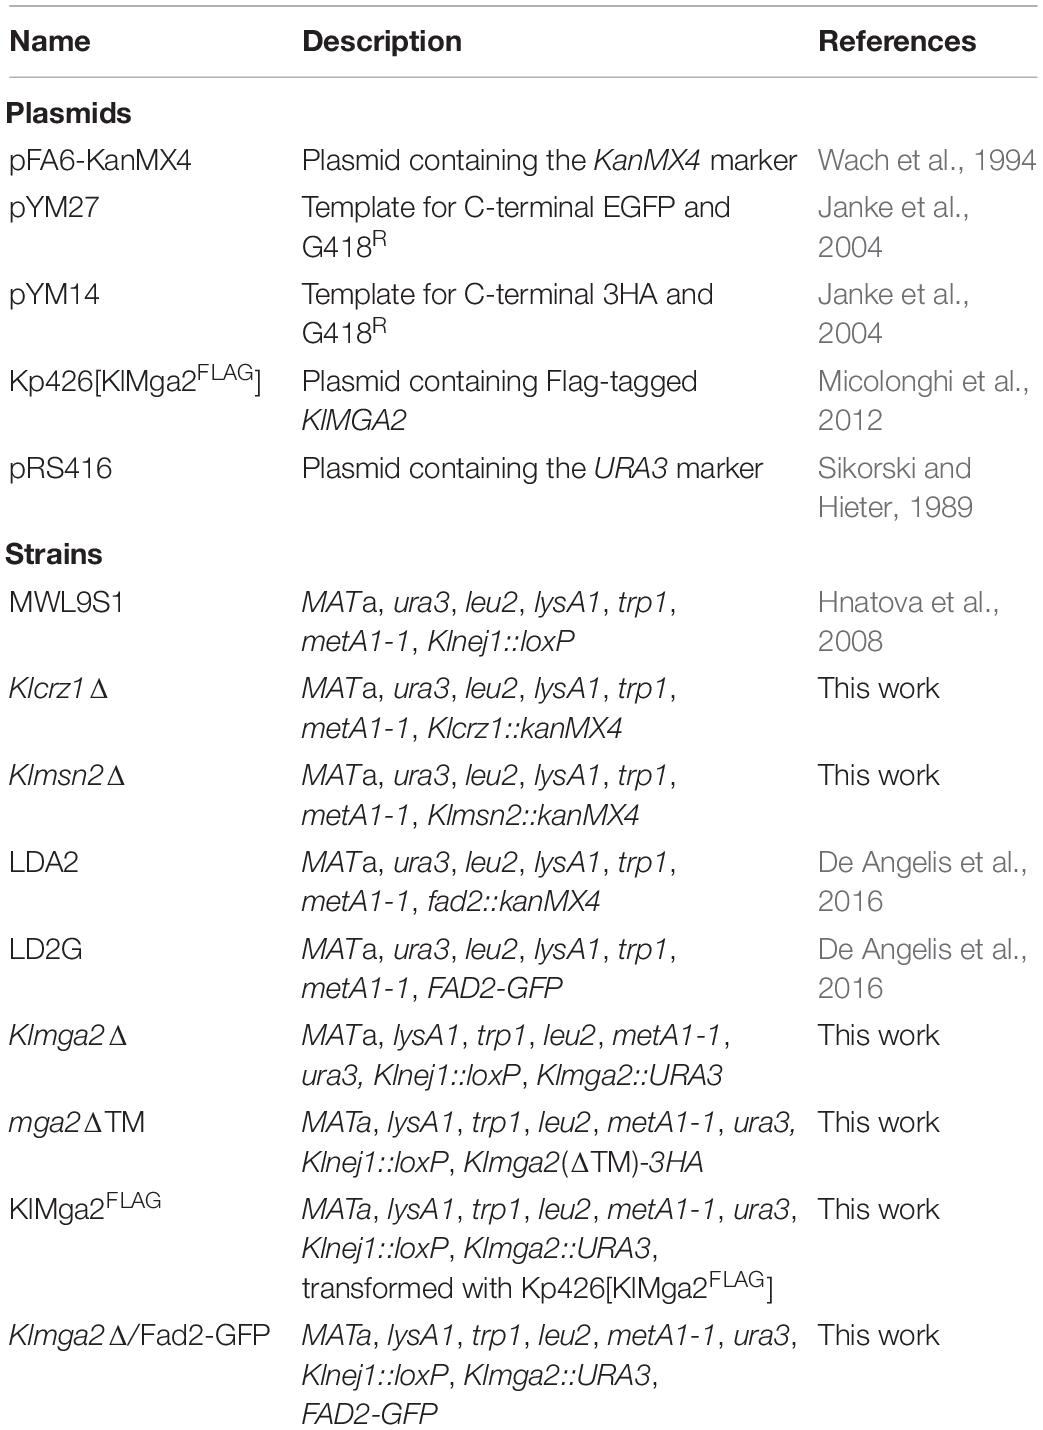
Table 1. Plasmids and strains.
Strains MWL9S1/crz1Δ, MWL9S1/msn2Δ, and MWL9S1/Klmga2Δ were obtained by disruption of KlCRZ1 (ORF KLLA0E08713g), KlMSN2 (ORF KLLA0F26961g), or KlMGA2 (ORF KLLA0E17953g) with the KanMX4 cassette or URA3 deletion cassettes, which have been generated by the short flanking sequences-PCR method (Janke et al., 2004) (Vent DNA Polymerase; New England Biolabs). DNAs were amplified using the primers 1–6 (Supplementary Table 1) and plasmid pFA6-KanMX4 (Addgene, Table 1) as DNA template containing KanMX4 or the plasmid pRS416 (Stratagene, Table 1) as DNA template containing URA3 marker. The purified PCR products were then used to transform MWL9S1 strain by electroporation. Transformed colonies were selected on YPD solid medium supplemented with Geneticin (G418) on SD solid medium without uracil and then analyzed by PCR (Taq Pol, Jena Bioscience). Strain MWL9S1/mga2ΔTM was obtained in the same way by disruption of C-terminal membrane-anchoring domain coding sequence in KlMGA2 (from codon 833 of protein KLLA0E17953p) using plasmid pYM14 (Euroscarf, Table 1) as template bearing the 3HA-KanMX4 cassette (primers 7 and 8, Supplementary Table 1). FAD2 gene was fused in frame with GFP sequence in Klmga2Δ strain, by a PCR-based strategy (Janke et al., 2004) using plasmid pYM27 (Euroscarf, Table 1) as template bearing the EGFP-KanMX4 cassette to obtained Klmga2Δ/Fad2-GFP strain. Yeast strains were obtained by transformation with the electroporation procedure as previously described (Salani and Bianchi, 2006).
Total RNAs were prepared by the hot phenol procedure as described by Köhrer and Domdey (1991) from cultures grown to OD600 = 1 ± 0.2 in light or dark conditions, and then collected or subjected to the opportune light/dark shift. Integrity of total RNAs extracts was controlled by electrophoresis on agarose-formaldehyde gel. RNA concentration was determined by measuring the absorption at 260 nm. Transcript analysis was performed by qRT-PCR. Total RNA (1 μg) was retro-transcribed to cDNA using QuantiTect Reverse Transcription Kit (Qiagen), following instructions. One sample not retro-transcribed was used as negative control. cDNA amplification was performed using KAPA Sybr Fast 2X (Sigma-Aldrich) with the appropriate couple of 10 μM primers (Supplementary Table 1) and 2 μl of the cDNA (100 ng). All the samples, except for the negative controls, were loaded in double for a technical replicate. The experiments were then conducted using the Rotor Gene Q (Qiagen), and data were analyzed using the provided software. The cycling was set with 3 min at 95°C for enzyme activation, then 40 cycles at 95°C for 3 s and 30 s at 60°C, followed by a final step for generation of melting curve, ranging from 60° to 95°C. Quantification was performed by the construction of a standard curve with genomic DNA from MWL9S1 with five points of serial dilutions (the R2 obtained for the curve was always higher than 0.99) and by the relative quantification of the samples of interest, using amplification of 18S rDNA as reference (Santomartino et al., 2019b).
Cultures were grown to OD600 = 1 ± 0.2 and then collected or shifted to light or dark conditions for different time points, depending on the experiment. Cells were harvested and suspended in 200 μl of sterile water. An equal volume of 0.2 N NaOH was added and cells were incubated at room temperature for 5 min, then centrifuged for 2 min at 10,000 g. After elimination of the supernatant, pellets were suspended in Laemmli buffer (60 mM TrisHCl pH 6.8; 50% glycerol; 2% SDS; 5% β-mercaptoethanol; 2% bromophenol blue). Total protein extract amount was quantified by measuring absorption at 280 nm (NanoDropTM 2000 spectrophotometer, Thermo Fisher Scientific). The samples were boiled for 5 min or incubated at 65°C for 10 min, kept on ice for 2 min and centrifuged at 10,000 g for 1 min, then loaded on 8–10% acrylamide (Sigma-Aldrich) gel for SDS-PAGE. After electrophoresis, proteins were transferred to PVDF transfer membrane (Merck Millipore). Western blotting was performed with different primary antibodies (sc-7392 anti-HA Santa Cruz Biotechnology; sc-9996 anti-GFP Santa Cruz Biotechnology; F4042 anti-flag Sigma-Aldrich) and horseradish peroxidase-conjugated secondary antibody (sc-516102 anti-mouse Santa Cruz Biotechnology). Detection was performed with ECL Western blotting detection reagents (LiteAblot EXTEND, EuroClone or Western Bright Quantum, Advansta) and visualized by ChemiDocTM MP Imaging System (Biorad). α-Tubulin (sc-53030 Santa Cruz Biotechnology) or Ada2 (ab215524 AbCam) detections were used as loading controls.
Cells (3–4 OD600 units) were collected from cultures, and extracts were prepared by glass beads crushing in lysis buffer (50 mM Tris-HCl pH 6.8; 100 mM NaCl). Protein content in samples was determined at 280 nm (NanoDropTM 2000, Thermo Fisher Scientific). To determine catalase activity, 1–1.5 μl aliquots of samples were added to 0.5 ml of 11 mM H2O2 (Sigma-Aldrich) in 50 mM phosphate buffer pH 7.0; 1 μM EDTA. H2O2 decomposition was monitored at 25°C at 240 nm (ε240 = 39.4 M–1 cm–1). Superoxide dismutase activity was determined by measuring the rate of WST1-Formazan formation, using the SOD Assay kit-WST (Sigma-Aldrich), as suggested by the supplier. Calibration curve was determined using a commercial Sod enzyme (Sigma-Aldrich). Activity measurements have been performed in two to four biological repetitions, each of them in technical triplicates. Standard deviations and statistical significances (P-values) have been determined.
Exponentially growing cells on YPD medium were observed with a Zeiss Axio Imager Z1 fluorescence microscope with an AxioVision 4.8 digital image processing system, and oil 63× objective lens. Culture (100 μl) was centrifugated, washed with sterile water, and then resuspended in 100 μl of 0.1 mM 2-(p-dimethylaminostryryl)-l-methylpyridinium iodine (DASPMI). Fluorescence could be detected 5–10 min after addition of the dye to the cells. The fluorescence was observed using DASPMI filter sets (550/25 nm excitation and 605/670 nm emission). DASPMI maximal absorption wavelength is 429 nm, and maximal emission wavelength (excitation at 467 nm) is 557.5 nm in water (Bereiter-Hahn, 1976; Ramadass and Bereiter-Hahn, 2008).
Respiration was analyzed by measuring the oxygen consumption rate using a Clark oxygen electrode (Hansatech Instruments) as described in De Luca et al. (2009). Cells (1 × 10⁶) from exponential cultures (1 ÷ 4 × 10⁶ cells ml–1) were collected, washed with 1 ml sterile water, suspended in 1 ml sodium phosphate buffer (10 mM pH 7.4, containing glucose 4 g L–1), and loaded in the reaction vessel of the previously calibrated oxygen electrode chamber.
FAs were extracted from cells grown to OD600 = 1 in light or dark exposition. Lyophilized cells of K. lactis were extracted following the method described in Ludovici et al. (2014). Internal reference standard was the 9(S)-HODE-d4 (Cayman) at the final concentration of 1 μM. The samples were extracted with 2 ml of isopropyl alcohol:water:ethyl acetate (1:1:3 v/v) mixture with 0.0025% w/v of butylated hydroxytoluene. The extracts were dried by nitrogen flux and resuspended with 100 μl of methanol. The samples have been analyzed with LC (HPLC 1200 series rapid resolution) coupled to a triple quadrupole MS (G6420 series triple quadrupole, QQQ) equipped with an electrospray ionization source (ESI). The equipment, the chromatographic column, and the analysis software were from Agilent Technologies. The chromatographic separation has been performed with a Zorbax ECLIPSE XDB-C18 rapid resolution HT 4.6 × 50 mm 1.8 μm p.s. column. FAs were analyzed by single ion monitoring (SIM) method in negative. The elution program requires the following mobile phase: phase A water/acetonitrile 97:3 v/v containing 0.1% formic acid and 3% acetonitrile, and phase B: acetonitrile/isopropyl alcohol 90:10 v/v. The injection volume was 10 μl. Instrument setting was reported previously (Ludovici et al., 2014). The SIM parameters have been obtained by flow injection of authentic standard and agreed with the literature (Yang et al., 2009; Beccaccioli et al., 2021). FA mass and relative parameters of analysis are reported in Table 2. SIM data have been processed using Mass Hunter Quantitative software. Membrane fluidity, expressed as the FA unsaturation index (UI), was calculated as follows: [(%C16:1 + %C18:1) + (%C18:2 × 2) + (%C18:3 × 3)]/100.
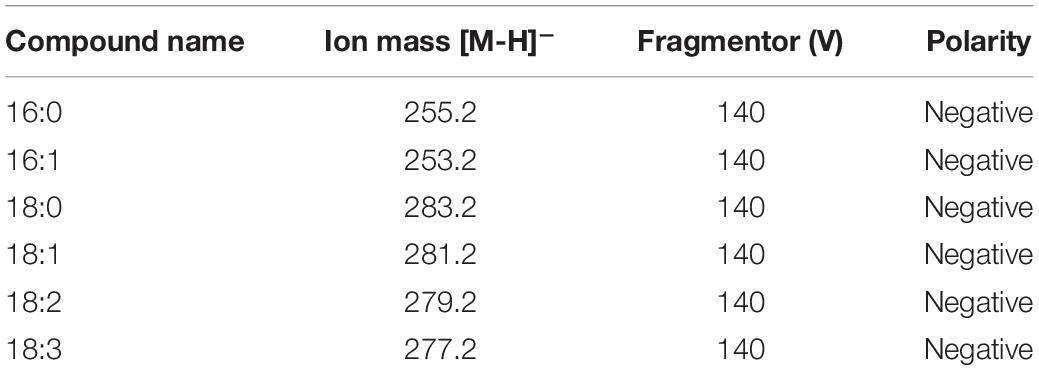
Table 2. Fatty acid SIM method.
In order to test the role of KlMga2, KlMsn2, and KlCrz1 in light-dependent response, we constructed deletion mutants into K. lactis MWL9S1 strain (Wésolowski-Louvel, 2011). The identification of KlMGA2 has been described previously (Micolonghi et al., 2012). The homologs of CRZ1 and MSN2 were identified in K. lactis genome using BLAST: KlMSN2 (ORF KLLA0F26961g) had 24% identity and 35% similarity with MSN2; KlCRZ1 (ORF KLLA0E08713g) had 28% identity and 40% similarity with CRZ1 (Bussereau et al., 2006; Barsoum et al., 2011). These mutant strains were named Klmga2Δ, Klcrz1Δ, and Klmsn2Δ, respectively. Likewise, we generated an additional Klmga2Δ mutant strain harboring a truncated form of KlMGA2 (mga2ΔTM strain): the latter contained KlMga2 lacking C-terminal transmembrane domain (TM), that in S. cerevisiae represses Mga2 protein activity (Chellappa et al., 2001; Huang and Kao, 2018). We assumed that the mga2ΔTM strain coded for an always active truncated KlMga2 protein. Genotypes of these four mutant strains, obtained as described in the “Materials and Methods” section, are reported in Table 1.
We have previously shown (Ottaviano et al., 2015) that the deletion of KlMGA2 in the wild type GDK strain caused a reduced growth rate compared to wild type. We performed the growth experiment on standard glucose medium in light or darkness condition with MWL9S1 strain and the derived Klmga2Δ mutant strain (Figure 1). According to our previous results with the mutant strain GDK/Klmga2Δ, we observed that the deleted strain presented a longer lag phase and a slower growth rate as compared to wild type MWL9S1. Interestingly, incubation in dark or light conditions significantly affected the growth rate of mutant strain: in fact, the duplication time of deleted strain in the exponential phase shifted from about 6 h in light to 4 h in darkness, while the wild type duplication time only changed from 2.7 h in light to 2.2 h in darkness condition, respectively.
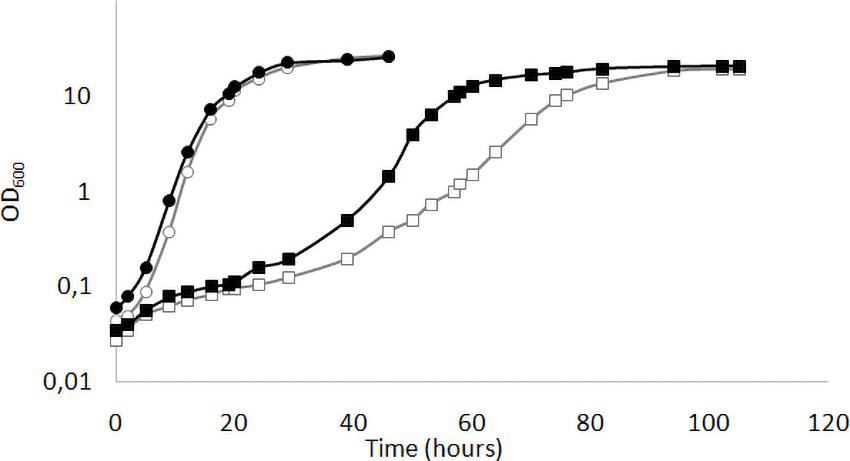
Figure 1. Growth profiles of Klmga2Δ strain in light or dark exposure. Typical growth curves of the wild type MWL9S1 (circles) and the Klmga2Δ mutant strains (squares) in standard YPD medium are reported as optical density (OD600) vs. time (hours). Black and white symbols refer to darkness and light cultivation, respectively. Repeated experiments gave similar results.
Previous studies showed that the desaturase gene FAD2 is a target of KlMga2 (Ottaviano et al., 2015). However, light or dark incubation did not interfere with growth rates of fad2Δ strain (LDA2 strain, Table 1). The presence of light or darkness did not interfere significantly also with strain Klmsn2Δ: both results are reported in Supplementary Figure 1.
We previously reported (Ottaviano et al., 2015) that KlMGA2 deletion affected FA biosynthesis, respiration rate, and mitochondrial morphology. To establish the occurrence of a light-dependent connection between growth and respiration rates of Klmga2Δ strain, we measured oxygen consumption rates of exponentially growing MWL9S1 wild type and Klmga2Δ mutant cells cultured in light or darkness using a Clark electrode, as described in the section “Materials and Methods.” Results are reported in Figure 2. Average of three independent measurements indicated that the wild type cells consumed oxygen faster than deleted strain and consumption rate was independent on light (1.5 ± 0.05 nmol O2 ml–1 s–1) or dark (1.54 ± 0.04 nmol O2 ml–1 s–1) growth. Differently, the deleted strains showed higher oxygen consumption rate when grown in darkness (0.92 ± 0.01 nmol O2 ml–1 s–1) than in light condition (0.69 ± 0.03 nmol O2 ml–1 s–1). Similarly to growth rate, the defective respiration rate of the deleted strain was exacerbated by light exposure while no effect of light could be recorded in the presence of KlMga2. Data reported in Supplementary Figure 2 showed that light or dark did not affect the respiration rates of Klmsn2Δ and fad2Δ strains.
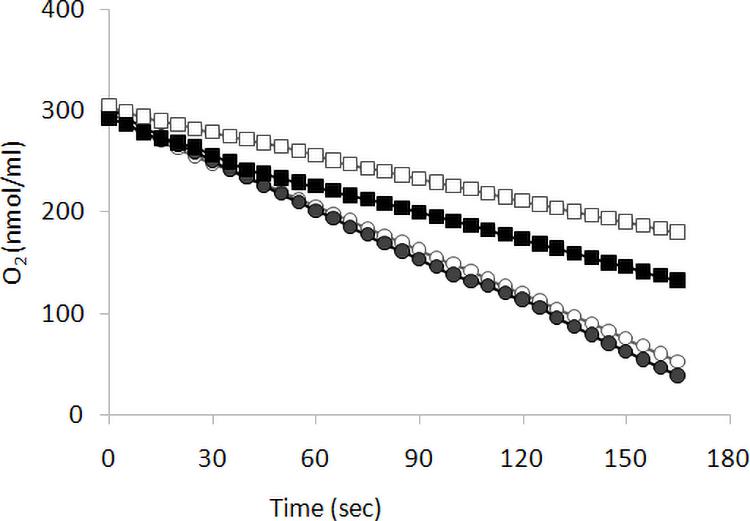
Figure 2. Respiration rate. Respiration was determined as oxygen consumption rate (oxygen slope: nmol O2 ml–1 s–1) by wild type (circles) and of Klmga2Δ mutant cells (squares), grown exponentially in YPD medium. Black and white symbols refer to dark and light cultivation, respectively. Repeated experiments gave similar slopes: average values and standard deviations of the repeated experiments are reported in text.
In order to investigate mitochondrial morphology and activity, cells were stained with the functional dye DASPMI. This staining allows to visualize functional mitochondrial membranes with an active potential by fluorescence microscopy (Bereiter-Hahn, 1976). Results, reported in Figure 3A and Supplementary Figure 3, revealed that the mitochondrial membranes of the Klmga2Δ mutant strains, as well as those of the wild type strain, were visualized by DASPMI staining suggesting a correct mitochondrial functionality. Nevertheless, as previously reported (Ottaviano et al., 2015), mitochondrial network of Klmga2Δ strain frequently showed a non-tubular collapsed morphology under light conditions. However, when the Klmga2Δ cells were grown in the darkness, the percentage of cells bearing normal tubular mitochondria was significantly increased to the same level as the wild type (Figure 3B). We observed a normal mitochondrial morphology in Klmsn2Δ, fad2Δ, and mga2ΔTM strains (data not shown).
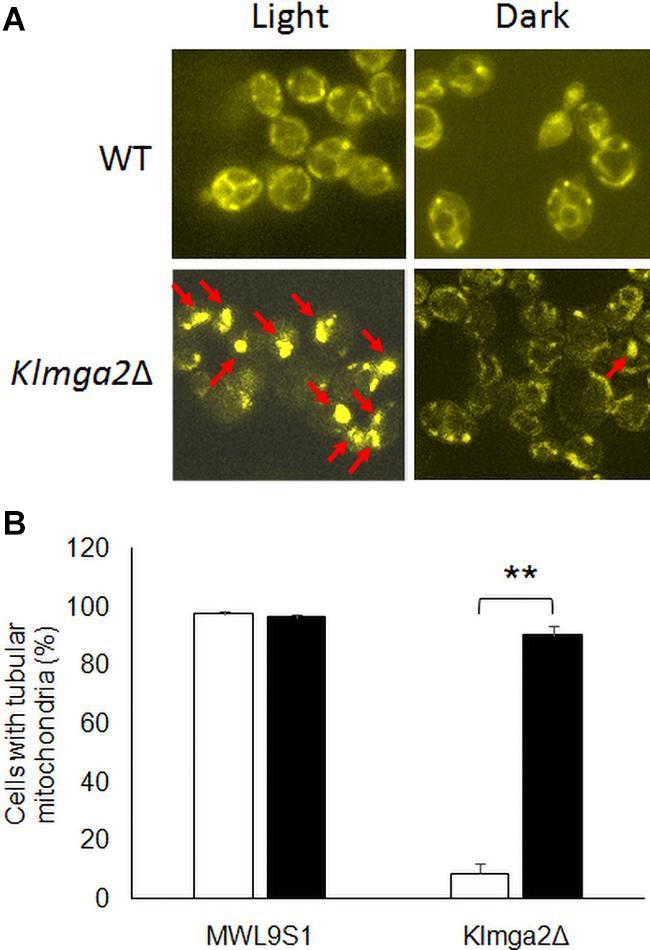
Figure 3. Fluorescence microscopy analysis of wild type and mutant strains Klmga2Δ. (A) Reports DASPMI staining of the mitochondrial network of wild type MWL9S1 and Klmga2Δ strains. The red arrows show the non-tubular collapsed mitochondrial network. (B) Shows histogram reporting the percentages of tubular mitochondria-containing cells. White and black blocks refer to light and darkness cultivation, respectively. Growth medium was YPD. Two or three independent cultures were performed for each strain/condition, and 100–700 cells were analyzed. Standard deviations (SD) are reported. ** indicates p < 0.01.
The Klmga2Δ strain in the MWL9S1 background had a rag- phenotype (sensitivity to the mitochondrial drug antimycin A on high glucose concentration: GAA medium, Figure 4) as previously reported for another K. lactis strain (Micolonghi et al., 2012). The rag- phenotype is usually due to defects in the glycolytic and/or fermentative pathways or in their regulation (Wésolowski-Louvel et al., 1992) pointed out by respiration blockage; however, the deletion of KlMGA2 did not impeded hypoxic growth or ethanol production (Ottaviano et al., 2015), indicating that the inability of the deleted strain to grow when oxidative phosphorylation is impaired was not to be ascribed to mere metabolic defect. We assayed the effect of darkness on the rag- phenotype of the deleted strain (Figure 4), but no difference with light stress could be recorded, suggesting that blockage of electron transport required KlMga2 for growth in both conditions. Surprisingly, the deletion of KlMSN2 did not affect growth in the presence of antimycin A under light stress but a slight reduction of growth was observed in darkness. Deletion of FAD2 and KlCRZ1 did not influence growth on antimycin A in light or darkness (Supplementary Figure 4). Expression of the KlMga2 truncated form in strain mga2ΔTM allowed wild type growth in the presence of light (Supplementary Figure 4); however, growth in darkness was more similar to the deleted strain than the wild type and the presence of antimycin A slightly reduced grow rate in both light and darkness.
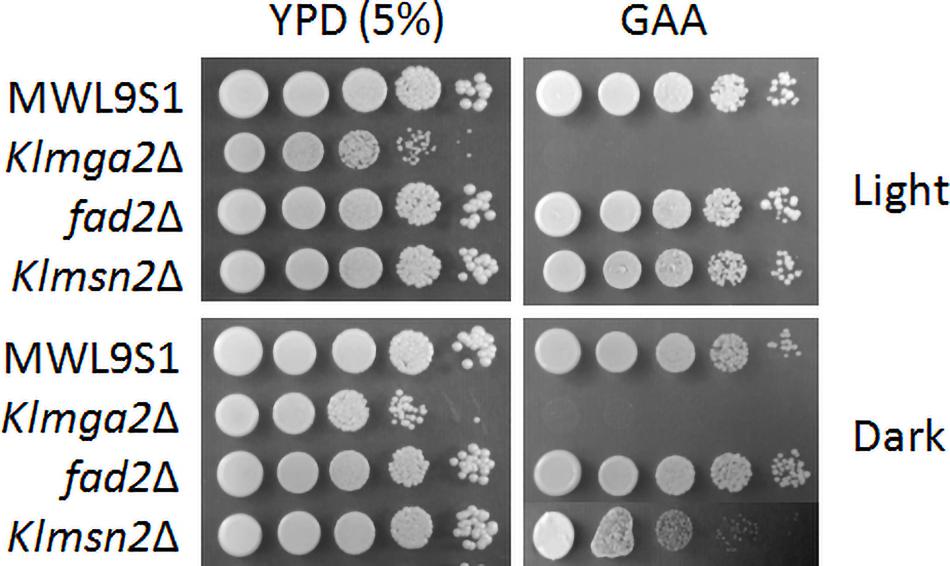
Figure 4. Growth on different media of wild type strain MWL9S1 and mutant strains. Cultures were grown overnight in YPD at 28°C in light or dark conditions, serially diluted, and plated onto YPD plates (5% glucose) without or with antimycin A (GAA plates). Plates were incubated at 28°C under light or dark conditions for 3–4 days. Two or three independent cultures were performed for each strain/condition. Representative samples are shown.
In S. cerevisiae Mga2 is present in two forms: p120, an inactive 120 kDa precursor form that is anchored to the ER membrane by the C-terminus, and p90, a soluble 90 kDa N-terminus fragment which is the nuclear active form. Mga2 activation requires appropriate stimuli, such as hypoxia or low temperature, to induce p120 ubiquitylation and the consequent proteolytic activation process by the proteasome. Activation of the precursor p120 releases the soluble and active transcriptional activator p90 from the ER to the nucleus, where it drives the gene expression mediated by stress responsive elements (STRE) (Covino et al., 2016).
In order to assess the role of light in KlMga2 activation, we transformed the Klmga2Δ strain with a plasmid containing a modified KlMGA2Flag gene, encoding a N-terminus tagged protein, and we investigated KlMga2 protein maturation under light or dark growth conditions by Western blot. Results (not shown) revealed that KlMga2 proteolytic activation occurred independently on light or dark conditions with similar efficiency.
Collapsed mitochondria are often associated to ROS accumulation and impaired response to oxidative stress: we previously observed that GDK/Klmga2Δ strain showed a stronger protection against ROS by over-expressing ROS detoxification enzymes catalase (Cat) and superoxide dismutase (SOD) in the exponential growth phase as compared to wild type strain (Santomartino et al., 2019a). The deletion of KlMGA2 also caused an increased chronological life span (Santomartino et al., 2019a).
Studies on S. cerevisiae reported that light is converted to an oxidative stress signal inside the cell (Bodvard et al., 2017). To assess if light exposition activates an oxidative stress response in K. lactis, we assayed the production of SOD and KlCtt1/KlCta1 enzymes by transcription analysis of KlSOD1, KlSOD2, KlCTA1, and KlCTT1 genes (Figure 5) and by measuring SOD and catalase enzymes activity (Figure 6). Wild type and Klmga2Δ strains were cultivated in standard YPD medium in light and dark conditions to exponential growth phase. Results of transcription analysis, performed by qRT-PCR, showed that in the wild type strain transcript levels of the four genes did not change between light and dark growth condition (Figure 5). On the contrary, the transcription levels of KlSOD1 (cytosolic SOD) and KlSOD2 (mitochondrial SOD) genes were higher in the mutant strain than the wild type when cells were grown in light (Figures 5A,B). We also observed a 10-fold higher transcription level of KlCTT1 (cytosolic Cat) gene in the mutant strain with respect to the wild type cells in both light and dark condition (Figure 5D). Differently, the transcription levels of KlCTA1 (peroxisomal Cat) gene were not significantly different between Klmga2Δ mutant and wild type cells (Figure 5C).
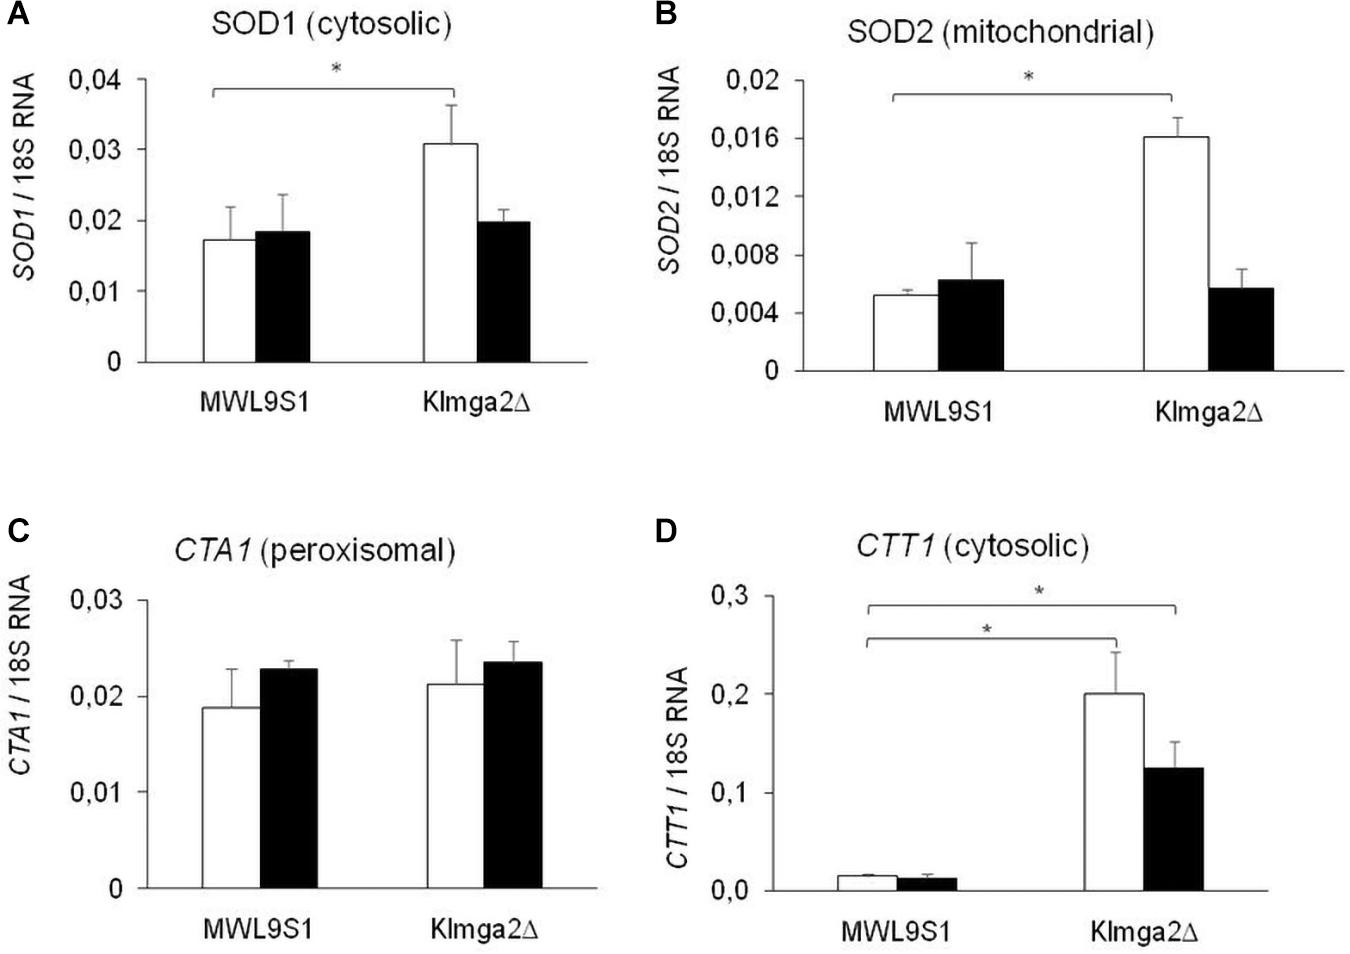
Figure 5. Transcription of KlSOD1, KlSOD2, KlCTA1, and KlCTT1 genes. Results of qRT-PCR analysis of Catalase (Cat) and SOD genes in wild type MWL9S1 and in Klmga2Δ mutant strain grown in YPD flask cultures in light (white blocks) or dark (black blocks) condition are reported. (A–D) report KlSOD1, KlSOD2, KlCTA1, and KlCTT1 transcription analysis, respectively. Ribosomal 18S gene transcription has been used as reference. Values are averages of three independent determinations, each measured by two technical repetitions, with SD reported. ∗ indicates p < 0.05.
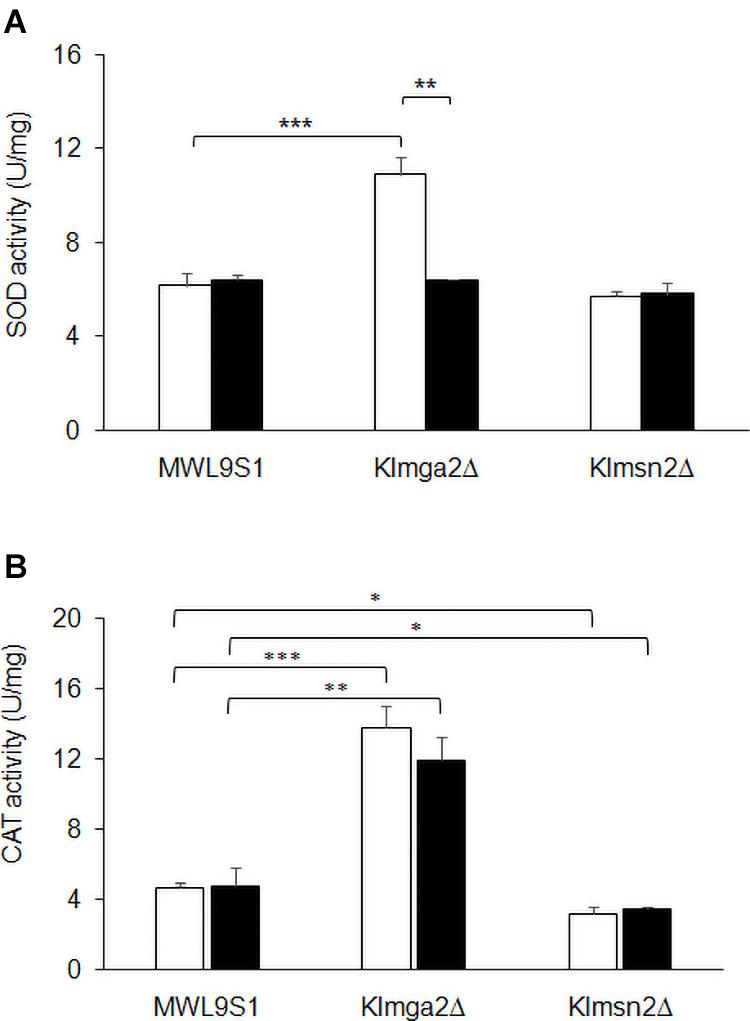
Figure 6. Activity of SOD and catalase enzymes. Total extracts from wild type MWL9S1, Klmga2Δ and Klmsn2Δ strains, grown in light (white blocks) and dark (black blocks) conditions up to exponential phase, were assayed for catalase and superoxide dismutase activities. (A) shows SOD activities (U mg–1): values are averages of three independent determinations, each measured by three technical repetitions, with standard deviations reported. (B) shows KlCtt1/KlCta1 activities (U mg–1): values are averages of two to four independent determinations, each measured by three technical repetitions, with SD reported. Significances: *p < 0.05; **p < 0.01; and ***p < 0.001.
To assess if increased transcription of the selected genes corresponded to increased enzyme activities, SOD and KlCtt1/KlCta1 activities were measured in cell extracts at the exponential growth phase. Results are reported in Figure 6. Both SOD and KlCtt1/KlCta1 activity levels in wild type strain resulted independent on light or dark exposition. On the contrary, SOD activity in Klmga2Δ mutant cells (Figure 6A) resulted higher in light condition (10.9 ± 0.73 U mg–1 mg–1), while in dark condition it was very similar to wild type (6.4 ± 0.04 U mg–1). Differently, KlCtt1/KlCta1 activity (Figure 6B) in Klmga2Δ mutant cells was higher both in dark (12.0 ± 1.31 U mg–1) and light (13.8 ± 1.18 U mg–1) growth conditions compared to wild type (4.8 ± 1 and 4.7 ± 0.33 U mg–1 in dark and light, respectively).
We performed enzyme activities assays in the Klmsn2Δ strain too, since in S. cerevisiae Msn2 upregulates the cytosolic catalase gene CTT1 (Hasan et al., 2002), which resulted strongly transcribed in Klmga2Δ mutant cells (Figure 5D). In the Klmsn2Δ strain, we found a significantly decrease of KlCtt1/KlCta1 activity (3.2 ± 0.38 U mg–1 and 3.5 ± 0.14 U mg–1 in light and dark condition, respectively; Figure 6B) in respect to wild type cells, suggesting that also in K. lactis Msn2 upregulates the activity of catalases. No significant changes of SOD activity compared to wild type were found in the Klmsn2Δ mutant.
Previous studies showed that FA composition of membranes is modulated by hypoxia in S. cerevisiae (Vasconcelles et al., 2001), by temperature and also by light exposure, especially in plant and bacterial cells (Kis et al., 1998; Hernández et al., 2011), as a stress adaptation response. We reported that K. lactis strain GDK/Klmga2Δ has an altered membrane composition and an inhibited hypoxic induction of the desaturase gene FAD2, which was the main FA desaturation target gene of KlMga2 (Ottaviano et al., 2015). We aimed studying a possible light regulation of desaturases expression in K. lactis, in particular, a KlMga2-dependent response to light. To this purpose, we first focused our study to the desaturase FAD2 gene expression after light to dark and dark to light shifts. Results of qRT-PCR, reported in Figure 7, showed that the transcription levels of FAD2 in wild type strain were influenced by light exposure. In detail, the shift from light to darkness caused a transient increase of transcription with a significant peak at 40 min from transition, while a progressive FAD2 transcript reduction could be observed by shifting from darkness to light. Differently, the expression of FAD2 in the Klmga2Δ mutant strain resulted substantially unchanged during light/dark shifts.
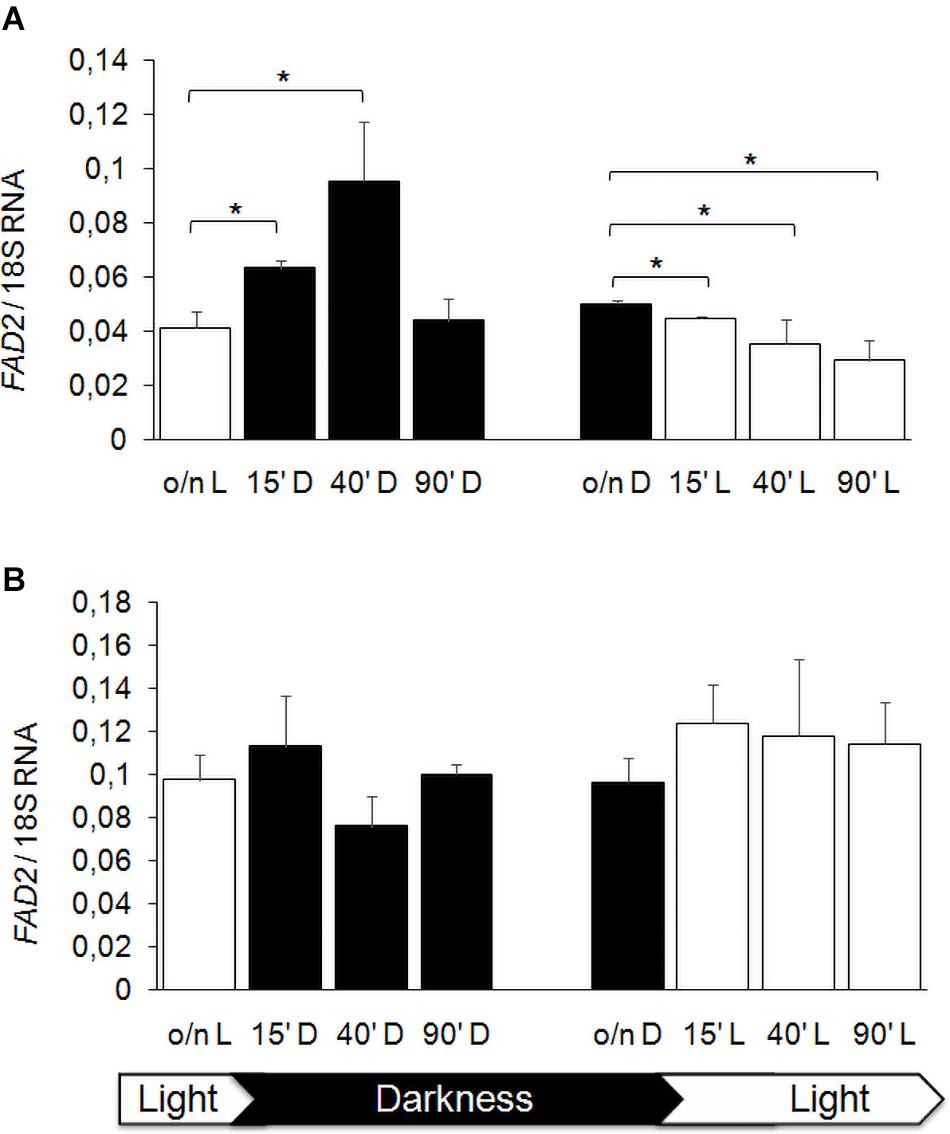
Figure 7. FAD2 transcription after light and darkness shifts. Wild type (A) and Klmga2Δ (B) strain cells were grown overnight in light (o/n L) or darkness (o/n D) and then shifted to darkness (D) or light (L), respectively, for 15, 40, and 90 min before nucleic acid extraction and qRT-PCR. Values are averages of three independent determinations with SD. Transcription of ribosomal 18S gene was used as reference. * indicates p < 0.05.
The expression profile of FAD2 in wild type strain was confirmed assaying Fad2 protein levels by Western blot (Figure 8). The shift from light to darkness caused a transient increase of Fad2 expression with a significant peak at 60 min from induction; from darkness to light, our results showed a Fad2 reduction after 120 min of light exposure.
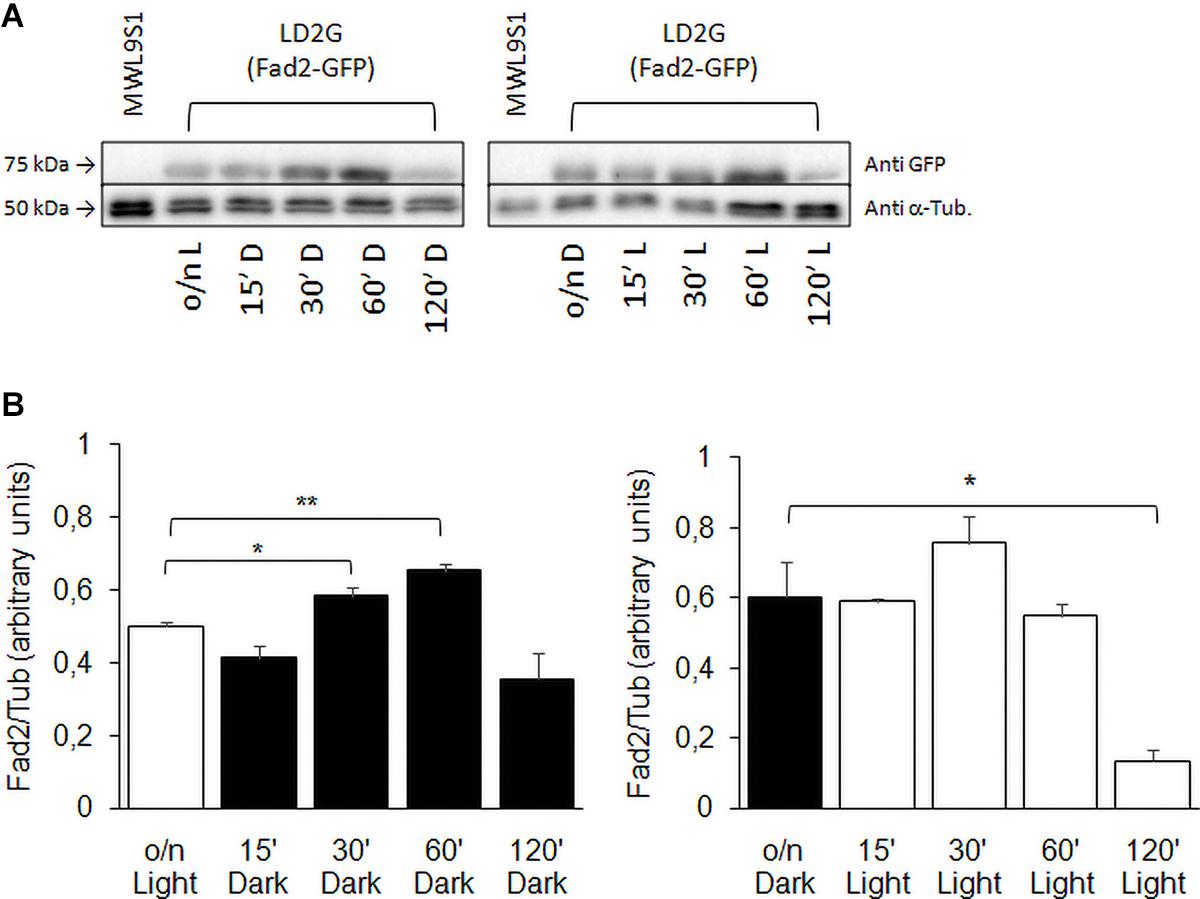
Figure 8. Fad2 enzyme production in wild type strain with FAD2 fused to EGFP. (A) Shows Western blot against GFP-fused Fad2 protein, using strain LD2G (De Angelis et al., 2016). Cells were grown overnight in light or darkness and then shifted to darkness or light for 15, 30, 60, and 120 min. α-Tubulin detection was used as loading control. (B) Reports Fad2-GFP signal quantification with respect to α-Tubulin: values are averages of three independent determinations with SD. Significances: *p < 0.05; **p < 0.01.
Desaturases control the synthesis of unsaturated FAs and, consequently, composition of membranes. We performed FA analysis of wild type and Klmga2Δ mutant cells grown overnight in light or darkness (Figure 9). In the wild type strain, we observed a significant higher level of total FAs when cells were grown in light rather than in darkness, while in the mutant strain, FAs were high independently on light or darkness (values: Figure 9A). We calculated the Unsaturation Index (UI), a parameter of membrane fluidity: a low UI indicates a low fluidity of the membrane lipids due to a reduced percentage of unsaturated carbon–carbon bonds in FA molecules. Results in Figure 9B indicated a lower UI for the mutant strain with respect to the wild type, as also previously reported (Ottaviano et al., 2015), regardless on light (1.71 ± 0.005 vs. 1.93 ± 0.03) or dark (1.65 ± 0.004 vs. 1.81 ± 0.03) exposure. In addition, we have observed that UI was higher in both strains when cultivated in light condition as compared to darkness.
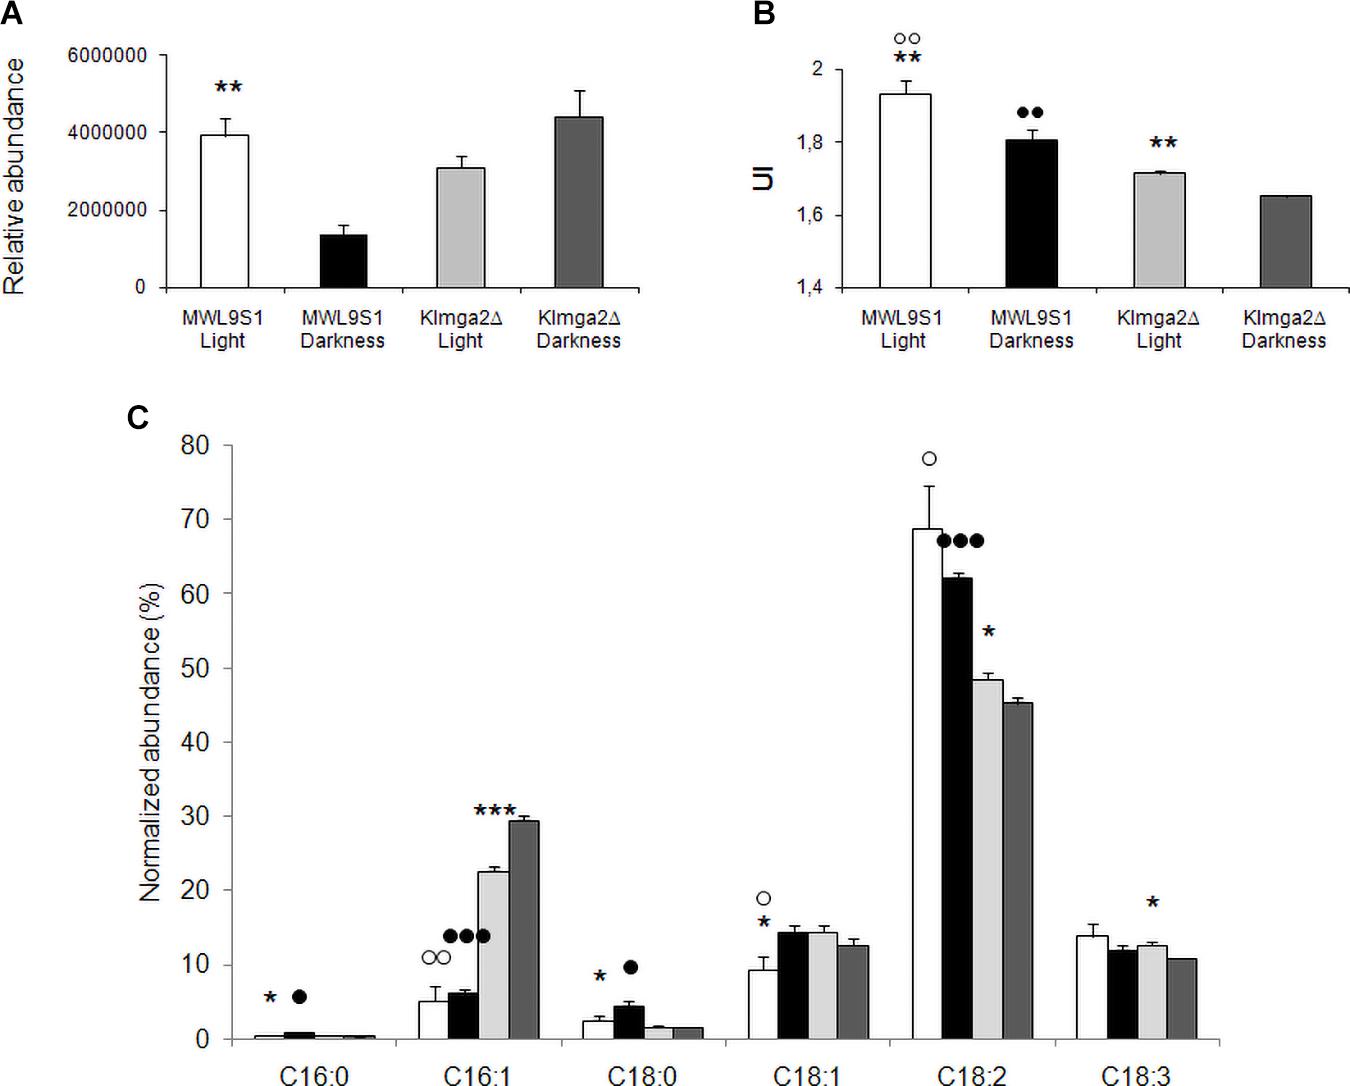
Figure 9. Fatty acid composition of the wild type MWL9S1 and Klmga2Δ mutant strain. Cells were grown in overnight light or darkness. (A,B) Report total fatty acid (FA) content (relative abundance with respect to 9-hydroxy octadecadienoic d4 acid, 9-HODE d4) and unsaturation indexes (UI) of the wild type and deleted mutant strain, respectively, with SD reported. (C) Reports amounts of palmitic (C16:0), palmitoleic (C16:1), stearic (C18:0), oleic (C18:1Δ9), linoleic (C18:2Δ9,Δ12), and linolenic (C18:3Δ9,Δ12,Δ15) acids (relative abundance with respect to HODE, normalized to the total amount of FAs). Results with SD are means of three independent determinations. Statistical relevance: stars = light vs dark, white dots = wild type vs mutant (light conditions), black dots = wild type vs mutant (dark conditions); one star or white/black dot = p < 0.05, two stars or white/black dots = p < 0.01 and three stars or white/black dots = p < 0.001.
The detailed analysis of palmitic (C16:0), palmitoleic (C16:1), stearic (C18:0), oleic (C18:1), linoleic (C18:2), and linolenic (C18:3) acids is reported in Figure 9C. In the wild type strain, the growth in darkness resulted in an increase of saturated palmitic and stearic acids and of the mono-unsaturated (MUFA) oleic acid: the reduction of UI in darkness depended on the compensatory decrease of poly-unsaturated (PUFA) linoleic and linolenic acids. In the mutant strain we observed slightly different profile: the significant increase of palmitoleic acid was compensated by the decrease of C18 unsaturated oleic, linoleic and linolenic acids. The most relevant differences between the wild type and the mutant strains were significant increase of palmitoleic acid in the mutant strain, both in light and darkness growth (and oleic, but only in light), and the significant reduction of linoleic acid in the mutant strain, again in both light and darkness conditions.
These changes might depend on different production of the desaturases Ole1 and Fad2 in the mutant strain. To verify this hypothesis, we determined the amount of Fad2 by Western blotting in the wild type and in the mutant strains grown in light and darkness. Results, reported in Figure 10, showed a significant reduction of Fad2 in the mutant strain with respect to the wild type, when grown under light stress, suggesting that, at least in light condition, the reduction of linoleic acid could be correlated to reduction of the corresponding biosynthetic enzyme.
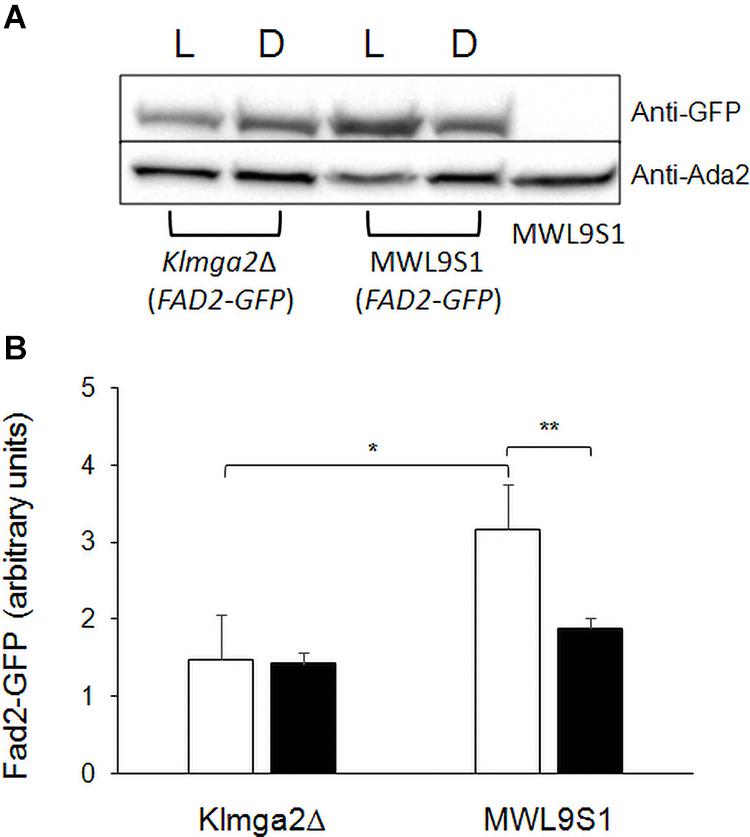
Figure 10. Fad2 production in Klmga2Δ mutant strain and wild type. (A) Shows a Western blot against Fad2-GFP protein, using extracts of strains LD2G and Klmga2Δ/Fad2-GFP grown overnight in light (L) and dark (D) conditions. Ada2 protein was used as loading control. (B) Reports a Fad2-GFP signal quantification of repeated Western blot experiments. White blocks represent Fad2-GFP in light and black blocks in darkness, respectively. SD are indicated. Statistical significance: *p < 0.05, **p < 0.01.
Light is an ubiquitous and free source of energy. Light availability allowed the evolution of organisms endowed of biochemical systems able to capture and use this energy for biosynthesis. Also organisms lacking such molecules or proteins are subjected to light and are possibly set to respond to its exposure. Microorganisms like the unicellular yeasts K. lactis and S. cerevisiae do not have recognized light-responsive protein or photo-receptive molecules but are transparent to light and their metabolism and physiology might be influenced by light.
Very few data, related to the light response in yeast, are available. In S. cerevisiae, the two regulatory factors Msn2 and Crz1 are environmental-stress regulators and a similar function has been recorded also for Msn2 in K. lactis (Barsoum et al., 2011). Msn2 and Crz1 are also light-dependent proteins in S. cerevisiae, translocated to nuclei under light exposition (Cai et al., 2008; Bodvard et al., 2011), suggesting a possible light-stress response dependent on the expression of specific target genes. Light signaling can be mediated in S. cerevisiae by the synthesis of hydrogen peroxide and the activity of PKA through the action of Pox1/Tsa1/Trx1 enzymes (Bodvard et al., 2017). All these elements are also present in K. lactis (TPK1/2: KLLA0B07205g, TPK2: KLLA0D03190g, BCY1: KLLA0E04181g, POX1: KLLA0F09933g, TSA1: KLLA0B01628g, TRX1: KLLA0E16347g), suggesting that a similar mechanism might be active also in this yeast.
In wild type K. lactis cells, light had no effects on growth rate. Differently, in the absence of KlMGA2 gene, growth in darkness proceeded faster than in light, suggesting that that light could act as stressing element respect to growth and that KlMga2 could counteract light effect, protecting cells from adverse events. An altered membrane composition of the Klmga2Δ strain is a direct consequence of the reduced expression of FAD2, which is a main target of KlMga2 (Ottaviano et al., 2015). However, the deletion of FAD2 gene did not affect light growth, suggesting that the differences in growth between light and dark conditions observed in the Klmga2Δ strain should not be a direct consequence of the altered FAs membrane composition that characterizes the mutant strain.
We have previously reported that the deletion of KlMGA2 causes altered mitochondrial morphology and respiration rate (Ottaviano et al., 2015). The recovery of normal mitochondrial morphology and the increase of respiration rate of the Klmga2Δ strain in the darkness confirm that K. lactis can sense light and that KlMga2 could play a role to mediate or attenuate phenotypes specifically correlated to respiration and/or mitochondrial functions in response to light. The deletion of KlMSN2 did not caused sensitivity to the mitochondrial drug antimycin A (rag- phenotype), as in the case of KlMGA2. A slight sensitivity to the drug in darkness suggests an opposite regulatory effect of KlMsn2, respect to KlMga2, in the mechanism of antimycin A resistance in light/dark conditions. The deletion of KlCRZ1 did not cause evident phenotypes in the conditions explored in this work.
Our results indicated that light or dark exposition did not induce the KlMga2 maturation process. However, the slight sensitivity to antimycin A, especially in darkness, of the constitutively active mga2ΔTM strain suggests a possible role of the full-sized membrane-bound KlMga2 form in contrasting drug activity. A detailed study of KlMga2 maturation and the physiological characterization of the strain harboring the KlMga2 truncated form, such as growth, oxygen consumption, and protein localization, will require further targeted investigations.
We have demonstrated in previous work (Santomartino et al., 2019a) that KlMga2 is involved in the response to oxidative stress and regulates chronological life span. It has been reported that light can induce ROS generation and oxidative stress in S. cerevisiae (Bodvard et al., 2017). In K. lactis, we found that the activity profiles of KlCtt1/KlCta1 and SOD enzymes and the transcriptional profiles of the corresponding genes were consistent with a general overactive ROS response in the absence of KlMGA2 when the cells were exposed to light, especially as far as SOD expression was concerned. Our results also suggested a possible role of KlMga2 as downregulator of Msn2, because we observed high KlCtt1/KlCta1 activity in the absence of KlMGA2, which was instead reduced in the absence of KlMSN2. In the latter case, the mechanism of action seemed to be independent on light/dark exposition.
FA composition of membranes determines their properties and functionality and depends on the expression FA biosynthetic enzymes, especially desaturases. The expression of yeast FAs desaturases is regulated by various environmental factors, including hypoxia, temperature, and the presence of specific chemicals. In addition, different yeasts are endowed with different desaturases (Santomartino et al., 2017). Another environmental factor that might influence membrane composition is light: it has been shown that the expression of the desaturase gene FAD2 in plant depends on light exposure (Kargiotidou et al., 2008; Dar et al., 2017). Our study on the expression of FAD2 desaturase gene in K. lactis indicated that KlMga2 mediates the transient light-dependent regulation of FAD2 observed in wild type cells, suggesting a light-stress dependent modulation of membrane composition. Our results showed opposite light regulation of transcription of FAD2 and SOD1/2 or CTT1 genes in the wild type and in the Klmga2Δ mutant, suggesting that light stress influenced differently ROS metabolism and PUFA biosynthesis in K. lactis and indicating the involvement of other specific elements in the KlMga2-dependent response mechanisms.
Major differences between K. lactis cells cultivated in light and in darkness were in the total amount of FAs and in the unsaturation index (UI). Light cultivation caused a consistent increase of cellular FAs and an increase of UI. Light also caused specific changes in the amount of individual FA species. As far as FA biosynthesis and accumulation were concerned, the absence of KlMga2 simulated a light stress-like status with abundant FAs content. On the other hand, light stress could be associated with increased membrane fluidity but this response was not dependent on KlMga2. It remains to be investigated the specific connection between light stress and high FAs content and high UI. For example, the high FAs content might derive from accumulation of triacylglycerol, due to metabolic imbalance, or increase of functional membranes, dependent on organelle proliferation. These hypotheses could be further investigated by assessing lipid droplets in light and dark conditions.
Interestingly, the amount of oxylipins (oxidized FA, Supplementary Figure 5) increased in dark conditions concomitantly to FA decrease in both strains. Especially 13-hydoxyoctadecenoic acid (13-HODE), an oxidation product of linoleic acid, increased in darkness (not shown). We can suggest that part of the loss of linoleic acid under dark conditions experiments by both strains could be partly due to the synthesis of oxylipins. This synthesis can be spontaneous, i.e., occurring from double bond oxidation by ROS, and enzymatically, i.e., catalyzed by lipoxygenases or dioxygenases.
Results reported in this work indicate that the yeast K. lactis is responsive to light and that the regulatory factor KlMga2 has a role in this response. It has been shown that light induces oxidative stress in S. cerevisiae (Bodvard et al., 2017) and a similar activity could be envisaged also in K. lactis with the involvement of KlMga2, because of the effect of light on the detoxifying enzymes catalase and SOD. The deletion of KlMGA2 gene has pleiotropic effects, suggesting that KlMga2, possibly because of its biochemical characteristics (Camponeschi et al., 2020), participates in various pathways: uncovering the detail of these pathways requires further investigation.
One of the most relevant pathway regulated by KlMga2 is the biosynthesis of FAs, and we showed here that also this pathway is influenced by light stress. The connection among light stress, membrane composition or functionality, and KlMga2 is highlighted by the fact that phenotypes of the Klmga2Δ strains, like growth rate, respiration rate, and mitochondrial morphology, are partially or completely suppressed either by darkness or by unsaturated FAs (Micolonghi et al., 2012; Ottaviano et al., 2015; Santomartino et al., 2019a). Finally, our findings open new perspectives on the role of light in the biology of organisms (apparently) deprived of light sensing proteins and on the role of lipids and membranes in the response to light stress.
The original contributions presented in the study are included in the article/ Supplementary Material, further inquiries can be directed to the corresponding author/s.
IC performed and conceived the experiments and wrote the manuscript. AM, MR, and CM performed the critical reading. MB performed the experiments and critical reading. MMB conceived the experiments, wrote the manuscript, and provided the funding. All authors contributed to the article and approved the submitted version.
This work was supported by the Ateneo Sapienza 2019 and 2020, MAECI Progetti Grande Rilevanza PGR00208; PGR00209; PGR00748.
The authors declare that the research was conducted in the absence of any commercial or financial relationships that could be construed as a potential conflict of interest.
We are indebted to the colleague Paola Ballario of the Department of Biology and Biotechnology ‘C. Darwin’, Sapienza University of Rome, who inspired and promoted this research of light effects on yeast.
The Supplementary Material for this article can be found online at: https://www.frontiersin.org/articles/10.3389/fmicb.2021.705012/full#supplementary-material
Barsoum, E., Rajaei, N., and Aström, S. U. (2011). RAS/cyclic AMP and transcription factor Msn2 regulate mating and mating-type switching in the yeast Kluyveromyces lactis. Eukaryot Cell 10, 1545–1552. doi: 10.1128/EC.05158-11
Beccaccioli, M., Salustri, M., Scala, V., Ludovici, M., Cacciotti, A., D’Angeli, S., et al. (2021). The effect of Fusarium verticillioides fumonisins on fatty acids, sphingolipids, and oxylipins in maize germlings. Int. J. Mol. Sci. 22:2435. doi: 10.3390/ijms22052435
Bereiter-Hahn, J. (1976). Dimethylaminostyrylmethylpyridiniumiodine (daspmi) as a fluorescent probe for mitochondria in situ. Biochim. Biophys. Acta 423, 1–14. doi: 10.1016/0005-2728(76)90096-7
Bodvard, K., Jörhov, A., Blomberg, A., Molin, M., and Käll, M. (2013). The yeast transcription factor Crz1 is activated by light in a Ca2+/calcineurin-dependent and PKA-independent manner. PLoS One 8:e53404. doi: 10.1371/journal.pone.0053404
Bodvard, K., Peeters, K., Roger, F., Romanov, N., Igbaria, A., Welkenhuysen, N., et al. (2017). Light-sensing via hydrogen peroxide and a peroxiredoxin. Nat. Commun. 8:14791. doi: 10.1038/ncomms14791
Bodvard, K., Wrangborg, D., Tapani, S., Logg, K., Sliwa, P., Blomberg, A., et al. (2011). Continuous light exposure causes cumulative stress that affects the localization oscillation dynamics of the transcription factor Msn2p. Biochim. Biophys. Acta 1813, 358–366. doi: 10.1016/j.bbamcr.2010.12.004
Bussereau, F., Casaregola, S., Lafay, J. F., and Bolotin-Fukuhara, M. (2006). The Kluyveromyces lactis repertoire of transcriptional regulators. FEMS Yeast Res. 6, 325–335. doi: 10.1111/j.1567-1364.2006.00028.x
Byfield, G. E., and Upchurch, R. G. (2007). Effect of temperature on delta-9 stearoyl-ACP and microsomal omega-6 desaturase gene expression and fatty acid content in developing soybean seeds. Crop Sci. 47, 1698–1704. doi: 10.2135/cropsci2006.04.0213
Cai, L., Dalal, C. K., and Elowitz, M. B. (2008). Frequency-modulated nuclear localization bursts coordinate gene regulation. Nature 455, 485–490. doi: 10.1038/nature07292
Camponeschi, I., Damasco, A., Uversky, V. N., Giuliani, A., and Bianchi, M. M. (2020). Phenotypic suppression caused by resonance with light-dark cycles indicates the presence of a 24-hours oscillator in yeast and suggests a new role of intrinsically disordered protein regions as internal mediators. J. Biomol. Struct. Dyn. 39, 2490–2501. doi: 10.1080/07391102.2020.1749133
Chellappa, R., Kandasamy, P., Oh, C. S., Jiang, Y., Vemula, M., and Martin, C. E. (2001). The membrane proteins, Spt23p and Mga2p, play distinct roles in the activation of Saccharomyces cerevisiae OLE1 gene expression. fatty acid-mediated regulation of Mga2p activity is independent of its proteolytic processing into a soluble transcription activator. J. Biol. Chem. 276, 43548–43556. doi: 10.1074/jbc.M107845200
Covino, R., Ballweg, S., Stordeur, C., Michaelis, J. B., Puth, K., Wernig, F., et al. (2016). A eukaryotic sensor for membrane lipid saturation. Mol. Cell 63, 49–59. doi: 10.1016/j.molcel.2016.05.015
Cyert, M. S. (2003). Calcineurin signaling in Saccharomyces cerevisiae: how yeast go crazy in response to stress. Biochem. Biophys. Res. Commun. 311, 1143–1150. doi: 10.1016/s0006-291x(03)01552-3
Dar, A. A., Choudhury, A. R., Kancharla, P. K., and Arumugam, N. (2017). The fad2 gene in plants: occurrence, Regulation, and Role. Front Plant Sci. 8:1789. doi: 10.3389/fpls.2017.01789
De Angelis, L., Rinaldi, T., Cirigliano, A., Bello, C., Reverberi, M., Amaretti, A., et al. (2016). Functional roles of the fatty acid desaturases encoded by KlOLE1, FAD2 and FAD3 in the yeast Kluyveromyces lactis. Microbiology 162, 1435–1445. doi: 10.1099/mic.0.000315
De Luca, C., Zhou, Y., Montanari, A., Morea, V., Oliva, R., Besagni, C., et al. (2009). Can yeast be used to study mitochondrial diseases? Biolistic tRNA mutants for the analysis of mechanisms and suppressors. Mitochondrion 9, 408–417. doi: 10.1016/j.mito.2009.07.004
Estruch, F. (2000). Stress-controlled transcription factors, stress-induced genes and stress tolerance in budding yeast. FEMS Microbiol. Rev. 24, 469–486. doi: 10.1111/j.1574-6976.2000.tb00551.x
Görner, W., Durchschlag, E., Martinez-Pastor, M. T., Estruch, F., Ammerer, G., Hamilton, B., et al. (1998). Nuclear localization of the C2H2 zinc finger protein Msn2p is regulated by stress and protein kinase A activity. Genes Dev. 12, 586–597. doi: 10.1101/gad.12.4.586
Hao, N., and O’Shea, E. K. (2011). Signal-dependent dynamics of transcription factor translocation controls gene expression. Nat. Struct. Mol. Biol. 19, 31–39. doi: 10.1038/nsmb.2192
Hasan, R., Leroy, C., Isnard, A. D., Labarre, J., Boy-Marcotte, E., and Toledano, M. B. (2002). The control of the yeast H2O2 response by the Msn2/4 transcription factors. Mol. Microbiol. 45, 233–241. doi: 10.1046/j.1365-2958.2002.03011.x
Hernández, M. L., Padilla, M. N., Sicardo, M. D., Mancha, M., and Martínez-Rivas, J. M. (2011). Effect of different environmental stresses on the expression of oleate desaturase genes and fatty acid composition in olive fruit. Phytochemistry 72, 178–187. doi: 10.1016/j.phytochem.2010.11.026
Hnatova, M., W solowski-Louvel, M., Dieppois, G., Deffaud, J., and Lemaire, M. (2008). Characterization of KlGRR1 and SMS1 genes, two new elements of the glucose signaling pathway of Kluyveromyces lactis. Eukaryot Cell 7, 1299–1308. doi: 10.1128/EC.00454-07
Hockberger, P. E., Skimina, T. A., Centonze, V. E., Lavin, C., Chu, S., Dadras, S., et al. (1999). Activation of flavin-containing oxidases underlies light-induced production of H2O2 in mammalian cells. Proc. Natl. Acad. Sci. U.S.A. 96, 6255–6260. doi: 10.1073/pnas.96.11.6255
Hoppe, T., Matuschewski, K., Rape, M., Schlenker, S., Ulrich, H. D., and Jentsch, S. (2000). Activation of a membrane-bound transcription factor by regulated ubiquitin/proteasome-dependent processing. Cell 102, 577–586. doi: 10.1016/s0092-8674(00)00080-5
Huang, M., and Kao, K. C. (2018). Identifying novel genetic determinants for oxidative stress tolerance in Candida glabrata via adaptive laboratory evolution. Yeast 35, 605–618. doi: 10.1002/yea.3352
Idnurm, A., Verma, S., and Corrochano, L. M. (2010). A glimpse into the basis of vision in the kingdom Mycota. Fungal Genet. Biol. 47, 881–892. doi: 10.1016/j.fgb.2010.04.009
Janke, C., Magiera, M. M., Rathfelder, N., Taxis, C., Reber, S., Maekawa, H., et al. (2004). A versatile toolbox for PCR-based tagging of yeast genes: new fluorescent proteins, more markers and promoter substitution cassettes. Yeast 21, 947–962. doi: 10.1002/yea.1142
Jiang, Y., Vasconcelles, M. J., Wretzel, S., Light, A., Martin, C. E., and Goldberg, M. A. (2001). MGA2 is involved in the low-oxygen response element-dependent hypoxic induction of genes in Saccharomyces cerevisiae. Mol. Cell Biol. 21, 6161–6169. doi: 10.1128/mcb.21.18.6161-6169.2001
Kainou, K., Kamisaka, Y., Kimura, K., and Uemura, H. (2006). Isolation of Delta12 and omega3-fatty acid desaturase genes from the yeast Kluyveromyces lactis and their heterologous expression to produce linoleic and alpha-linolenic acids in Saccharomyces cerevisiae. Yeast 23, 605–612. doi: 10.1002/yea.1378
Kargiotidou, A., Deli, D., Galanopoulou, D., Tsaftaris, A., and Farmaki, T. (2008). Low temperature and light regulate delta 12 fatty acid desaturases (FAD2) at a transcriptional level in cotton (Gossypium hirsutum). J. Exp. Bot. 59, 2043–2056. doi: 10.1093/jxb/ern065
Kis, M., Zsiros, O., Farkas, T., Wada, H., Nagy, F., and Gombos, Z. (1998). Light-induced expression of fatty acid desaturase genes. Proc. Natl. Acad. Sci. U.S.A. 95, 4209–4214. doi: 10.1073/pnas.95.8.4209
Köhrer, K., and Domdey, H. (1991). Preparation of high molecular weight RNA. Methods Enzymol. 194, 398–405. doi: 10.1016/0076-6879(91)94030-g
Ludovici, M., Ialongo, C., Reverberi, M., Beccaccioli, M., Scarpari, M., and Scala, V. (2014). Quantitative profiling of oxylipins through comprehensive LC-MS/MS analysis of Fusarium verticillioides and maize kernels. Food Addit. Contam. Part A Chem. Anal. Control Expo. Risk Assess. 31, 2026–2033. doi: 10.1080/19440049.2014.968810
Medvedik, O., Lamming, D. W., Kim, K. D., and Sinclair, D. A. (2007). MSN2 and MSN4 link calorie restriction and TOR to sirtuin-mediated lifespan extension in Saccharomyces cerevisiae. PLoS Biol. 5:e261. doi: 10.1371/journal.pbio.0050261
Micolonghi, C., Ottaviano, D., Di Silvio, E., Damato, G., Heipieper, H. J., and Bianchi, M. M. (2012). A dual signalling pathway for the hypoxic expression of lipid genes, dependent on the glucose sensor Rag4, is revealed by the analysis of the KlMGA2 gene in Kluyveromyces lactis. Microbiology 158, 1734–1744. doi: 10.1099/mic.0.059402-0
Natter, K., and Kohlwein, S. D. (2013). Yeast and cancer cells - common principles in lipid metabolism. Biochim. Biophys. Acta 1831, 314–326. doi: 10.1016/j.bbalip.2012.09.003
Ottaviano, D., Montanari, A., De Angelis, L., Santomartino, R., Visca, A., Brambilla, L., et al. (2015). Unsaturated fatty acids-dependent linkage between respiration and fermentation revealed by deletion of hypoxic regulatory KlMGA2 gene in the facultative anaerobe-respiratory yeast Kluyveromyces lactis. FEMS Yeast Res. 15:fov028. doi: 10.1093/femsyr/fov028
Ramadass, R., and Bereiter-Hahn, J. (2008). How DASPMI reveals mitochondrial membrane potential: fluorescence decay kinetics and steady-state anisotropy in living cells. Biophys. J. 95, 4068–4076. doi: 10.1529/biophysj.108.135079
Rossi, M., Buzzini, P., Cordisco, L., Amaretti, A., Sala, M., Raimondi, S., et al. (2009). Growth, lipid accumulation, and fatty acid composition in obligate psychrophilic, facultative psychrophilic, and mesophilic yeasts. FEMS Microbiol. Ecol. 69, 363–372. doi: 10.1111/j.1574-6941.2009.00727.x
Salani, F., and Bianchi, M. M. (2006). Production of glucoamylase in pyruvate decarboxylase deletion mutants of the yeast Kluyveromyces lactis. Appl. Microbiol. Biotechnol. 69, 564–572. doi: 10.1007/s00253-005-0148-x
Santhanam, A., Hartley, A., Düvel, K., Broach, J. R., and Garrett, S. (2004). PP2A phosphatase activity is required for stress and Tor kinase regulation of yeast stress response factor Msn2p. Eukaryot Cell 3, 1261–1271. doi: 10.1128/EC.3.5.1261-1271.2004
Santomartino, R., Camponeschi, I., Polo, G., Immesi, A., Rinaldi, T., Mazzoni, C., et al. (2019a). The hypoxic transcription factor KlMga2 mediates the response to oxidative stress and influences longevity in the yeast Kluyveromyces lactis. FEMS Yeast Res. 19:foz020. doi: 10.1093/femsyr/foz020
Santomartino, R., Ottaviano, D., Camponeschi, I., Landicho, T. A. A., Falato, L., Visca, A., et al. (2019b). The hypoxic expression of the glucose transporter RAG1 reveals the role of the bHLH transcription factor Sck1 as a novel hypoxic modulator in Kluyveromyces lactis. FEMS Yeast Res. 19:foz041. doi: 10.1093/femsyr/foz041
Santomartino, R., Riego-Ruiz, L., and Bianchi, M. M. (2017). Three, two, one yeast fatty acid desaturases: regulation and function. World J. Microbiol. Biotechnol. 33:89. doi: 10.1007/s11274-017-2257-y
Sikorski, R. S., and Hieter, P. (1989). A system of shuttle vectors and yeast host strains designed for efficient manipulation of DNA in Saccharomyces cerevisiae. Genetics 122, 19–27.
Thewes, S. (2014). Calcineurin-Crz1 signaling in lower eukaryotes. Eukaryot Cell 13, 694–705. doi: 10.1128/EC.00038-14
Vasconcelles, M. J., Jiang, Y., McDaid, K., Gilooly, L., Wretzel, S., Porter, D. L., et al. (2001). Identification and characterization of a low oxygen response element involved in the hypoxic induction of a family of Saccharomyces cerevisiae genes. implications for the conservation of oxygen sensing in eukaryotes. J. Biol. Chem. 276, 14374–14384. doi: 10.1074/jbc.M009546200
Wach, A., Brachat, A., Pö hlmann, R., and Philippsen, P. (1994). New heterologous modules for classical or PCR-based gene disruptions in Saccharomyces cerevisiae. Yeast 10, 1793–1808. doi: 10.1002/yea.320101310
Wésolowski-Louvel, M. (2011). An efficient method to optimize Kluyveromyces lactis gene targeting. FEMS Yeast Res. 11, 509–513. doi: 10.1111/j.1567-1364.2011.00741.x
Wésolowski-Louvel, M., Prior, C., Bornecque, D., and Fukuhara, H. (1992). Rag- mutations involved in glucose metabolism in yeast: isolation and genetic characterization. Yeast. 8, 711–719. doi: 10.1002/yea.320080904
Yang, J., Schmelzer, K., Georgi, K., and Hammock, B. D. (2009). Quantitative profiling method for oxylipin metabolome by liquid chromatography electrospray ionization tandem mass spectrometry. Anal. Chem. 81, 8085–8093. doi: 10.1021/ac901282n
Yuan, S.-W., Wu, X.-L., Liu, Z.-H., Luo, H.-B., and Huang, R.-Z. (2012). Abiotic stresses and phytohormones regulate expression of FAD2 gene in Arabidopsis thaliana. J. Integr. Agric. 11, 62–72. doi: 10.1016/S1671-2927(12)60783-4
Keywords: lipid, membrane, desaturase, ROS, fungi
Citation: Camponeschi I, Montanari A, Beccaccioli M, Reverberi M, Mazzoni C and Bianchi MM (2021) Light-Stress Response Mediated by the Transcription Factor KlMga2 in the Yeast Kluyveromyces lactis. Front. Microbiol. 12:705012. doi: 10.3389/fmicb.2021.705012
Received: 04 May 2021; Accepted: 16 June 2021;
Published: 14 July 2021.
Edited by:
Nelson da Cruz Soares, University of Sharjah, United Arab EmiratesReviewed by:
Rosaura Rodicio, University of Oviedo, SpainCopyright © 2021 Camponeschi, Montanari, Beccaccioli, Reverberi, Mazzoni and Bianchi. This is an open-access article distributed under the terms of the Creative Commons Attribution License (CC BY). The use, distribution or reproduction in other forums is permitted, provided the original author(s) and the copyright owner(s) are credited and that the original publication in this journal is cited, in accordance with accepted academic practice. No use, distribution or reproduction is permitted which does not comply with these terms.
*Correspondence: Michele M. Bianchi, bWljaGVsZS5iaWFuY2hpQHVuaXJvbWExLml0
Disclaimer: All claims expressed in this article are solely those of the authors and do not necessarily represent those of their affiliated organizations, or those of the publisher, the editors and the reviewers. Any product that may be evaluated in this article or claim that may be made by its manufacturer is not guaranteed or endorsed by the publisher.
Research integrity at Frontiers
Learn more about the work of our research integrity team to safeguard the quality of each article we publish.