
94% of researchers rate our articles as excellent or good
Learn more about the work of our research integrity team to safeguard the quality of each article we publish.
Find out more
ORIGINAL RESEARCH article
Front. Microbiol., 31 August 2021
Sec. Microbiological Chemistry and Geomicrobiology
Volume 12 - 2021 | https://doi.org/10.3389/fmicb.2021.696921
 Jia-Wei Tang1†Qing-Hua Liu2†Xiao-Cong Yin3†
 Ya-Cheng Pan4Peng-Bo Wen1
 Xin Liu1Xing-Xing Kang1
 Bing Gu3,5*
 Zuo-Bin Zhu4*
 Liang Wang1,6*
Raman spectroscopy (RS) is a widely used analytical technique based on the detection of molecular vibrations in a defined system, which generates Raman spectra that contain unique and highly resolved fingerprints of the system. However, the low intensity of normal Raman scattering effect greatly hinders its application. Recently, the newly emerged surface enhanced Raman spectroscopy (SERS) technique overcomes the problem by mixing metal nanoparticles such as gold and silver with samples, which greatly enhances signal intensity of Raman effects by orders of magnitudes when compared with regular RS. In clinical and research laboratories, SERS provides a great potential for fast, sensitive, label-free, and non-destructive microbial detection and identification with the assistance of appropriate machine learning (ML) algorithms. However, choosing an appropriate algorithm for a specific group of bacterial species remains challenging, because with the large volumes of data generated during SERS analysis not all algorithms could achieve a relatively high accuracy. In this study, we compared three unsupervised machine learning methods and 10 supervised machine learning methods, respectively, on 2,752 SERS spectra from 117 Staphylococcus strains belonging to nine clinically important Staphylococcus species in order to test the capacity of different machine learning methods for bacterial rapid differentiation and accurate prediction. According to the results, density-based spatial clustering of applications with noise (DBSCAN) showed the best clustering capacity (Rand index 0.9733) while convolutional neural network (CNN) topped all other supervised machine learning methods as the best model for predicting Staphylococcus species via SERS spectra (ACC 98.21%, AUC 99.93%). Taken together, this study shows that machine learning methods are capable of distinguishing closely related Staphylococcus species and therefore have great application potentials for bacterial pathogen diagnosis in clinical settings.
The genus Staphylococcus includes many commonly encountered and clinically important pathogenic species in nosocomial infections, such as Staphylococcus aureus and Staphylococcus epidermidis, etc. (McGavin and Heinrichs, 2012). Some of these Staphylococcus species could cause severe infectious diseases, especially in immune-compromised patients with the use of catheters and other medical implants (Schlievert et al., 2016). Therefore, it is crucial to develop rapid diagnostic methods for pathogenic bacteria. Raman spectroscopy (RS) is a widely used non-destructive, vibrational spectroscopic technique in the fields of biology and medicine, such as cell-drug interactions (Buckley and Ryder, 2017) and cancer diagnosis (D’Acunto et al., 2020), etc., which normally generates spectra of the analytes that can be further used for quantitative and qualitative analyses (Das and Agrawal, 2011). The basic principle of Raman spectroscopy relies on the photons in elastically scattered after interacting with vibrating molecules within the sample. Since molecular vibrations are distinct for each molecule, the vibrational Raman spectrum for a sample is therefore unique with characteristic peaks that are often termed as molecular fingerprints. However, the major drawback for traditional RS is its inherent weakness of signals, hence very low detection sensitivity (Jones et al., 2019). In addition, it is very difficult for RS to obtain reliable spectra due to its comparatively poor reproducibility (Dong and Zhao, 2017).
Recently, enhanced Raman spectroscopic techniques have emerged, such as surface enhanced Raman spectroscopy (SERS) and tip-enhanced Raman scattering (TERS; Jones et al., 2019). SERS is a surface-sensitive technique that can enhance the intensity of Raman scattering at the level of several orders of magnitude by exploiting surface plasmons (SPs) of metallic nanostructures (Pérez-Jiménez et al., 2020), also known as SERS substrate, which is sufficient to analyze bacterial samples at single-cell resolution (Weiss et al., 2019). Common examples for SERS substrates include silver and gold nanoparticles (NPs) since they do not have any Raman active modes (Bora, 2018) and show outstanding SERS enhancements (Pérez-Jiménez et al., 2020). Comparatively speaking, silver colloidal nanoparticles (AgNPs) has a high molar extinction coefficient from visible to near infrared region, whereas gold is commonly used for red and near infrared regions; in addition, AgNPs show higher plasmon quality than that of gold NPs (Wei et al., 2018; Pérez-Jiménez et al., 2020). Therefore, AgNPs have been widely employed for bacteria detection in SERS studies, which are also the case in this study for the differentiation and identification of Staphylococcus species.
Due to the complexity of bacterial composition, large datasets are regularly acquired during SERS analyses, which make the classical linear methods no longer sufficient for data processing (Lussier et al., 2020). Machine learning (ML) methods focus on constructing models via learning patterns from large sets of data and improving the accuracy of models over time, which belongs to the field of artificial intelligence (AI). ML algorithms have been successfully applied in classification, clustering, and prediction tasks over large, high-dimensional datasets (Marsland, 2014). In fact, ML algorithms have found many applications in Raman spectroscopy, especially for the differentiation and identification of bacterial pathogens (Rebrošová et al., 2017; Chen et al., 2019; Ho et al., 2019; Uysal Ciloglu et al., 2020). For example, Rebrošová et al. (2017) recruited three classical supervised learning methods, linear discriminant analysis (LDA), one nearest neighbor (1NN), and support vector machine (SVM), to analyze 16 Staphylococcus strains, according to which, 1NN achieved the highest accuracy (99.3%). In addition, Ho et al. (2019) used the state-of-the art deep learning model convolutional neural network (CNN) to address low signal-noise-ratio (SNR) one-dimensional Raman spectral data for the first time, which not only achieved more than 82% prediction accuracy for bacterial identification, but also successfully differentiated methicillin-resistant (MRSA) and methicillin-susceptible S. aureus (MSSA) with 89±0.1% accuracy.
Currently, there is little study focusing on the systematic comparison of performances of different machine learning methods in terms of both supervised and unsupervised learning algorithms. Here, we applied three unsupervised learning algorithms and 10 supervised learning algorithms to analyze 2,752 Raman spectra generated from 117 Staphylococcus strains belonging to nine Staphylococcus species. According to the comparative study of the three unsupervised learning methods, density-based spatial clustering of applications with noise (DBSCAN) had the best capacity for clustering Staphylococcus species into different groups (Rand index 0.9733). We also compared the prediction capacity of 10 supervised learning algorithms, which showed that CNN was the best predicting model for analyzing Staphylococcus Raman spectra with accuracy (ACC) at 98.21% and area under curve (AUC) at 99.93%. Taken together, we concluded that machine learning methods were efficient for the differentiation and identification of pathogenic Staphylococcus species, which showed promising potentials for rapid and non-invasive clinical diagnostics of bacterial pathogens in near future.
A total of 117 Staphylococcus strains belonging to nine Staphylococcus species were included in this experiment: 12 strains of S. aureus (N=531), 12 strains of S. capitis (N=282), 30 strains of S. epidermidis (N=649), 18 strains of S. haemolyticus (N=360), 20 strains of S. hominis (N=550), six strains of S. kloosii (N=80), three strains of S. sciuri (N=70), eight strains of S. warneri (N=140), and eight strains of S. xylose (N=90). A total of 2,752 surface enhanced Raman spectra were collected, which was denoted by the letter N within the parentheses for each species. All the strains were clinical isolates stored in the Department of Laboratory Medicine, the Affiliated Hospital of Xuzhou Medical University, Xuzhou, Jiangsu Province, China. All of the strains were identified and confirmed through biochemical methods plus Matrix-assisted laser desorption/ionization-time of flight (MALDI-TOF) mass spectrometry (MS) and stored in Thermo-Fisher freezer at −80°C. Before Raman spectroscopy, all the strains were thawed, inoculated onto Mueller-Hinton agar plates (Sigma-Aldrich), and cultivated for 24h at 37°C. Colonies were randomly selected and mixed with negatively-charged silver nanoparticle substrate for SERS.
About 200ml of deionized water (ddH2O) and 33.72mg of AgNO3 (Sinopharm, Beijing, China) was added to a clean and sterile Erlenmeyer flask, which was then gently mixed and heated on a magnetic stirrer. After boiling, 8ml of 1wt% sodium citrate was added into the mixture, which was heated for 15min at the stirring rate of 650r/min. Stop heating, continue stirring, and wait for the mixture to cool down to room temperature. The final volume was set to 200ml. Then, take 1ml of the final solution and place it in a sterile Eppendorf tube, centrifuge the tube at 7,000r/min for 7min, discard the supernatant after centrifugation, and resuspend the solution with 100μl of ddH2O to obtain a uniform milky gray solution. The solution is the negatively-charged silver nanoparticle substrate. Store the solution in the dark at room temperature for later use.
After cultivation, a single colony of a Staphylococcus species was inoculated into 15μl phosphate buffer saline (PBS) and well mixed via vigorous vortexing, which was then well mixed with 15μl negatively-charged silver nanoparticle substrate solution. The mixed solution was dropped onto silicon wafer for complete dry. The dried spot was then measured by commercial i-Raman® Plus Raman spectrometer BWS465-785H (B&W Tek, United States) for Raman spectral generation. Measurement settings were described below. Laser power: 340mW, nominal at exiting probe; 455mW, nominal at laser port. Wavelength: 785nm. Detector type: high quantum efficiency CCD array. Raman shift range: 65–2,800cm−1. Spectral acquisition: 20s. Resolution: <3.5cm−1 at 912nm. Each spectrum consists of 657 points measured in the range 519.56–1,800.81cm−1.
Original data for each sample were sourced from Raman spectrometer via the software BWSpec 4.02 (B&W Tek, United States) and saved in plain text format. For all spectral files in a Staphylococcus species, the columns Raman shift and Raman intensity were first extracted from 519.56 to 1,800.81cm−1 and then put together via in-house Python scripts. The re-organized data were further calculated for average intensity and standard deviation at each Raman shift and visualized via Origin (OriginLab, United States).
The software LabSpec 6 (HORIBA Scientific, Japan) was used for processing and smoothing the averaged Raman spectra data. The parameters were first set at Degree=4, Size=5, and Height=50, and then click the button “Smooth.” For baseline correction, use the following settings: Type=Polynom, Degree=6, Attach=No, and then click the button “Auto.” After that, start to search the characteristic peaks. Function was set to GaussLoren, Level to 13%, and Size to 19 while other parameters were kept in default. Then, click on the “Search” button. Finally, use LabSpec 6 to normalize the spectra in order to better compare the curves from different Staphylococcus species. All the characteristic peaks were annotated with a black arrow. Common biopolymers, such as nucleic acids, proteins, lipids, and carbohydrates, etc. have been widely studied by Raman spectroscopy, which has led to the assignment of the Raman characteristic peaks to various molecular vibrations as summarized in Table 1. Dot matrix plot was also drawn to visualize the distribution of characteristic peaks among the nine Staphylococcus species in Supplementary Figure 1.
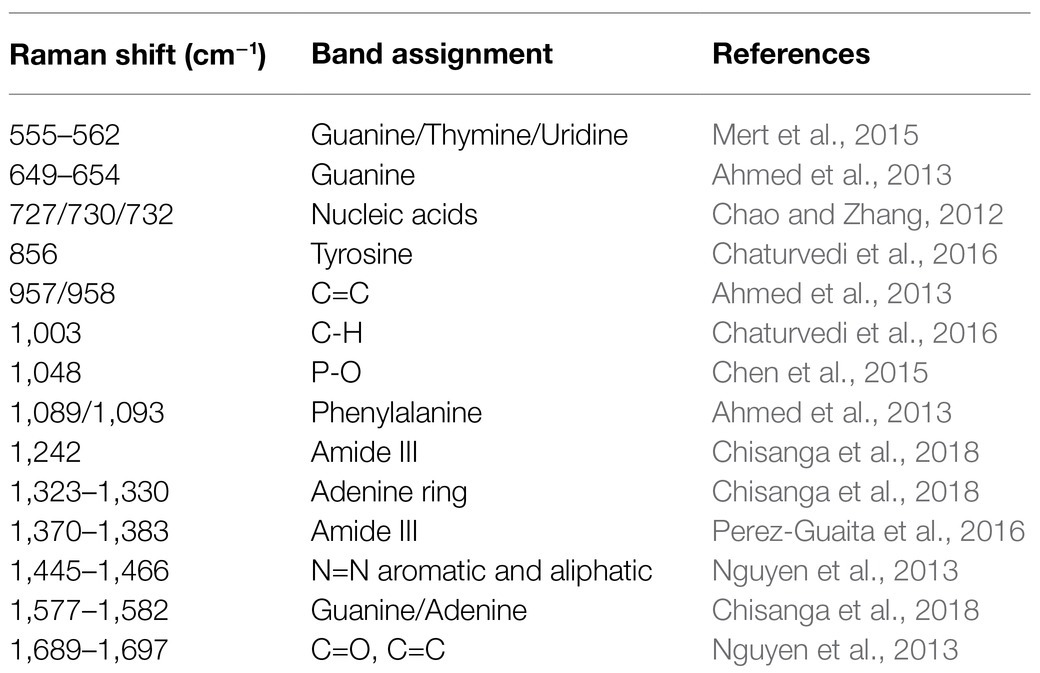
Table 1. Band assignments of characteristic peaks to potential metabolites in Raman spectra of Staphylococcus species.
Principal component analysis (PCA) was used to reduce the dimensionality of each Staphylococcus Raman spectra. According to PCA analysis, a few meaningful dimensions were identified, which were mainly determined by the degree of dispersion (variance) of all observations in each dimension. Total variance contribution rate (≥99%) was used as an indicator in this study. The results showed that 10 principal components were found. In order to avoid different units from affecting the results of data analysis, all data were normalized by column to improve the accuracy and accelerate the convergence speed of subsequent supervised and unsupervised machine learning algorithms.
Three clustering algorithms, K-means clustering algorithm (K-means), agglomerative nesting (AGNES), and DBSCAN, were used in this study to analyze the pre-processed Raman spectral data via PCA. In particular, we set the K value (n_clusters) in the K-means algorithm to 9, and divided each point into the cluster represented by the nearest cluster center point. After all points were allocated, these points in the cluster were re-calculated in terms of the center point of the cluster by taking the average value. Thus, the center point of the cluster was iteratively re-allocated and updated until the center point of the cluster changed little or reached the specified iteration frequency. As for the AGNES hierarchical clustering algorithm, we also set the K value (n_clusters) to 9, and the linkage mode was set to “ward,” that is, minimization of the differences in all clusters in terms of sum of squares. By using the bottom-up strategy, each object was initially treated as a cluster. Then, these atomic clusters were merged into a larger cluster until all objects were in the same cluster or met the termination condition. In terms of DBSCAN algorithm, the minimum rough value (min_samples) was set to 9, and the density radius was set to 0.7. By using the scikit-learn library in Python (Pedregosa et al., 2011), we calculated the adjusted Rand Index with a value between [−1, 1] so as to measure the degree of agreement between the clustering results and the real situation. The closer the value is to 1, the better the clustering effect is.
According to the spectral characteristics of Staphylococcus species, we used eight types of traditional supervised machine learning methods that are K-nearest neighbors (KNN, KNeighbors), decision trees (DT, DecisionTree), random forest (RF, RandomForest), gradient boosting (GB, GradientBoosting), SVM, adaptive boosting (AdaBoost), Gaussian naive Bayes (GNB, GaussianNB), quadratic discriminant analysis (QDA, QuadraticDiscriminantAnalysis), and two deep learning methods, namely, CNN and long short-term memory neural network (LSTM) to process one-dimensional Raman spectral fingerprinting data via scikit-learn library (Pedregosa et al., 2011). For all the algorithms, the sample data were divided into 70% of the training set and 30% of the test set. We then converted previously defined labels into a hot encoding form that could be easily recognized by the computer. Encapsulated classifier functions in the scikit-learn library were called for the analysis while the corresponding parameters were set, accordingly. For example, we set the kernel function of SVM to rfb, the penalty parameter C=0.8, and the kernel function parameter gamma=20. As for the two deep learning algorithms, CNN consisted of one initial input layer, three alternative convolutional layers, and three pooling layers, plus one fully connected layer and output layer (Figure 1). The three convolutional layers contained 16, 64, and 64 convolution filters of different sizes. A single training iteration (epochs) was set to 5, the number of batches (batch_size) for each training was set to 10, and adam was selected for the optimization algorithm of the loss function.
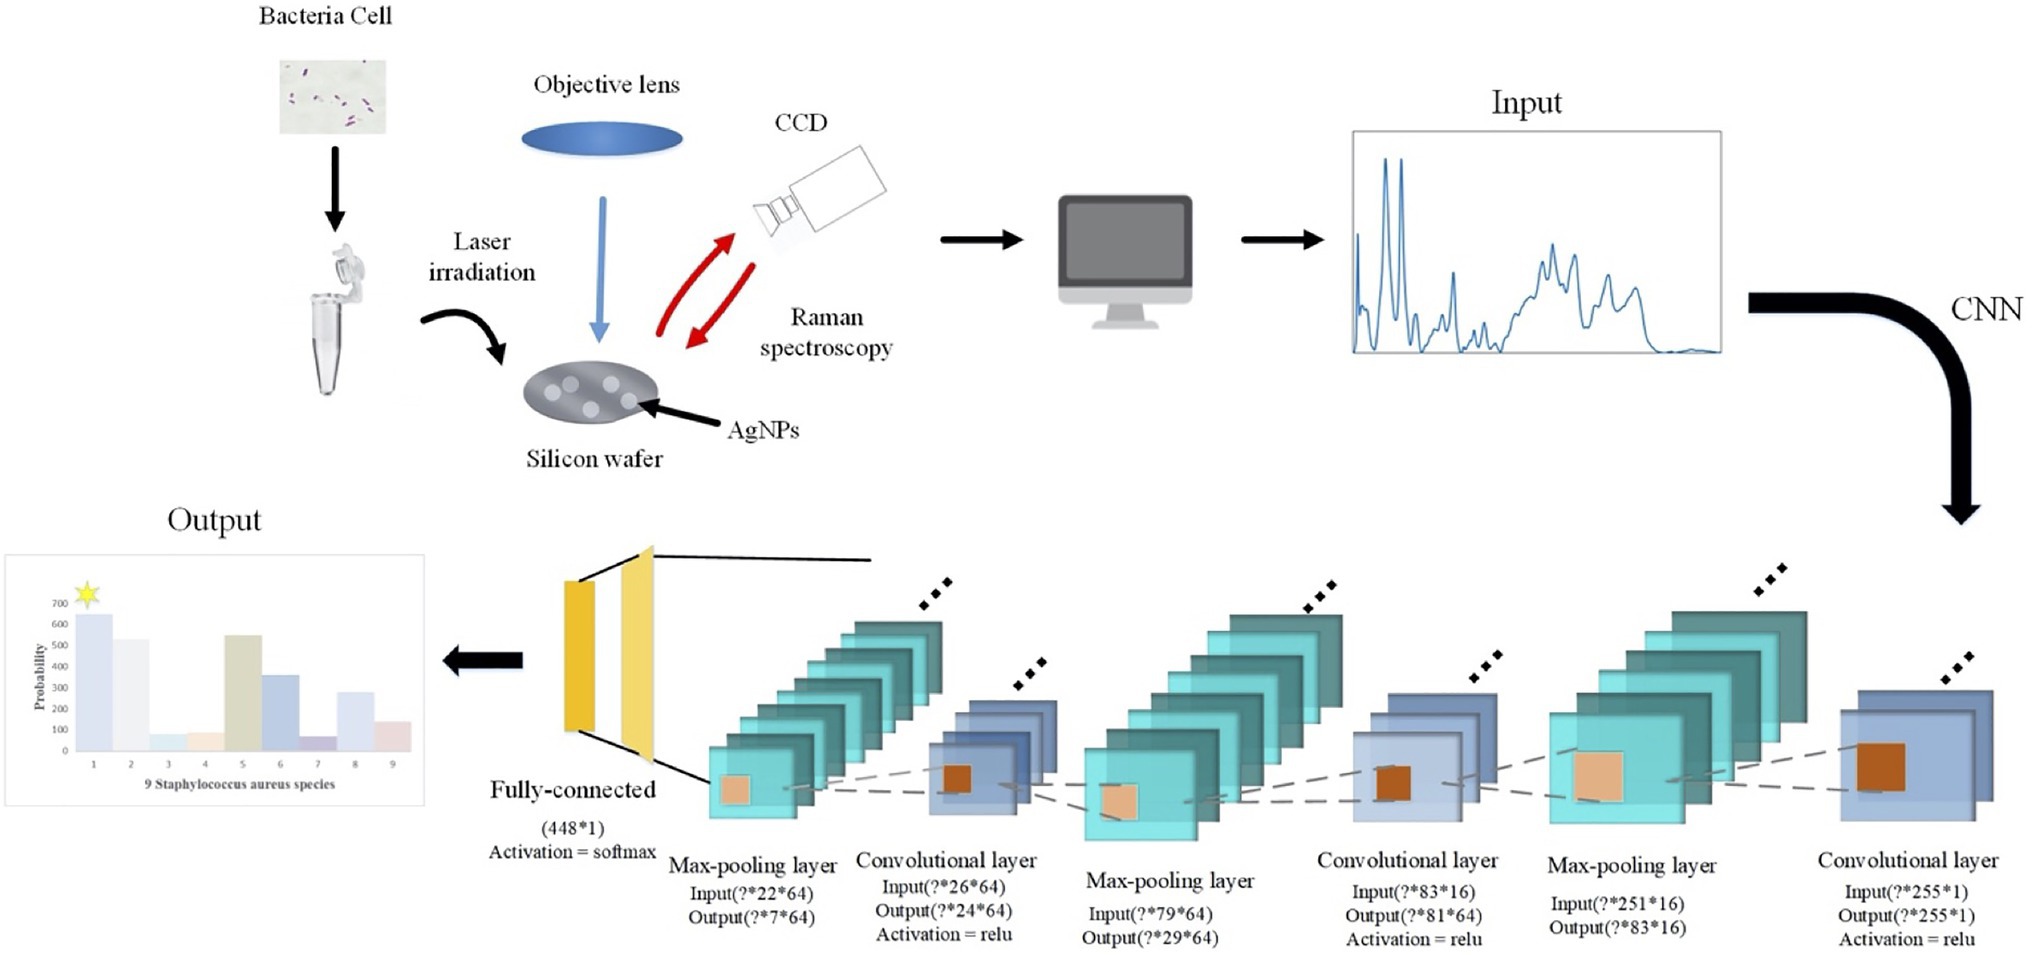
Figure 1. Schematic illustration of convolutional neural network (CNN) data flow during processing surface enhanced Raman spectra of Staphylococcus species. In specificity, a particular strain was first mixed with silver colloidal nanoparticles (AgNPs) and then smeared on the silicon chip. Raman spectrum fingerprinting data in the smearing area were then generated. In-house python scripts were used to perform principal component analysis (PCA) for dimension reduction and spectral normalization, which was then processed through alternating convolutional layers and pooling layers via different activation functions in order to classify and predict the nine Staphylococcus species.
In this study, LSTM contained an input layer, two hidden layers, two regularization methods, and a fully-linked neural layer. The two hidden layers used the relu and sigmoid activation functions, respectively (Figure 2). The optimization algorithm used for the loss function was adam while the single training iteration (epochs) was set to 50.
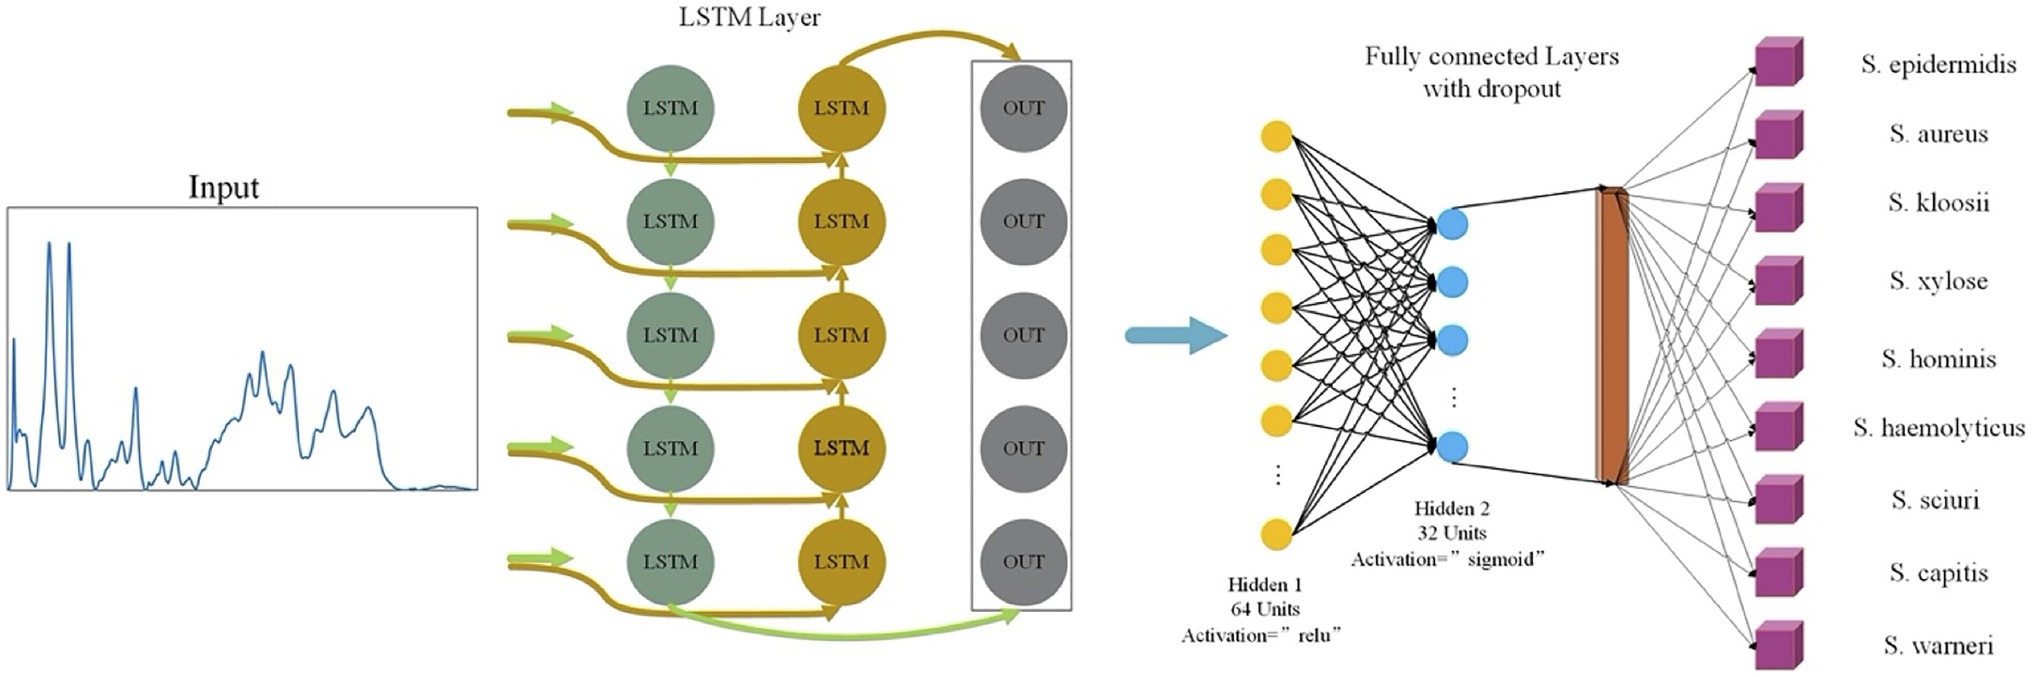
Figure 2. Schematic illustration of long short-term memory neural network (LSTM) analysis of Staphylococcus Raman spectra. The one-dimensional Raman spectra data were first normalized and then used as input for LSTM. After a fully connected layer and regularization operation, different activation functions were used to improve the accuracy of the model. After going through a fully connected neural layer, Raman spectral data of Staphylococcus species were correspondingly classified and predicted.
Whether using supervised machine learning algorithms for regression, classification, or clustering, quantitative indicators for testing the effects of supervised machine learning models are inevitable and important. Therefore, all these algorithms were scored by the accuracy rate (ACC), recall rate (Recall), F1 score (F1-score), Matthews correlation coefficient (MCC), precision (Pre), and KAPPA coefficient (kappa). In order to compare the stability of the selected models, this study also used 5-fold cross-validation to evaluate the constructed models. Briefly, in each independent test, the whole data set was randomly divided into five subsets, four of which were used as training data sets while the remaining one was used as a verification dataset. The verification process could be repeated for different times to evaluate the stability of the model. The average accuracy of all verification segmentations was taken as the overall accuracy. In addition, in order to estimate a classifier’s ability to predict a certain sample at a specific threshold, receiver operating characteristic (ROC) curves were drawn for all the machine learning methods. The closer the ROC curve was to the upper left corner, the higher the true correct rate (TPR) of the test, and the lower the false correct rate (FPR). Therefore, the point on the ROC curve closest to the upper left corner had the largest sum of sensitivity and specificity. Finally, the classification and prediction results were visualized using a confusion matrix for CNN model. Rows corresponded to bacterial species identified by standard biochemical tests and MALDI-TOF MS (true class) while columns corresponded to bacterial identification predicted by the CNN algorithm. For a detailed procedure of machine learning analysis of Staphylococcus Raman spectra in this study, please refer to Figure 3.
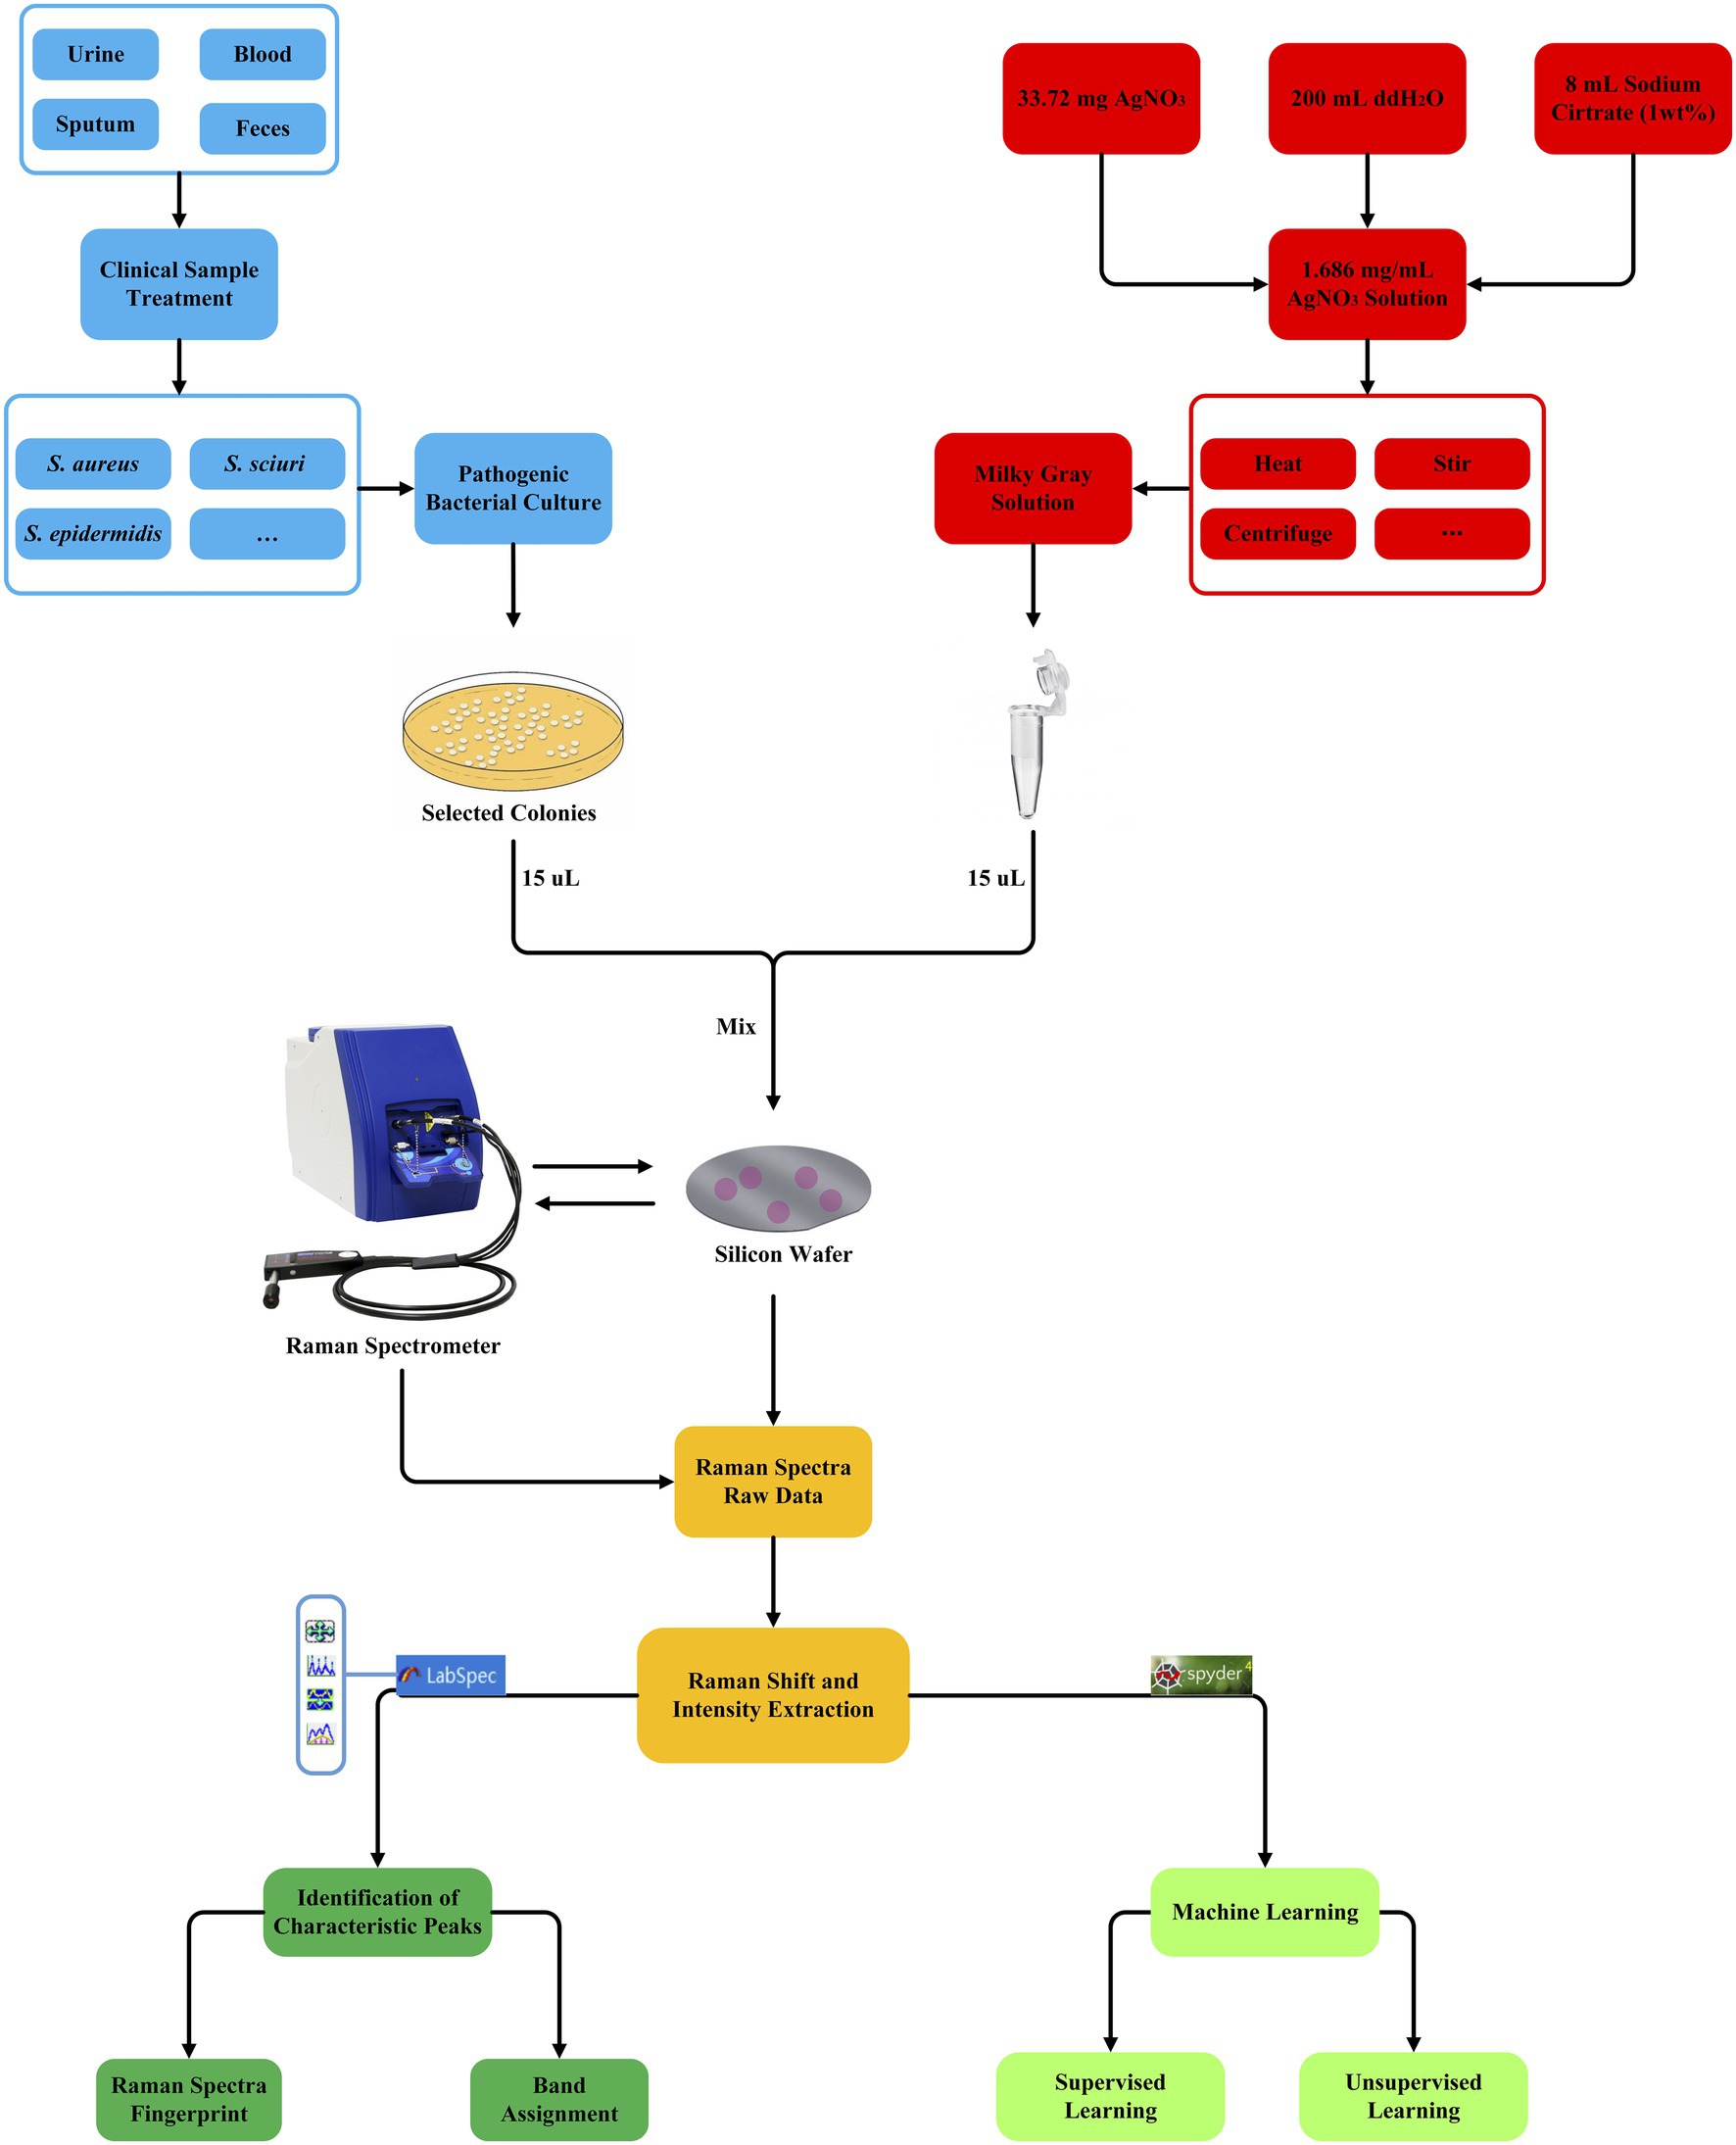
Figure 3. Schematic illustration of the generation and analysis of SERS spectra for the nine Staphylococcus species, which involve clinical sample collection and bacterial culture (blue square), AgNO3 silver nanoparticle solution preparation (red square), bacteria and AgNO3 solution mixture, Raman spectroscopy (yellow square), Raman spectra raw data pre-treatment (dark green square), and unsupervised and supervised machine learning algorithms (light green square).
Average Raman spectra with SE (shaded error bands) could clearly and quantitatively display the general trend and also reflect the data variance in the Raman spectra, which were present in Figure 4 for all the nine Staphylococcus species explored in this study. It was noteworthy that we used 20% of the SE at a given Raman shift for the visualization of the error bands. Since band shape was important for identifying characteristic peaks, we also used Savitzgy-Golay smoothing algorithm (also known as moving polynomial method) to preserve the band shape, which worked better than other methods such as moving average algorithm and Fourier filter that might lead to the loss of spectral information (Radzol et al., 2014).
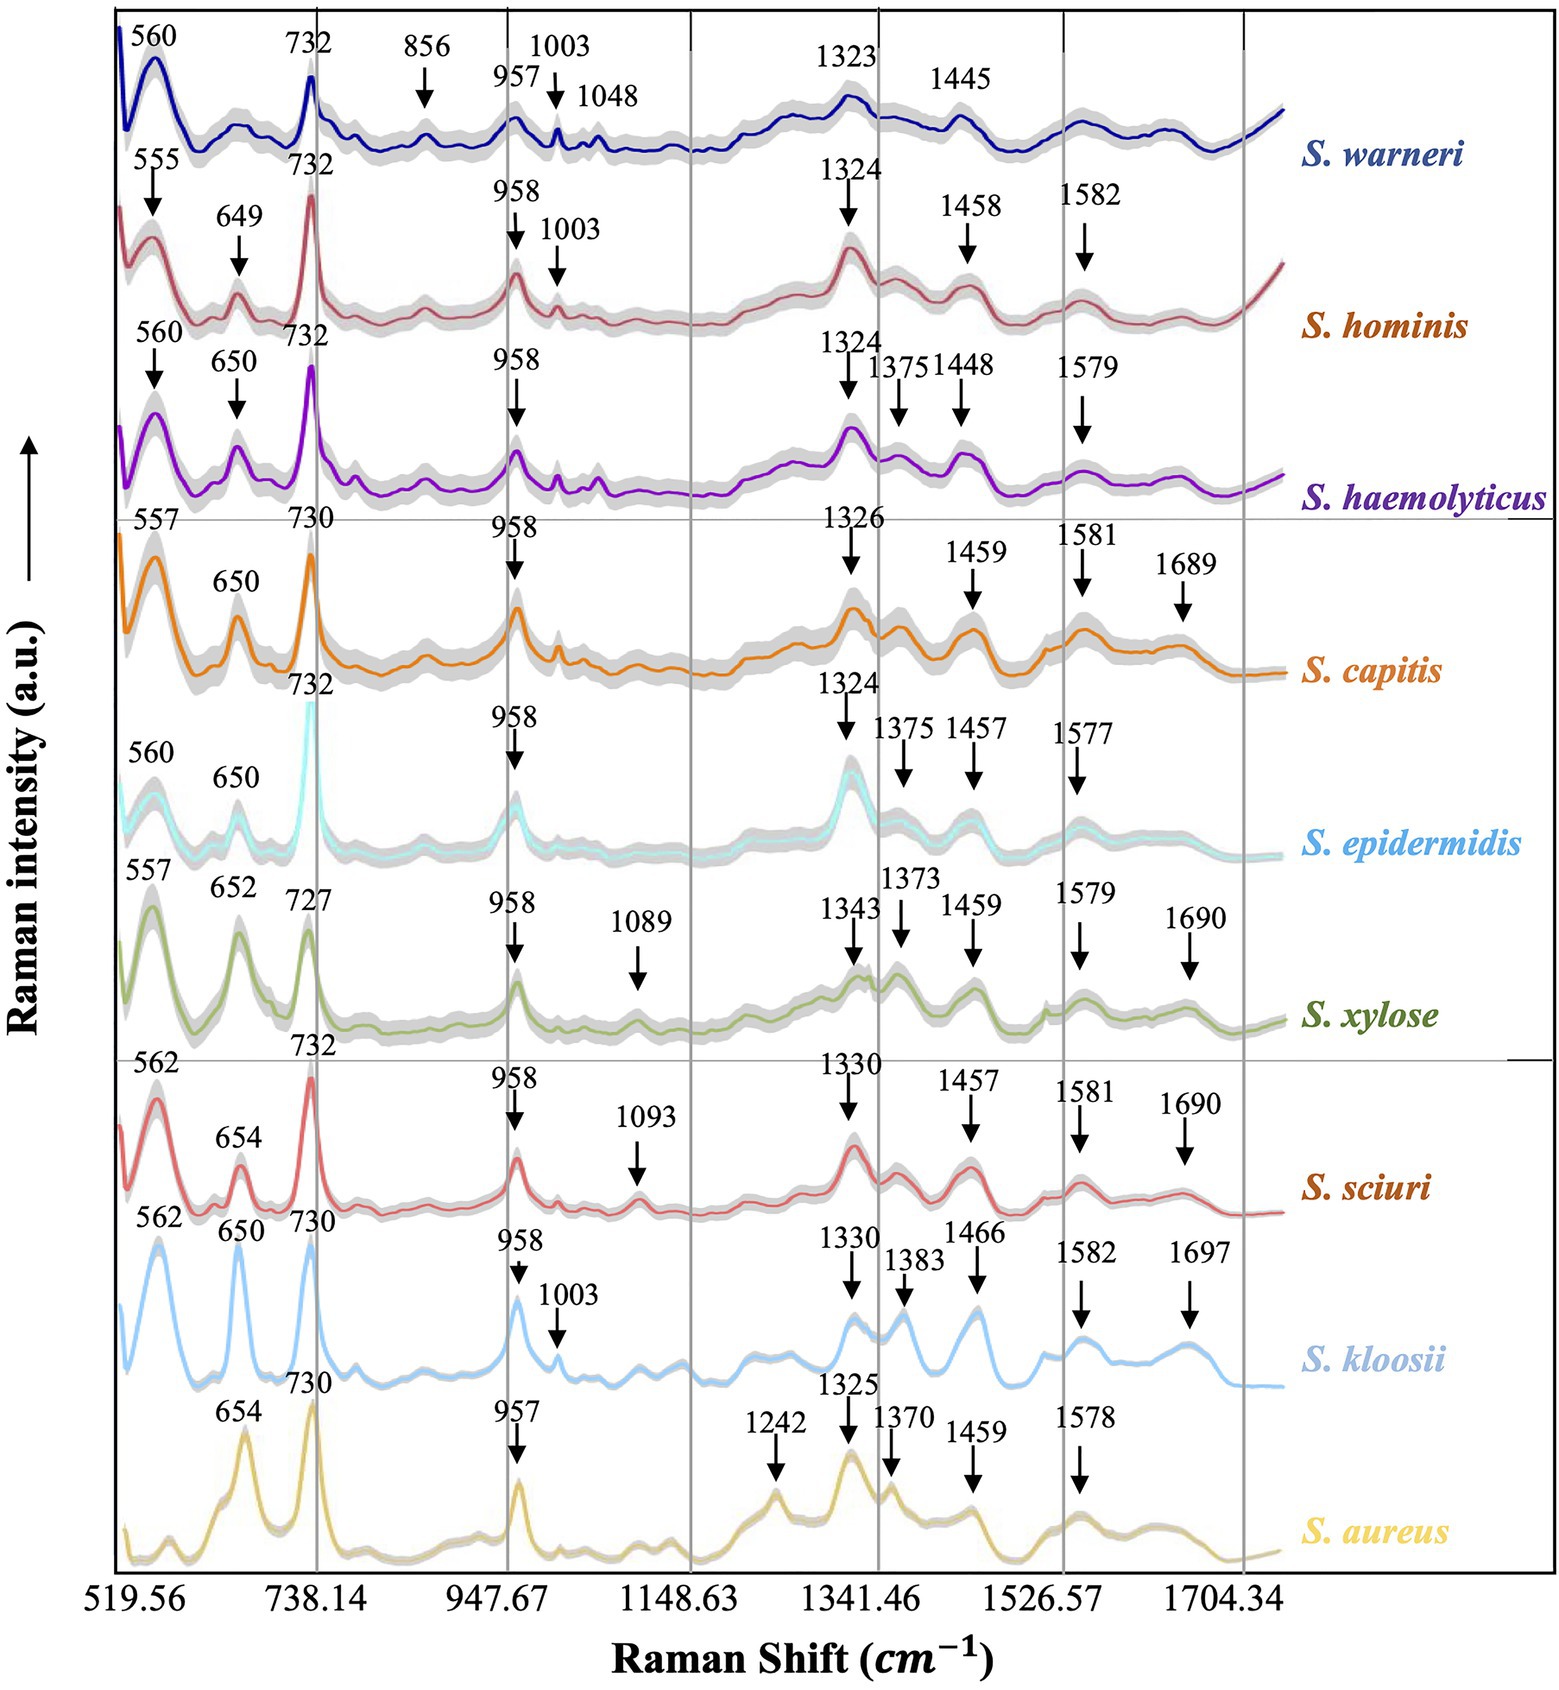
Figure 4. Averaged surface enhanced Raman spectra of nine clinical Staphylococcus species. For each Raman spectrum, multiple spectra were used, that is, Staphylococcus aureus (n=531), Staphylococcus capitis (n=282), Staphylococcus epidermidis (n=649), Staphylococcus haemolyticus (n=360), Staphylococcus hominis (n=550), Staphylococcus kloosii (n=80), Staphylococcus sciuri (n=70), Staphylococcus warneri (n=140), and Staphylococcus xylose (n=90). The X-axis represented Raman shift that ranged from 519.56 to 1,800.81cm−1 while the Y-axis represented Raman intensity in arbitrary unit (a.u.). For each spectrum, characteristic peaks were marked with black arrows and numbered with the corresponding Raman shift. Shadow region for each spectrum represented 20% of Raman shift SD.
Since each Raman spectrum contained multiple peaks, it was rather difficult to recognize the individual contributions of the numerous peaks. Thus, the average Raman spectra of the nine Staphylococcus species were analyzed by Gauss-Loren function via LabSpec software (Tagliaferro et al., 2020), through which characteristic peaks for each average Raman spectrum were identified and were marked with black arrows in Figure 4. According to previous studies, spectral peaks could be assigned to known metabolites; however, due to the complexity of the Raman spectra, identities of the metabolites could only be speculated (Nguyen et al., 2013). As for the Raman spectral results in this study, different peak combinations were observed for each Staphylococcus species (Table 1).
In specificity, all the species had prominent peaks at 555–562cm−1 (Guanine/Thymine/Uridine) except for S. aureus (Mert et al., 2015). As for Raman shift from 649 to 654 cm−1 (Guanine), all the species had characteristic peaks within this region except for S. warneri (Ahmed et al., 2013) while S. warneri had unique peak at 856cm−1 (Tyrosine; Chaturvedi et al., 2016). In addition, characteristic peaks at 727/730/732cm−1 (nucleic acids) were also present in all Staphylococcus species (Chao and Zhang, 2012). As for the C=C double bond (957 and 958cm−1), this characteristic peak was also identified in the Raman spectra of all Staphylococcus species (Ahmed et al., 2013). In the strains S. warneri, S. hominis, and S. kloosii, a unique characteristic peak 1,003cm−1 (C-H) was identified in all of them while other strains did not have this peak (Chaturvedi et al., 2016). It was also observed that P-O (1,048cm−1) was only present in S. warneri (Chen et al., 2015). In terms of phenylalanine (1,089, 1,093cm−1), only S. xylose and S. sciuri showed the reported peaks (Ahmed et al., 2013). In addition, all strains had the peak of adenine ring (1,323–1,330cm−1; Chisanga et al., 2018) while S. haemolyticus, S. epidermidis, S. xylose, S. kloosii, and S. aureus had a unique peak at 1,370–1,383cm−1 for the amide III (Perez-Guaita et al., 2016). It was noteworthy that S. aureus also had amide III at the characteristic peak 1,242cm−1 (Chisanga et al., 2018). The identification of peaks in the range of 1,445–1,466cm−1 in all the Staphylococcus species was indicative of N=N aromatic and aliphatic substance (Nguyen et al., 2013). In addition, guanine and adenine peaks (1,577–1,582cm−1) were observed in all the species except for S. warneri strains (Chisanga et al., 2018). Finally, the characteristic peak for the combination of C=O and C=C bonds in the range of 1,689–1,697cm−1 was seen in S. capitis, S. xylose, S. sciuri, and S. kloosii (Perez-Guaita et al., 2016).
Unsupervised learning algorithms aim to seek the representations of a mixed dataset by splitting the data into well-separated groups called clusters. Thus, unsupervised methods are mainly used for clustering data without a priori knowledge (Sikirzhytski et al., 2010). In this study, we employed three commonly used unsupervised machine learning algorithms for clustering surface enhanced Raman spectra of Staphylococcus species, which included K-means, DBSCAN, and AGNES. K-means partitions data into k distinct clusters based on distance to the centroid of a cluster, which have been successfully applied to the analysis of Raman spectra from biological samples such as breast cancer (Kothari et al., 2021), colonic cancer (Beljebbar et al., 2009), and macromolecules (Pahlow et al., 2018). As for the DBSCAN algorithm, it is a density-based clustering that looks for high-density areas and extends clusters from them (Guyeux et al., 2019). Thus, the pre-set number of clusters is not required. In terms of AGNES, it uses hierarchical agglomerative approach to divide a dataset into clusters via successive fusions of the individual objects (Oyelade et al., 2016). However, the three methods are rarely used for Raman spectral analyses. In this study, all the clustering results were visualized in Figure 5 via Python scikit-learn library, from which a clear picture of clustering effects could be observed. In order to obtain a qualitative comparison of the performance of the three methods, Rand Index, a metric for the assessment of cluster algorithm performance, was calculated (Rand, 1971). According to the result, DBSCAN had the highest score of 0.9733 while Rand indices for K-means and AGNES are 0.933 and 0.9291, respectively. In sum, the result suggested that the discrimination of Staphylococcus species via unsupervised machine learning analysis of surface enhanced Raman spectra was plausible, which had the potential to be applied in clinical settings.
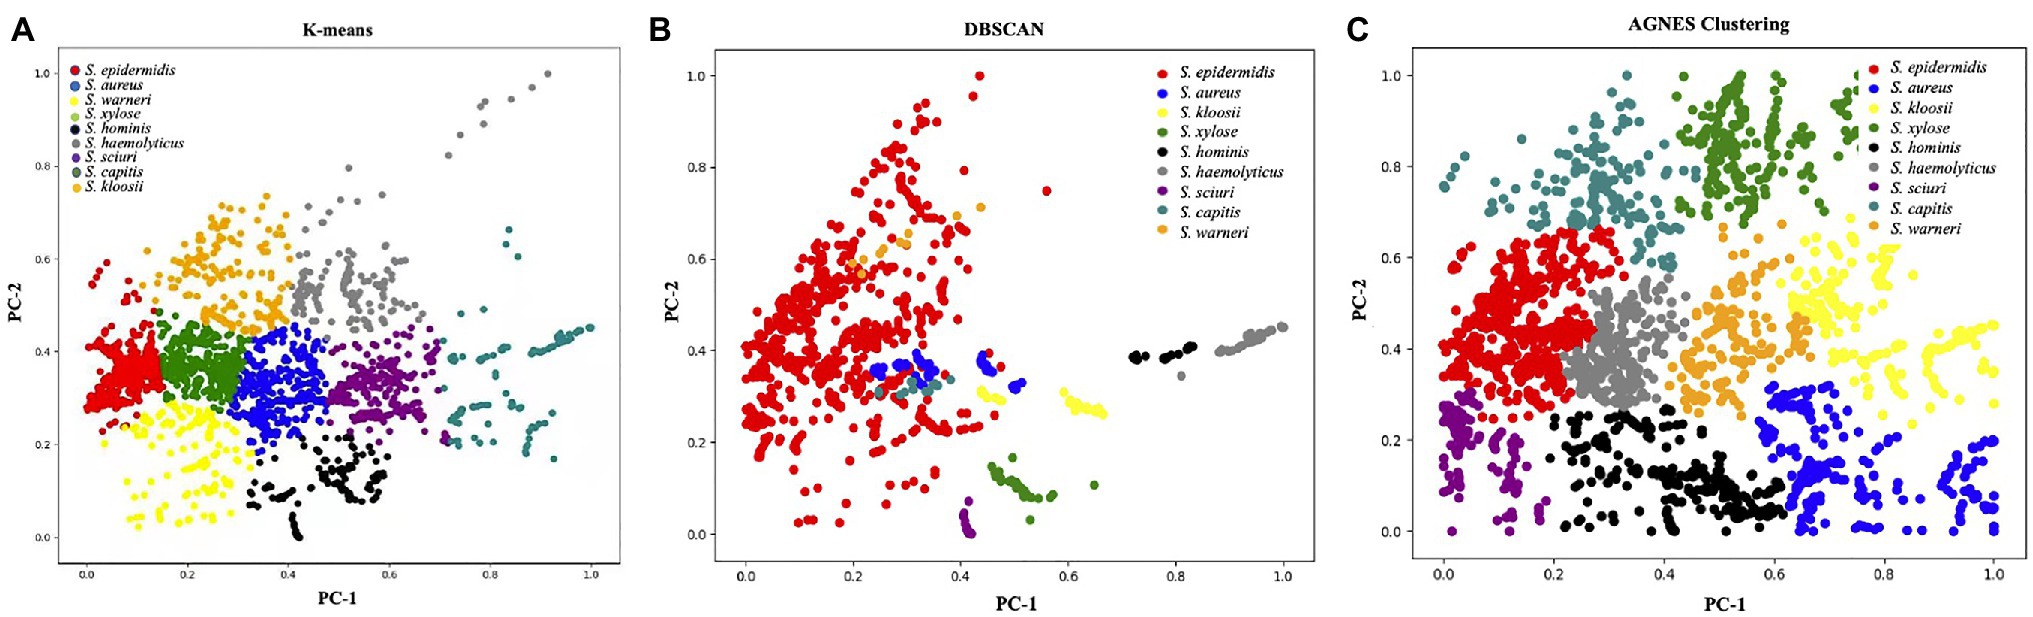
Figure 5. Clustering results of nine Staphylococcus species via (A) K-means, (B) density-based spatial clustering of applications with noise (DBSCAN), and (C) agglomerative nesting (AGNES). The PCA score plot showed the two directions of largest variance in the data and provided valuable insights into the nature of the surface enhanced Raman spectra of Staphylococcus species. Each color corresponded to one group of Staphylococcus species as denoted in the figure legend.
Supervised learning is to use an algorithm to learn the mapping function Y=f(X), where X is an input variable while Y is an output variable. The purpose of the learning process is to use unknown input data X to accurately predict its output Y. Briefly, supervised learning algorithms aim to establish a correlation between known input variables and dependent variables (labels) via data training in order to predict the outcomes of new input variables (Xu and Jackson, 2019).
In this study, we compared 10 commonly encountered methods, which were KNN, DT, RF, GB, SVM, AdaBoost, GNB, QDA, CNN, and LSTM, in terms of their capacities in the analysis of Staphylococcus Raman spectral data. Through calculating and comparing the machine learning scores, that is, ACC, Recall, F1-score, MCC, Pre, and KAPPA, we revealed that the deep learning algorithm CNN had the best prediction accuracy (98.21%), together with the largest AUCs (99.93%). Recently, Ho et al. (2019) also compared the performance of classic machine learning methods, that is, logistic regression (LR) and SVM, with the deep learning algorithm CNN, which showed a similar result. In particular, LR and SVM achieved accuracies of 75.7 and 74.9%, respectively, while CNN had an average isolate-level accuracy of 82.2±0.3% (Ho et al., 2019). Except for CNN, another deep learning algorithm LSTM that was rarely used for Raman spectral analysis also performed well with high ACC (94.33%) and AUC (99.83%) values. In addition, classic methods, such as KNN, RF, DT, and GB also achieved good prediction accuracies while SVM, AdaBoost, QDA, and GNB were not recommended for the analysis of Raman spectra of Staphylococcus species. Predication performance of the 10 supervised machine learning methods is present in Table 2.
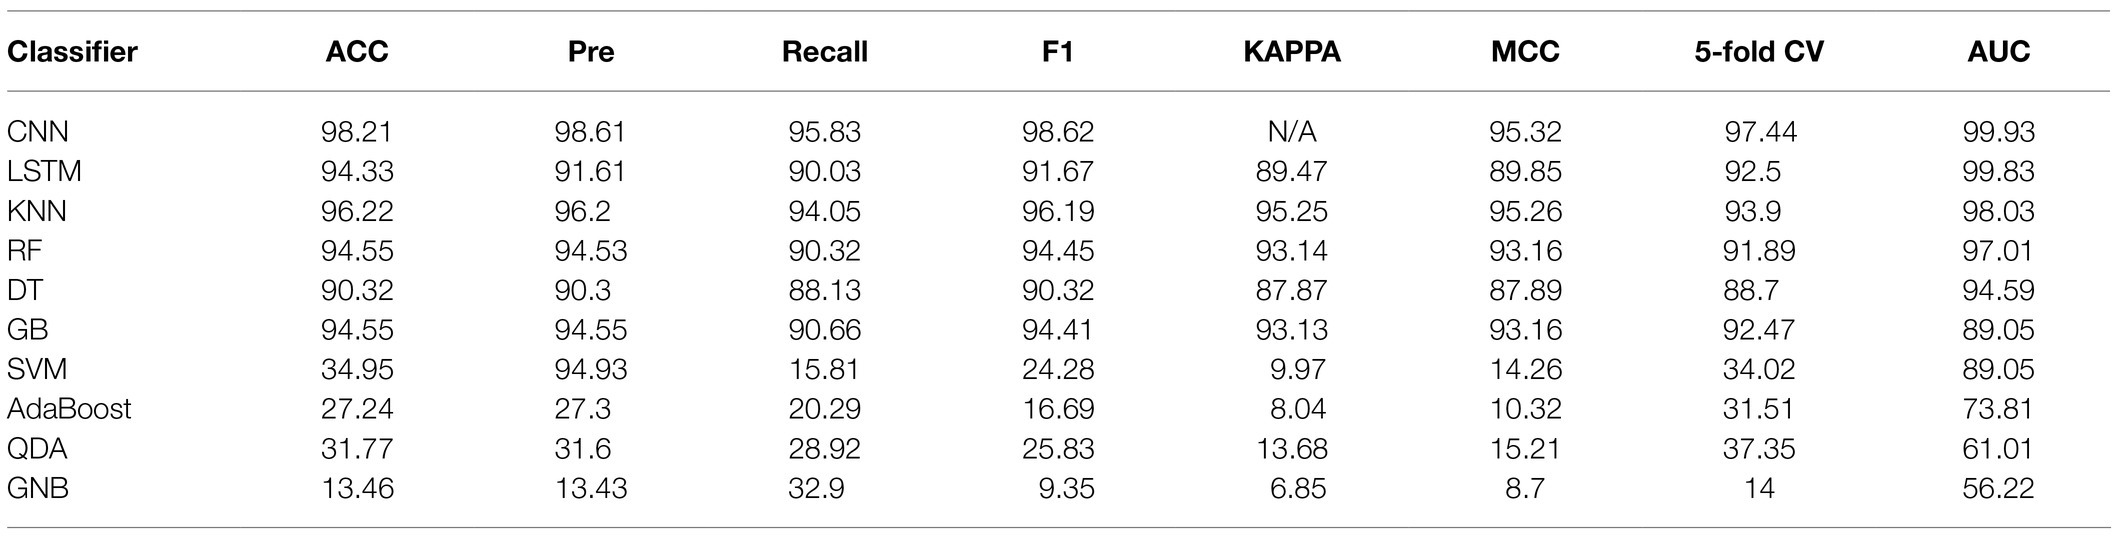
Table 2. Comparison of 10 machine learning algorithms in terms of their capacities in the analysis of Staphylococcus Raman spectral data.
Since CNN achieved the highest prediction accuracy and largest AUC value, we investigated into data analysis procedure in order to explain how the algorithm was refined in this study. In specificity, For the CNN model, it can automatically extract features from things without artificial intervention, avoiding complex data preprocessing procedures. In addition, the convolutional layer and the pooling layer in the CNN algorithm are alternately applied, using different convolution kernels and the entire range of data for convolution. Thus, the algorithm greatly simplified the amount of data, improved computing efficiency and robustness, and completed nonlinear multi-classification through the fully connected layer task. In this study, we used the classic deep learning model LeNet-5, with six convolutional layers, three pooling layers, and two fully connected layers, while the size of the convolution kernel is set to 3*1. Then, each Raman spectrum was input into the CNN in the form of one-dimensional data. The Raman shift ranged from 519.56 to 1,800.81cm−1, leading to the generation of a total of 667 Raman shifts. ReLU activation function was used to avoid the problems of gradient explosion and gradient disappearance, which speeded up the model convergence. The Adam loss function was used to avoid the model from falling into a local minimum. Since the recognition target format is in One-Hot Encoding form, categorical_crossentropy was used as the loss. In order to facilitate the orderly linking of neurons in the network, Flatten Layer was used to stretch the data into one column, followed by the Softmax output layer in order to realize multi-class identification of pathogenic bacteria samples.
Receiver operating characteristic curves compare sensitivity and specificity across a range of values for the ability of supervised machine learning methods to predict a dichotomous outcome while the area under the ROC curves (AUCs) mean overall accuracies in distinguishing Staphylococcus species among each other (Florkowski, 2008). Thus, ROC curves are a graphical demonstration of true positives and false-positives across a range of cut-offs. In this study, we compared the ROC curves of 10 supervised machine learning methods, together with the corresponding AUCs, which clearly showed that the top three methods with the best performances were CNN, LSTM, and KNN (Figure 6).
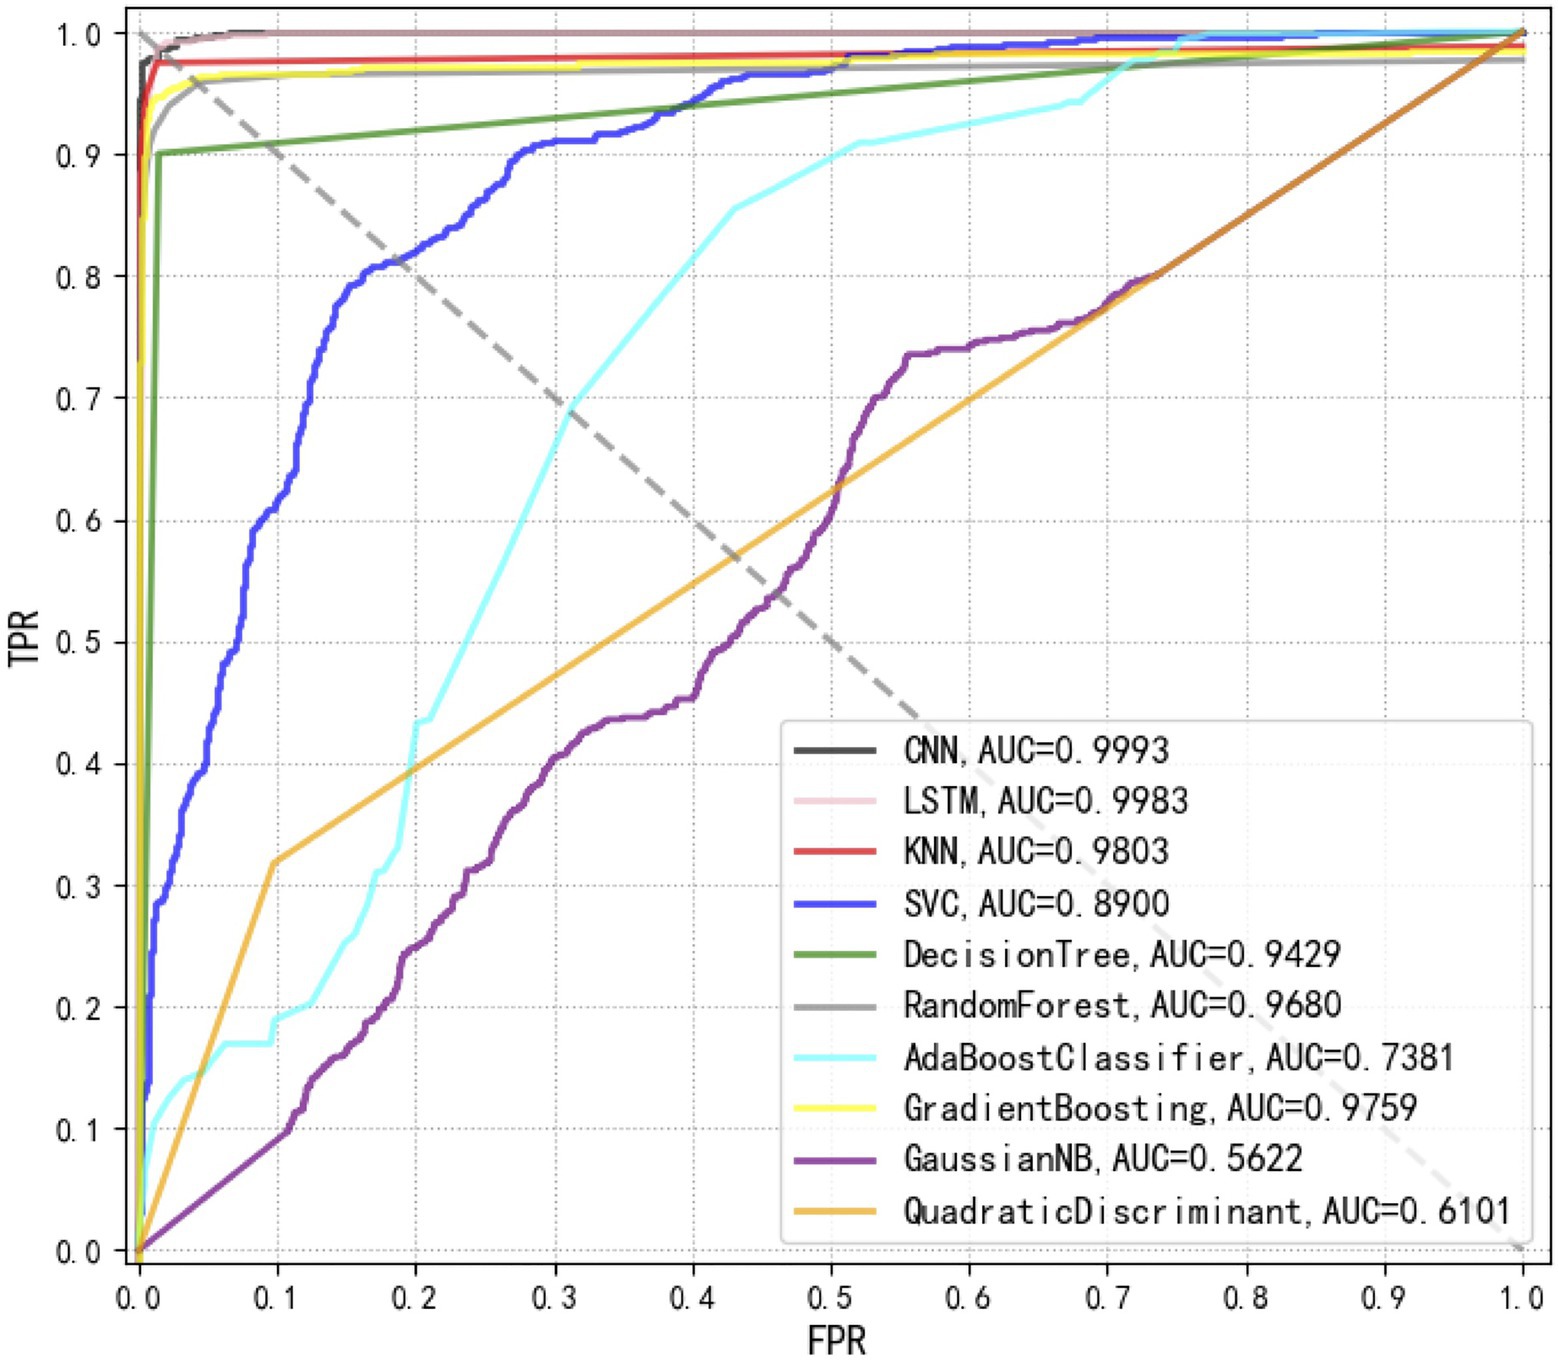
Figure 6. Comparison of receiver operating characteristic (ROC) curves used for the evaluation of the performance of 10 supervised machine learning algorithms. The closer the ROC curve is to the upper left corner, the higher the true correct rate (TPR) and the lower the false correct rate (FPR) of the test. According to the comparison, CNN achieved the best performance [area under curve (AUC)=0.9993] than all other algorithms.
Confusion matrix is a table that describes the classification results in detail, including true class and predicted class. Since CNN performed best in terms of Staphylococcus species prediction in this study, we calculated the corresponding confusion matrix of binary classification, which provided further classification details (Figure 7). In this matrix, the vertical axis denoted the true classes (actual classes of samples via standard biochemical tests and MALDI-TOF MS) while the horizontal axis represented the predicted classes. In addition, we classified the samples into nine categories, that is, nine Staphylococcus species. Using the confusion matrix, we evaluated the performance of the CNN model on each species. According to the matrix, the CNN model had the lowest accuracy for predicting S. hominis (75%) that was misclassified as S. epidermidis in 17% and as S. aureus in 8% of all the cases. On the other hand, the model had 100% accuracy in predicting the species S. aureus, S. kloosii, S. haemolyticus, and S. warneri.
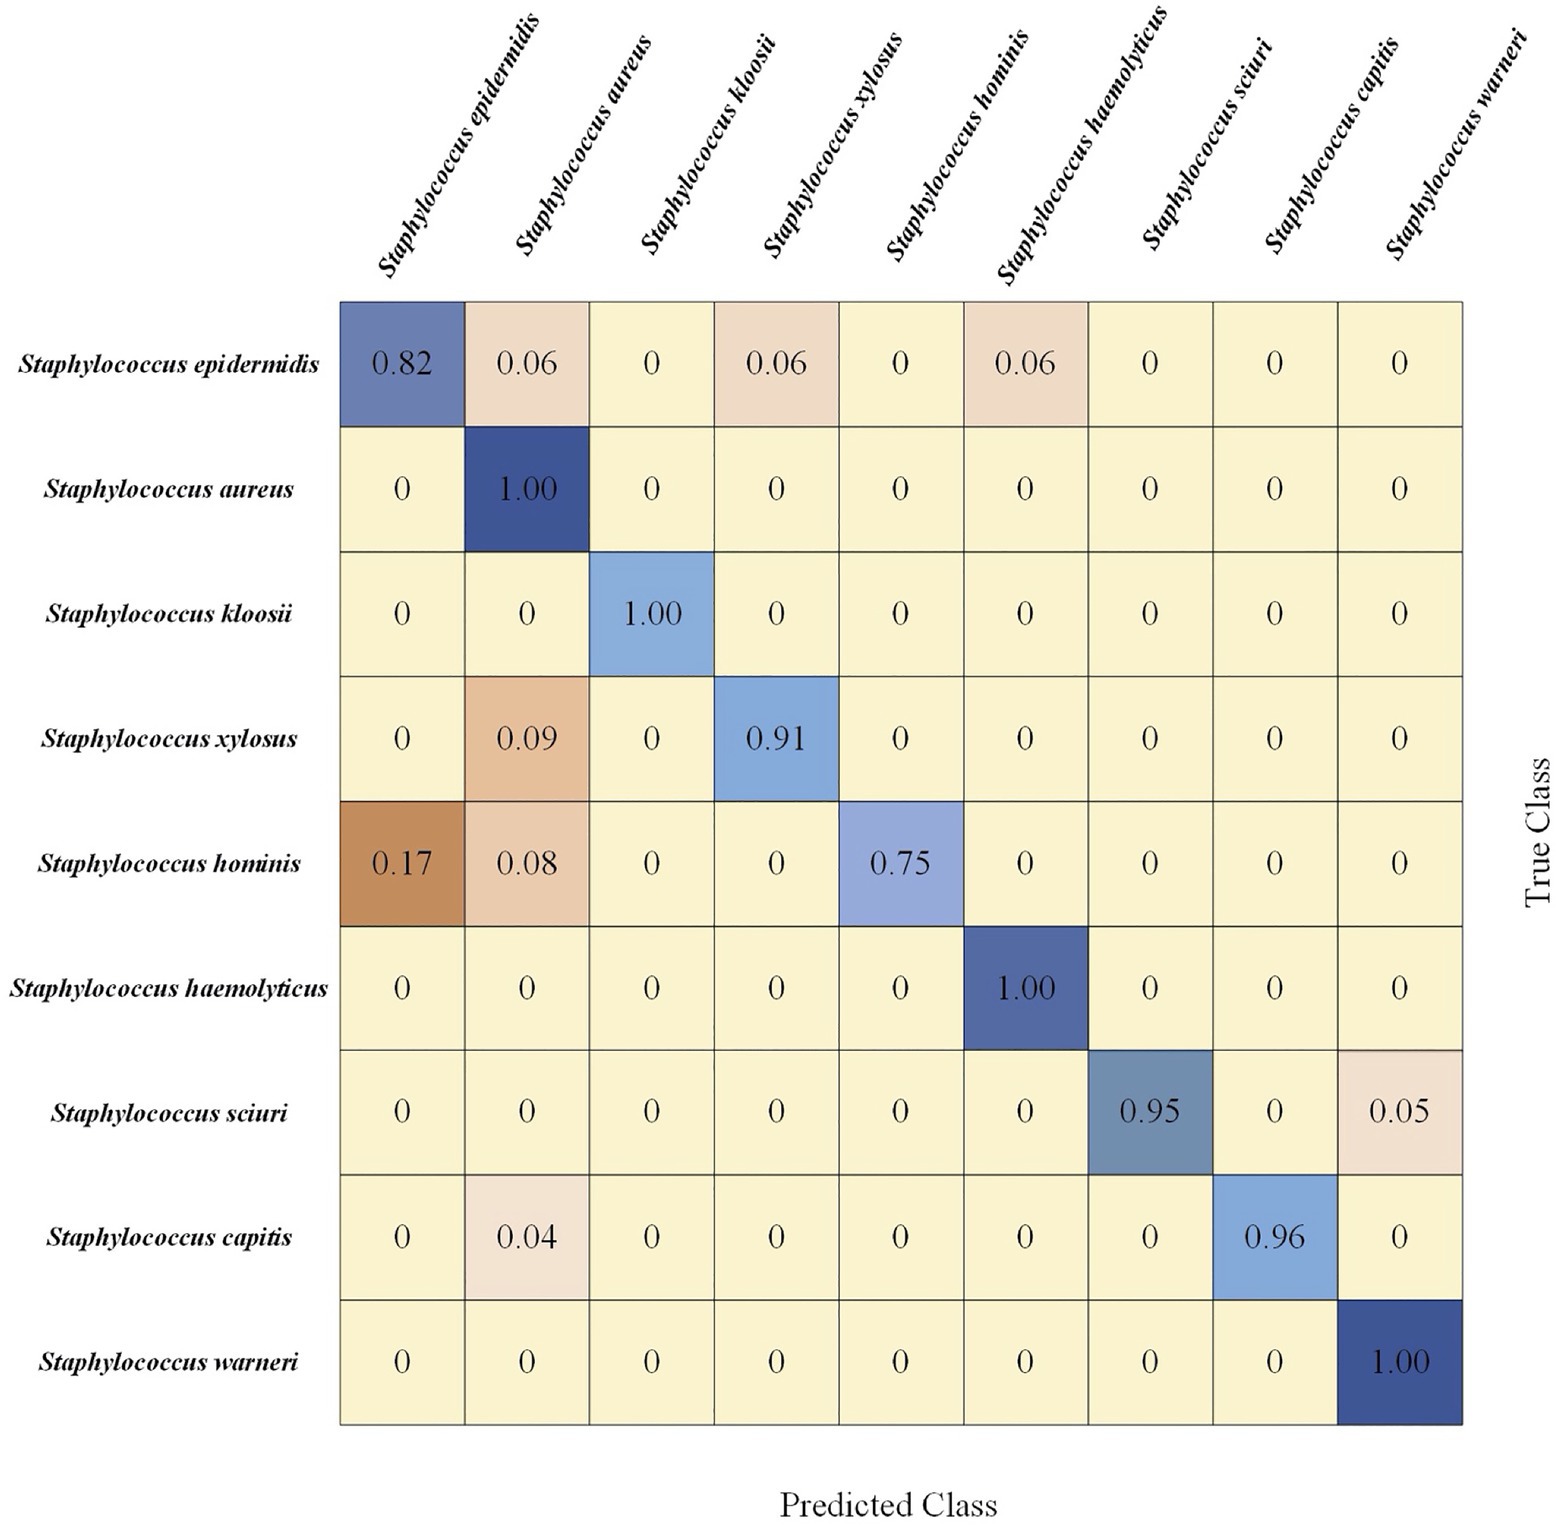
Figure 7. Confusion matrix of 5-fold cross-validated Staphylococcus species identification via CNN model. Rows corresponded to bacterial species identified by standard biochemical tests and matrix-assisted laser desorption/ionization-time of flight (MALDI-TOF) mass spectrometry (MS; true class) while columns corresponded to bacterial identification predicted by the CNN algorithm (predicted class). Numbers in the confusion matrix stood for the percentage of correctly classified (diagonal) or mis-classified (off-diagonal) spectra, respectively.
Conventional methods such as medium culture and biochemical reactions for bacterial species differentiations and phenotype profilings are sometimes laborious and time-consuming (Palomino, 2005) while commonly used molecular methods like PCR and enzyme-linked immunosorbent assay (ELISA) either require specially designed primers or have comparatively high false positive rates due to the instability of some antibodies (Sakamoto et al., 2017). As for the newly developed high-throughput sequencing technology, although the sequencing costs have dropped significantly, the complex data analysis pipeline and traditional clinical laboratory procedures somewhat restrict its wide application in clinical diagnosis (Bertelli and Greub, 2013). Compared to the above-mentioned methods, Raman spectroscopy is a fast, sensitive, low-cost, label-free, and non-destructive microbial detection and identification technique (Maruthamuthu et al., 2020), which has great potential in facilitating the improvement of the clinical diagnosis (Wang et al., 2021). In fact, a variety of studies has already used Raman spectroscopy for the identification of Staphylococcus species. For example, Samek et al. (2008) analyzed the Raman spectra of S. epidermidis related to medical device-associated infections, based on which different S. epidermidis clones were discriminated via combinational analyses of characteristic peaks. Later, Rebrošová et al. (2017) used three supervised learning methods, LDA, 1NN, and SVM, to analyze 16 Staphylococcus strains in order to differentiate between S. aureus and S. epidermidis strains.
Due to the low signal-to-noise ratio of Raman spectroscopy from bacterial species and phenotypes, it is difficult to quickly and accurately characterize these biological samples (Zhu et al., 2019). Thus, SERS was developed to enhance Raman scattering effects. For example, Chen et al. (2019) performed the SERS through positively charged silver nanoparticles and successfully identified MRSA S. aureus with almost 100% accuracy. However, it is noteworthy that silver nanoparticles are toxic to bacterial organisms, which would affect the experimental results and cause the variation of Raman spectra (Cui et al., 2015). In this study, we used the same amount of AgNPs (15μl) to mix with the 15μl solution of selected colonies of Staphylococcus species, which will generate similar impacts on bacterial metabolism and physiology. In addition, for the same species, we have multiple strains for Raman spectral analyses, which would be considered as biological replicates and reduce the intra-group variations. During the computational analysis of Raman spectra, the whole spectra rather than specific peaks were analyzed, which would also reduce the influences of small variations in the fingerprinting spectra caused by the toxicity of silver nanoparticles. Characteristic peaks could not only reflect the unique patterns of Raman spectra but also correspond to specific compositions of bacterial species (de Siqueira E Oliveira et al., 2020). Thus, it was biologically meaningful to analyze the characteristic peaks of Raman spectrum for each Staphylococcus species. Currently, a variety of computational tools like LabSpec 6 (HORIBA Scientific, Japan), and algorithms like occlusion-based Raman spectra feature extraction (ORSFE) have been developed for identifying characteristic peaks in Raman spectra (Lu et al., 2020), all of which could perform well on Raman spectra for feature extraction.
In addition, Raman spectra are rather complex and classical linear methods are no longer sufficient for data processing (Lussier et al., 2020). Thus, advanced computational methods are essential in processing these sophisticated data. In this study, we compared the capacities of machine learning methods in discriminating and predicting bacterial species through the analyses of the SERS spectra of nine Staphylococcus species. For unsupervised machine learning analysis of Raman spectra, previous studies have successfully applied PCA and hierarchical cluster analysis (HCA) on bacterial pathogens such as meningococcus and mycobacteria (Harz et al., 2009; Stöckel et al., 2015). However, clustering algorithms, such as K-means, DBSCAN, and AGNES are rarely used. Our quantitative comparison shows that DBSCAN has the best clustering performance for the SERS spectra of nine Staphylococcus species. In particular, DBSCAN is a very typical density clustering algorithm. Compared with K-means and AGNES that are generally suitable for convex sample sets, DBSCAN can be applied to both convex and non-convex sample sets. The significant advantage of the DBSCAN algorithm is that the clustering speed is fast and it can effectively deal with noisy points and find spatial clusters of arbitrary shapes. Raman spectroscopy data have different signal intensities at different Raman shifts. In this study, Raman spectra were first passed through data preprocessing procedures, including curve smoothing, baseline correction, polynomial fitting, and intensity normalization. The DBSCAN algorithm then calculates the average Euclidean distance between the Raman shift and the signal intensity of each sample and each cluster, and selects the smallest distance to divide the clusters. Parameters were manually adjusted and the key parameters used in the DBSCAN algorithm were set to min_sample=9 and eps=0.7.
Besides discriminating bacterial species into different groups, we also compared supervised learning algorithms for the predictions of bacterial species. A variety of supervised machine learning methods have been used for Raman spectral analyses, such as SVM (Moawad et al., 2019), RF (Ren et al., 2017), CNN (Wang et al., 2020), KNN (Uysal Ciloglu et al., 2020), and DT (Uysal Ciloglu et al., 2020), etc. Although many supervised learning methods have been used for various bacterial species, which leads to comparatively high prediction accuracies, there are rarely comparative studies of the performance of supervised machine learning methods in surface enhanced Raman spectral analysis. In this study, we compared 10 commonly used supervised learning algorithms for their capacities in Raman spectral analysis, among which CNN and LSTM topped other algorithms and performed the best. Other methods, such as KNN, RF, DT, and GB also achieved high level of prediction accuracies but did not surpass CNN and LSTM. In particular, Raman spectroscopy generates fingerprinting spectra that are difficult to avoid the influence of various objective factors during the acquisition process. Thus, it is necessary to clean and preprocess the spectral data. After that, we compared eight traditional supervised learning algorithms and two deep learning algorithms. According to the results, KNN has the highest accuracy among traditional machine learning algorithms, with an accuracy of 96.22%, which can effectively distinguish nine different Staphylococcus species. The accuracy of RF and DT is slightly lower than that of KNN, and the accuracy is up to 90%.
For those who are not familiar with the preprocessing process of Raman spectroscopy of pathogenic bacteria, the process of spectral preprocessing is a complicated process. Thus, in this study, we applied two deep learning methods, CNN and LSTM, to remove complex pre-processing procedures through automatically extracting spectral features based on the construction of convolutional layers, pooling layers, fully connected layers, and activation functions. The accuracy rates of CNN and LSTM reached 98.21 and 94.33% while the AUC values reached 99.93 and 99.83%, respectively. In order to reflect the generalization ability of the deep learning algorithm, this study also used a 5-fold cross-validation method to objectively evaluate the robustness of the model. The cross-validation results for CNN and LSTM reached 97.44 and 92.5%, respectively, which showed that deep learning algorithms had strong classification and prediction ability in the identification of bacterial pathogen identification through Raman spectra. However, these results were only based on laboratory cultures of Staphylococcus species. Further studies will be focusing on direct discrimination and prediction of bacterial pathogens from clinical samples, such as sputum, urine, and blood, etc., which, despite a very challenging question, will greatly facilitate the real world applications of Raman spectroscopy in clinical settings.
Raman spectroscopy has been widely used in the diagnosis of bacterial pathogens in terms of species differentiation, antibiotic resistance detection, and virulence factor identification (Rebrošová et al., 2017). In this study, we explored both unsupervised and supervised machine learning algorithms in terms of their capacities to discriminate and predict pathogenic Staphylococcus species via SERS spectra. According to the results, DBSCAN showed the best clustering effect while CNN was the best prediction model for the SERS spectra of nine Staphylococcus species. However, there are many machine learning algorithms that have not been explored, which may be appropriate for the analysis of Raman spectra and worthy of further investigation. Moreover, machine learning algorithms should also be applied for more sophisticated situations, such as identifying bacterial species directly from clinical samples, rather than relying on isolated and cultured bacterial colonies. Specialized Raman spectral database for clinically important bacterial pathogens should also be constructed, which could greatly improve the implementation of Raman spectroscopy in clinical settings. Taken together, this study showed the great potential of Raman spectroscopy in culture-free pathogen identification that could facilitate the fast and accurate clinical diagnosis and swift control of infectious diseases.
The original contributions presented in the study are included in the article/Supplementary Material, further inquiries can be directed to the corresponding authors.
LW conceived and designed the experiments. LW, Z-BZ, and BG contributed to project administration. J-WT, Q-HL, X-CY, P-BW, XL, and X-XK carried out the computational and experimental work. LW, J-WT, Q-HL, Y-CP, and XL wrote and revised the manuscript. LW and BG provided platform, resources, and student supervision. All authors contributed to the article and approved the submitted version.
LW was supported by National Natural Science Foundation of China (31900022), Natural Science Foundation of Jiangsu Province (BK20180997), Young Science and Technology Innovation Team of Xuzhou Medical University (TD202001), and Jiangsu Qinglan Project (2020). BG was supported by National Natural Science Foundation of China (81871734 and 81471994), Key R&D Program of Jiangsu Province (BE2020646), Jiangsu Provincial Medical Talent (ZDRCA2016053), Six Talent Peaks Project of Jiangsu Province (WSN-135), Advanced Health Talent of Six One Project of Jiangsu Province (LGY2016042), and Research Foundation for Advanced Talents of Guangdong Provincial People’s Hospital (KJ012021097).
The authors declare that the research was conducted in the absence of any commercial or financial relationships that could be construed as a potential conflict of interest.
All claims expressed in this article are solely those of the authors and do not necessarily represent those of their affiliated organizations, or those of the publisher, the editors and the reviewers. Any product that may be evaluated in this article, or claim that may be made by its manufacturer, is not guaranteed or endorsed by the publisher.
We thank the reviewers for their thoughtful comments that greatly improve the quality of the manuscript.
The Supplementary Material for this article can be found online at: https://www.frontiersin.org/articles/10.3389/fmicb.2021.696921/full#supplementary-material
Supplementary Figure 1 | Dot matrix plot of the characteristic peaks in the nine Staphylococcus species that was identified via LabSpec 6.
Ahmed, M., Almagedi, S., and Yao, W. (2013). SERS signatures of foodborne pathogenic zoonotic bacteria using gold colloid. Int. J. Eng. Sci. Technol. 5, 810–821.
Beljebbar, A., Bouché, O., Diébold, M. D., Guillou, P. J., Palot, J. P., Eudes, D., et al. (2009). Identification of Raman spectroscopic markers for the characterization of normal and adenocarcinomatous colonic tissues. Crit. Rev. Oncol. Hematol. 72, 255–264. doi: 10.1016/j.critrevonc.2009.09.004
Bertelli, C., and Greub, G. (2013). Rapid bacterial genome sequencing: methods and applications in clinical microbiology. Clin. Microbiol. Infect. 19, 803–813. doi: 10.1111/1469-0691.12217
Bora, T. (2018). “Recent developments on metal nanoparticles for SERS applications,” in Noble and Precious Metals – Properties Nanoscale Effects and Applications. Vol. 6. eds. M. Seehra and A. Bristow (IntechOpen), 117–135.
Buckley, K., and Ryder, A. G. (2017). Applications of Raman spectroscopy in biopharmaceutical manufacturing: a short review. Appl. Spectrosc. 71, 1085–1116. doi: 10.1177/0003702817703270
Chao, Y., and Zhang, T. (2012). Surface-enhanced Raman scattering (SERS) revealing chemical variation during biofilm formation: from initial attachment to mature biofilm. Anal. Bioanal. Chem. 404, 1465–1475. doi: 10.1007/s00216-012-6225-y
Chaturvedi, D., Balaji, S., Bn, V. K., Ariese, F., Umapathy, S., and Rangarajan, A. (2016). Different phases of breast cancer cells: Raman study of immortalized, transformed, and invasive cells. Biosensors 6:57. doi: 10.3390/bios6040057
Chen, W., Lin, J., Chen, R., Feng, S., Yu, Y., Lin, D., et al. (2015). Detection and identification of Huo–Xue–Hua–Yu decoction (HXHYD) using surface-enhanced Raman scattering (SERS) spectroscopy and multivariate analysis. Laser Phys. Lett. 12:045602. doi: 10.1088/1612-2011/12/4/045602
Chen, X., Tang, M., Liu, Y., Huang, J., Liu, Z., Tian, H., et al. (2019). Surface-enhanced Raman scattering method for the identification of methicillin-resistant Staphylococcus aureus using positively charged silver nanoparticles. Microchim. Acta 186:102. doi: 10.1007/s00604-018-3150-6
Chisanga, M., Muhamadali, H., Ellis, D. I., and Goodacre, R. (2018). Surface-enhanced Raman scattering (SERS) in microbiology: illumination and enhancement of the microbial world. Appl. Spectrosc. 72, 987–1000. doi: 10.1177/0003702818764672
Cui, L., Chen, S., and Zhang, K. (2015). Effect of toxicity of Ag nanoparticles on SERS spectral variance of bacteria. Spectrochim. Acta A Mol. Biomol. Spectrosc. 137, 1061–1066. doi: 10.1016/j.saa.2014.08.155
D’Acunto, M., Gaeta, R., Capanna, R., and Franchi, A. (2020). Contribution of Raman spectroscopy to diagnosis and grading of chondrogenic tumors. Sci. Rep. 10:2155. doi: 10.1038/s41598-020-58848-0
Das, R. S., and Agrawal, Y. K. (2011). Raman spectroscopy: recent advancements, techniques and applications. Vib. Spectrosc. 57, 163–176. doi: 10.1016/j.vibspec.2011.08.003
de Siqueira E Oliveira, F. S., Da Silva, A. M., Pacheco, M. T. T., Giana, H. E., and Silveira, L. (2020). Biochemical characterization of pathogenic bacterial species using Raman spectroscopy and discrimination model based on selected spectral features. Lasers Med. Sci. 36, 289–302. doi: 10.1007/s10103-020-03028-9
Dong, D., and Zhao, C. (2017). Limitations and challenges of using Raman spectroscopy to detect the abiotic plant stress response. Proc. Natl. Acad. Sci. U. S. A. 114, E5486–E5487. doi: 10.1073/pnas.1707408114
Florkowski, C. M. (2008). Sensitivity, specificity, receiver-operating characteristic (ROC) curves and likelihood ratios: communicating the performance of diagnostic tests. Clin. Biochem. Rev. 29(Suppl. 1), 83–87.
Guyeux, C., Chrétien, S., Bou Tayeh, G., Demerjian, J., and Bahi, J. (2019). Introducing and comparing recent clustering methods for massive data management in the internet of things. J. Sens. Actuator Netw. 8:56. doi: 10.3390/jsan8040056
Harz, M., Kiehntopf, M., Stöckel, S., Rösch, P., Straube, E., Deufel, T., et al. (2009). Direct analysis of clinical relevant single bacterial cells from cerebrospinal fluid during bacterial meningitis by means of micro-Raman spectroscopy. J. Biophotonics 2, 70–80. doi: 10.1002/jbio.200810068
Ho, C.-S., Jean, N., Hogan, C. A., Blackmon, L., Jeffrey, S. S., Holodniy, M., et al. (2019). Rapid identification of pathogenic bacteria using Raman spectroscopy and deep learning. Nat. Commun. 10:4927. doi: 10.1038/s41467-019-12898-9
Jones, R. R., Hooper, D. C., Zhang, L., Wolverson, D., and Valev, V. K. (2019). Raman techniques: fundamentals and frontiers. Nanoscale Res. Lett. 14:231. doi: 10.1186/s11671-019-3039-2
Kothari, R., Jones, V., Mena, D., Bermúdez Reyes, V., Shon, Y., Smith, J. P., et al. (2021). Raman spectroscopy and artificial intelligence to predict the Bayesian probability of breast cancer. Sci. Rep. 11:6482. doi: 10.1038/s41598-021-85758-6
Lu, W., Chen, X., Wang, L., Li, H., and Fu, Y. V. (2020). Combination of an artificial intelligence approach and laser tweezers Raman spectroscopy for microbial identification. Anal. Chem. 92, 6288–6296. doi: 10.1021/acs.analchem.9b04946
Lussier, F., Thibault, V., Charron, B., Wallace, G. Q., and Masson, J.-F. (2020). Deep learning and artificial intelligence methods for Raman and surface-enhanced Raman scattering. Trends Anal. Chem. 124:115796. doi: 10.1016/j.trac.2019.115796
Marsland, S. (2014). Machine Learning: An Algorithmic Perspective. 2nd Edn Boca Raton, FL, USA: Chapman and Hall/CRC.
Maruthamuthu, M. K., Raffiee, A. H., De Oliveira, D. M., Ardekani, A. M., and Verma, M. S. (2020). Raman spectra-based deep learning: a tool to identify microbial contamination. Microbiology 9:e1122. doi: 10.1002/mbo3.1122
McGavin, M. J., and Heinrichs, D. E. (2012). The staphylococci and staphylococcal pathogenesis. Front. Cell. Infect. Microbiol. 2:66. doi: 10.3389/fcimb.2012.00066
Mert, S., Özbek, E., Otunctemur, A., and Culha, M. (2015). Kidney tumor staging using surface-enhanced Raman scattering. J. Biomed. Opt. 20:047002. doi: 10.1117/1.JBO.20.4.047002
Moawad, A. A., Silge, A., Bocklitz, T., Fischer, K., Rösch, P., Roesler, U., et al. (2019). A machine learning-based raman spectroscopic assay for the identification of Burkholderia mallei and related species. Molecules 24:4516. doi: 10.3390/molecules24244516
Nguyen, E. P., Chrimes, A. F., Brkljaca, R., Ou, J. Z., Berean, K., Zhuiykov, S., et al. (2013). “Assessment of a Raman micro-spectroscopy/microfluidics unit using a model E. coli/glucose bio-system.” in The 7th IEEE International Conference on Nano/Molecular Medicine and Engineering; November 10–13, 2013; 157–162.
Oyelade, J., Isewon, I., Oladipupo, F., Aromolaran, O., Uwoghiren, E., Ameh, F., et al. (2016). Clustering algorithms: their application to gene expression data. Bioinform. Biol. Insights 10, 237–253. doi: 10.4137/BBI.S38316
Pahlow, S., Weber, K., Popp, J., Wood, B. R., Kochan, K., Rüther, A., et al. (2018). Application of vibrational spectroscopy and imaging to point-of-care medicine: a review. Appl. Spectrosc. 72, 52–84. doi: 10.1177/0003702818791939
Palomino, J. C. (2005). Nonconventional and new methods in the diagnosis of tuberculosis: feasibility and applicability in the field. Eur. Respir. J. 26, 339–350. doi: 10.1183/09031936.05.00050305
Pedregosa, F., Varoquaux, G., Gramfort, A., Michel, V., Thirion, B., Grisel, O., et al. (2011). Scikit-learn: machine learning in python. J. Mach. Learn. Res. 12, 2825–2830.
Perez-Guaita, D., Kochan, K., Martin, M., Andrew, D. W., Heraud, P., Richards, J. S., et al. (2016). Multimodal vibrational imaging of cells. Vib. Spectrosc. 91, 46–58. doi: 10.1016/j.vibspec.2016.07.017
Pérez-Jiménez, A. I., Lyu, D., Lu, Z., Liu, G., and Ren, B. (2020). Surface-enhanced Raman spectroscopy: benefits, trade-offs and future developments. Chem. Sci. 11, 4563–4577. doi: 10.1039/D0SC00809E
Radzol, A. R. M., Lee, K. Y., Mansor, W., and Azman, A. (2014). “Optimization of Savitzky-Golay smoothing filter for salivary surface enhanced Raman spectra of non structural protein 1.” in TENCON 2014 – 2014 IEEE Region 10 Conference; October 22–25, 2014; 1–6.
Rand, W. M. (1971). Objective criteria for the evaluation of clustering methods. J. Am. Stat. Assoc. 66, 846–850. doi: 10.1080/01621459.1971.10482356
Rebrošová, K., Šiler, M., Samek, O., Růžička, F., Bernatová, S., Holá, V., et al. (2017). Rapid identification of staphylococci by Raman spectroscopy. Sci. Rep. 7:14846. doi: 10.1038/s41598-017-13940-w
Ren, Y., Ji, Y., Teng, L., and Zhang, H. (2017). Using Raman spectroscopy and chemometrics to identify the growth phase of Lactobacillus casei Zhang during batch culture at the single-cell level. Microb. Cell Fact. 16:233. doi: 10.1186/s12934-017-0849-8
Sakamoto, S., Putalun, W., Vimolmangkang, S., Phoolcharoen, W., Shoyama, Y., Tanaka, H., et al. (2017). Enzyme-linked immunosorbent assay for the quantitative/qualitative analysis of plant secondary metabolites. J. Nat. Med. 72, 32–42. doi: 10.1007/s11418-017-1144-z
Samek, O., Telle, H. H., Harris, L. G., Bloomfield, M., and Mack, D. (2008). Raman spectroscopy for rapid discrimination of Staphylococcus epidermidis clones related to medical device-associated infections. Laser Phys. Lett. 5, 465–470. doi: 10.1002/lapl.200810011
Schlievert, P. M., Chessa, D., Ganau, G., Spiga, L., Bulla, A., Mazzarello, V., et al. (2016). Staphylococcus aureus and Staphylococcus epidermidis virulence strains as causative agents of persistent infections in breast implants. PLoS One 11:e0146668. doi: 10.1371/journal.pone.0146668
Sikirzhytski, V., Virkler, K., and Lednev, I. K. (2010). Discriminant analysis of Raman spectra for body fluid identification for forensic purposes. Sensors 10, 2869–2884. doi: 10.3390/s100402869
Stöckel, S., Stanca, A. S., Helbig, J., Rösch, P., and Popp, J. (2015). Raman spectroscopic monitoring of the growth of pigmented and non-pigmented mycobacteria. Anal. Bioanal. Chem. 407, 8919–8923. doi: 10.1007/s00216-015-9031-5
Tagliaferro, A., Rovere, M., Padovano, E., Bartoli, M., and Giorcelli, M. (2020). Introducing the novel mixed Gaussian-Lorentzian lineshape in the analysis of the Raman signal of biochar. Nano 10:1748. doi: 10.3390/nano10091748
Uysal Ciloglu, F., Saridag, A. M., Kilic, I. H., Tokmakci, M., Kahraman, M., and Aydin, O. (2020). Identification of methicillin-resistant Staphylococcus aureus bacteria using surface-enhanced Raman spectroscopy and machine learning techniques. Analyst 145, 7559–7570. doi: 10.1039/D0AN00476F
Wang, K., Chen, L., Ma, X., Ma, L., Chou, K. C., Cao, Y., et al. (2020). Arcobacter identification and species determination using Raman spectroscopy combined with neural networks. Appl. Environ. Microbiol. 86:e00924-20. doi: 10.1128/AEM.00924-20
Wang, L., Liu, W., Tang, J.-W., Wang, J.-J., Liu, Q.-H., Wen, P.-B., et al. (2021). Applications of Raman spectroscopy in bacterial infections: principles, advantages, and shortcomings. Front. Microbiol. 12:683580. doi: 10.3389/fmicb.2021.683580
Wei, C., Li, M., and Zhao, X. (2018). Surface-enhanced Raman scattering (SERS) with silver nano substrates synthesized by microwave for rapid detection of foodborne pathogens. Front. Microbiol. 9:2857. doi: 10.3389/fmicb.2018.02857
Weiss, R., Palatinszky, M., Wagner, M., Niessner, R., Elsner, M., Seidel, M., et al. (2019). Surface-enhanced Raman spectroscopy of microorganisms: limitations and applicability on the single-cell level. Analyst 144, 943–953. doi: 10.1039/C8AN02177E
Xu, C., and Jackson, S. A. (2019). Machine learning and complex biological data. Genome Biol. 20:76. doi: 10.1186/s13059-019-1689-0
Keywords: Raman spectroscopy, surface enhanced Raman spectroscopy, convolutional neural network, long short-term memory neural network, machine learning
Citation: Tang J-W, Liu Q-H, Yin X-C, Pan Y-C, Wen P-B, Liu X, Kang X-X, Gu B, Zhu Z-B and Wang L (2021) Comparative Analysis of Machine Learning Algorithms on Surface Enhanced Raman Spectra of Clinical Staphylococcus Species. Front. Microbiol. 12:696921. doi: 10.3389/fmicb.2021.696921
Edited by:
Jinhua Li, Institute of Geology and Geophysics, Chinese Academy of Sciences (CAS), ChinaReviewed by:
Xiaolong Liang, Washington University in St. Louis, United StatesCopyright © 2021 Tang, Liu, Yin, Pan, Wen, Liu, Kang, Gu, Zhu and Wang. This is an open-access article distributed under the terms of the Creative Commons Attribution License (CC BY). The use, distribution or reproduction in other forums is permitted, provided the original author(s) and the copyright owner(s) are credited and that the original publication in this journal is cited, in accordance with accepted academic practice. No use, distribution or reproduction is permitted which does not comply with these terms.
*Correspondence: Liang Wang, aGVhbHRoc2NpZW5jZUBmb3htYWlsLmNvbQ==; Zuo-Bin Zhu, emh1enVvYmluQHh6aG11LmVkdS5jbg==; Bing Gu, Z2IyMDAzMTEyOUAxNjMuY29t
†These authors have contributed equally to this work
Disclaimer: All claims expressed in this article are solely those of the authors and do not necessarily represent those of their affiliated organizations, or those of the publisher, the editors and the reviewers. Any product that may be evaluated in this article or claim that may be made by its manufacturer is not guaranteed or endorsed by the publisher.
Research integrity at Frontiers
Learn more about the work of our research integrity team to safeguard the quality of each article we publish.