 Nicole J. Bale1*
 Su Ding1
 Ellen C. Hopmans1
 Milou G. I. Arts1
 Laura Villanueva1,2
 Christine Boschman1Andreas F. Haas1Stefan Schouten1,2
 Jaap S. Sinninghe Damsté1,2
- 1Department of Marine Microbiology and Biogeochemistry, Royal Netherlands Institute for Sea Research, Texel, Netherlands
- 2Department of Earth Sciences, Faculty of Geosciences, Utrecht University, Utrecht, Netherlands
Lipids, as one of the main building blocks of cells, can provide valuable information on microorganisms in the environment. Traditionally, gas or liquid chromatography coupled to mass spectrometry (MS) has been used to analyze environmental lipids. The resulting spectra were then processed through individual peak identification and comparison with previously published mass spectra. Here, we present an untargeted analysis of MS1 spectral data generated by ultra-high-pressure liquid chromatography coupled with high-resolution mass spectrometry of environmental microbial communities. Rather than attempting to relate each mass spectrum to a specific compound, we have treated each mass spectrum as a component, which can be clustered together with other components based on similarity in their abundance depth profiles through the water column. We present this untargeted data visualization method on lipids of suspended particles from the water column of the Black Sea, which included >14,000 components. These components form clusters that correspond with distinct microbial communities driven by the highly stratified water column. The clusters include both known and unknown compounds, predominantly lipids, demonstrating the value of this rapid approach to visualize component distributions and identify novel lipid biomarkers.
Introduction
Lipids are the main building blocks of microorganisms and occur ubiquitously in the environment. A large number of lipids are synthesized by many different genera and orders of microbes but some lipids are unique to specific organisms or groups of organisms or to specific biogeochemical processes (e.g., Koga et al., 1998; Cvejic et al., 2000; Sinninghe Damsté et al., 2002b; Belt et al., 2007; Rossel et al., 2008; Bauersachs et al., 2009; Elling et al., 2017; Rush and Sinninghe Damsté, 2017; Longo et al., 2018; Gutiérrez et al., 2020), and hence serve as biomarker lipids. Furthermore, intact polar lipids (IPLs) are thought to degrade rapidly upon cell death indicating recent activity of microbial cells (White et al., 1979; Harvey et al., 1986). Therefore, analysis of IPLs and other lipids can, complementary to microbiological and molecular methods, provide valuable information on the diversity and activity of microorganisms in the environment. Early biomarker lipid studies of the microbial composition in the environment utilized gas chromatography (GC) often coupled to mass spectrometry (MS) to detect lipid biomarker such as steroids (Gaskell and Eglinton, 1976; Summons et al., 1992), and in particular phospholipid derived fatty acids (PLFAs) (White et al., 1979). In recent decades, the range of biomarker lipids utilized in environmental studies has been extended to include direct analysis of larger IPLs using liquid chromatography (LC) coupled to MS (e.g., Sturt et al., 2004).
Traditionally, the range of IPLs detected in the environment using LC-MS are constrained through individual peak identification and comparison with previously published mass spectra or standards (Sturt et al., 2004; Ertefai et al., 2008; Lipp and Hinrichs, 2009; Schubotz et al., 2009, 2018; Van Mooy and Fredricks, 2010; Popendorf et al., 2011; Brandsma et al., 2012; Gibson et al., 2013; Bale et al., 2016; Ding et al., 2020). This generally results in the detection only of dominant (groups of) known IPLs. With the advent of ultra-high-pressure liquid chromatography coupled with multistage high-resolution mass spectrometry (UHPLC-HRMSn) the richness of the mass spectral data has significantly increased, leading to the identification of many new lipid compounds (e.g., Liu et al., 2012a,b; Moore et al., 2013, 2016; Zhu et al., 2014a,b; Yoshinaga et al., 2015; Sollai et al., 2018; Bale et al., 2019b), but this identification is selective and tedious and could be sped up by using computational approaches. Furthermore, compounds with unknown mass spectra may be ignored even though they could be indicative of the abundance of specific microbes.
Recently, a number of studies have applied lipidomic data handling strategies in marine environments (Hunter et al., 2015; Collins et al., 2016; Cutignano et al., 2016; Becker et al., 2018a; Li et al., 2018; Saleem et al., 2019; Zeng et al., 2019). These studies describe various methods for lipidomic workflows such as high-throughput annotation and identification of lipids in HRMS data and statistical analysis of the outputted lipid data. Some of which have taken an untargeted approach, rather than attempting to relate each mass spectrum to a certain compound, they extract all spectral components (sometimes denoted as “features”) (Pluskal et al., 2010, 2020). The composition of spectral components can then be used to, e.g., define specific environmental niches.
Here, we perform an untargeted analysis of the lipidome of the Black Sea. We extract components based on high resolution MS1 spectra from UHPLC-HRMS analysis of lipid extracts of suspended particles and use a statistical approach to compare the individual abundance depth profiles of all components. These depth profiles are clustered by their similarity to one another, without bias toward known or abundant components. We compare these findings with previous studies, which have examined the lipidome of the Black Sea water column using traditional IPL identification (e.g., Neretin et al., 2007; Wakeham et al., 2007; Schubotz et al., 2009; Sollai et al., 2018). Our rapid visualization method lays a foundation for the study of Ding et al. (2021), reported in parallel to this study, which used information theory framework combined with molecular networking to investigate lipid diversity and specificity as well as identify novel lipids.
Materials and Methods
Sampling and Environmental Setting
Suspended particulate matter (SPM) at various water depth in the water column (Table 1) was collected during two cruises in 2013 and 2017 in the Black Sea. The 2013 Black Sea SPM was collected from 50 to 2000 meter below sea level (mbsl; see Table 1 for depths) during the PHOXY cruise (June 2013) aboard of the R/V Pelagia (Kraal et al., 2017; Sollai et al., 2018). The sampling station (PHOX2) was located at 42°53.8′N, 30°40.7′E in the western gyre of the Black Sea. The 2017 Black Sea SPM (50–2000 m, Table 1) was collected during the 64PE418 cruise (March 2017) also aboard of the R/V Pelagia. For the latter, the sampling station (Station “4”) was located at 42°46.9′N, 29°21.1′E. Because the two SPM profiles (2013 and 2017) were collected from different stations (∼60 nautical miles apart, although both in the center of the western gyre of the Black Sea), they represent two distinct sample sets, both temporally and spatially.
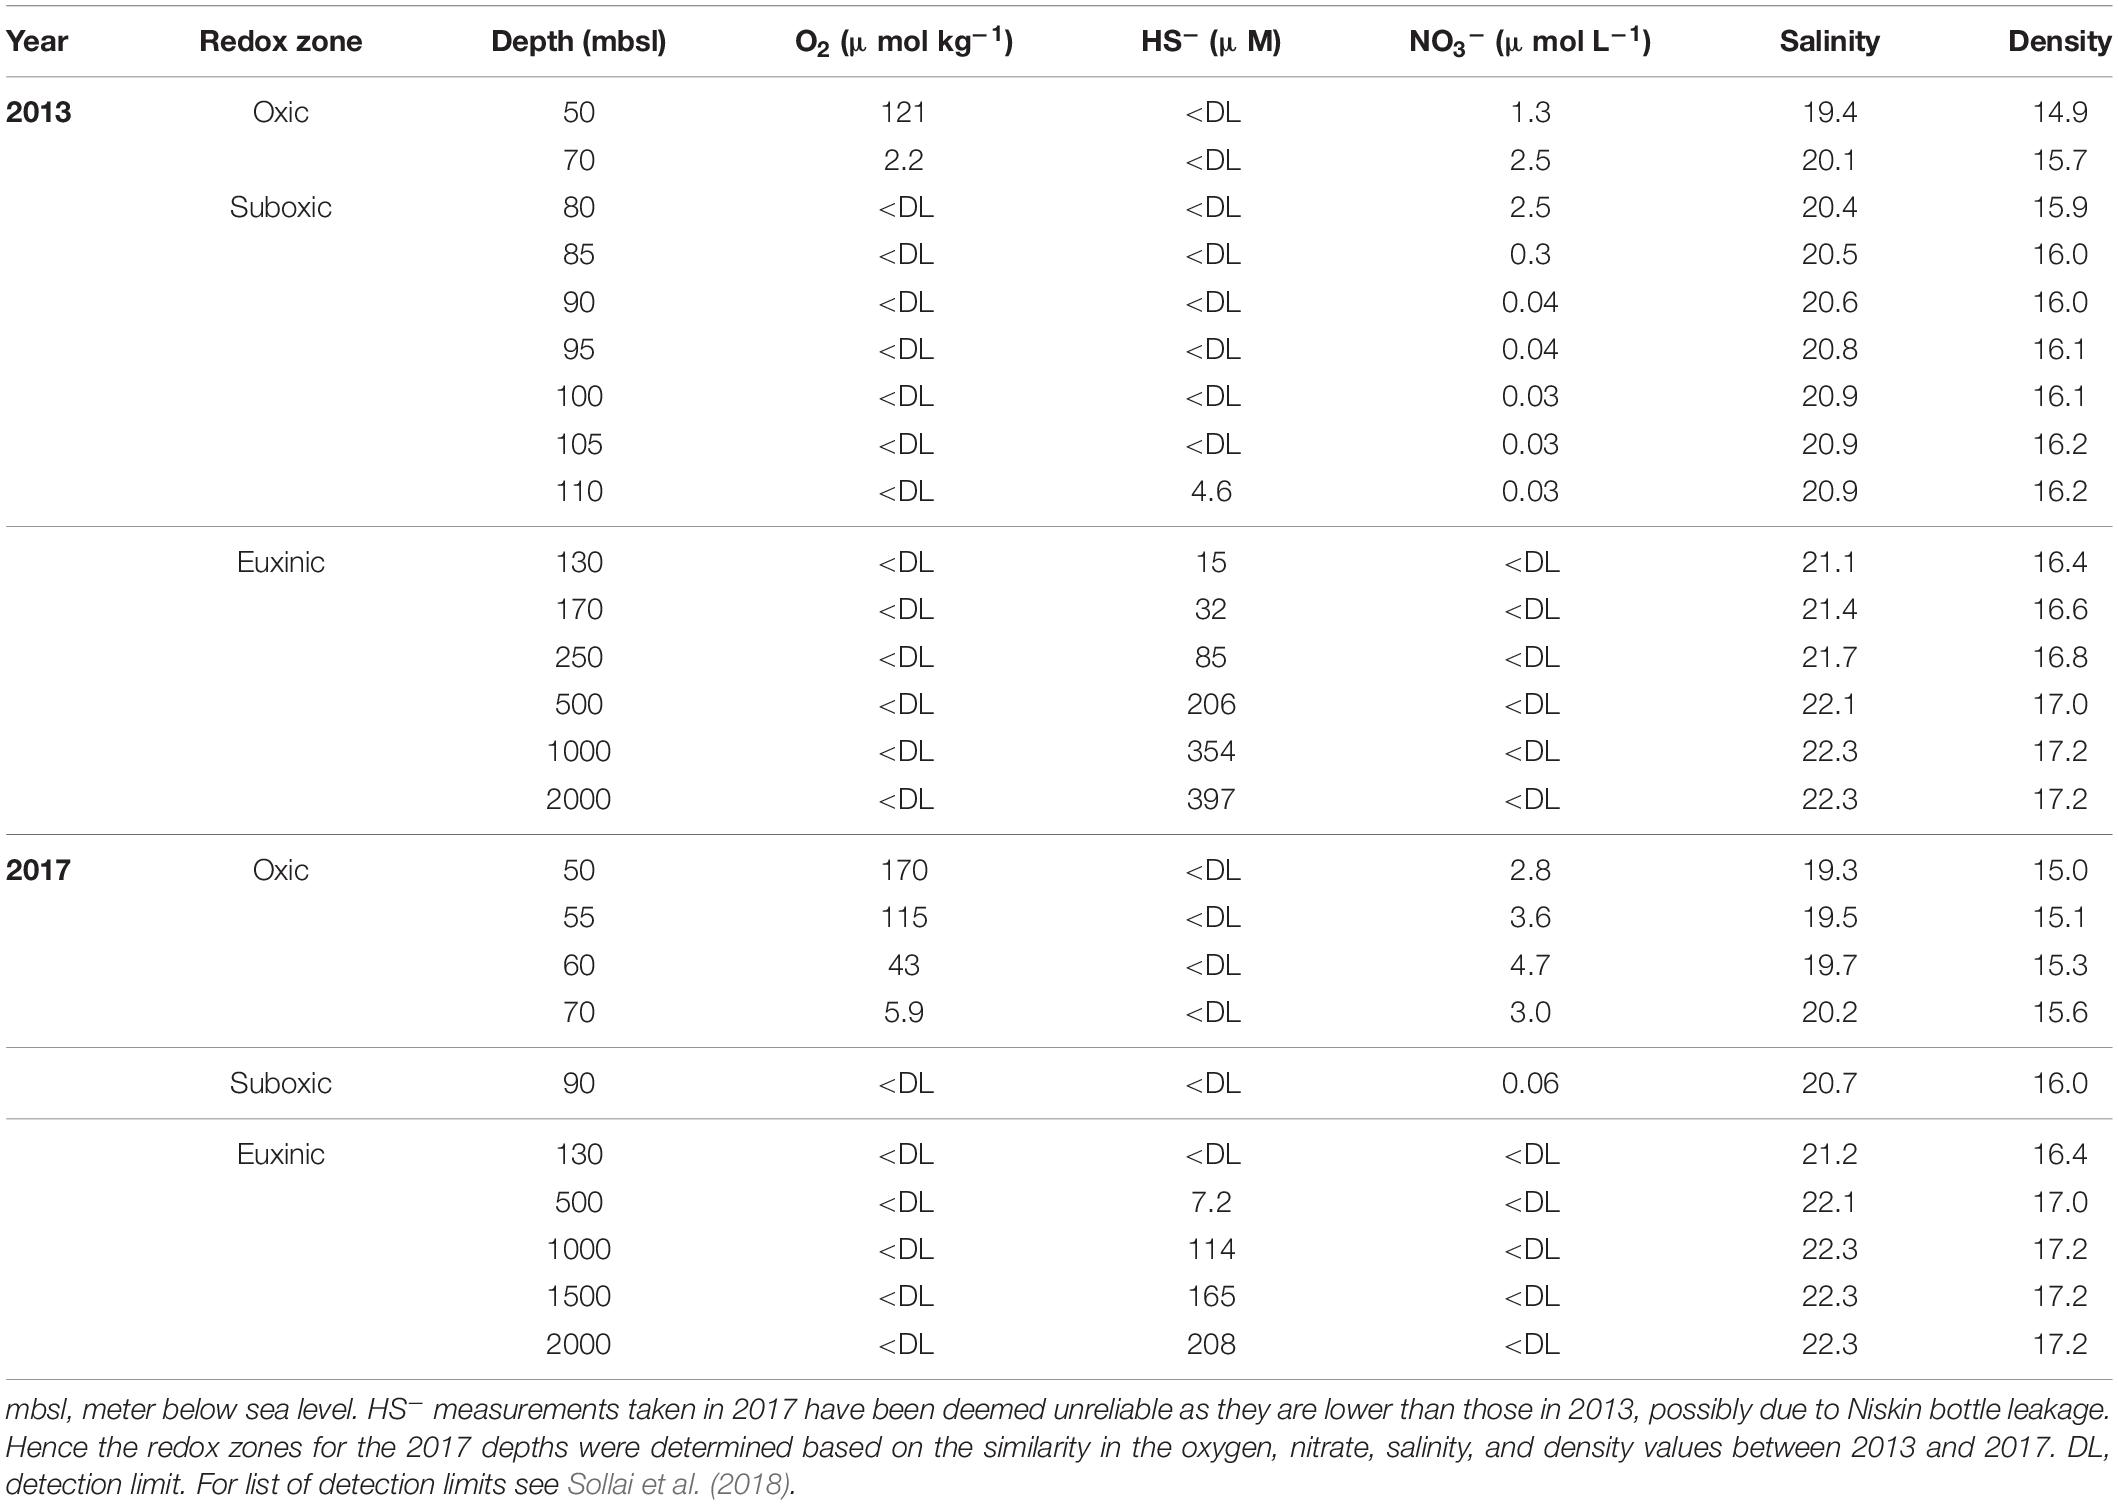
Table 1. Depth of SPM sampling and hydrological properties in the water column in the center of the western gyre of the Black Sea at sampling station PHOX2 in March 2013 and station 64PE418-4 in June 2017.
Suspended particulate matter was collected on pre-ashed filters mounted on McLane WTS-LV in situ pumps (McLane Laboratories Inc., Falmouth, United Kingdom). In 2013 142-mm-diameter 0.7-μm pore size glass fiber GF/F filters (Pall Corporation) were used and in 2017 they were 0.3 μm GF75 filters (Advantec). Upon the recovery of the in situ pumps on the deck of the ship, the filters were immediately stored at −80°C until extraction. Physical parameters of the water column were recorded with a Sea-Bird SBE911C conductivity–temperature–depth (CTD) system equipped with a 24 × 12 L Niskin bottle rosette sampler. For the methods used for the measurement of dissolved oxygen (O2) and inorganic nutrients see Sollai et al. (2018).
SPM Extraction and LC-MS Analysis
Lyophilized filters were extracted using a modified Bligh-Dyer procedure (similar to that described in Sturt et al., 2004) in batches of three alongside an extraction blank, consisting of pre-ashed glass fiber filter. Briefly, the cut-up filters were twice extracted ultrasonically for 10 min in a mixture of methanol, dichloromethane, and phosphate buffer (2:1:0.8, v:v) and the combined supernatants were phase-separated by adding additional dichloromethane and buffer to a final solvent ratio of 1:1:0.9 (v:v). The organic phase containing the IPLs was collected and the aqueous phase re-extracted three times with dichloromethane. All steps of the extraction were then repeated on the residue but with a mixture of methanol, dichloromethane, and aqueous trichloroacetic acid solution (TCA) pH 3 (2:1:0.8, v:v). Finally, the organic extracts were combined and dried under a stream of N2 gas. Before analysis the extract was redissolved in a mixture of MeOH:DCM (9:1, v:v) which contained two internal standards (IS), a platelet activating factor (PAF) standard (1-O-hexadecyl-2-acetyl-snglycero-3-phosphocholine) and a deuterated betaine lipid {1,2-dipalmitoyl-sn-glycero-3-O-4′-[N,N,N-trimethyl(d9)]-homoserine; Avanti Lipids}. Aliquots were filtered through 0.45 μm regenerated cellulose syringe filters (4 mm diameter; Grace Alltech). Extraction blanks were performed alongside the SPM extractions, using the same glassware, solvents and extraction methodology, but with no glass fiber or SPM material.
Analysis of SPM extracts was carried out using UHPLC-HRMS according to the reversed phase method of Wörmer et al. (2013) with the following modifications. We used an Agilent 1290 Infinity I UHPLC, equipped with thermostatted auto-injector and column oven, coupled to a Q Exactive Orbitrap MS with Ion Max source with heated electrospray ionization (HESI) probe (Thermo Fisher Scientific). Separation was achieved on an Acquity BEH C18 column (Waters, 2.1 × 150 mm, 1.7 μm) maintained at 30°C. The eluent composition was (A) MeOH/H2O/formic acid/14.8 M NH3aq [85:15:0.12:0.04 (v:v)] and (B) IPA/MeOH/formic acid/14.8 M NH3aq [50:50:0.12:0.04 (v:v)]. The elution program was: 95% A for 3 min, followed by a linear gradient to 40% A at 12 min and then to 0% A at 50 min, this was maintained until 80 min. The flow rate was 0.2 mL min–1. Positive ion HESI settings were: capillary temperature, 300°C; sheath gas (N2) pressure, 40 arbitrary units (AU); auxiliary gas (N2) pressure, 10 AU; spray voltage, 4.5 kV; probe heater temperature, 50°C; S-lens 70 V. Lipids were analyzed with a mass range of m/z 350–2000 (resolving power 70,000 ppm at m/z 200), followed by data-dependent tandem MS/MS (resolving power 17,500 ppm), in which the 10 most abundant masses in the mass spectrum were fragmented successively (stepped normalized collision energy 15, 22.5, 30; isolation width, 1.0 m/z). The Q Exactive was calibrated within a mass accuracy range of 1 ppm using the Thermo Scientific Pierce LTQ Velos ESI Positive Ion Calibration Solution. During analysis dynamic exclusion was used to temporarily exclude masses (for 6 s) in order to allow selection of less abundant ions for MS/MS.
It should be noted that IPL species have diverse degrees of ionization efficiencies (Van Mooy and Fredricks, 2010) and hence the peak areas, in response units, of different components do not necessarily reflect their actual relative abundance. However, this method allows for comparison between samples when analyzed together.
Data Processing
Each SPM extract was analyzed in duplicate by UHPLC-HRMS, in sequence with extraction blanks (Bligh-Dyer extraction without SPM material) and analytical blanks (solvent injections on system between extract analyses). Extractions blanks were included in the subsequent data processing scheme, while analytical blanks were used for routine quality control checks but were not included in further data processing. For the Black Sea 2013 series, there were 30 analyses of SPM extracts (15 samples in duplicate) and 8 analyses of extraction blanks (4 extraction blanks in duplicate), totaling 38 analyses. In order to provide relevant information about background compounds and contamination, all extraction blanks were carried out using approximately the same solvent volumes as for the samples and extracts and were injected in the same injection volume. For the Black Sea 2017 series, there were 22 analyses of SPM extracts (11 samples in duplicate) and 8 analyses of extraction blanks (4 blanks in duplicate), totaling 30 analyses. For each UHPLC-HRMS analysis, the raw data files was converted to an.mz XML file using MSconvert of the ProteoWizard package (Chambers et al., 2012). The mzXML files were then processed using MZmine software (Version 2.34) (Pluskal et al., 2010). A signal threshold of 1 × 10⁵ was applied for MS1 mass detection within the mzXML files. The detected masses were used to build extracted ion chromatograms (EIC) with a minimum peak height of 1 × 10⁶ (AU) and a 3 ppm relative mass tolerance. Chromatographic deconvolution (separation of detected masses into individual peaks) was carried out with the “baseline cutoff” algorithm where the minimum peak height was 1 × 10⁵ AU and the maximum peak width was 5 min. Following the deconvolution, isotope peak grouping was carried out with a 3 ppm relative mass tolerance and a 0.2 min retention time tolerance followed by alignment of EICs with a 20 ppm mass tolerance and a 0.5 min retention time tolerance. Only aligned EICs containing a minimum of two isotope peaks and occurring in at least two samples were included. The next stage of processing removed duplicate peaks (within a window of 5 ppm mass and 0.4 min retention time). For each individual component, an MS1 peak area was recorded for each sample, which was then corrected for the amount of sea water filtered (in L).
A preliminary statistical analysis of datasets was then carried out using Ward method average-neighbor hierarchical clustering (Ward, 1963) using JMP® software (Version 14.2.0., SAS Institute Inc.). For the 2013 dataset, for example, the 38 analyses were clustered according to the similarity in their component distributions (Figure 1). All duplicate analyses clustered together, demonstrating the reproducibility of the UHPLC-HRMS analytical method and the MZmine component extraction. The SPM extracts also clustered in a relatively good accordance to the different redox zones where they were collected (Table 1) as indicated with red annotation in Figure 1. The duplicate SPM extracts from 2000 mbsl depth clustered most closely with the extraction blanks, indicative of the much lower concentration of organic matter at this depth.
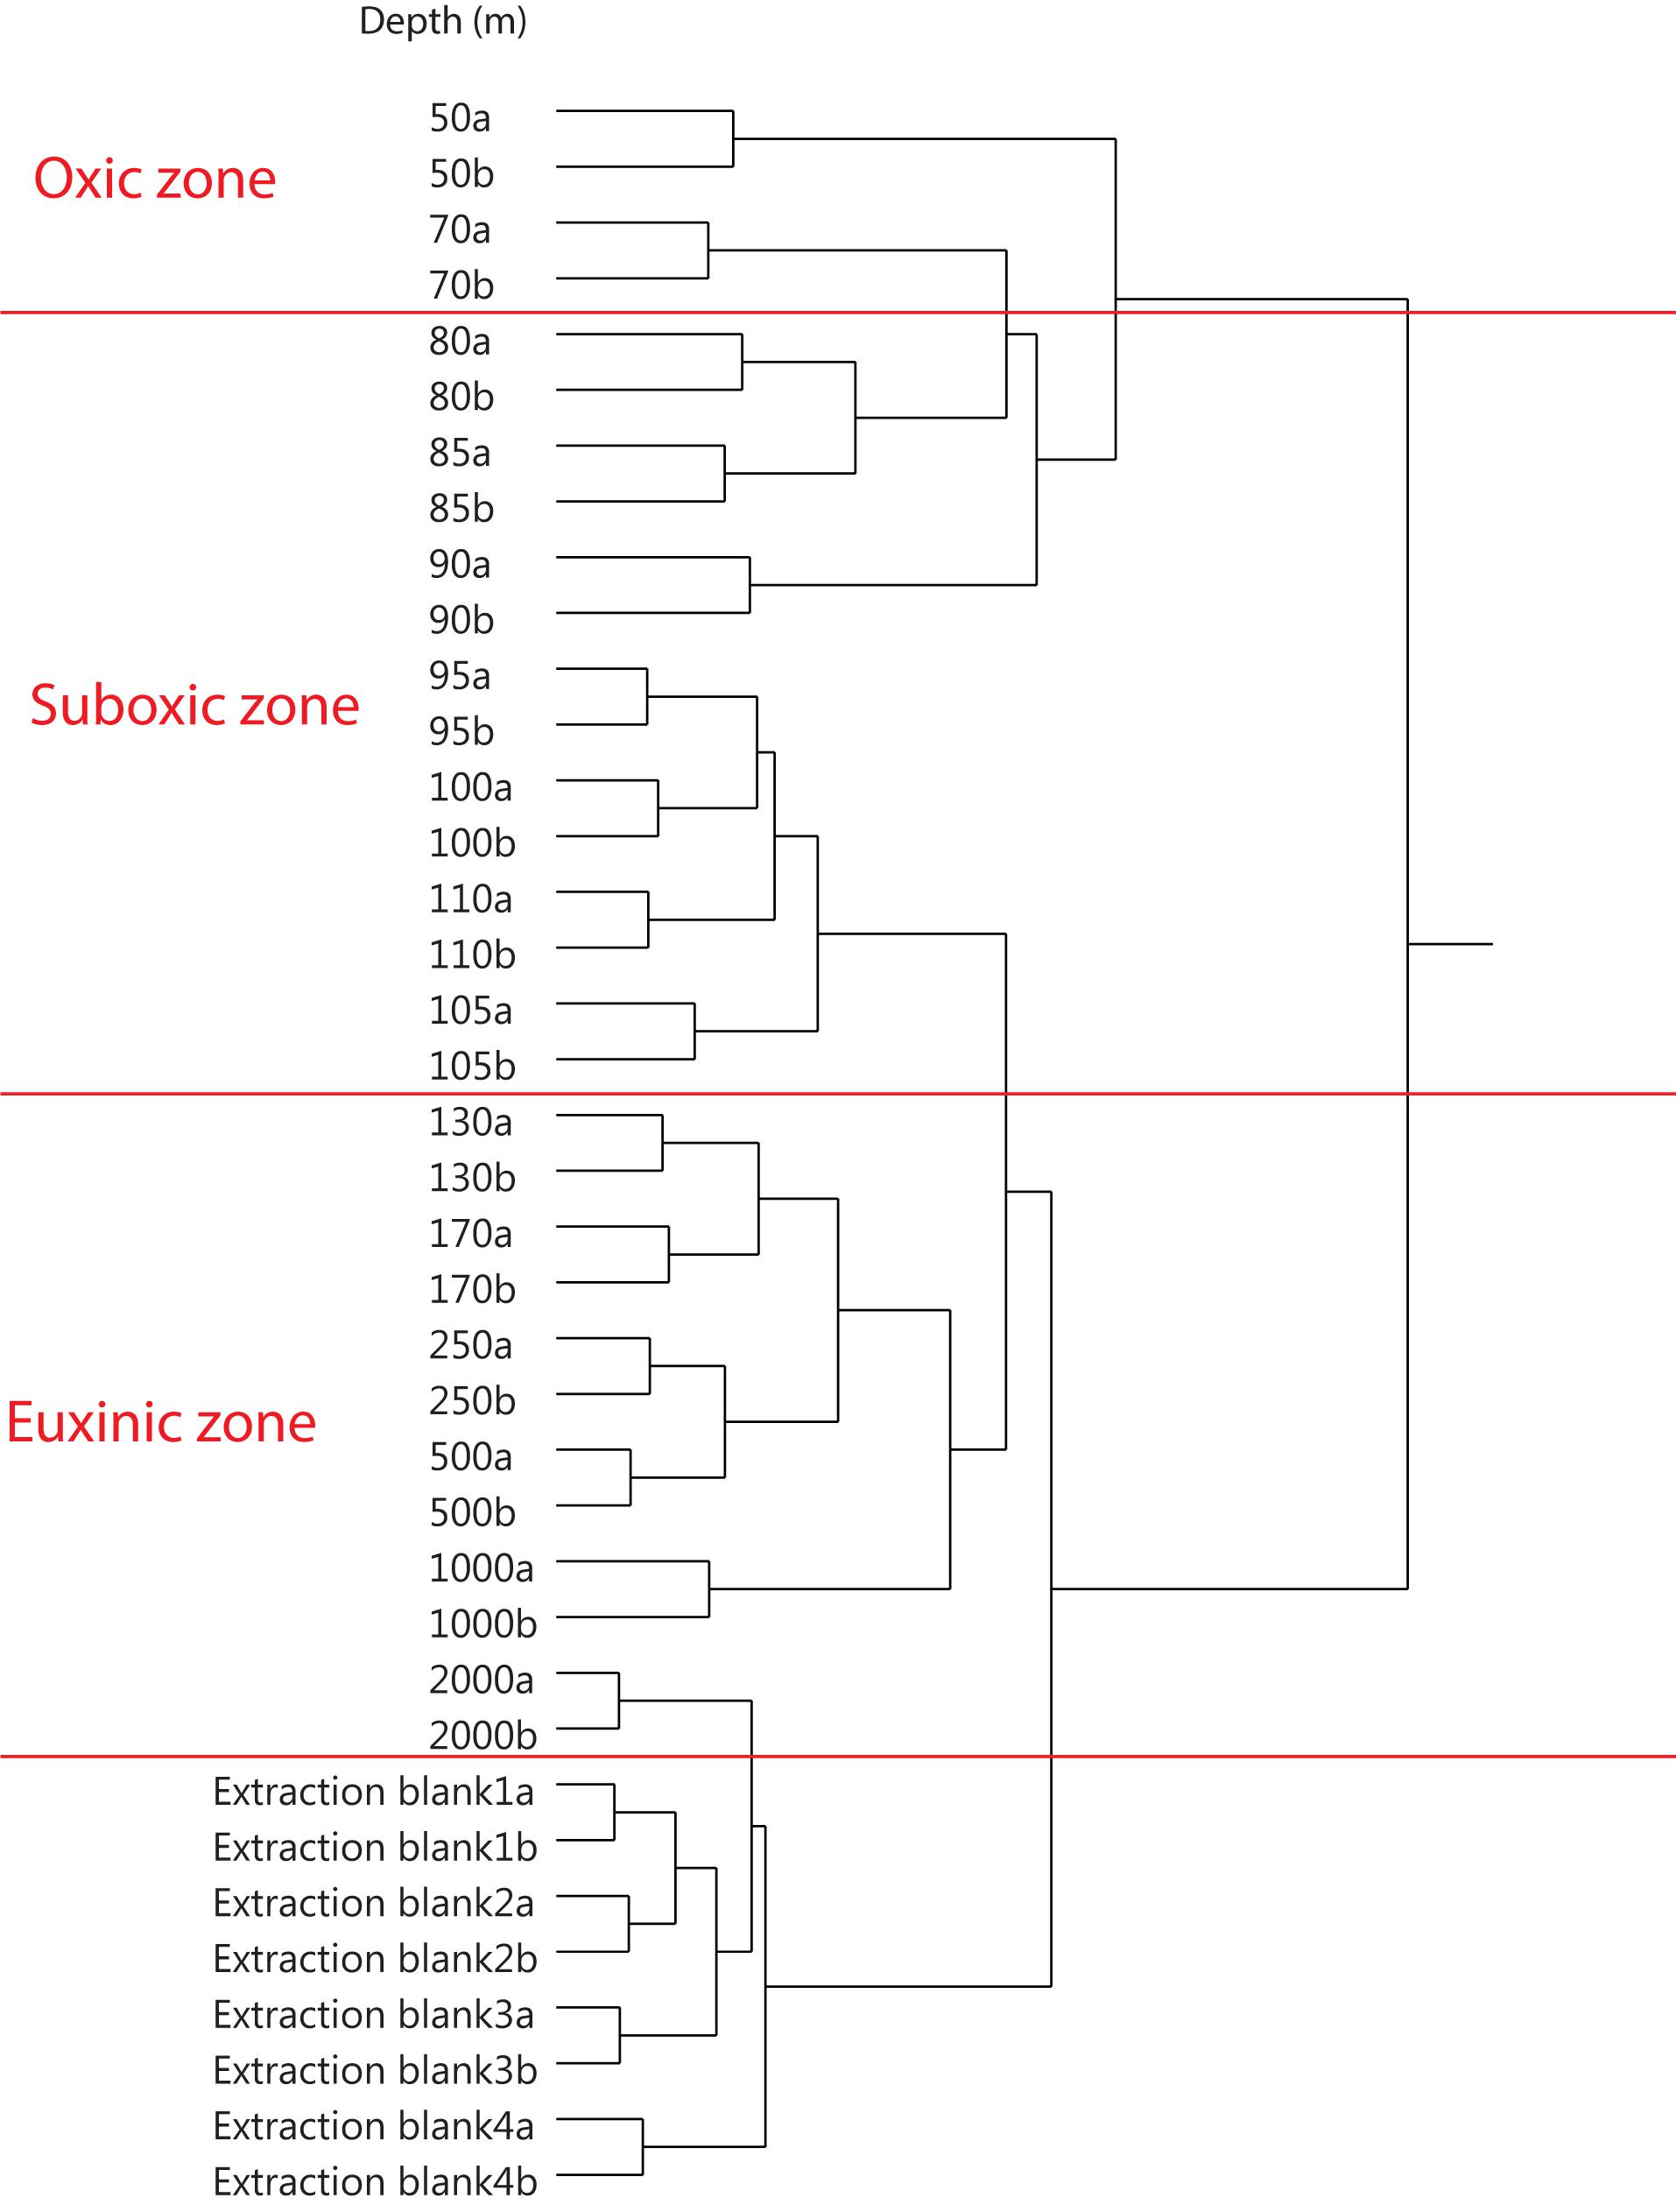
Figure 1. A preliminary analysis, using average-neighbor hierarchical clustering (Ward method) of the 38 UHPLC-HRMS analyses (Black Sea water column SPM from 2013) and associated extraction blanks. Clustered by similarity in distribution of lipidome components (n = 14,648), as extracted by MZmine software. Red annotations show the water column redox zones, as given in Table 1.
For both datasets a blank subtraction method was subsequently carried out. For each component an average of the extraction blank peak areas was calculated (2013, n = 8; 2017, n = 8). This was then deducted from the average of the SPM extract peak areas (2013, n = 30; 2017, n = 20). While this led to the complete removal of many contaminants, some remained in the final dataset. When examining the most abundant components in the various clusters, eight known contaminants remained, mostly in the 2000 mbsl SPM extracts (Supplementary Table 1). It is possible these contaminants were introduced during sampling rather than extraction as they occurred in both duplicate samples. These eight contaminants were excluded from further analysis. In the 2013 dataset blank subtraction led to the complete removal of 996 components and in the 2017 dataset it was 562.
For the components remaining after blank extraction, an average value was calculated for each pair of duplicate SPM analyses. The resulting two datasets were then analyzed by two-way average-neighbor hierarchical clustering (using JMP®), again following the Ward method, according first to component distribution in samples and then two way clustered to component abundance across samples. This clustering was visualized in a two-dimensional dendrogram with peak area abundance shown with a color scale.
Results and Discussion
Untargeted Analysis of Black Sea SPM Collected in 2013
The Black Sea is the world’s largest permanently stratified anoxic basin. The SPM collected covered the full range of redox zones throughout the water column (Table 1): the oxic zone, the suboxic zone, which is defined as the zone where both oxygen and sulfide are below detection levels, and the euxinic zone where the water is both anoxic and sulfidic (Murray et al., 1999).
Lipid extracts of SPM (n = 15) produced a final dataset of 14,648 components. This entire final dataset then underwent two-way average-neighbor hierarchical clustering, dendrogram construction and a heat map plotting using JMP® software (Figure 2). The clustering of the SPM extracts (vertical axis, denoted by the depth at which the SPM was collected) is based on the distribution of all MS1 spectral components within the SPM extracts. The clustering of the components (horizontal axis) is based on the similarity of the abundance depth profiles for each component. Each individual depth profile in Figure 2 has a color scale (heat map, red, highest abundance of component in depth profile; blue, lowest abundance of component in depth profile). This visualization of both the similarity between SPM extracts and the similarity between the component depth profiles is a useful resource for a rapid examination of the dataset. Firstly, it reveals component clusters that are associated with specific niches, environmental variables, or organisms of interest. Secondly, it is clusters that contain a known component can be used to find other components with a similar distribution through the water column. Hereafter we give some examples of such examinations.
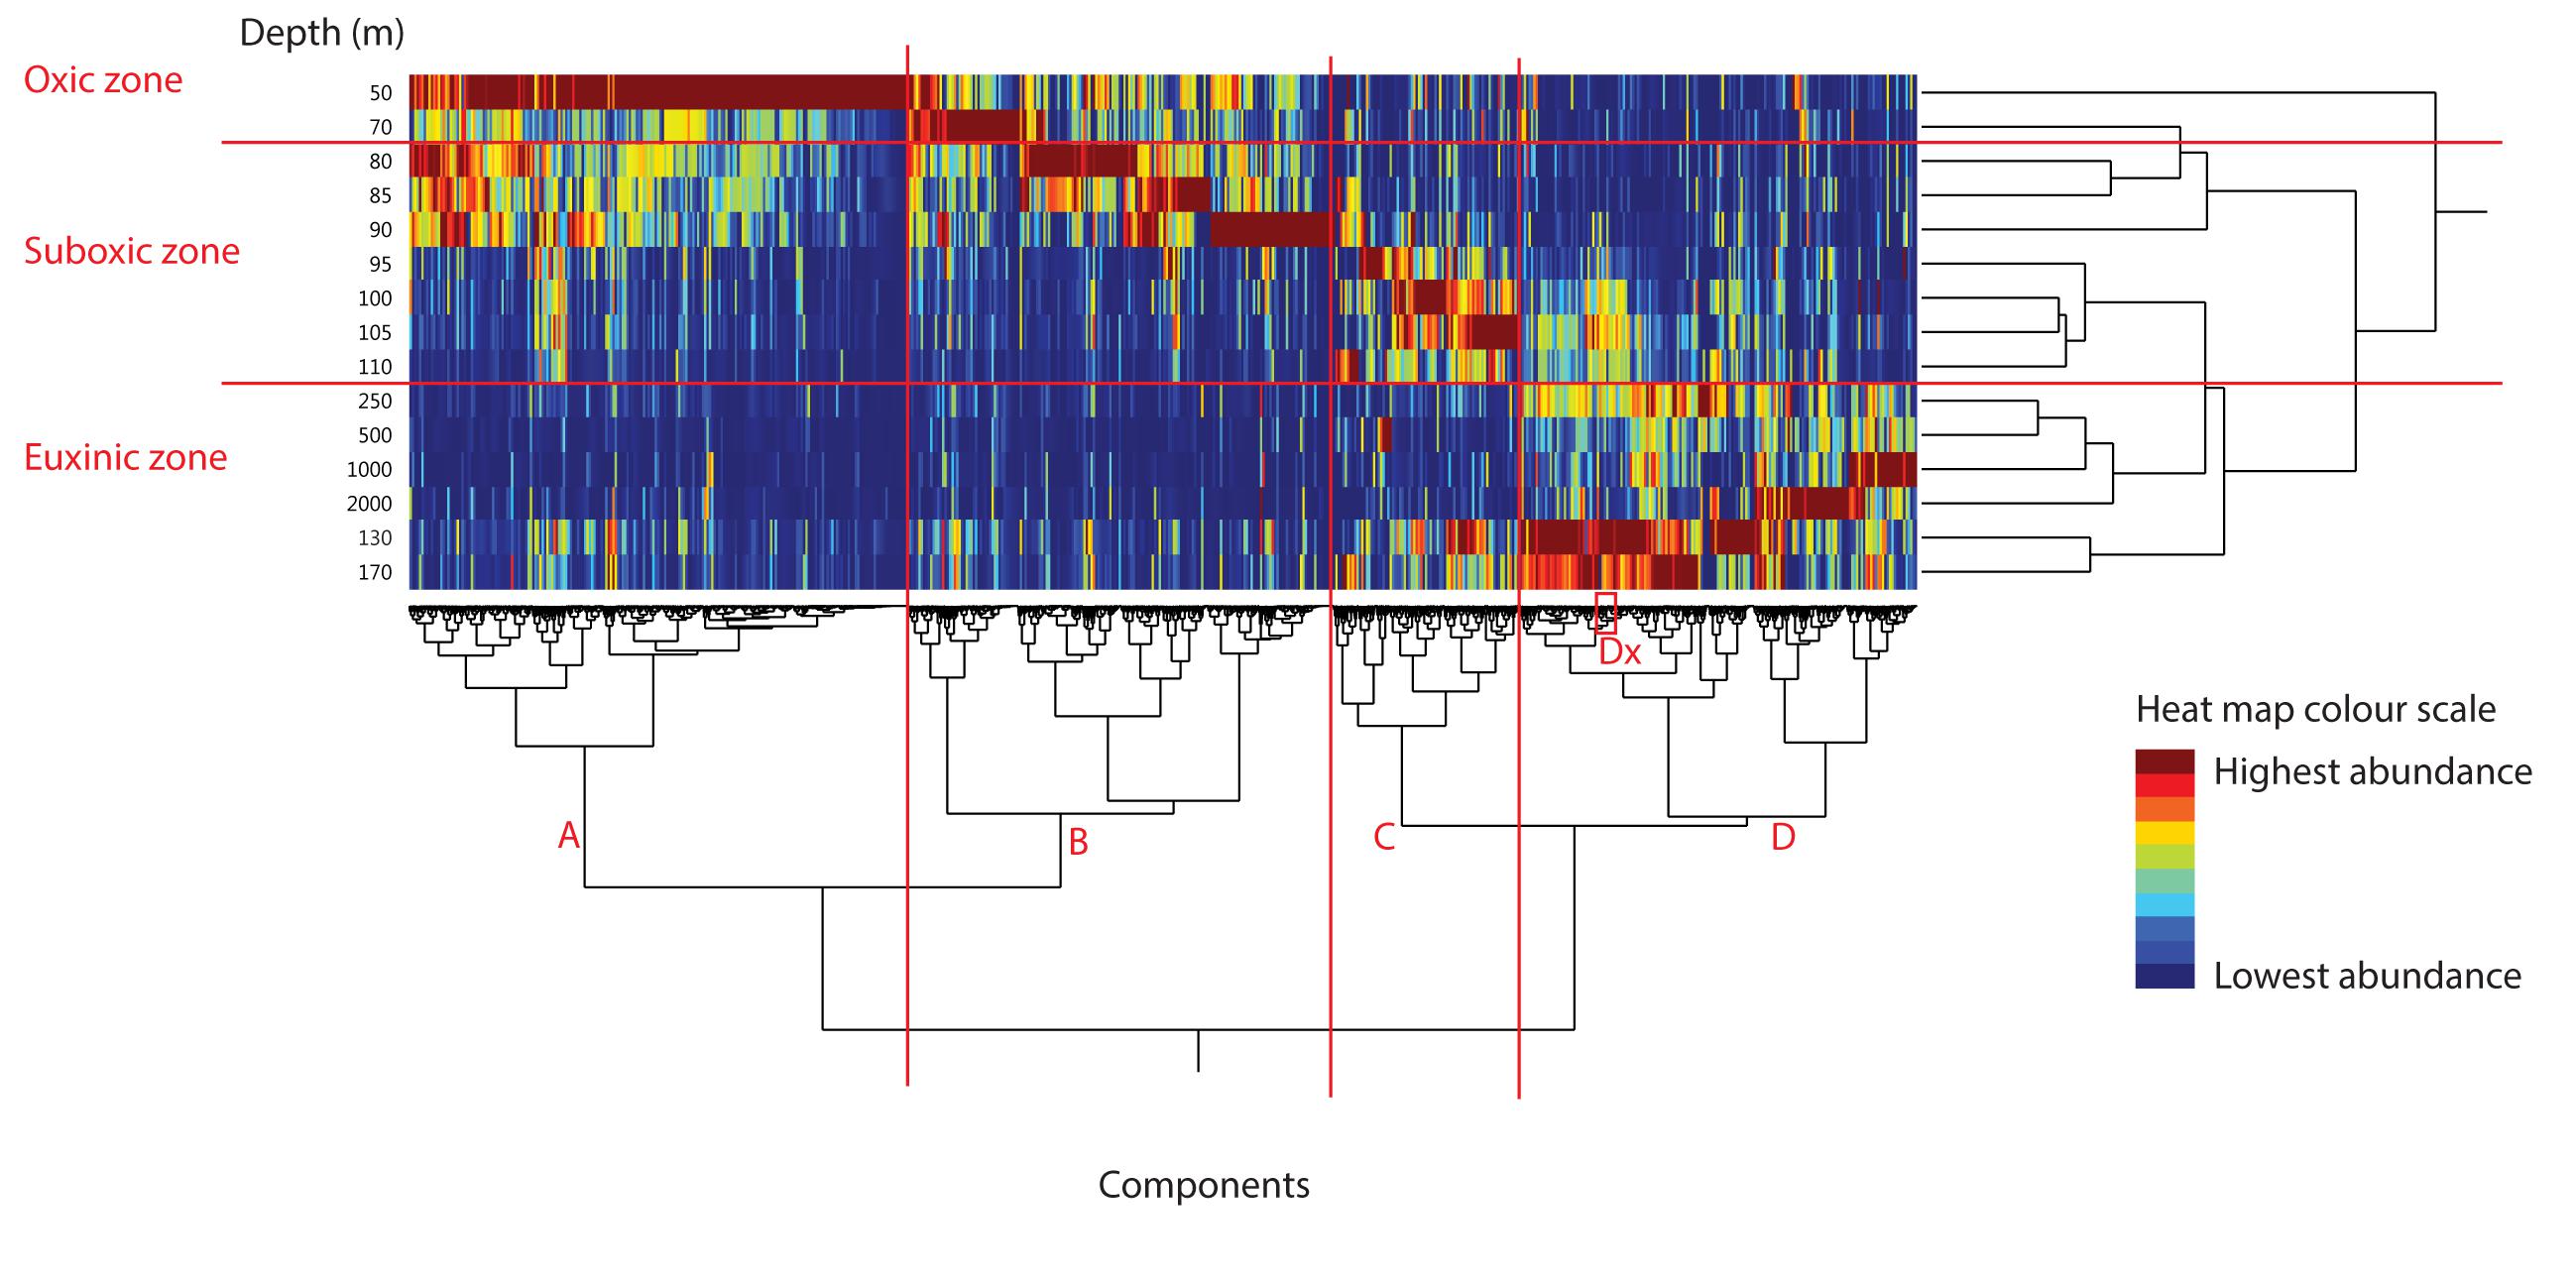
Figure 2. Heat map of the peak areas of 14,648 component in Black Sea SPM from June 2013 as extracted by MZmine software. Color scheme represents component’s depth profile, red, highest abundance; and blue, lowest abundance. SPM extracts clustered by similarity in component distribution on the vertical axis and components clustered by similarity of depth profile through water column on the horizontal axis. Red annotations show the water column redox zones, as given in Table 1.
Component Clusters and Their Association With Specific Redox Zones
The vertical clustering generally followed the three redox zones (cf. Table 1) as marked (with red horizontal lines and red labels). The division between the redox zones was also visible in the distinct areas of component abundance maxima (red color) on the heat map, indicating a general division in the component signature of the SPM based on different chemical, and by extension, biological strata. The dendrogram of the 14,648 components (along the horizontal axis, Figure 2) showed four main clusters. We denoted these four large clusters as A–D (with red vertical lines and red labels). The four component clusters also correlated well with the different redox zones. Component cluster A (4846 components) corresponded most closely with the oxic zone (50 mbsl). Cluster B (4131 components) was most associated with the upper half of the suboxic zone and the lowest depth from the oxic zone (70–90 mbsl), while cluster C (1822 components) corresponded with the deeper part of the suboxic zone (95–110 mbsl). Component cluster D (3849 components) was most associated with the euxinic zone (130–2000 mbsl).
This division of the components into redox-defined niches of the Black Sea is in line with the earlier findings from traditional lipid analyses (Repeta and Simpson, 1991; Kuypers et al., 2003; Wakeham et al., 2003, 2007; Coolen et al., 2007; Schubotz et al., 2009; Becker et al., 2018b). The benefit of this non-targeted visualization approach, however, is that it is quick, unbiased, uses all mass spectral information and does not require the laborious integration of all compounds, nor the plotting of their individual depth profiles. Furthermore, the components, while dominated by lipids due to the extraction and analytical methods applied, are expected to contain many other biomolecules, expanding the search for potential biomarkers associated with microorganisms or processes of interest.
Abundant Components in Major Clusters
In order to examine the output of our component extraction and visualization method, we examined the 10 most abundant components in each of the four component clusters A–D (Table 2) in order to identify them and to compare the results with previous studies of the Black Sea lipidome (e.g., Neretin et al., 2007; Wakeham et al., 2007; Schubotz et al., 2009; Sollai et al., 2018). Identification followed traditional MS interpretation methods, looking at the accurate mass of the component and its MS/MS spectrum in comparison with published data. In the component cluster A (associated with the oxic zone), seven of the 10 most abundant components were triacylglycerols (TAG; Hsu and Turk, 1999). TAG lipids can form an important fraction of the total fatty acid inventory, and are utilized as storage lipids in algae and zooplankton (i.e., Guschina and Harwood, 2009; Becker et al., 2018a). Also abundant components in cluster A were two betaine lipids: diacylglycerylcarboxyhydroxymethylcholine (DGCC) and diacylglyceryltrimethylhomoserine (DGTS; Li et al., 2017). Betaine lipids have been found in a variety of eukaryotes and photosynthetic bacteria (Dembitsky, 1996) and DGTS in particular is found in green algae (Li et al., 2017), while DGCCs have been shown to be a common membrane lipid in Haptophyceae algae (Kato et al., 1996). Also present was the photosynthetic pigment chlorophyll-a (chl-a) (Bale et al., 2011; Table 2). The dominance of TAGs, betaines lipids and chl-a in the component cluster associated with the oxic (photic) zone are all in line with a dominance of phytoplankton. In fact, the western Black Sea experiences extensive phytoplankton blooms, especially during the summer period (Moncheva et al., 2001) when our sampling occurred. In a previous study of IPLs throughout the Black Sea water column, betaine lipids were found to be very abundant in the oxic zone but TAGs and chlorophylls were not reported owing to the applied chromatographic method (Schubotz et al., 2009).
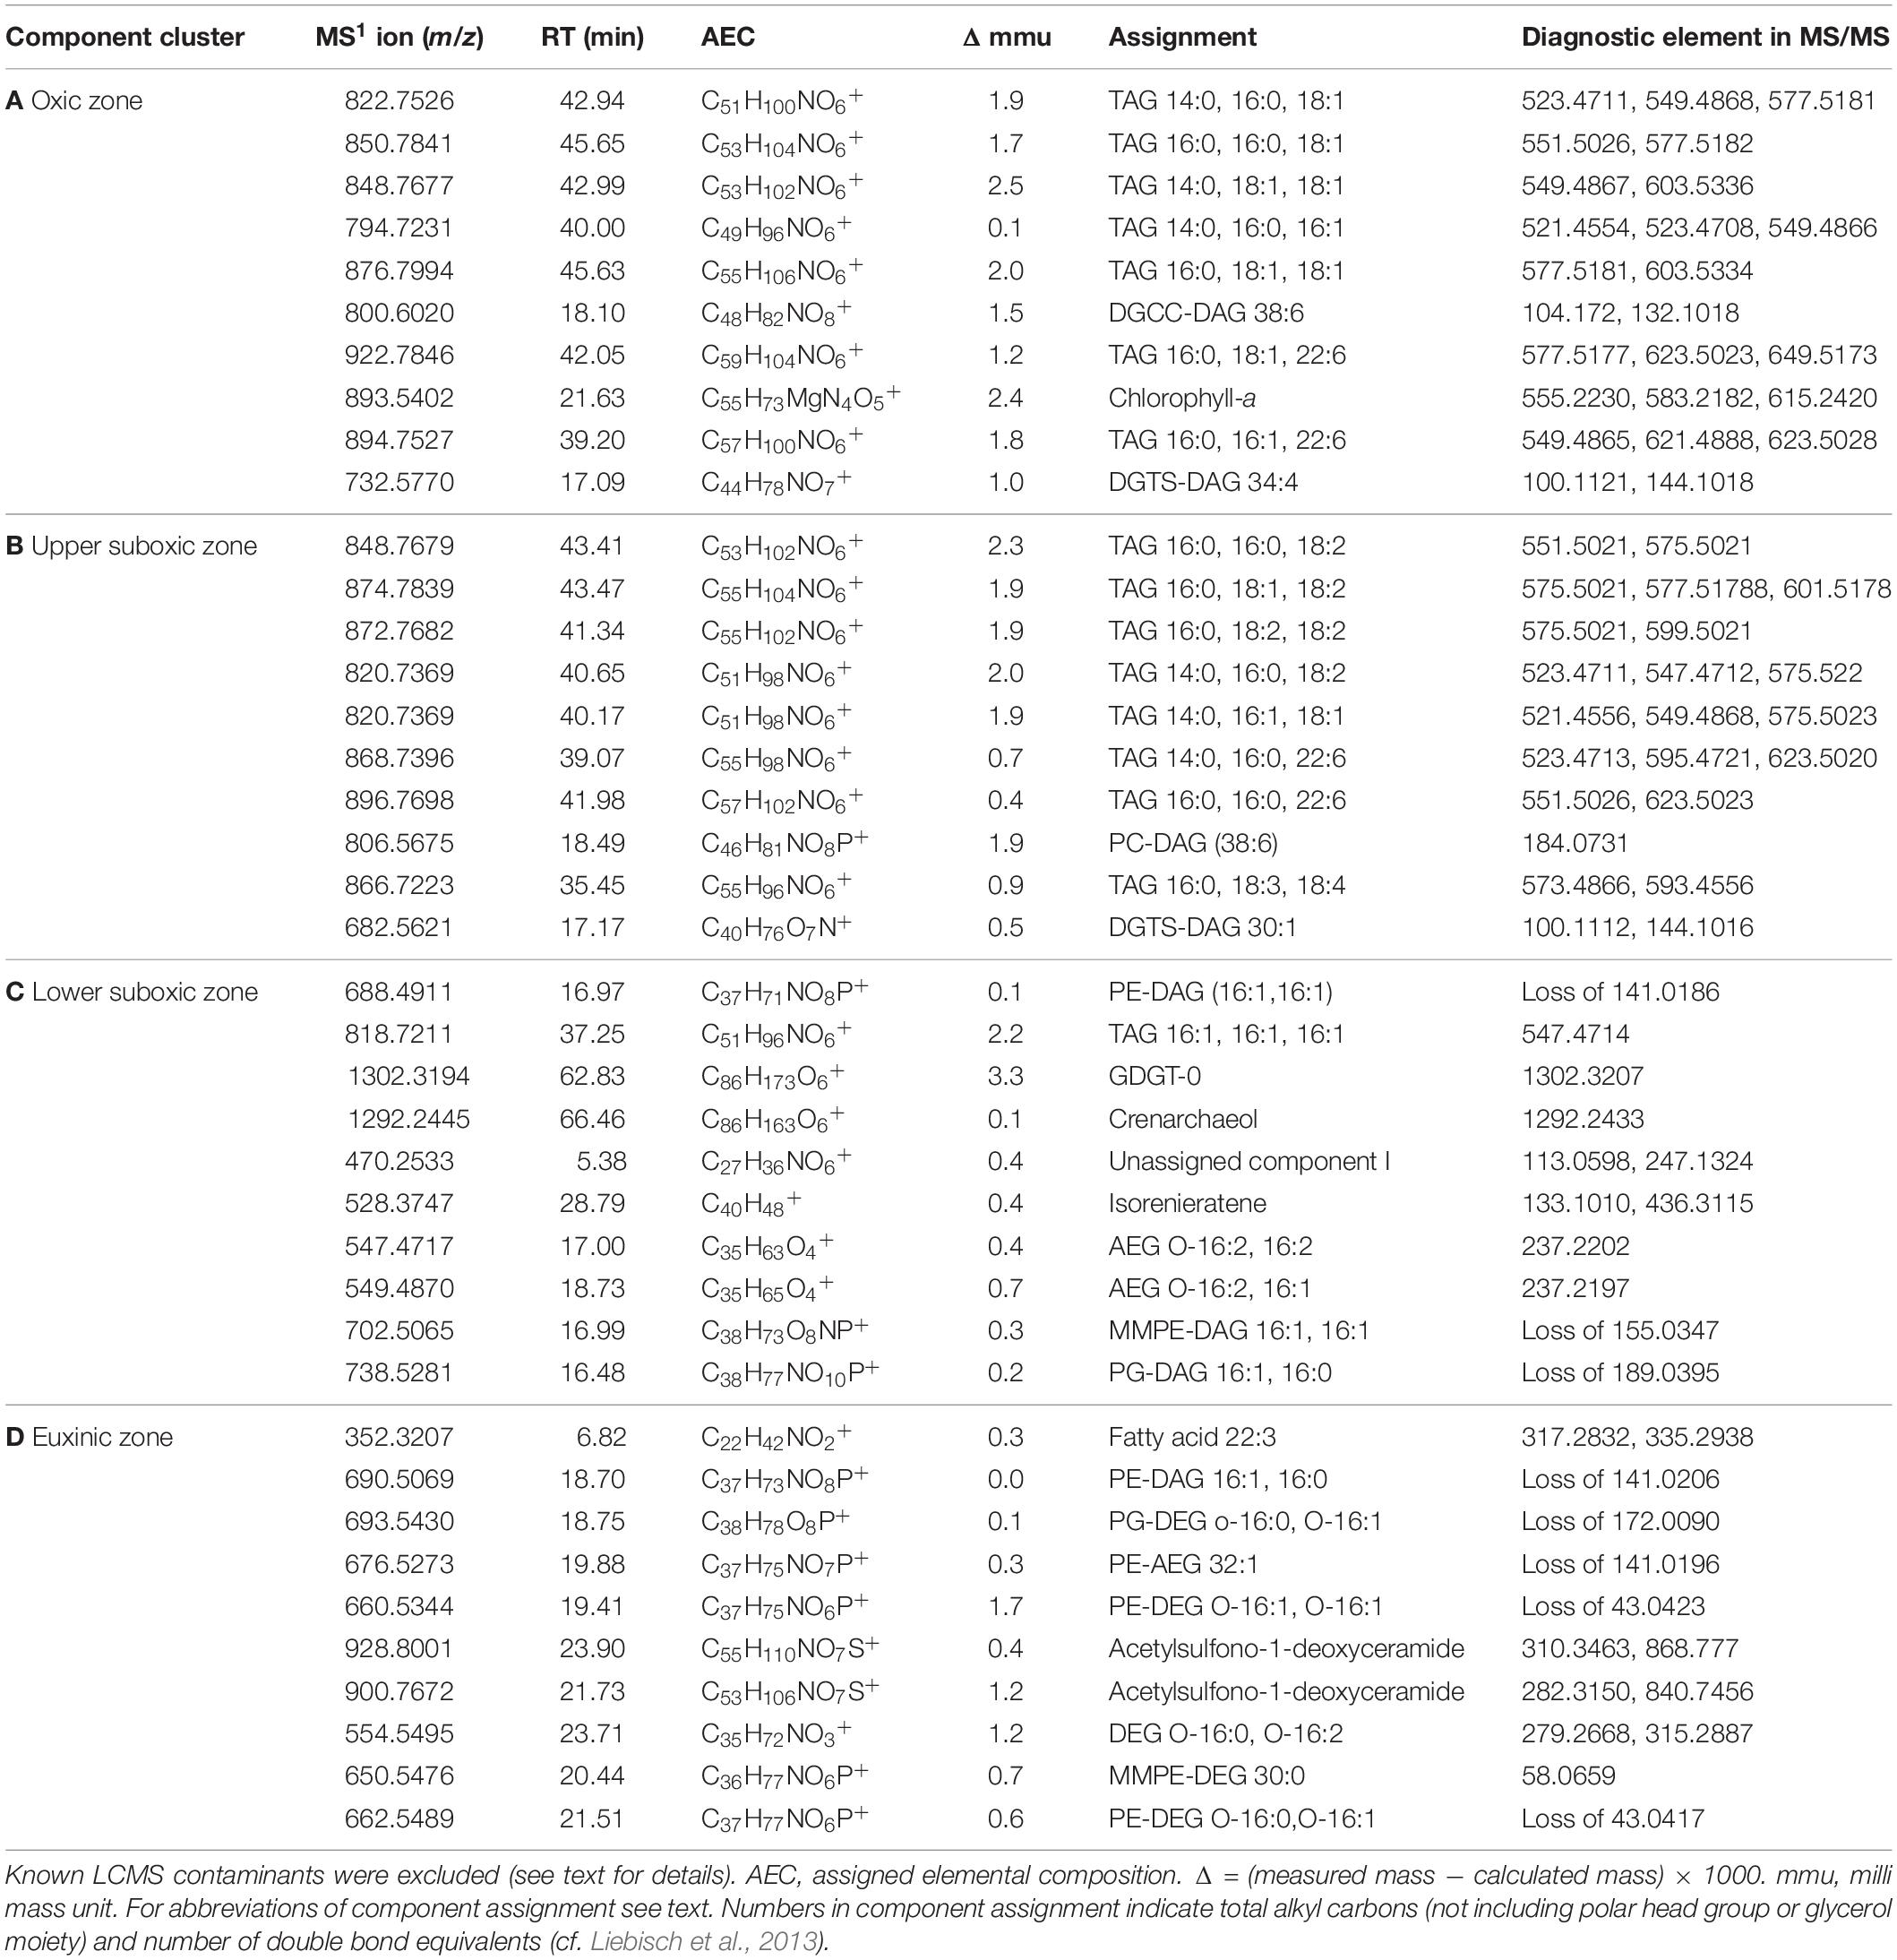
Table 2. The most abundant components of cluster A–D in the Black Sea SPM extracts (2013 expedition).
In cluster B (associated with the upper part of the suboxic zone, 70–90 mbsl), the eight of the 10 most abundant components were also TAG lipids. A DGTS betaine lipids was also in the most abundant components of this cluster along with a phosphatidylcholine (PC) lipid with a highly unsaturated diacyl glycerol (DAG) core: PC-DAG 38:6. PCs containing long chain highly unsaturated acyl moieties are associated with phytoplankton (Brett and Müller−Navarra, 1997) and have been observed previously in the oxic zone of the Black Sea (Schubotz et al., 2009). These results indicate that the upper part of the suboxic zone was still dominated by phytoplankton-derived lipids.
The 10 most abundant components in cluster C (associated with the lower half of the suboxic zone; Table 2) included three DAG-phospholipids: a phosphoethanolamine (PE) and a monomethyl PE (MMPE) both with two 16:1 fatty acids, and a phosphoglycerol (PG)-DAG with 16:0,16:1 fatty acids. PE-IPLs are frequently the main lipid component of bacterial membranes. Schubotz et al. (2009) also found diacyl phospholipids to be characteristic of the suboxic zone of the Black Sea. The 2nd most abundant component was a TAG (with 16:1, 16:1, 16:1 fatty acids). As well as being storage lipids in living algae and zooplankton, TAGs are present in sinking particles (Wakeham, 1985) and hence their abundance here, well below the oxic zone, may be due to sinking material, including algal cells and zooplankton fecal pellets (Hay et al., 1990; Bologa et al., 1999; Moncheva et al., 2001; Wakeham et al., 2007). Two other abundant components in cluster C were acyl/ether glycerol lipids (termed AEGs; Sturt et al., 2004) without a polar head group: both with 16:2 ether bound chains and with a 16:1 fatty acid and a 16:2 fatty acid, respectively. AEGs have been reported mainly in anaerobic bacteria, although with some exceptions in aerobic bacteria, and are thought to improve cell resistance, relative to DAGs, to extreme external conditions (Grossi et al., 2015).
Also among the top six components in cluster C were two core glycerol dialkyl glycerol tetraethers (GDGTs): GDGT-0 and crenarchaeol. These archaeal membrane lipids are sn-2,3-dialkyl diglycerol tetraethers with two glycerol moieties connected by two C40 isoprenoid chains which contain 0–8 cyclopentane moieties (i.e., GDGT-n, where n is the number of cyclopentane moieties) (Schouten et al., 2013). To date, crenarchaeol (which has four cyclopentane moieties and one cyclohexane moiety) has only been associated with the archaeal phylum Thaumarchaeota and hence is considered to represent a specific biomarker for members of this phylum (e.g., Sinninghe Damsté et al., 2002b; Schouten et al., 2013; Bale et al., 2019a). GDGT-0 is a more cosmopolitan GDGT, produced by representatives of the Thaumarchaeota, Crenarchaeota, and Euryarchaeota (Villanueva et al., 2014). Previous studies of archaeal lipids in the Black Sea water column also reported both GDGT-0 and crenarchaeol throughout the water column (Wakeham et al., 2003; Coolen et al., 2007; Sollai et al., 2018). Sollai et al. (2018) found a maximum in archaeal 16S rRNA gene copies at 105 m, in the lower part of the suboxic zone, mainly attributed to Nitrosopumilus species, many of which are known to produce GDGT-0 and crenarchaeol as their dominant GDGTs (Sinninghe Damsté et al., 2002a; Schouten et al., 2008; Pitcher et al., 2011; Qin et al., 2015; Elling et al., 2017). Another abundant component at this depth was isorenieratene, a specific carotenoid of the photosynthetic sulfur bacteria Chlorobiaceae (Repeta, 1993; Koopmans et al., 1996; Sinninghe Damsté et al., 2001; Brocks et al., 2005). That isorenieratene is found in component cluster C, associated with the lower suboxic zone, is to be expected, as Chlorobiaceae perform photosynthesis using sulfide, and hence require photic zone anoxia, as has been shown to occur in the suboxic zone of the Black Sea (Repeta et al., 1989; Repeta and Simpson, 1991; Overmann et al., 1992; Becker et al., 2018b).
Finally, one of the most abundant components in cluster C was an unassigned component (I), with m/z 470.2520 (Table 2; cf. Supplementary Figure 1A for MS/MS spectrum). The presence of this unassigned component in the 10 most abundant components of cluster C highlights that our untargeted method has the potential to identify novel compounds associated with specific redox zones and by extension, specific groups of organisms or their activity. Using traditional MS data interpretation approaches, this component would have very likely been overlooked as it occurred at only a few depths. Such components would be interesting targets for future rigorous identification approaches or for matching with the continuously increasing number of online spectral libraries.
In component cluster D, associated with the euxinic zone, the most abundant feature was a 22:3 fatty acid without a headgroup or glycerol moiety, followed by a PE-DAG with 16:1, 16:0 fatty acids, and a PE-AEG 32:1. A previous study described PE-AEG as an important component of the lipidome at the oxic zone/oxygen minimum zone (OMZ) transition in the eastern tropical North Pacific (Schubotz et al., 2018). Also in the 10 most abundant components were multiple diether glycerol (DEG)-based lipids: PE-DEG with O-16:1 and O-16:0 (denoting ether-bound alkyl chain), MMPE-DEG 30:0, a PG-DEG O-16:0, O-16:1 and a DEG O-16:0, O-16:2 without a polar headgroup. Diether lipids have been detected in a limited number of bacteria (e.g., Grossi et al., 2015) but their (core lipid) abundance in the Black Sea water column has been shown to correlate with sulfate reducing bacteria (SRB; Neretin et al., 2007). Two components, tentatively assigned as sulfate-1-deoxyceramides (Ding et al., 2021), were also among most abundant components in cluster D. Ding et al. (2021) hypothesize that, as bacterial sphingolipids are mainly produced by Bacteroidetes and selected Proteobacteria (Heaver et al., 2018) and because certain Bacteroidetes from the Black Sea are known to produce capnines (Bale et al., 2020; Yadav et al., 2020), sulfono-analogs of sphinganine (Godchaux and Leadbetter, 1980), that these novel sulfate-1-deoxyceramides, may also be produced by anaerobic heterotrophs related to Bacteroidetes.
In summary, our non-targeted data analysis resulted in clusters of components associated with specific depths. The zonation of these components (the major ones being lipids) due to microbial niches is in agreement with previous studies (Wakeham et al., 2007; Schubotz et al., 2009), however, our approach is rapid and unbiased and includes all components within the analytical window whether they have been identified or not.
Rapid Clustering of Lipids Based on Depth Profile Similarity
The LCMS data visualization method we have presented here is useful to examine clusters that contain a known component, in order to find other components with the same distribution through the water column. Here, we demonstrate this by examining other components in a subcluster containing the sulfate-1-deoxyceramide with m/z 928.8001 (cluster D, associated with the euxinic zone, Table 2). As discussed in Ding et al. (2021), this novel 1-deoxysphingolipids may be produced by an as-yet uncultured anaerobic heterotroph related to Bacteroidetes. We examined components with a very similar depth profile, that may be associated with the same microbial producer or with producers that live in the same environmental niche. At a higher level of clustering, the sulfate-1-deoxyceramide with m/z 928.8001 was in a cluster of 24 components (Dx; as indicated in Figure 2). We present here the 10 most abundant components in this subcluster (Dx) (Table 3). All 10 components followed a similar abundance depth profile with a distinct maximum at 130 m. Other than the sulfate-1-deoxyceramide with m/z 928.8001 (Ding et al., 2021), no other components in Dx were in the list of top 10 most abundant components in cluster D.
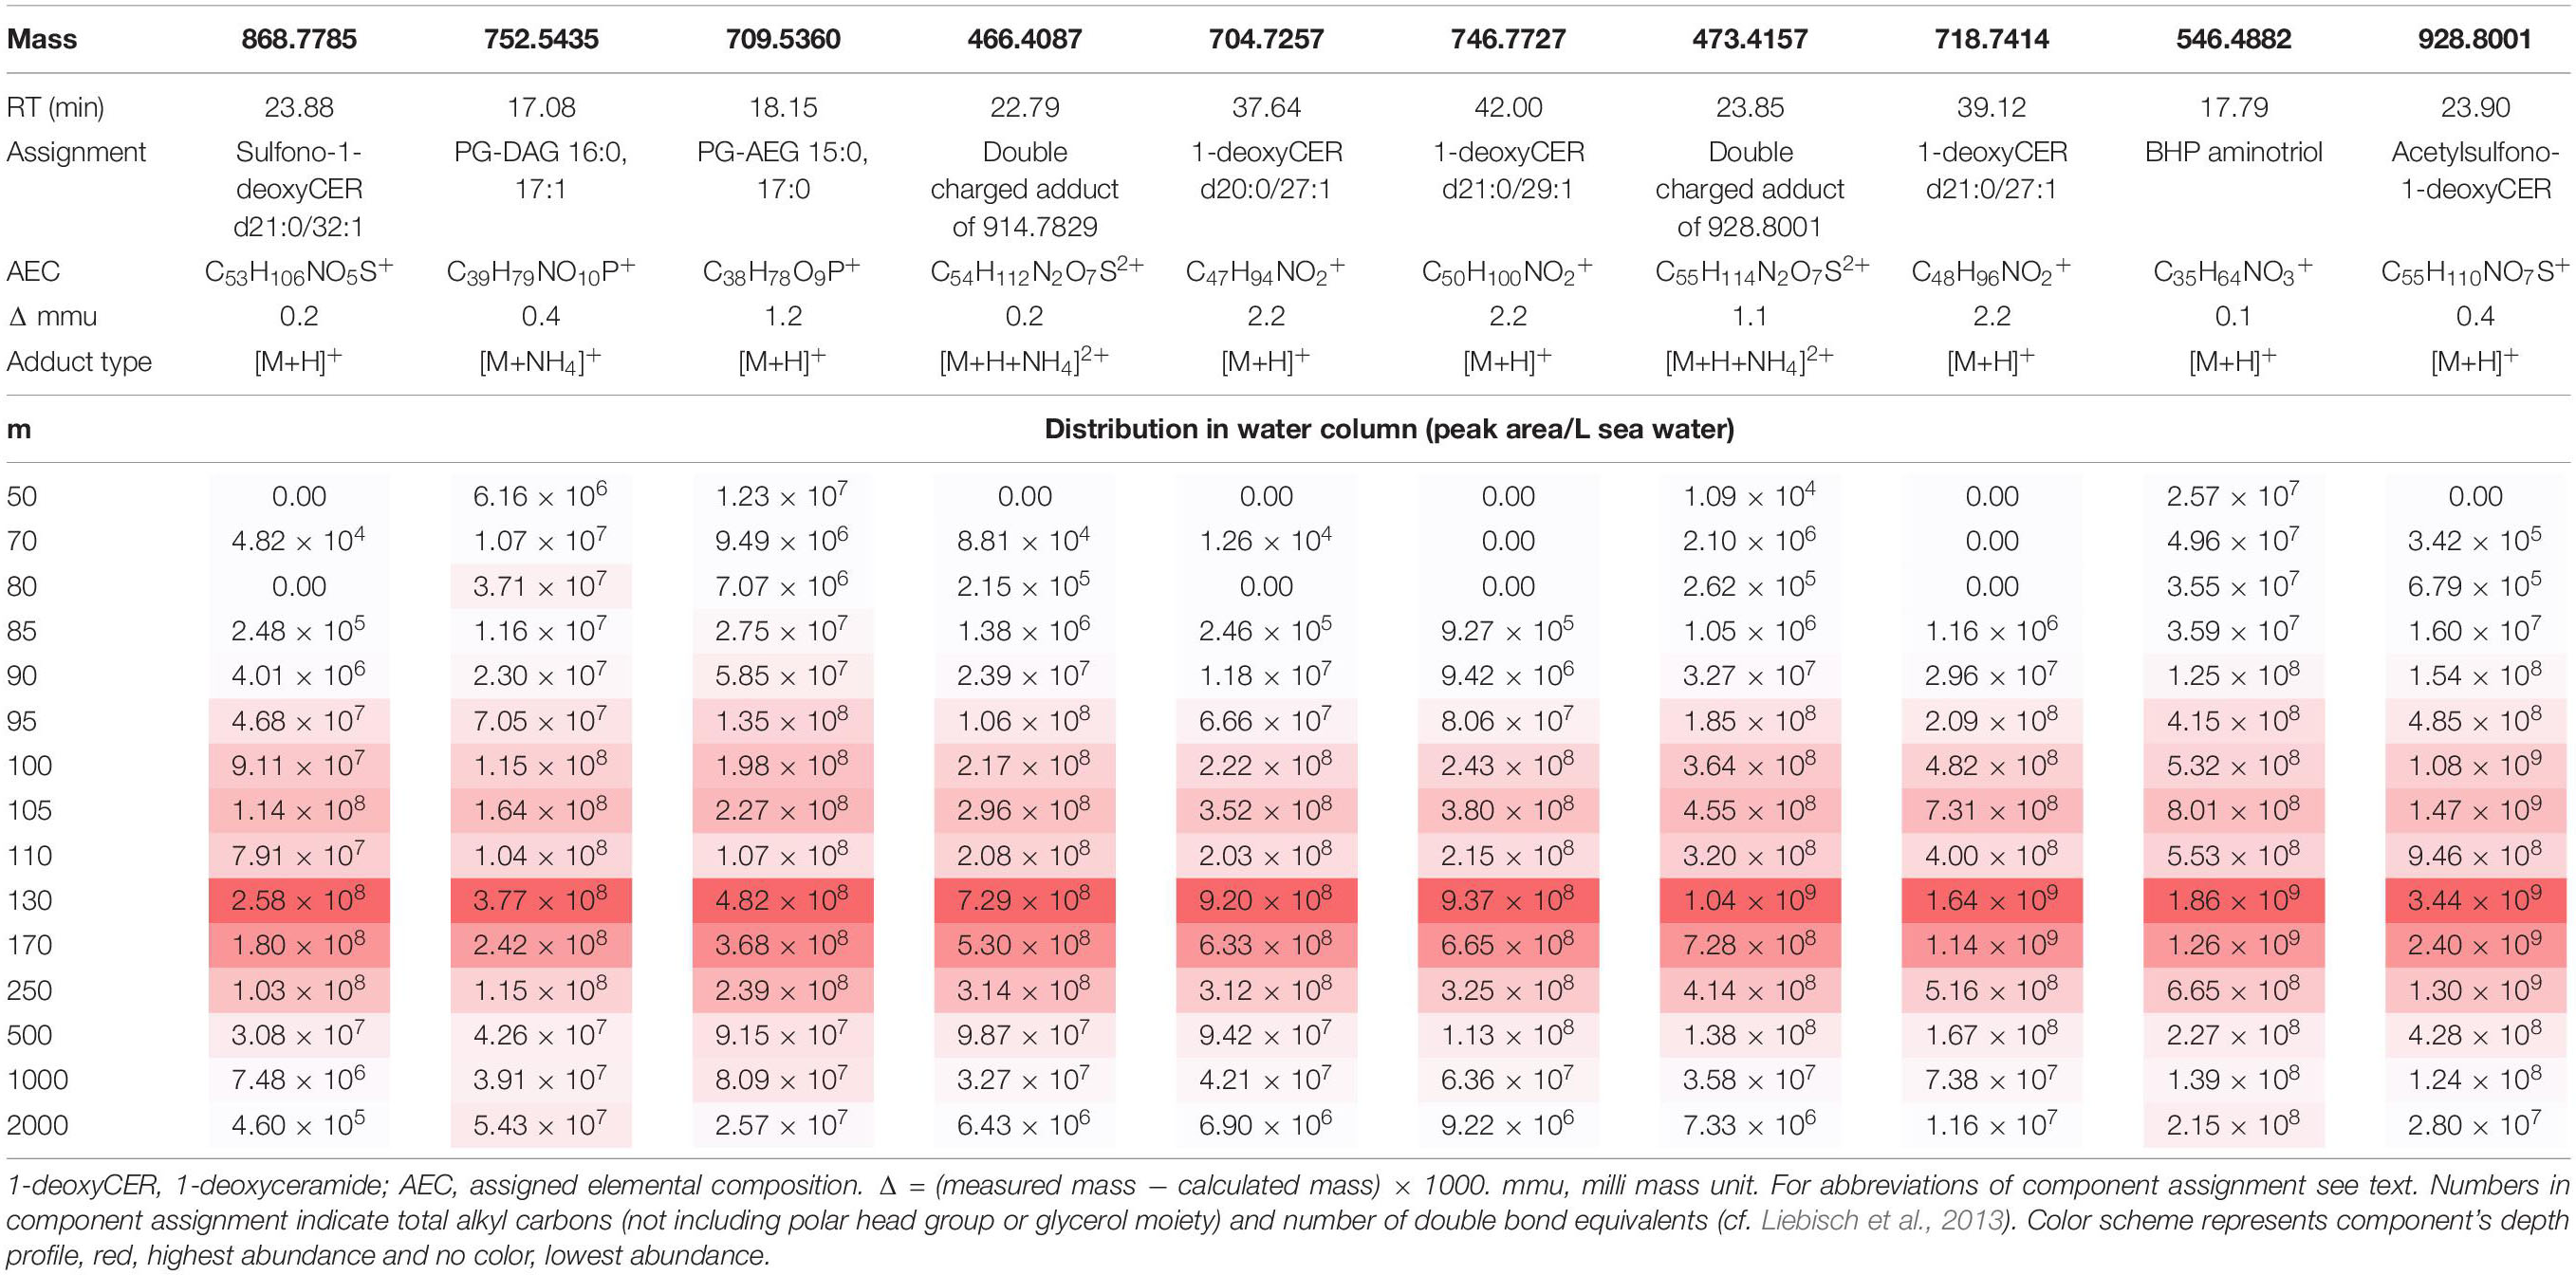
Table 3. The most abundant components of cluster Dx in the Black Sea SPM extracts (2013 expedition).
The second most abundant component was assigned as aminotriol bacteriohopanepolyol (BHP) based on its accurate mass and fragmentation spectra (Hopmans et al., 2021). This BHP is relatively ubiquitous in marine systems (Talbot et al., 2014; Rush et al., 2016) but has been specifically associated with aerobic methanotrophic bacteria (Cvejic et al., 2000) and with SRB (Blumenberg et al., 2012). At its maxima at 130 mbsl, at the top of the euxinic zone, it is most probably associated with SRB. Three components were 1-deoxyceramides and two were sulfono-1-deoxyceramides (as per their assignment in Ding et al., 2021). Also present were two PGs, one with a DAG 33:1 core and one with a 32:0 core. Two of the components listed, at m/z 473.4157 and 466.4087 were artifacts of analysis, doubly charged acetylsulfono-1-deoxyceramides (with [M+H]+ at m/z 928.8001 and 914.7830, respectively). This was clear due to the 0.5 Da spacing in their isotope pattern (Supplementary Figure 2).
Here, we show that the selection of a subcluster of components around a component of interest is straightforward and quick and allows for rapid associations between different components to be made, based on their specific depth profiles, rather than their chemical composition.
Comparison Between SPM Collected in 2013 and 2017
In order to examine the robustness of our method for distinguishing the lipidome associated with different depths of the Black Sea water column, we followed the same method of component extraction and visualization on SPM extracts from the Black Sea water column, collected in March 2017 at a station located ∼110 km from that of 2013 cruise. SPM was collected at an earlier time in the year (March versus June), with a different distribution of sampling depths (more sampling in oxic zone, less in suboxic zone, Table 1), and using a smaller (nominal) pore size of filter (0.3 versus 0.7 μm). We followed the same data extraction and data processing procedure as described above for the 2013 sample set. The heat map generated from these data again shows division in the lipidome (Figure 3), supported by the vertical clustering, generally in line with the three redox zones. The dendrogram of the 12,372 components was again made up of four distinct clusters E–H (Figure 3), which corresponded with the redox zones. Component cluster E (6006 components) corresponded with the oxic zone. Cluster F (1292 components) with the suboxic zone, and again included the 70 mbsl depth SPM, from the base of the oxic zone. Cluster G (1941 components) corresponded with the uppermost sampling depth from the euxinic zone (130 mbsl), while cluster G (3133) with the remainder of the depths in the euxinic zone.
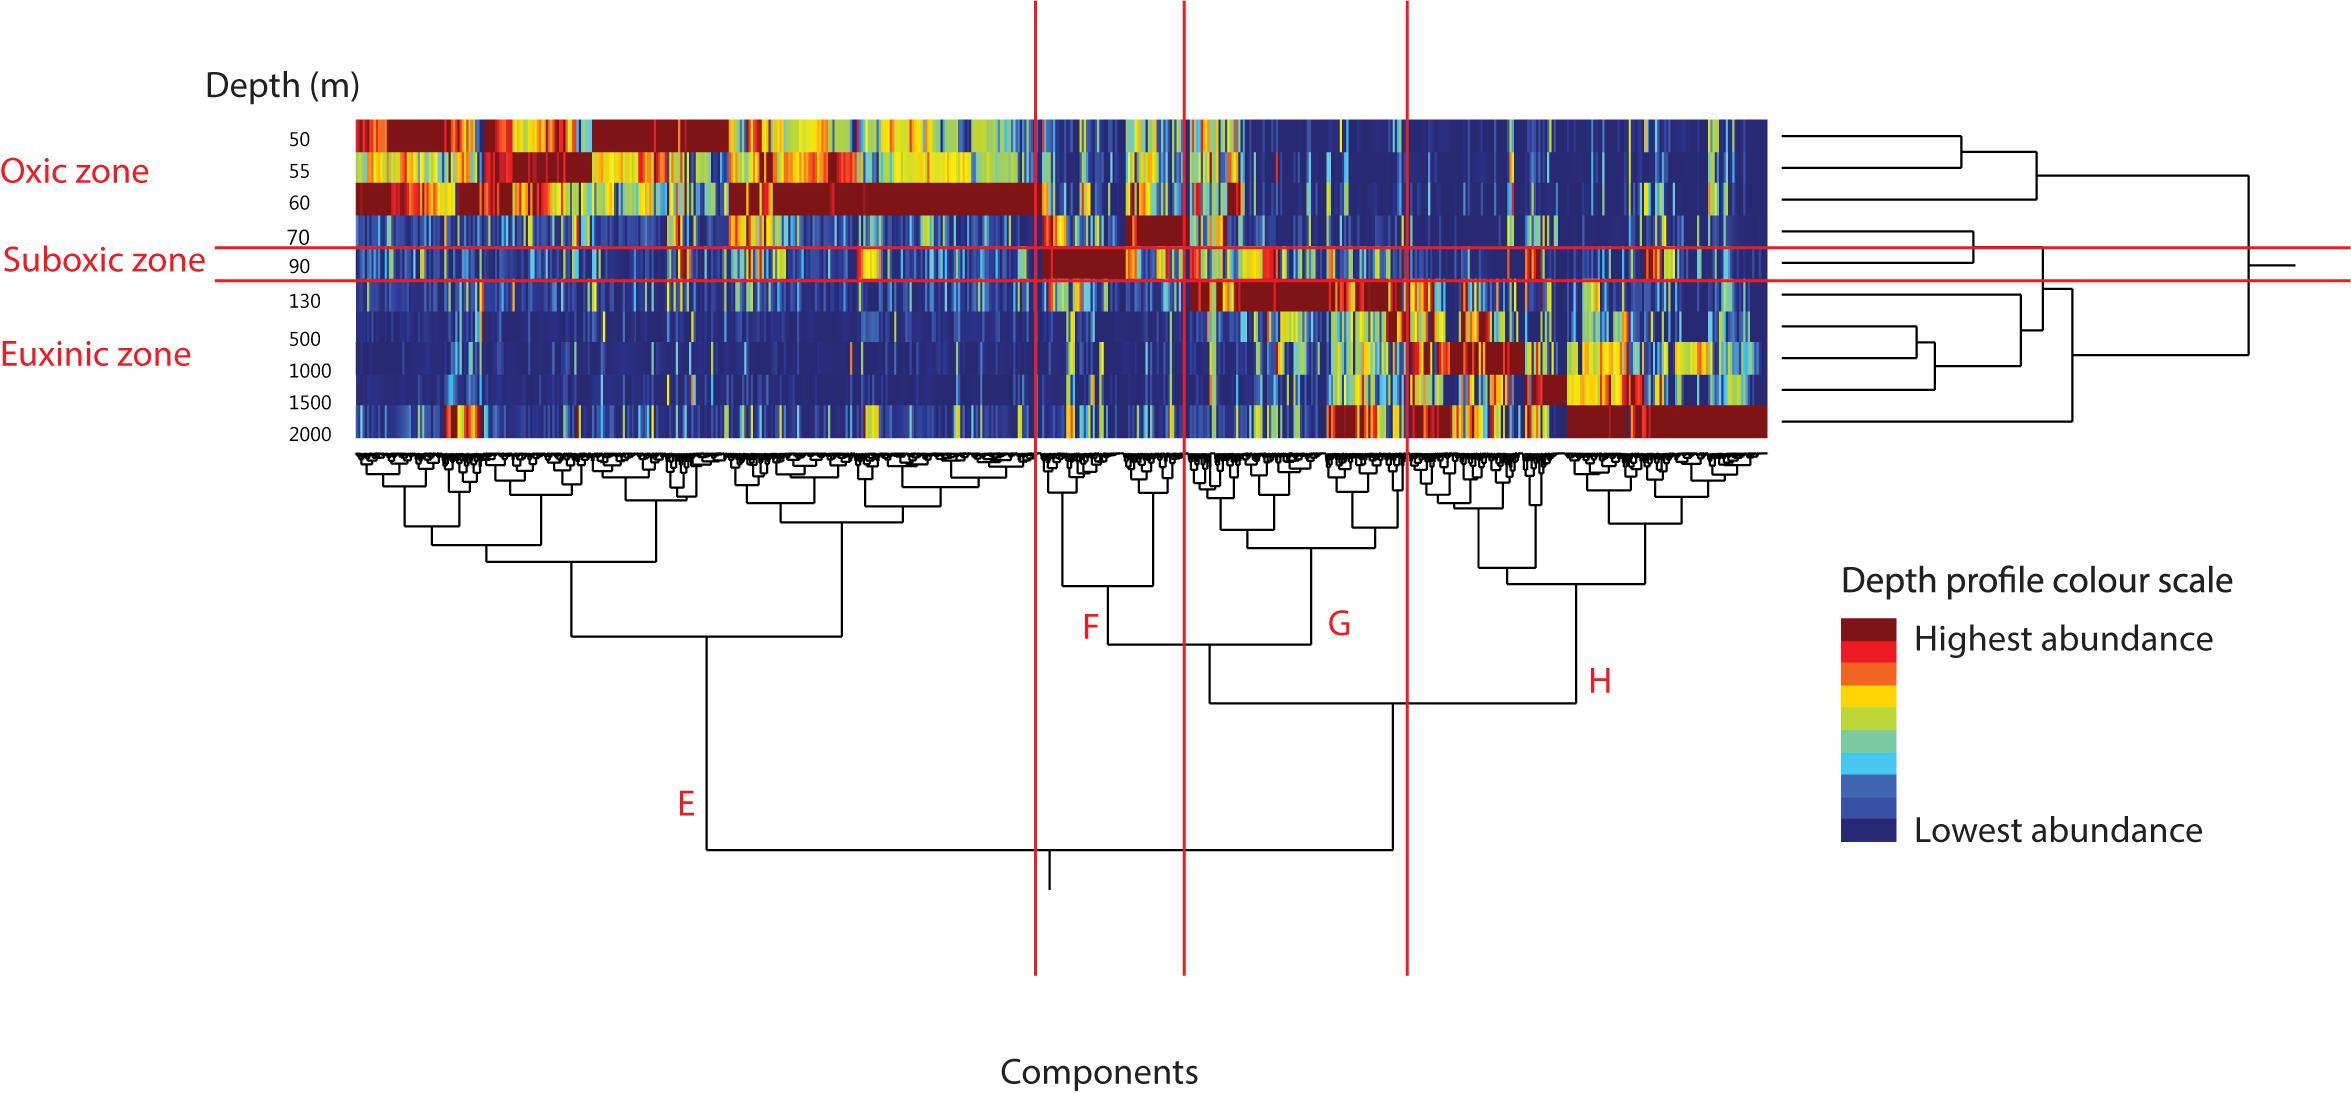
Figure 3. Heat map of the peak area of 12,372 components in Black Sea SPM from March 2017 as extracted by MZmine software. Color scheme represents component’s depth profile, red, highest abundance; and blue, lowest abundance. SPM extracts clustered by similarity in component distribution on the vertical axis and components clustered by similarity of depth profile through water column on the horizontal axis. Red annotations show the water column redox zones, as given in Table 1.
We again examined the 10 most abundant components (Table 4) in component clusters E–H (Figure 3). In cluster E, associated with the oxic zone, six of the 10 most abundant components were TAG lipids, similar to the 2013 dataset (Table 2). Two more abundant components were the chl-a alteration product pheophytin-a and the epimer of pheophytin-a (C-132 diastereomer). Demetalation of chl-a to produce pheophytin-a occurs readily when chl-a is free from its stable protein complex. While pheophytin can be formed naturally, e.g., during cell senescence or grazing (Louda et al., 1998, 2002; Bale et al., 2011), it is likely that in this study it represents an artifact of sampling and extraction (transformation of chl-a) as the sample collection and extraction were not optimized for pigment analysis. The presence of pheophytin-a, whether a natural occurring compound or a proxy for chlorophyll is not surprising as the oxic photic zone of the western Black Sea experiences extensive phytoplankton blooms (Moncheva et al., 2001). Pheophytin-a was not among the most abundant 10 components in cluster A (although chl-a was the 8th most abundant component). The same betaine lipid, DGTS 34:4 as was seen in cluster A from 2013 was among the 10 most abundant components in cluster E from 2017. Finally, an unassigned component (II), with m/z 547.2703 (Table 2; cf. Supplementary Figure 1B for MS/MS spectrum) was among the most abundant components in this cluster.
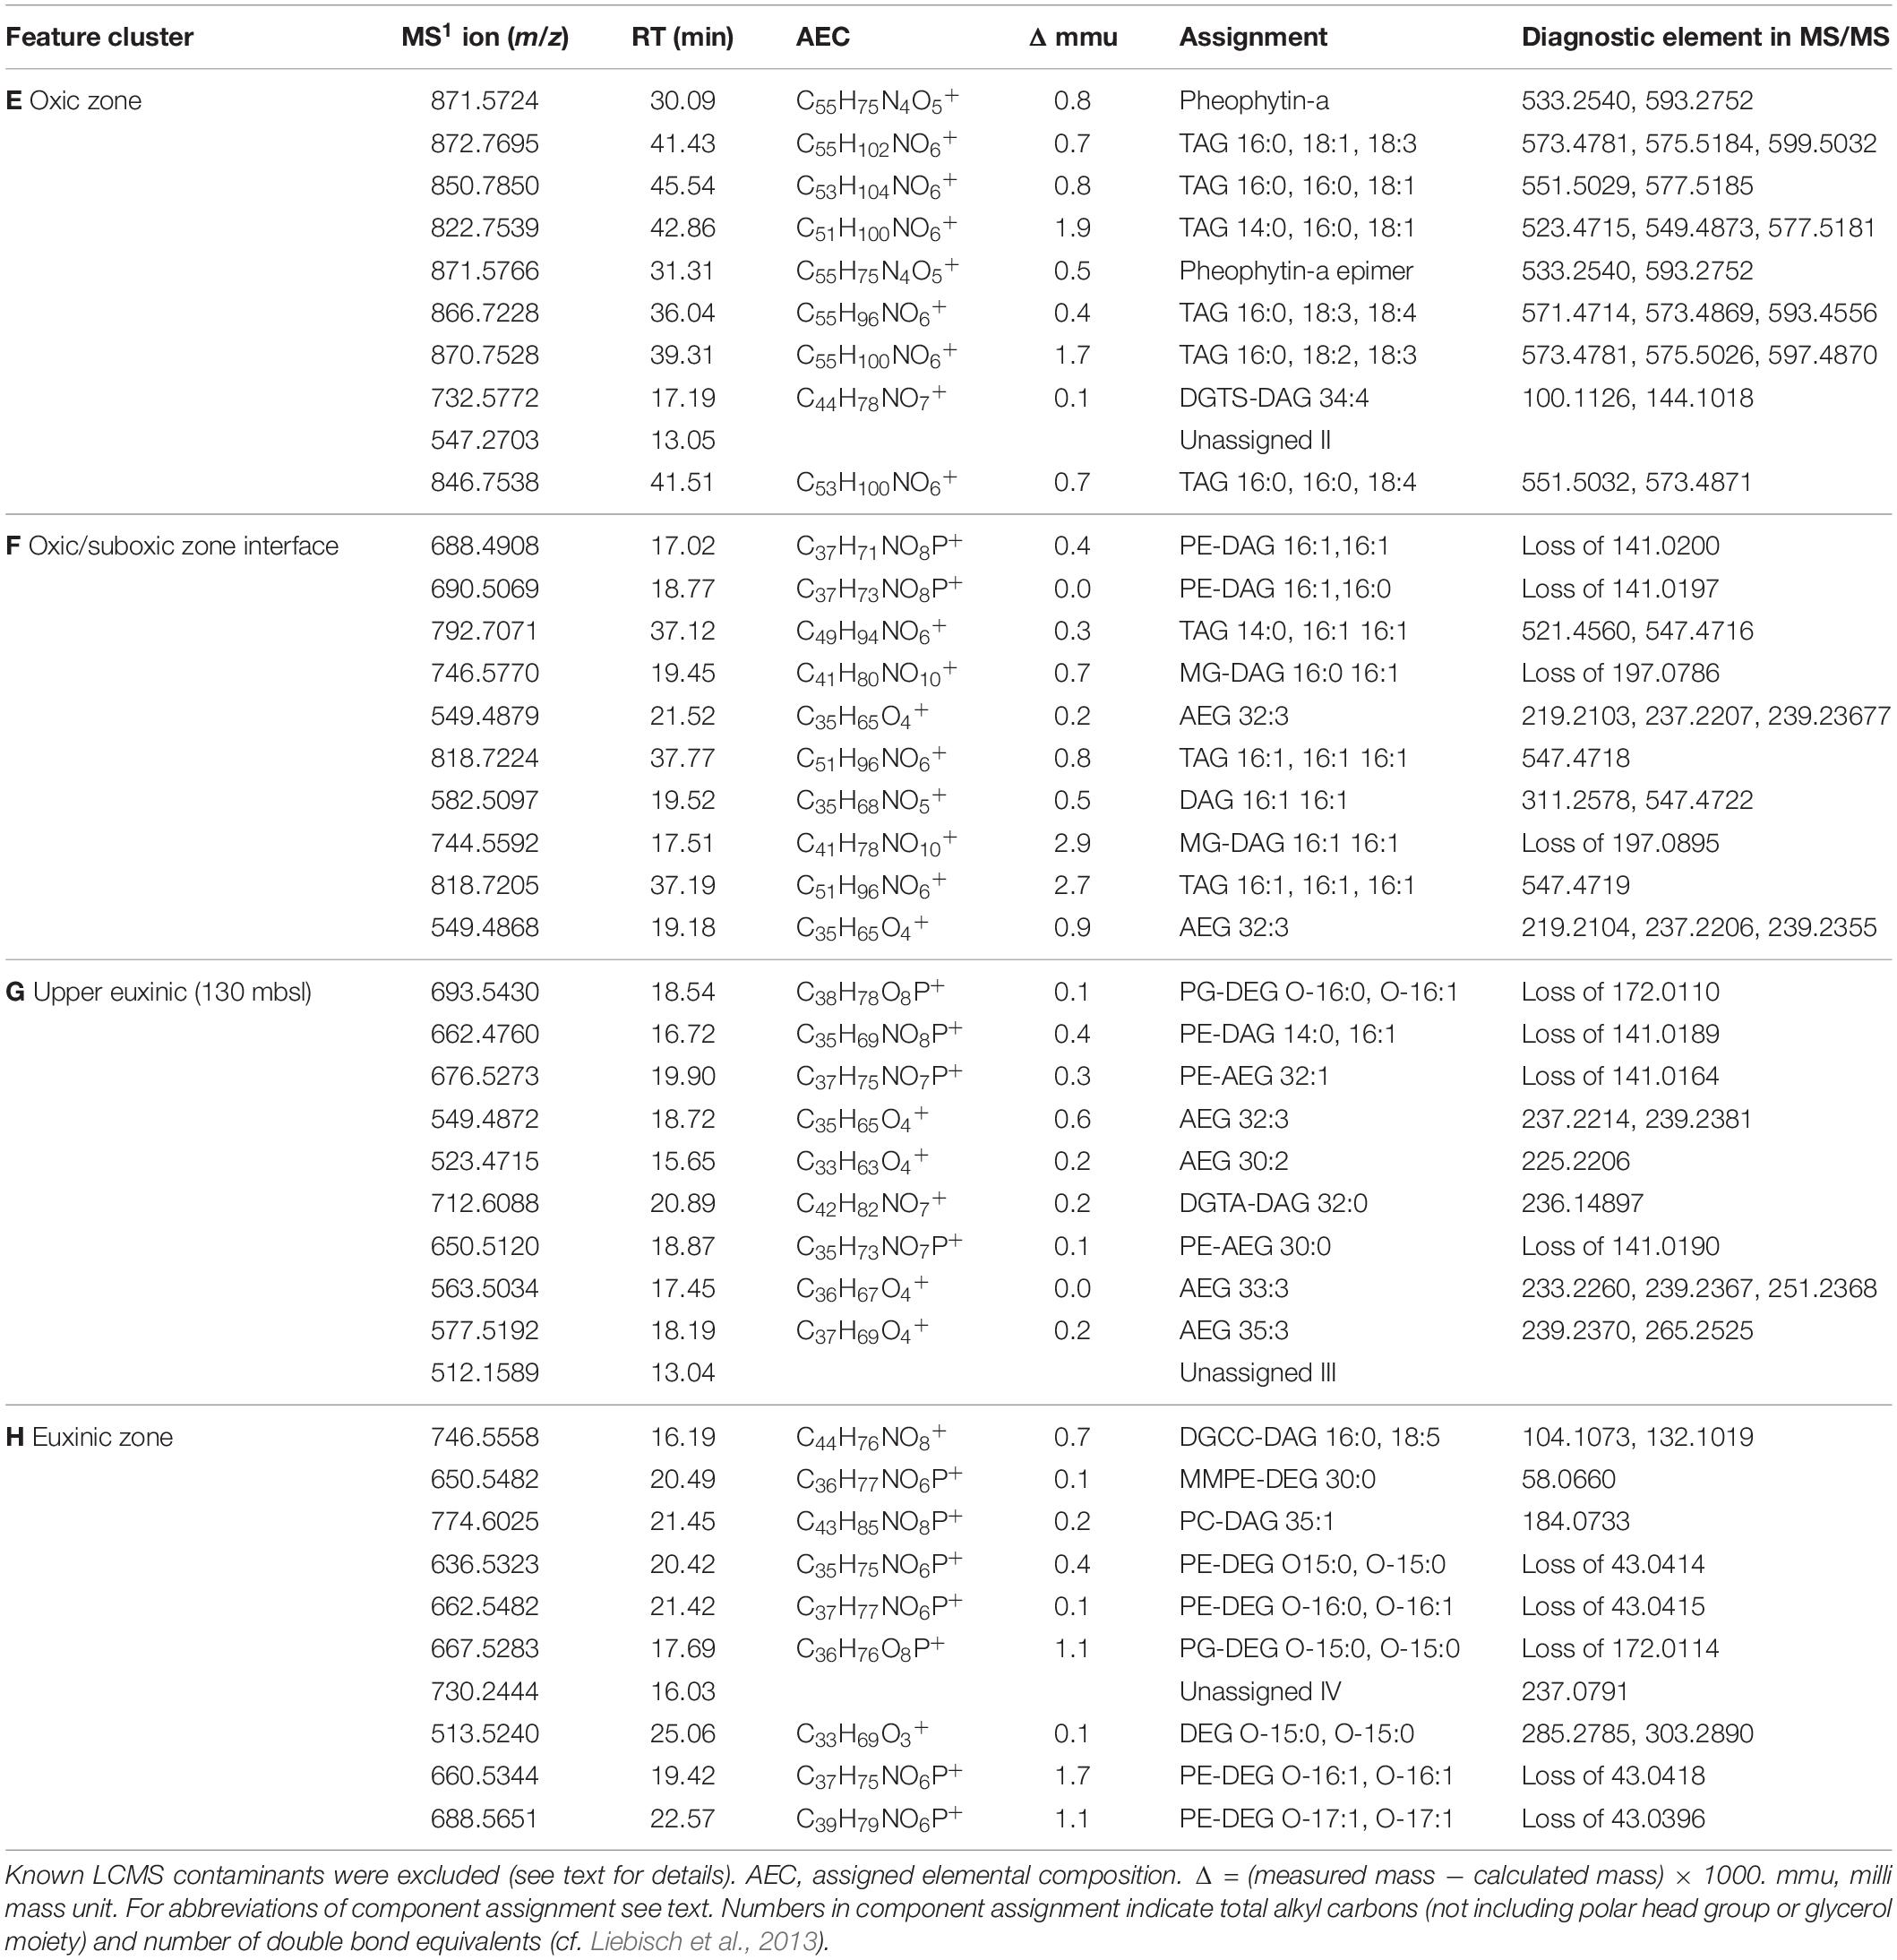
Table 4. The most abundant components of cluster E–H in the Black Sea SPM extracts (2017 expedition).
Cluster F, associated with the suboxic zone (Table 4), included three TAG lipids, a similar result to that of 2013, where TAG lipids remained abundant below the oxic zone (Table 2). Also abundant were several DAG lipids: PE-DAG 16:0, 16:1 and 16:1, 16:1. In the 2013 dataset, similar PE-DAGs were associated with the lower suboxic zone (Table 2). Two monogalactosyl [MG]-DAGs (commonly referred to as a MGDG) with 16:0 and 16:1 fatty acids were dominant components in cluster F. MGDGs are predominately associated with eukaryotic chloroplasts and cyanobacteria, although they can also be produced by non-photosynthetic bacteria (Hölzl and Dörmann, 2007; Popendorf et al., 2011), including sulfate-reducing bacteria when phosphate concentrations are below 20 μM (Bosak et al., 2016). This component was not listed among the top 10 components in any cluster from 2013. A DAG comprising of two 16:1 fatty acids and no polar head group was also among the abundant components of this cluster as were two isomers of AEG 32:3 without a polar head group (Table 4). AEG 32:3 was similarly abundant in the 2013 cluster associated with the lower suboxic zone (Table 2).
In cluster G, which was associated most closely with the SPM from 130 mbsl (the upper euxinic zone), among of the most abundant component was a DGTS betaine lipid with a DAG 32:0 core, whereas in the 2013 a similar DGTS-DAG (30:1) was associated with the upper suboxic zone. The only other abundant DAG-based lipid in the top 10 components from this cluster was PE-DAG 14:0, 16:1. Similar PE-DAGs were present there in the 2013 clusters associated with the lower suboxic zone and the euxinic zone. PE-AEG 30:0 and 32:1 were also dominant in this cluster, of which the same or similar components had been associated with the euxinic zone from 2013 (which included 130 mbsl; Table 2). Also abundant were an AEG 32:3 (a later eluting isomer to the AEG 32:3 seen in cluster F), AEG 30:2, 33:3, and 35:3. Similar components were associated with the lower suboxic zone of the 2013 dataset. Only one DEG-based lipid was among the 10 most abundant in cluster G, PG-DEG with a 16:1 and 16:0 ether bound chain as had been seen in the euxinic zone-associated cluster from 2013. Finally, an unassigned component (III), m/z 512.1589 (Table 4; cf. Supplementary Figure 1C for MS/MS spectrum).
In cluster H, associated with the remainder of the euxinic zone, among the 10 most abundant component were two DAG-based lipids, a betaine lipid, DGCC-DAG with a 16:0 and 18:5 fatty acid and PC-DAG 35:1. Neither DGCCs nor PC-DAGs were seen in the euxinic zone cluster from 2013 and both are associated with photosynthetic organisms. Their presence at depth in 2017 may be due to sinking algal material (typically in fecal pellets or marine snow) present in the euxinic zone as particles slowly descend to the sea floor. The majority of the 10 most abundant components in this cluster were PE and MMPE DEG lipids with O-15:0, O-16:0, and O-16:1 ether bound chains, as was also observed in the euxinic zone-associated cluster from 2013. MMPE-DEG 30:0 has previously be postulated to be associated with sulfate-reducing bacteria in the anoxic zone of the Black Sea (Schubotz et al., 2009). Another abundant component of cluster H was a PG-DEG O-15:0, O-15:0. A similar component, PG-DEG O-16:0, O-16:1, occurred also in the 2013 euxinic zone cluster. Also, DEG O-15:0, O-15:0 without a polar head group was abundant. Another unassigned component (IV) was also found in this cluster, with m/z 730.2444 (Table 2; cf. Supplementary Figure 1D for MS/MS spectrum).
Overall, the UHPLC-HRMS component extraction and visualization method presented here provided, for both the 2013 and 2017 SPM datasets, a similar picture of a stratified lipidome, in accordance with the three main redox zones. There were many similarities between the two sample sets, for example the clusters associated with the oxic zone were in both years dominated by TAG lipids. The differences that were observed are probably attributable to the different distribution of sampling depths between the years (more sampling in of the oxic zone in 2017, more of the suboxic zone in 2013; Table 1), which led to a different clustering of depths. The similarity in the dominant components highlights the similarity in the Black Sea lipidome over time and hence the stability of the microbial niches in this system.
Conclusion
We used an untargeted UHPLC-HRMS data analysis approach to visualize components in the SPM from the Black Sea water column collected in June 2013. This revealed distinct clusters of known and unknown components, dominated by lipids, associated with specific depths. The approach allows for a rapid and unbiased view of the lipidome of an environment and for the identification of unknown lipids which potentially contain important ecological information. E.g., on (uncultivated) microbes. A second dataset from March 2017 provided similar results in the suboxic and euxinic zones. This rapid untargeted data visualization approach unlocks a hidden potential in UHPLC-HRMS data and provides a framework for further lipidomic method development which includes the utilization of MS/MS spectra (Ding et al., 2021).
Data Availability Statement
The raw data supporting the conclusions of this article will be made available by the authors, without undue reservation.
Author Contributions
NB and SD carried out the data analyses. NB wrote the manuscript. CB carried out the extractions and lipid analysis. EH initiated the research theme and oversaw the lipid identification. LV led 2017 sample collection and provided the ecological overview. MGIA and AH provided the methodological support. SS and JSSD supervised the study. All authors contributed to the article and approved the submitted version.
Funding
This project received funding to JSSD from the European Research Council (ERC) under the European Union’s Horizon 2020 Research and Innovation Program (grant agreement no. 694569, MICROLIPIDS) and from the SIAM Gravitation Grant (024.002.002) from the Dutch Ministry of Education, Culture and Science (OCW).
Conflict of Interest
The authors declare that the research was conducted in the absence of any commercial or financial relationships that could be construed as a potential conflict of interest.
Publisher’s Note
All claims expressed in this article are solely those of the authors and do not necessarily represent those of their affiliated organizations, or those of the publisher, the editors and the reviewers. Any product that may be evaluated in this article, or claim that may be made by its manufacturer, is not guaranteed or endorsed by the publisher.
Acknowledgments
We thank C. P. Slomp for the acquisition of funding of the PHOXY cruise and G. J. Reichart for leading it. We acknowledge the captains and crew of the R/V Pelagia. We thank P. Dorrestein’s Lab for advice and support using MZmine. We also thank P. Kraal and G. J. Reichart for discussions on the Black Sea water column, R. Airs for discussions on the mass spectrometry of carotenoids and D. Rush, S. Lengger, and D. Sahonero Canavesi for general discussions of lipid biomarkers. We are also very grateful to both the reviewers for suggesting constructive edits that improved the manuscript significantly.
Supplementary Material
The Supplementary Material for this article can be found online at: https://www.frontiersin.org/articles/10.3389/fmicb.2021.659302/full#supplementary-material
Supplementary Figure 1 | UHPLC-HRMS/MS spectra of unassigned components (A) I, (B) II, (C) III, and (D) IV. Mmu, milli mass unit. Δ mmu = (measured mass − calculated mass) × 1000.
Supplementary Figure 2 | Partial MS1 spectra of double charged components listed in Table 3.
References
Bale, N. J., Airs, R. L., and Llewellyn, C. A. (2011). Type I and Type II chlorophyll-a transformation products associated with algal senescence. Org. Geochem. 42, 451–464. doi: 10.1016/j.orggeochem.2011.03.016
Bale, N. J., Hopmans, E. C., Schoon, P. L., de Kluijver, A., Downing, J. A., Middelburg, J. J., et al. (2016). Impact of trophic state on the distribution of intact polar lipids in surface waters of lakes. Limnol. Oceanogr. 61, 1065–1077. doi: 10.1002/lno.10274
Bale, N. J., Koenen, M., Yadav, S., Hopmans, E. C., Villanueva, L., Sinninghe Damsté, J. S., et al. (2020). Diagnostic amide products of amino lipids detected in the microaerophilic bacteria Lutibacter during routine fatty acid analysis using gas chromatography. Organic Geochem. 144:104027. doi: 10.1016/j.orggeochem.2020.104027
Bale, N. J., Palatinszky, M., Rijpstra, W. I. C., Herbold, C. W., Wagner, M., and Sinninghe Damsté, J. S. (2019a). Membrane Lipid Composition of the Moderately Thermophilic Ammonia-Oxidizing Archaeon “Candidatus Nitrosotenuis uzonensis” at Different Growth Temperatures. Appl. Environ. Microbiol. 85, 1332–1319. doi: 10.1128/AEM.01332-19
Bale, N. J., Sorokin, D. Y., Hopmans, E. C., Koenen, M., Rijpstra, W. I. C., Villanueva, L., et al. (2019b). New insights into the polar lipid composition of extremely halo(alkali)philic euryarchaea from hypersaline lakes. Front. Microbiol. 10:377. doi: 10.3389/fmicb.2019.00377
Bauersachs, T., Compaore, J., Hopmans, E. C., Stal, L. J., Schouten, S., and Sinninghe Damsté, J. S. (2009). Distribution of heterocyst glycolipids in cyanobacteria. Phytochemistry 70, 2034–2039. doi: 10.1016/j.phytochem.2009.08.014
Becker, K. W., Collins, J. R., Durham, B. P., Groussman, R. D., White, A. E., Fredricks, H. F., et al. (2018a). Daily changes in phytoplankton lipidomes reveal mechanisms of energy storage in the open ocean. Nat. Commun. 9:5179. doi: 10.1038/s41467-018-07346-z
Becker, K. W., Elling, F. J., Schröder, J. M., Lipp, J. S., Goldhammer, T., Zabel, M., et al. (2018b). Isoprenoid Quinones Resolve the Stratification of Redox Processes in a Biogeochemical Continuum from the Photic Zone to Deep Anoxic Sediments of the Black Sea. Appl. Environ. Microbiol. 84, 2736–2717. doi: 10.1128/AEM.02736-17
Belt, S. T., Massé, G., Rowland, S. J., Poulin, M., Michel, C., and LeBlanc, B. (2007). A novel chemical fossil of palaeo sea ice: IP25. Organic Geochem. 38, 16–27. doi: 10.1016/j.orggeochem.2006.09.013
Blumenberg, M., Hoppert, M., Krüger, M., Dreier, A., and Thiel, V. (2012). Novel findings on hopanoid occurrences among sulfate reducing bacteria: Is there a direct link to nitrogen fixation? Organic Geochem. 49, 1–5. doi: 10.1016/j.orggeochem.2012.05.003
Bologa, A. S., Frangopol, P. T., Vedernikov, V. I., Stelmakh, L. V., Yunev, O. A., Yilmaz, A., et al. (1999). “Distribution of Planktonic Primary Production in the Black Sea,” in Environmental Degradation of the Black Sea: Challenges and Remedies NATO Science Series, eds S. T. Beşiktepe, Ü Ünlüata, and A. S. Bologa (Dordrecht: Springer Netherlands), 131–145. doi: 10.1007/978-94-011-4568-8_9
Bosak, T., Schubotz, F., Santiago-Torio, A., de, Kuehl, J. V., Carlson, H. K., et al. (2016). System-Wide Adaptations of Desulfovibrio alaskensis G20 to Phosphate-Limited Conditions. PLoS One 11:e0168719. doi: 10.1371/journal.pone.0168719
Brandsma, J., Hopmans, E. C., Brussaard, C. P. D., Witte, H. J., Schouten, S., and Sinninghe Damsté, J. S. (2012). Spatial distribution of intact polar lipids in North Sea surface waters: Relationship with environmental conditions and microbial community composition. Limnol. Oceanogr. 57, 959–973. doi: 10.4319/lo.2012.57.4.0959
Brett, M., and Müller−Navarra, D. (1997). The role of highly unsaturated fatty acids in aquatic foodweb processes. Freshw. Biol. 38, 483–499. doi: 10.1046/j.1365-2427.1997.00220.x
Brocks, J. J., Love, G. D., Summons, R. E., Knoll, A. H., Logan, G. A., and Bowden, S. A. (2005). Biomarker evidence for green and purple sulphur bacteria in a stratified Palaeoproterozoic sea. Nature 437, 866–870. doi: 10.1038/nature04068
Chambers, M. C., Maclean, B., Burke, R., Amodei, D., Ruderman, D. L., Neumann, S., et al. (2012). A cross-platform toolkit for mass spectrometry and proteomics. Nat. Biotechnol. 30, 918–920. doi: 10.1038/nbt.2377
Collins, J. R., Edwards, B. R., Fredricks, H. F., and Van Mooy, B. A. S. (2016). LOBSTAHS: An Adduct-Based Lipidomics Strategy for Discovery and Identification of Oxidative Stress Biomarkers. Anal. Chem. 88, 7154–7162. doi: 10.1021/acs.analchem.6b01260
Coolen, M. J. L., Abbas, B., van Bleijswijk, J., Hopmans, E. C., Kuypers, M. M. M., Wakeham, S. G., et al. (2007). Putative ammonia-oxidizing Crenarchaeota in suboxic waters of the Black Sea: a basin-wide ecological study using 16S ribosomal and functional genes and membrane lipids. Environ. Microbiol. 9, 1001–1016. doi: 10.1111/j.1462-2920.2006.01227.x
Cutignano, A., Luongo, E., Nuzzo, G., Pagano, D., Manzo, E., Sardo, A., et al. (2016). Profiling of complex lipids in marine microalgae by UHPLC/tandem mass spectrometry. Algal Res. 17, 348–358. doi: 10.1016/j.algal.2016.05.016
Cvejic, J. H., Bodrossy, L., Kovács, K. L., and Rohmer, M. (2000). Bacterial triterpenoids of the hopane series from the methanotrophic bacteria Methylocaldum spp.: Phylogenetic implications and first evidence for an unsaturated aminobacteriohopanepolyol. FEMS Microbiol. Lett. 182, 361–365. doi: 10.1016/S0378-1097(99)00610-2
Dembitsky, V. M. (1996). Betaine ether-linked glycerolipids: chemistry and biology. Prog. Lipid Res. 35, 1–51. doi: 10.1016/0163-7827(95)00009-7
Ding, S., Bale, N. J., Hopmans, E. C., Villanueva, L., Arts, M., Schouten, S., et al. (2021). Lipidomics of environmental microbial communities. II: Characterization using molecular networking and information theory. Front. Microbiol. 2021:659315. doi: 10.3389/fmicb.2021.659315
Ding, S., Lange, M., Lipp, J., Schwab, V. F., Chowdhury, S., Pollierer, M. M., et al. (2020). Characteristics and origin of intact polar lipids in soil organic matter. Soil Biol. Biochem. 151:108045. doi: 10.1016/j.soilbio.2020.108045
Elling, F. J., Könneke, M., Nicol, G. W., Stieglmeier, M., Bayer, B., Spieck, E., et al. (2017). Chemotaxonomic characterisation of the thaumarchaeal lipidome. Environ. Microbiol. 19, 2681–2700. doi: 10.1111/1462-2920.13759
Ertefai, T. F., Fisher, M. C., Fredricks, H. F., Lipp, J. S., Pearson, A., Birgel, D., et al. (2008). Vertical distribution of microbial lipids and functional genes in chemically distinct layers of a highly polluted meromictic lake. Org. Geochem. 39, 1572–1588. doi: 10.1016/j.orggeochem.2008.07.009
Gaskell, S. J., and Eglinton, G. (1976). Sterols of a contemporary lacustrine sediment. Geochim. Cosmochim. Acta 40, 1221–1228. doi: 10.1016/0016-7037(76)90157-5
Gibson, R. A., van der Meer, M. T. J., Hopmans, E. C., Reysenbach, A.-L., Schouten, S., and Sinninghe Damsté, J. S. (2013). Comparison of intact polar lipid with microbial community composition of vent deposits of the Rainbow and Lucky Strike hydrothermal fields. Geobiology 11, 72–85. doi: 10.1111/gbi.12017
Godchaux, W. III., and Leadbetter, E. R. (1980). Capnocytophaga spp. contain sulfonolipids that are novel in procaryotes. J. Bacteriol. 144, 592–602. doi: 10.1128/jb.144.2.592-602.1980
Grossi, V., Mollex, D., Vinçon-Laugier, A., Hakil, F., Pacton, M., and Cravo-Laureau, C. (2015). Mono- and Dialkyl Glycerol Ether Lipids in Anaerobic Bacteria: Biosynthetic Insights from the Mesophilic Sulfate Reducer Desulfatibacillum alkenivorans PF2803T. Appl. Environ. Microbiol. 81, 3157–3168. doi: 10.1128/AEM.03794-14
Guschina, I. A., and Harwood, J. L. (2009). “Algal lipids and effect of the environment on their biochemistry,” in Lipids in Aquatic Ecosystems, eds M. Kainz, M. T. Brett, and M. T. Arts (New York, NY: Springer), 1–24. doi: 10.1007/978-0-387-89366-2_1
Gutiérrez, M. H., Vera, J., Srain, B., Quiñones, R. A., Wörmer, L., Hinrichs, K.-U., et al. (2020). Biochemical fingerprints of marine fungi: implications for trophic and biogeochemical studies. Aquat. Microb. Ecol. 84, 75–90. doi: 10.3354/ame01927
Harvey, H. R., Fallon, R. D., and Patton, J. S. (1986). The effect of organic matter and oxygen on the degradation of bacterial membrane lipids in marine sediments. Geochim. Cosmochim. Acta 50, 795–804. doi: 10.1016/0016-7037(86)90355-8
Hay, B. J., Honjo, S., Kempe, S., Ittekkot, V. A., Degens, E. T., Konuk, T., et al. (1990). Interannual variability in particle flux in the southwestern Black Sea. Deep Sea Res. Part A Oceanogr. Res. Papers 37, 911–928. doi: 10.1016/0198-0149(90)90103-3
Heaver, S. L., Johnson, E. L., and Ley, R. E. (2018). Sphingolipids in host-microbial interactions. Curr Opin Microbiol. 43, 92–99. doi: 10.1016/j.mib.2017.12.011
Hölzl, G., and Dörmann, P. (2007). Structure and function of glycoglycerolipids in plants and bacteria. Prog. Lipid Res. 46, 225–243. doi: 10.1016/j.plipres.2007.05.001
Hopmans, E. C., Smit, N., Schwartz-Narbonne, R., Sinninghe Damsté, J. S., and Rush, D. (2021). Analysis of non-derivatized bacteriohopanepolyols using UHPLC-HRMS reveals great structural diversity in environmental lipid assemblages. Organic Geochem. [Preprint].
Hsu, F.-F., and Turk, J. (1999). Structural characterization of triacylglycerols as lithiated adducts by electrospray ionization mass spectrometry using low-energy collisionally activated dissociation on a triple stage quadrupole instrument. J. Am. Soc. Mass Spectromet. 10, 587–599. doi: 10.1016/S1044-0305(99)00035-5
Hunter, J. E., Frada, M. J., Fredricks, H. F., Vardi, A., and Van Mooy, B. A. S. (2015). Targeted and untargeted lipidomics of Emiliania huxleyi viral infection and life cycle phases highlights molecular biomarkers of infection, susceptibility, and ploidy. Front. Mar. Sci. 2:00081. doi: 10.3389/fmars.2015.00081
Kato, M., Sakai, M., Adachi, K., Ikemoto, H., and Sano, H. (1996). Distribution of betaine lipids in marine algae. Phytochemistry 42, 1341–1345. doi: 10.1016/0031-9422(96)00115-X
Koga, Y., Morii, H., Akagawa-Matsushita, M., and Ohga, M. (1998). Correlation of Polar Lipid Composition with 16S rRNA Phylogeny in Methanogens. Further Analysis of Lipid Component Parts. Biosci. Biotechnol. Biochem. 62, 230–236. doi: 10.1271/bbb.62.230
Koopmans, M. P., Köster, J., Van Kaam-Peters, H. M. E., Kenig, F., Schouten, S., Hartgers, W. A., et al. (1996). Diagenetic and catagenetic products of isorenieratene: Molecular indicators for photic zone anoxia. Geochim. Cosmochim. Acta 60, 4467–4496. doi: 10.1016/S0016-7037(96)00238-4
Kraal, P., Dijkstra, N., Behrends, T., and Slomp, C. P. (2017). Phosphorus burial in sediments of the sulfidic deep Black Sea: Key roles for adsorption by calcium carbonate and apatite authigenesis. Geochim. Cosmochim. Acta 204, 140–158. doi: 10.1016/j.gca.2017.01.042
Kuypers, M. M. M., Sliekers, A. O., Lavik, G., Schmid, M., Jørgensen, B. B., Kuenen, J. G., et al. (2003). Anaerobic ammonium oxidation by anammox bacteria in the Black Sea. Nature 422, 608–611. doi: 10.1038/nature01472
Li, X., He, Q., Hou, H., Zhang, S., Zhang, X., Zhang, Y., et al. (2018). Targeted lipidomics profiling of marine phospholipids from different resources by UPLC-Q-Exactive Orbitrap/MS approach. J. Chromatogr. B 1096, 107–112. doi: 10.1016/j.jchromb.2018.08.018
Li, Y., Lou, Y., Mu, T., Xu, J., Zhou, C., and Yan, X. (2017). Simultaneous structural identification of diacylglyceryl-N-trimethylhomoserine (DGTS) and diacylglycerylhydroxymethyl-N,N,N-trimethyl-β-alanine (DGTA) in microalgae using dual Li+/H+ adduct ion mode by ultra-performance liquid chromatography/quadrupole time-of-flight mass spectrometry. Rapid Communicat. Mass Spectrom. 31, 457–468. doi: 10.1002/rcm.7818
Liebisch, G., Vizcaíno, J. A., Köfeler, H., Trötzmüller, M., Griffiths, W. J., Schmitz, G., et al. (2013). Shorthand notation for lipid structures derived from mass spectrometry. J. Lipid Res. 54, 1523–1530. doi: 10.1194/jlr.M033506
Lipp, J. S., and Hinrichs, K.-U. (2009). Structural diversity and fate of intact polar lipids in marine sediments. Geochim. Cosmochim. Acta 73, 6816–6833. doi: 10.1016/j.gca.2009.08.003
Liu, X.-L., Lipp, J. S., Simpson, J. H., Lin, Y.-S., Summons, R. E., and Hinrichs, K.-U. (2012a). Mono- and dihydroxyl glycerol dibiphytanyl glycerol tetraethers in marine sediments: Identification of both core and intact polar lipid forms. Geochim. Cosmochim. Acta 89, 102–115. doi: 10.1016/j.gca.2012.04.053
Liu, X.-L., Summons, R. E., and Hinrichs, K.-U. (2012b). Extending the known range of glycerol ether lipids in the environment: structural assignments based on tandem mass spectral fragmentation patterns. Rapid Communicat. Mass Spectromet. 26, 2295–2302. doi: 10.1002/rcm.6355
Longo, W. M., Huang, Y., Yao, Y., Zhao, J., Giblin, A. E., Wang, X., et al. (2018). Widespread occurrence of distinct alkenones from Group I haptophytes in freshwater lakes: Implications for paleotemperature and paleoenvironmental reconstructions. Earth Planet. Sci. Lett. 492, 239–250. doi: 10.1016/j.epsl.2018.04.002
Louda, J. W., Li, J., Liu, L., Winfree, M. N., and Baker, E. W. (1998). Chlorophyll-a degradation during cellular senescence and death. Org. Geochem. 29, 1233–1251. doi: 10.1016/S0146-6380(98)00186-7
Louda, J. W., Liu, L., and Baker, E. W. (2002). Senescence- and death-related alteration of chlorophylls and carotenoids in marine phytoplankton. Org. Geochem. 33, 1635–1653. doi: 10.1016/s0146-6380(02)00106-7
Moncheva, S., Gotsis-Skretas, O., Pagou, K., and Krastev, A. (2001). Phytoplankton Blooms in Black Sea and Mediterranean Coastal Ecosystems Subjected to Anthropogenic Eutrophication: Similarities and Differences. Estuar. Coastal Shelf Sci. 53, 281–295. doi: 10.1006/ecss.2001.0767
Moore, E. K., Hopmans, E. C., Rijpstra, W. I. C., Villanueva, L., Dedysh, S. N., Kulichevskaya, I. S., et al. (2013). Novel Mono-, Di-, and Trimethylornithine Membrane Lipids in Northern Wetland Planctomycetes. Appl. Environ. Microbiol. 79, 6874–6884. doi: 10.1128/AEM.02169-13
Moore, E. K., Hopmans, E. C., Rijpstra, W. I. C., Villanueva, L., and Sinninghe Damsté, J. S. (2016). Elucidation and identification of amino acid containing membrane lipids using liquid chromatography/high-resolution mass spectrometry: LC/HRMS of amino acid containing membrane lipids. Rapid Communicat. Mass Spectromet. 30, 739–750. doi: 10.1002/rcm.7503
Murray, J. W., Lee, B.-S., Bullister, J., and Luther, G. W. (1999). “The Suboxic Zone of the Black Sea,” in Environmental Degradation of the Black Sea: Challenges and Remedies NATO Science Series, eds S. T. Beşiktepe, Ü Ünlüata, and A. S. Bologa (Dordrecht: Springer Netherlands), 75–91. doi: 10.1007/978-94-011-4568-8_6
Neretin, L. N., Abed, R. M. M., Schippers, A., Schubert, C. J., Kohls, K., and Kuypers, M. M. M. (2007). Inorganic carbon fixation by sulfate-reducing bacteria in the Black Sea water column. Environ. Microbiol. 9, 3019–3024. doi: 10.1111/j.1462-2920.2007.01413.x
Overmann, J., Cypionka, H., and Pfennig, N. (1992). An extremely low−light adapted phototrophic sulfur bacterium from the Black Sea. Limnol. Oceanogr. 37, 150–155. doi: 10.4319/LO.1992.37.1.0150
Pitcher, A., Hopmans, E. C., Mosier, A. C., Park, S.-J., Rhee, S.-K., Francis, C. A., et al. (2011). Core and intact polar glycerol dibiphytanyl glycerol tetraether lipids of ammonia-oxidizing archaea enriched from marine and estuarine sediments. Appl. Environ. Microbiol. 77, 3468–3477. doi: 10.1128/AEM.02758-10
Pluskal, T., Castillo, S., Villar-Briones, A., and Orešiè, M. (2010). MZmine 2: Modular framework for processing, visualizing, and analyzing mass spectrometry-based molecular profile data. BMC Bioinformatics 11:395. doi: 10.1186/1471-2105-11-395
Pluskal, T., Korf, A., Smirnov, A., Schmid, R., Fallon, T. R., Du, X., et al. (2020). “CHAPTER 7:Metabolomics Data Analysis Using MZmine,” in Processing Metabolomics and Proteomics Data with Open Software, ed. R. Winkler (London: ıRoyal Society of Chemistry).
Popendorf, K. J., Lomas, M. W., and Van Mooy, B. A. S. (2011). Microbial sources of intact polar diacylglycerolipids in the Western North Atlantic Ocean. Org. Geochem. 42, 803–811. doi: 10.1016/j.orggeochem.2011.05.003
Qin, W., Carlson, L. T., Armbrust, E. V., Devol, A. H., Moffett, J. W., Stahl, D. A., et al. (2015). Confounding effects of oxygen and temperature on the TEX86 signature of marine Thaumarchaeota. PNAS 112, 10979–10984. doi: 10.1073/pnas.1501568112
Repeta, D. J. (1993). A high resolution historical record of Holocene anoxygenic primary production in the Black Sea. Geochim. Cosmochim. Acta 57, 4337–4342. doi: 10.1016/0016-7037(93)90334-S
Repeta, D. J., and Simpson, D. J. (1991). The distribution and recycling of chlorophyll, bacteriochlorophyll and carotenoids in the Black Sea. Deep Sea Res. Part A Oceanogr. Res. Papers 38, S969–S984. doi: 10.1016/S0198-0149(10)80019-6
Repeta, D. J., Simpson, D. J., Jorgensen, B. B., and Jannasch, H. W. (1989). Evidence for anoxygenic photosynthesis from the distribution of bacteriochlorophylls in the Black Sea. Nature 342, 69–72. doi: 10.1038/342069a0
Rossel, P. E., Lipp, J. S., Fredricks, H. F., Arnds, J., Boetius, A., Elvert, M., et al. (2008). Intact polar lipids of anaerobic methanotrophic archaea and associated bacteria. Organic Geochem. 39, 992–999. doi: 10.1016/j.orggeochem.2008.02.021
Rush, D., and Sinninghe Damsté, J. S. (2017). Lipids as paleomarkers to constrain the marine nitrogen cycle. Environ. Microbiol. 19, 2119–2132. doi: 10.1111/1462-2920.13682
Rush, D., Osborne, K. A., Birgel, D., Kappler, A., Hirayama, H., Peckmann, J., et al. (2016). The Bacteriohopanepolyol Inventory of Novel Aerobic Methane Oxidising Bacteria Reveals New Biomarker Signatures of Aerobic Methanotrophy in Marine Systems. PLoS One 11:e0165635. doi: 10.1371/journal.pone.0165635
Saleem, A., Bell, M. A., Kimpe, L. E., Korosi, J. B., Arnason, J. T., and Blais, J. M. (2019). Identifying novel treeline biomarkers in lake sediments using an untargeted screening approach. Sci. Tot. Environ. 694:133684. doi: 10.1016/j.scitotenv.2019.133684
Schouten, S., Hopmans, E. C., and Sinninghe Damsté, J. S. (2013). The organic geochemistry of glycerol dialkyl glycerol tetraether lipids: A review. Org. Geochem. 54, 19–61. doi: 10.1016/j.orggeochem.2012.09.006
Schouten, S., Hopmans, E. C., Baas, M., Boumann, H., Standfest, S., Koenneke, M., et al. (2008). Intact membrane lipids of “Candidatus Nitrosopumilus maritimus,” a cultivated representative of the cosmopolitan mesophilic group I crenarchaeota. Appl. Environ. Microbiol. 74, 2433–2440. doi: 10.1128/AEM.01709-07
Schubotz, F., Wakeham, S. G., Lipp, J. S., Fredricks, H. F., and Hinrichs, K.-U. (2009). Detection of microbial biomass by intact polar membrane lipid analysis in the water column and surface sediments of the Black Sea. Environ. Microbiol. 11, 2720–2734. doi: 10.1111/j.1462-2920.2009.01999.x
Schubotz, F., Xie, S., Lipp, J. S., Hinrichs, K.-U., and Wakeham, S. G. (2018). Intact polar lipids in the water column of the eastern tropical North Pacific: abundance and structural variety of non-phosphorus lipids. Biogeosciences 15, 6481–6501. doi: 10.5194/bg-15-6481-2018
Sinninghe Damsté, J. S., Rijpstra, W. I. C., Hopmans, E. C., Prahl, F. G., Wakeham, S. G., and Schouten, S. (2002a). Distribution of Membrane Lipids of Planktonic Crenarchaeota in the Arabian Sea. Appl. Environ. Microbiol. 68, 2997–3002. doi: 10.1128/AEM.68.6.2997-3002.2002
Sinninghe Damsté, J. S., Schouten, S., and van Duin, A. C. T. (2001). Isorenieratene derivatives in sediments: possible controls on their distribution. Geochim. Cosmochim. Acta 65, 1557–1571. doi: 10.1016/S0016-7037(01)00549-X
Sinninghe Damsté, J. S., Schouten, S., Hopmans, E. C., van Duin, A. C. T., and Geenevasen, J. A. J. (2002b). Crenarchaeol: the characteristic core glycerol dibiphytanyl glycerol tetraether membrane lipid of cosmopolitan pelagic crenarchaeota. J. Lipid Res. 43, 1641–1651.
Sollai, M., Villanueva, L., Hopmans, E. C., Reichart, G.-J., and Sinninghe Damsté, J. S. (2018). A combined lipidomic and 16S rRNA gene amplicon sequencing approach reveals archaeal sources of intact polar lipids in the stratified Black Sea water column. Geobiology 17, 91–109. doi: 10.1111/gbi.12316
Sturt, H. F., Summons, R. E., Smith, K., Elvert, M., and Hinrichs, K. U. (2004). Intact polar membrane lipids in prokaryotes and sediments deciphered by high-performance liquid chromatography/electrospray ionization multistage mass spectrometry - new biomarkers for biogeochemistry and microbial ecology. Rapid Commun. Mass Spectrom. 18, 617–628. doi: 10.1002/rcm.1378
Summons, R. E., Thomas, J., Maxwell, J. R., and Boreham, C. J. (1992). Secular and environmental constraints on the occurrence of dinosterane in sediments. Geochim. Cosmochim. Acta 56, 2437–2444. doi: 10.1016/0016-7037(92)90200-3
Talbot, H. M., Handley, L., Spencer-Jones, C. L., Bienvenu, D. J., Schefuß, E., Mann, P. J., et al. (2014). Variability in aerobic methane oxidation over the past 1.2 Myrs recorded in microbial biomarker signatures from Congo fan sediments. Geochim. Cosmochim. Acta 133, 387–401. doi: 10.1016/j.gca.2014.02.035
Van Mooy, B. A. S., and Fredricks, H. F. (2010). Bacterial and eukaryotic intact polar lipids in the eastern subtropical South Pacific: Water-column distribution, planktonic sources, and fatty acid composition. Geochim. Cosmochim. Acta 74, 6499–6516. doi: 10.1016/j.gca.2010.08.026
Villanueva, L., Damsté, J. S. S., and Schouten, S. (2014). A re-evaluation of the archaeal membrane lipid biosynthetic pathway. Nat. Rev. Microbiol. 12, 438–448. doi: 10.1038/nrmicro3260
Wakeham, S. G. (1985). Wax esters and triacylglycerols in sinking particulate matter in the Peru upwelling area (15°S, 75°W). Mar. Chem. 17, 213–235. doi: 10.1016/0304-4203(85)90012-X
Wakeham, S. G., Amann, R., Freeman, K. H., Hopmans, E. C., Jørgensen, B. B., Putnam, I. F., et al. (2007). Microbial ecology of the stratified water column of the Black Sea as revealed by a comprehensive biomarker study. Organic Geochem. 38, 2070–2097. doi: 10.1016/j.orggeochem.2007.08.003
Wakeham, S. G., Lewis, C. M., Hopmans, E. C., Schouten, S., and Sinninghe Damsté, J. S. (2003). Archaea mediate anaerobic oxidation of methane in deep euxinic waters of the Black Sea. Geochim. Cosmochim. Acta 67, 1359–1374. doi: 10.1016/S0016-7037(02)01220-6
Ward, J. H. (1963). Hierarchical Grouping to Optimize an Objective Function. J. Am. Statist. Associat. 58, 236–244. doi: 10.1080/01621459.1963.10500845
White, D. C., Davis, W. M., Nickels, J. S., King, J. D., and Bobbie, R. J. (1979). Determination of the sedimentary microbial biomass by extractible lipid phosphate. Oecologia 40, 51–62. doi: 10.1007/BF00388810
Wörmer, L., Lipp, J. S., Schröder, J. M., and Hinrichs, K.-U. (2013). Application of two new LC–ESI–MS methods for improved detection of intact polar lipids (IPLs) in environmental samples. Organic Geochem. 59, 10–21. doi: 10.1016/j.orggeochem.2013.03.004
Yadav, S., Villanueva, L., Bale, N., Koenen, M., Hopmans, E. C., and Damsté, J. S. S. (2020). Physiological, chemotaxonomic and genomic characterization of two novel piezotolerant bacteria of the family Marinifilaceae isolated from sulfidic waters of the Black Sea. Systemat. Appl. Microbiol. 43:126122. doi: 10.1016/j.syapm.2020.126122
Yoshinaga, M. Y., Lazar, C. S., Elvert, M., Lin, Y.-S., Zhu, C., Heuer, V. B., et al. (2015). Possible roles of uncultured archaea in carbon cycling in methane-seep sediments. Geochim. Cosmochim. Acta 164, 35–52. doi: 10.1016/j.gca.2015.05.003
Zeng, J., Liu, S., Cai, W., Jiang, H., Lu, X., Li, G., et al. (2019). Emerging lipidome patterns associated with marine Emiliania huxleyi-virus model system. Sci. Tot. Environ. 688, 521–528. doi: 10.1016/j.scitotenv.2019.06.284
Zhu, C., Meador, T. B., Dummann, W., and Hinrichs, K.-U. (2014a). Identification of unusual butanetriol dialkyl glycerol tetraether and pentanetriol dialkyl glycerol tetraether lipids in marine sediments. Rapid Communicat. Mass Spectromet. 28, 332–338. doi: 10.1002/rcm.6792
Keywords: lipids, liquid chromatography mass spectrometry, lipidome, lipidomics, MZmine, Black Sea
Citation: Bale NJ, Ding S, Hopmans EC, Arts MGI, Villanueva L, Boschman C, Haas AF, Schouten S and Sinninghe Damsté JS (2021) Lipidomics of Environmental Microbial Communities. I: Visualization of Component Distributions Using Untargeted Analysis of High-Resolution Mass Spectrometry Data. Front. Microbiol. 12:659302. doi: 10.3389/fmicb.2021.659302
Received: 27 January 2021; Accepted: 18 June 2021;
Published: 23 July 2021.
Edited by:
Marcelino T. Suzuki, Sorbonne Universités, FranceReviewed by:
Florence Schubotz, University of Bremen, GermanyH. Rodger Harvey, Old Dominion University, United States
Copyright © 2021 Bale, Ding, Hopmans, Arts, Villanueva, Boschman, Haas, Schouten and Sinninghe Damsté. This is an open-access article distributed under the terms of the Creative Commons Attribution License (CC BY). The use, distribution or reproduction in other forums is permitted, provided the original author(s) and the copyright owner(s) are credited and that the original publication in this journal is cited, in accordance with accepted academic practice. No use, distribution or reproduction is permitted which does not comply with these terms.
*Correspondence: Nicole J. Bale, bmljb2xlLmJhbGVAbmlvei5ubA==