 Mengmeng Wang1,2†Qinghua Liu1,2†Xingxing Kang3
 Zuobin Zhu4
 Huan Yang5Xiangyu Xi6Xiao Zhang3Yan Du1,2Mengzhe Guo1,2
 Daoquan Tang1,2*
 Liang Wang1,3*
- 1Jiangsu Key Laboratory of New Drug Research and Clinical Pharmacy, School of Pharmacy, Xuzhou Medical University, Xuzhou, China
- 2Department of Pharmaceutical Analysis, School of Pharmacy, Xuzhou Medical University, Xuzhou, China
- 3Department of Bioinformatics, School of Medical Informatics and Engineering, Xuzhou Medical University, Xuzhou, China
- 4Department of Genetics, School of Life Sciences, Xuzhou Medical University, Xuzhou, China
- 5School of Laboratory Medicine, Xuzhou Medical University, Xuzhou, China
- 6Xuzhou Infectious Disease Hospital, Xuzhou, China
Glycogen is a highly branched polysaccharide that is widely present in all life domains. It has been identified in many bacterial species and functions as an important energy storage compound. In addition, it plays important roles in bacterial transmission, pathogenicity, and environmental viability. There are five essential enzymes (coding genes) directly involved in bacterial glycogen metabolism, which forms a single operon glgBXCAP with a suboperonic promoter in glgC gene in Escherichia coli. Currently, there is no comparative study of how the disruptions of the five glycogen metabolism genes influence bacterial phenotypes, such as growth rate, biofilm formation, and environmental survival, etc. In this study, we systematically and comparatively studied five E. coli single-gene mutants (ΔglgC, ΔglgA, ΔglgB, ΔglgP, ΔglgX) in terms of glycogen metabolism and explored their phenotype changes with a focus on environmental stress endurance, such as nutrient deprivation, low temperature, desiccation, and oxidation, etc. Biofilm formation in wild-type and mutant strains was also compared. E. coli wild-type stores the highest glycogen content after around 20-h culture while disruption of degradation genes (glgP, glgX) leads to continuous accumulation of glycogen. However, glycogen primary structure was abnormally changed in ΔglgP and ΔglgX. Meanwhile, increased accumulation of glycogen facilitates the growth of E. coli mutants but reduces glucose consumption in liquid culture and vice versa. Glycogen metabolism disruption also significantly and consistently increases biofilm formation in all the mutants. As for environmental stress endurance, glycogen over-accumulating mutants have enhanced starvation viability and reduced desiccation viability while all mutants showed decreased survival rate at low temperature. No consistent results were found for oxidative stress resistance in terms of glycogen metabolism disruptions, though ΔglgA shows highest resistance toward oxidation with unknown mechanisms. In sum, single gene disruptions in glgBXCAP operon significantly influence bacterial growth and glucose consumption during culture. Accumulation and structure of intracellular glycogen were also significantly altered. In addition, we observed significant changes in E. coli environmental viabilities due to the deletions of certain genes in the operon. Further investigations shall be focused on the molecular mechanisms behind these phenotype changes.
Introduction
Glycogen is a homogeneous polysaccharide with a typical feature of a highly and randomly branched structure, which is widely spread across the domains of life (Wang and Wise, 2011; Wang et al., 2020). It consists of glucosyl residues that are linked together by α-1,4-glycosidic bonds in linear chains and α-1,6-glycosidic bonds at branching points, together with a small but significant amount of proteins (Wang et al., 2019). Glycogen structure is generally divided into three levels: small γ particles (∼3 nm), spherical β particles (∼20 nm in diameter), and rosette-shaped α particles (up to 300 nm in diameter). α particles are formed by the aggregation of β particles (Wang and Wise, 2019; Liu et al., 2020). Previously, it was thought that only β particles existed in bacteria while α particles were exclusively present in higher organisms, until recently α particles were also observed in Streptomyces venezuelae and characterized in Escherichia coli (Wang and Wise, 2019; Wang et al., 2019). Some studies reported that the larger glycogen α particles were degraded more slowly than the smaller β particles (Jiang et al., 2016). In addition, chain length distribution patterns of glycogen β particles have also been reported to influence degradation rate (Wang and Wise, 2011). However, formation mechanisms of α particles and determinants of chain length distribution patterns in both prokaryotes and eukaryotes are not completely resolved yet and require further investigation.
Glycogen plays versatile roles in bacteria (Wilson et al., 2010). In some of the prominent pathogens such as E. coli (Jones et al., 2008), Salmonella enteritis (Bonafonte et al., 2000), Mycobacterium tuberculosis (Sambou et al., 2008), and Vibrio cholerae (Bourassa and Camilli, 2009), glycogen accumulation has been linked with colonization and/or pathogenicity (Park, 2015). In addition, several studies also support the roles of glycogen in host-pathogen interactions (Gehre et al., 2016). The major function of glycogen in bacteria is energy reserve, which has been confirmed to promote bacterial environmental survival under starvation conditions (Strange, 1968). Glycogen accumulation also facilitates bacterial viability under abiotic stresses such as low temperature, desiccation, and osmotic pressure, etc. (Seibold and Eikmanns, 2007; Dalmasso et al., 2012; Wang et al., 2015). According to the Sit-and-Wait (S&W) hypothesis, prolonged environmental survival could be positively correlated with pathogen evolution toward higher virulence because it increases the opportunity for pathogen to infect susceptible individuals with less dependence on infected hosts, hence less fitness costs (Walther and Ewald, 2004; Wang et al., 2017). A study on V. cholerae strongly supported the hypothesis, which showed that accumulated intracellular glycogen facilitated environmental persistence and transmission of V. cholerae between aquatic environment and hosts; meanwhile, glycogen-rich V. cholerae are more virulent than the glycogen-deficient counterpart (Bourassa and Camilli, 2009). Thus, glycogen as an energy reserve, could also contribute to the evolution of bacterial virulence.
The metabolism of glycogen has been extensively studied in a variety of bacteria. The genome-wide screening of genes affecting glycogen metabolism through 3985 single-gene knockout mutants (the Keio collection) revealed that 65 genes were involved in the glycogen accumulation in E. coli (Eydallin et al., 2007b). In addition, screening of genes with enhanced expression in E. coli through ASKA library identified 86 genes responsible for glycogen accumulation (Eydallin et al., 2010). Thus, bacterial glycogen metabolism is a sophisticatedly interacted and regulated network that involves multiple genes and pathways (Wilson et al., 2010). Among these genes, five have been considered as the most important in glycogen metabolism, which are glgC [glucose-1-phosphate adenylyltransferase (AGPase)], glgA [glycogen synthase (GS)], glgB [glycogen branching enzyme (GBE)], glgP [glycogen phosphorylase (GP)], and glgX [glycogen debranching enzyme (GDE)] (Wang and Wise, 2011). The five genes are located in a single operon glgBXCAP in E. coli with a sub-operon inside glgC gene, the encoded enzymes of which form the classical glycogen metabolism pathway (Montero et al., 2010). In particular, AGPase, GS, and GBE are responsible for glycogen biosynthesis while GP and GDE contribute to glycogen degradation.
Previous studies have investigated the influences of single gene mutants in the glycogen metabolism pathway on glycogen accumulation, glycogen structure, environmental persistence, and biofilm formation in different bacterial species, such as Azospirillum brasilense, V. cholera, and Corynebacterium glutamicum, etc. (Jackson et al., 2002b; Seibold and Eikmanns, 2007; Bourassa and Camilli, 2009; Lerner et al., 2009). Single gene knock-out mutants in E. coli glgBXCAP operon have also been explored with a focus on the alteration of glycogen accumulation and structure in different studies with non-consistent conditions (Dauvilleìe et al., 2005; Alonso-Casajuìs et al., 2006; Eydallin et al., 2007a; Park et al., 2011; Wang et al., 2015). A recent study comprehensively analyzed the genome-wide phenotypes of growth, cell morphogenesis, and cell cycle events in E. coli by using Keio library, which may facilitate our understanding of the influences of glycogen metabolism related genes on E. coli physiology (Campos et al., 2018). However, there is currently a lack of comparative study of how E. coli genes in glgBXCAP operon functions in terms of glucose consumption, glycogen accumulation and structure, biofilm formation, and environmental stress endurance. In this study, we systematically investigated the gene functions of glgC, glgA, glgB, glgP, and glgX in E. coli BW25113 mutants in terms of glycogen metabolism and bacterial physiology with standardized 1 × M9 minimal medium, which were also compared with wide-type strains E. coli BL21(DE3) and E. coli BW25113. In sum, this study provides a better understanding of glycogen functions in bacterial physiology through phenotypic characterization.
Materials and Methods
E. coli Strains and Growth Conditions
All the five E. coli mutants used in this study, ΔglgA, ΔglgB, ΔglgC, ΔglgP, and ΔglgX, together with the wide-type parent strain BW25113, were purchased from Horizon Discovery Ltd. (California, United States) as a whole package of the commercial Keio Collection, a systematic, single-gene knockout mutant collection of E. coli non-essential genes via λ-Red Recombination System (plasmids pKD4, pKD46, pCP20). Wild-type strain BL21(DE3) was purchased from Tiangen Biotech Co. (Beijing, China). The presence and absence of the five genes (glgA, glgB, glgC, glgP, and glgX) in the purchased wild-type and mutated E. coli strains were confirmed via PCR. For the results of agarose gel electrophoresis, please refer to Supplementary Figure 1. All the primers used for PCR reactions were present in Supplementary Table 1. 1 × M9 minimal medium with 6.78 g/L Na2HPO4, 3 g/L KH2PO4, 1 g/L NH4Cl, and 0.5 g/L NaCl (Sigma-Aldrich) supplemented with 0.2, 0.4, 0.8, and 1.6% glucose (Sigma-Aldrich) was used for E. coli culture, respectively. Liquid and solid Luria-Bertani (LB) media (Tiangen Biotech Co., Beijing, China) were also used for bacterial recovery from −80°C freezer and biofilm formation assay. Phosphate-buffered saline (PBS buffer, Sigma-Aldrich) was used for environmental stress endurance assay. All the strains were cultured at 37°C with shaking rate at 220 rpm when needed, until otherwise specified.
Growth Curves and Glucose Consumptions
Growth Curves
A single colony of BL21(DE3) was picked from LB agar plate and cultured in 5 ml LB broth for 5 h (37°C, 220 rpm). 1 × M9 minimal medium supplemented with 0.2, 0.4, 0.8, and 1.6% glucose was inoculated with the starting culture at 1:20 ratio and cultured at 37°C with shaking rate at 220 rpm, respectively. At selected time points of 2, 4, 6, 8, 10, 12, 16, 18, 20, and 24 h, OD600 values were measured and recorded by spectrophotometer (Thermo Fisher Scientific). OD600 readings, together with error bars, were drawn by correlating with corresponding time points for growth curves. For each time point, three independent replicates were repeated. As for the growth curves of the seven strains, that is, BL21(DE3), BW25113, ΔglgC, ΔglgA, ΔglgB, ΔglgP, and ΔglgX, cultured in 1 × M9 minimal medium supplemented with 0.8% glucose, the same procedure described above was followed.
Glucose Consumptions
In order to explore the glucose consumption amount in different cultures by different E. coli strains, we first measure the glucose content in wide-type BL21(DE3) 1 × M9 culture supplemented with 0.2, 0.4, 0.6, and 0.8% glucose at 0, 4, 6, 10, 12, 14, 16, 18, 20, and 24 h through GOPOD assay kit (Megazyme, Ireland) according to the manufacturer’s instructions. 1 × M9 minimal medium with 0.8% glucose was then used as a standard culture, in which the glucose consumption amount for all the seven strains was measured by following the growth curves. All the experiments were repeated independently for three times.
Glycogen Quantification, Isolation, and Purification
Glycogen content was assayed for BL21(DE3) along growth curves at 4, 6, 10, 14, 16, 18, 20, and 24 h in 1 × M9 minimal medium supplemented with 0.2, 0.4, 0.8, and 1.6% glucose. As for BW25113 and the five single gene mutated strains, glycogen content and protein amount were assayed at the same time points supplemented with 0.8% glucose only. Three independent replicates were used for each measurement. For glycogen isolation and purification, sucrose gradient density ultracentrifugation (SGDU) was used. All the procedures were followed as previously described (Wang et al., 2015, 2019).
Glycogen Primary Structure Characterization
Fluorophore-assisted carbohydrate electrophoresis (FACE) was used for characterizing glycogen primary structure (chain length distribution). In particular, 200 unit/mg isoamylase (Megazyme, Ireland) was used to break down all α-1,6-glycosidic branching points in glycogen, which were then labeled with APTS (8-aminopyrene-1,3,6-trisulfonate). The distributions of the number of chains as a function of the degree of polymerization X of that chain after debranching, Nde(X) were measured by standard FACE method. For details, please refer to Wang et al. (2019). The average chain length (ACL) of glycogen was computed by following the previously reported formula (Wang et al., 2015).
Biofilm Formation Assay
A single bacterial colony was picked up from LB agar to inoculate 5 ml LB broth, which was then cultured at 37°C overnight with 220 rpm shaking rate. 100 μl of the LB broth was inoculated into 10 ml 1 × M9 minimal medium (0.8% glucose) and LB broth, respectively. Each diluted culture was aliquoted to a 96-well microplate (Greiner CELLSTAR® 96 well plates, polystyrene, flat bottom with lid, sterile) with 200 μl/well. Sterile media were added as blank control, correspondingly. The 96-well microplate was cultured statically at 30°C for 20 h. After that, liquid waste was discarded, and planktonic cells were washed out with distilled water for three times. Then, 200 μl 0.1% crystal violet was pipetted into each well, including blank control, for 10 min staining. After that, crystal violet liquid was shaken out of the plate over the waste tray and all plates were washed for three times with distilled water. Finally, all plates were air-dried. 200 μl of 20%/80% ethanol/acetone solution was added to each well for dissolving crystal violet in biofilm for 10 min, 150 μl of which at each well was transferred to a new 96-well plate and OD590 value was read and recorded in spectrophotometer.
Assays for Environmental Stress Resistance
Starvation Viability Assay
A single bacterial colony was picked up from LB agar plate for inoculating 5 ml LB medium at 37°C with 220 rpm shaking rate, which was then used to inoculate 100 ml 1 × M9 medium supplemented with 0.8% glucose. The inoculated culture was incubated for 20 h (37°C, 220 rpm), centrifuged at 6000 × g for 10 min, and the harvested cells were washed three times with PBS buffer. Cells were then re-suspended in 1 ml PBS buffer, and placed on benchtop at room temperature for 0, 2, 4, 6, 8, 10, and 12 day. The number of viable cells for each time point was calculated via the Miles and Misra method (Miles et al., 2009). All the experiments were independently repeated three times for each strain.
Low Temperature Viability Assay
For each studied strain, a single bacterial colony was picked up from LB agar plate for inoculating 5 ml LB medium at 37°C with 220 rpm shaking rate, which was then used to inoculate 100 ml 1 × M9 medium supplemented with 0.8% glucose. After the inoculated culture was incubated for 20 h (37°C, 220 rpm), it was dispended into 1.5 ml Eppendorf tubes with 1 ml/tube and store at 4°C. At day 0, 3, 6, and 9, the suspension was serially and aseptically diluted in a hood by mixing 100 μl diluted culture with 900 μl PBS buffer. For each dilution, Miles and Misra method was used and three replicates were used (Miles et al., 2009). After inoculating, the plate was left in hood to air-dry aseptically, which generally took 20–30 min. When plates were completely dry, plates were incubated at 37°C for 24 h and emerged colonies were counted. The number of viable cells in original culture could then be calculated. As for low temperature viability coupled with starvation viability assay, all the procedures were the same as described above except that after the inoculated culture was incubated for 20 h (37°C, 220 rpm), it was then centrifuged at 6000 × g for 10 min, and the harvested cells were washed three times and resuspended in PBS buffer.
Desiccation Resistance Assay
Bacterial cell culture was prepared as described in section “Starvation Viability Assay.” After cells were resuspended in 100 ul PBS buffer, 15 μl of concentrated bacterial solution was added to sterilized petri dish for air-dry inside hood. At 0, 1, 3, and 6 h, dried cells were re-suspended in 1.5 ml PBS buffer and continuously diluted from 10–2 to 10–6. For each dilution, 10 μl of the diluent was taken and dropped onto LB agar plate, which was incubate at 37°C for 24 h. The number of bacterial colonies was counted, and the number of viable cells in original culture was calculated as stated in section “Low Temperature Viability Assay.” The experiments were repeated three times for each strain.
Oxidative Stress Resistance Assay
Cells were prepared in the same way as for starvation viability assay. After cultured for 20 h, 2 ml of bacterial solution was mixed with 18 ml LB broth containing 0.8% agarose agar and 1 × M9 minimal medium (0.8% glucose) containing 0.8% agarose agar for agar plate, respectively. 10 μl of 6.6 mol/L H2O2 was added onto a 6 mm sterilized round filter paper, which was then placed in the center of the agar plate. After culturing the plate statically at 37°C for 24 h, diameter of bacteriostatic ring from three different angles was measured and recorded. For each strain, the experiment was repeated independently three times.
Statistical Analysis
A two-tailed unequal variance Student t-test was calculated for pairwise comparison wherever applicable, unless otherwise instructed. Significant difference is denoted with asterisk(s) when the P-value was less than 0.05 (∗, P < 0.05; ∗∗, P < 0.01; ∗∗∗, P < 0.001). The single-step multiple comparison procedure and statistical test, Tukey’s Honestly Significant Difference (HSD) test, was performed for biofilm formation ability and oxidative stress resistance ability among wild-type and mutated strains, which compared the means of every group to the means of every other group simultaneously. Means denoted by a different letter indicated significant differences between groups (P < 0.05).
Results
Growth Curves
Previous studies have already shown that glucose concentration is important in determining bacterial growth and glycogen accumulation (Wang et al., 2018). There are a variety of culture media used for studying glycogen metabolism and accumulation in E. coli, which involves the supplementation of complex trace elements and different concentrations of glucose (Wang et al., 2018). In this study, we checked the influence of 1 × M9 minimal medium supplemented with 0.2, 0.4, 0.8, and 1.6% glucose on the growth of E. coli BL21(DE3). The results showed that the bacterium had a similar growth curve when cultured in 1 × M9 minimal medium with 0.8 and 1.6% glucose. In contrast, OD600 value decreased more rapidly after entering into stationary phase in 1 × M9 minimal medium with 0.2 and 0.4% glucose (Figure 1A). It is also noteworthy that due to the limited nutrients in the minimal medium, the overall OD600 values were comparatively lower than LB broth cultures (Wang et al., 2015). Two-tailed unequal variance Student’s t-test showed that no significant differences could be detected among all the growth curves through pair-wise comparisons in terms of overall growth trend (P > 0.05). However, by comparing OD600 values at each time point, statistical significance could be detected from 16 h. In particular, at 24 h, the OD600 value of BL21(DE3) in 1 × M9 minimal medium with 0.2% glucose was significantly lower than OD600 values of BL21(DE3) growing in other three media (P < 0.01) while OD600 values of BL21(DE3) in 1 × M9 minimal medium with 0.4% glucose were significantly lower than OD600 values of BL21(DE3) growing in 1 × M9 minimal medium with 0.8 and 1.6% glucose (P < 0.05). No significant difference was detected between OD600 values of BL21(DE3) growing in 1 × M9 minimal medium with 0.8 and 1.6% glucose. Thus, glucose concentration in the culture media has direct impact on E. coli growth pattern.
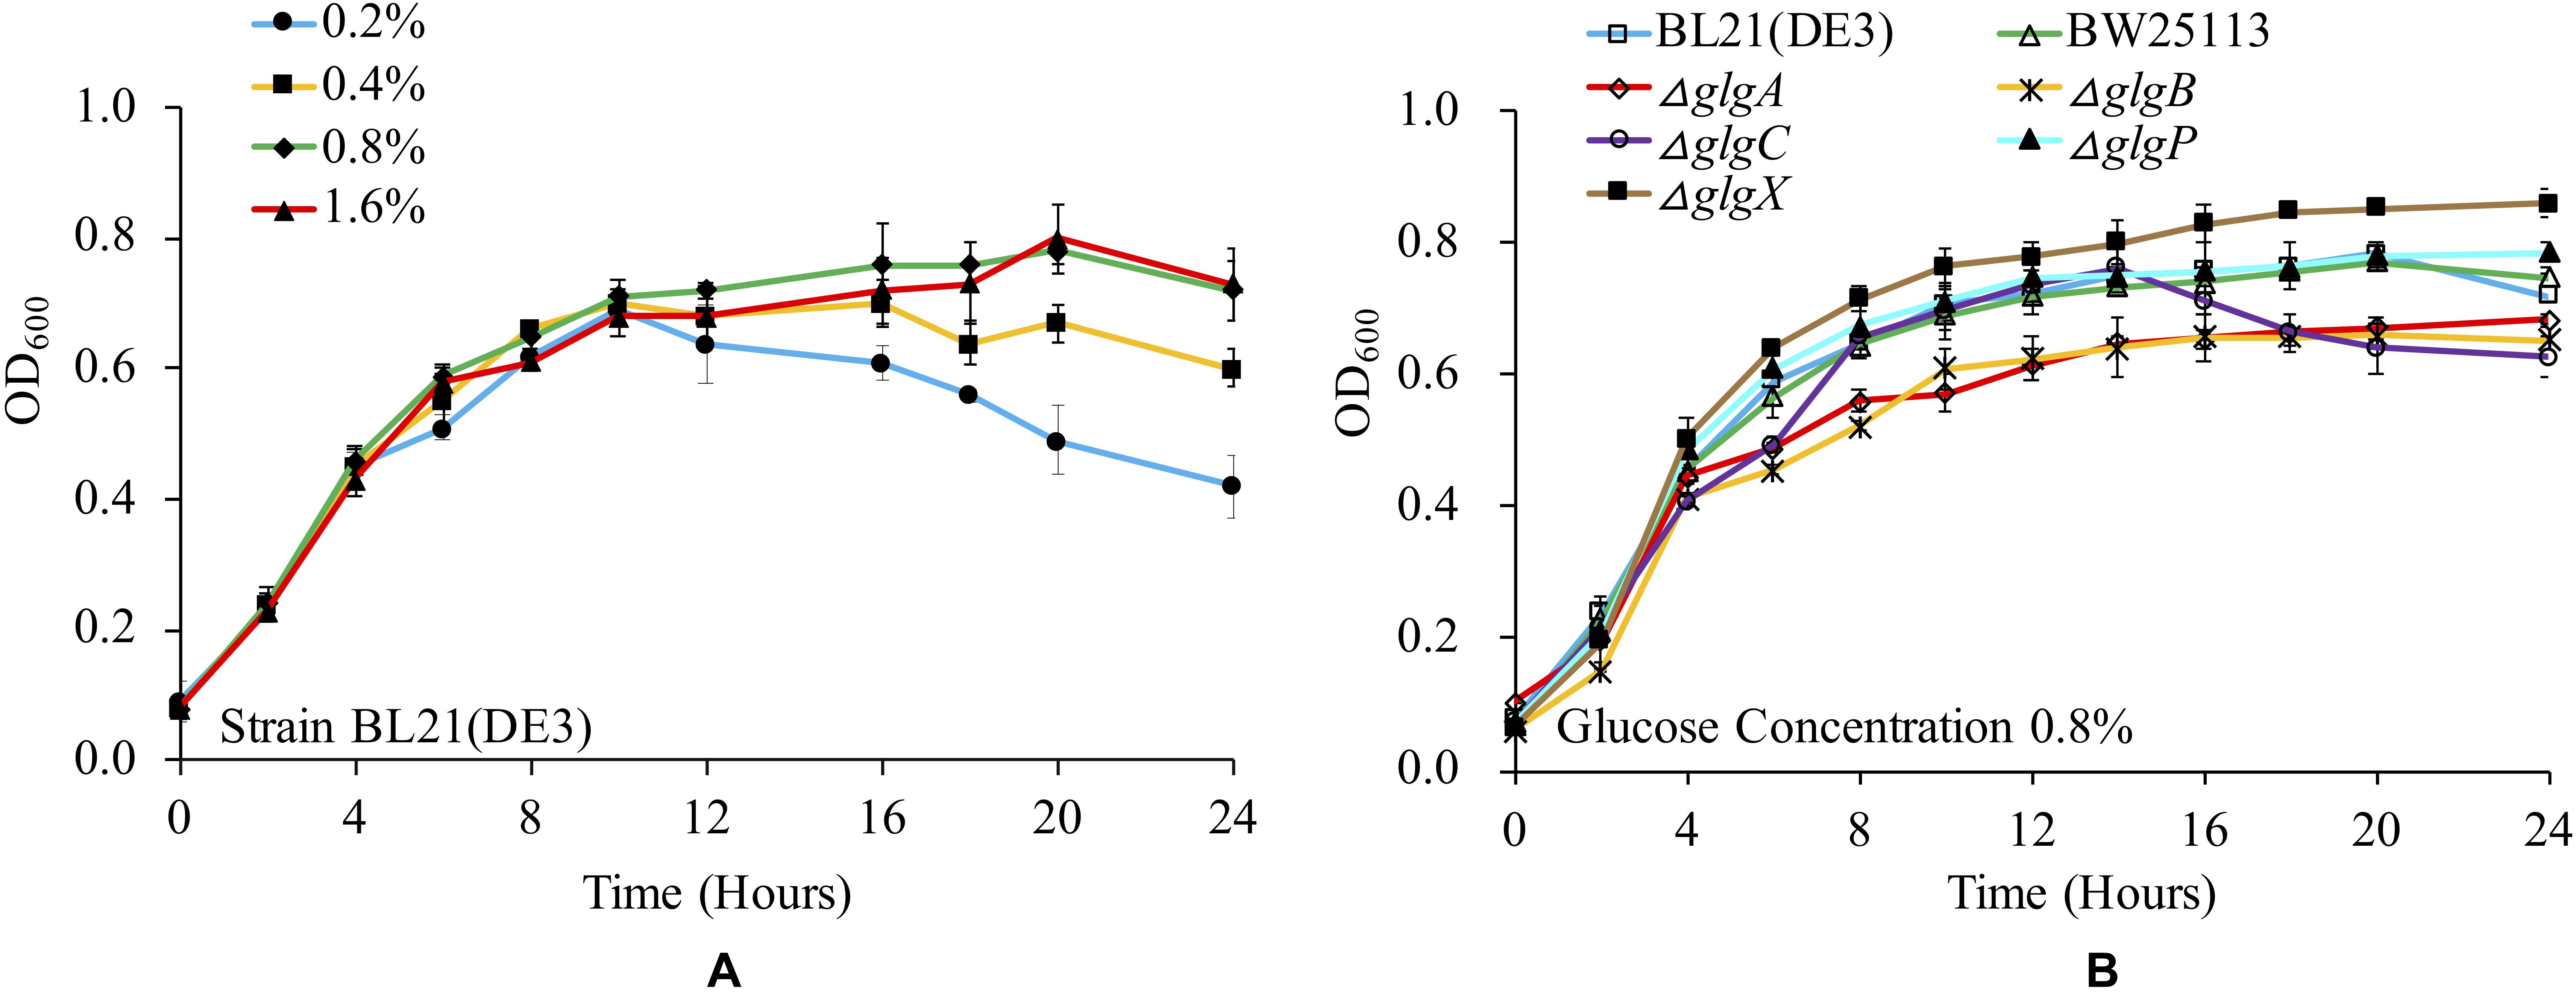
Figure 1. Medium- and strain-dependent E. coli growth curves. (A) Influences of glucose concentrations in 1 × M9 minimal medium on E. coli BL21(DE3) growth. (B) Comparison of growth curves of wild-type and mutated E. coli strains in 1 × M9 minimal medium supplemented with 0.8% glucose.
We then cultured wild-type strains BL21(DE3) and BW25113, together with the other five single-gene mutants (ΔglgC, ΔglgA, ΔglgB, ΔglgP, and ΔglgX) in 1 × M9 minimal medium supplemented with 0.8% glucose, and compared their growth curves (Figure 1B). According to the results, all the strains have similar growth trends. However, two mutants, ΔglgP and ΔglgX, reached higher OD600 values at 24 h than other strains, where ΔglgX had the highest OD600 value. Student’s t-test also showed that there was a significant difference between the two strains at 24 h (P < 0.05). As for the two wild-type strains, BL21(DE3) and BW25113, they had similar growing pattern as ΔglgP until 20 h. Then, their OD600 values dropped evidently. No significant difference was detected for the two wild-type strains in terms of OD600 values at 24 h (P > 0.05). As for the other three mutants, ΔglgC, ΔglgA, ΔglgB, that were disrupted on glycogen biosynthesis pathway, they showed lowest OD600 values at 24 h. In addition, no significant difference was detected among the three strains. Interestingly, ΔglgC had similar growing pattern as ΔglgP until 14 h, after which its OD600 value decreased sharply to the lowest level at 24 h. Student’s t-test showed that OD600 values of ΔglgC mutant at 24 h was significantly lower than BW25113 (P < 0.05), ΔglgP (P < 0.01), and ΔglgX (P < 0.001). Thus, disruption of genes in glycogen metabolism pathway changed E. coli growth abilities. That is, growth of mutants with impaired glycogen degradation pathway was boosted while growth of mutants with compromised glycogen synthesis pathway was hindered.
Glucose Consumption
Glucose consumption rate for BL21(DE3) was monitored in 1 × M9 minimal medium with different concentrations of glucose (Figure 2A). According to linear regression and statistical analysis, higher glucose concentration leads to slightly but significantly higher rate of glucose consumption among the four groups (P < 0.05), except for the comparison between 0.2 and 0.4% glucose (P > 0.05). We then checked glucose consumption rates of different strains in 1 × M9 minimal medium with 0.8% glucose (Figure 2B). The results suggested that glucose consumption patterns fluctuated in all the seven strains with an overall decreasing trend. No statistically significant differences were detected among them (P > 0.05). However, at 24 h, we noticed that glycogen over-accumulating mutants ΔglgP (0.27%) and ΔglgX (0.27%) had higher level of glucose left in the liquid culture while glucose left in ΔglgA culture (0.24%) is also comparatively high. Thus, disruption of glycogen metabolism pathway has impacts on the rate of glucose consumption in the culture. However, the specific mechanisms for each mutant might be different, which requires further experimental investigations.
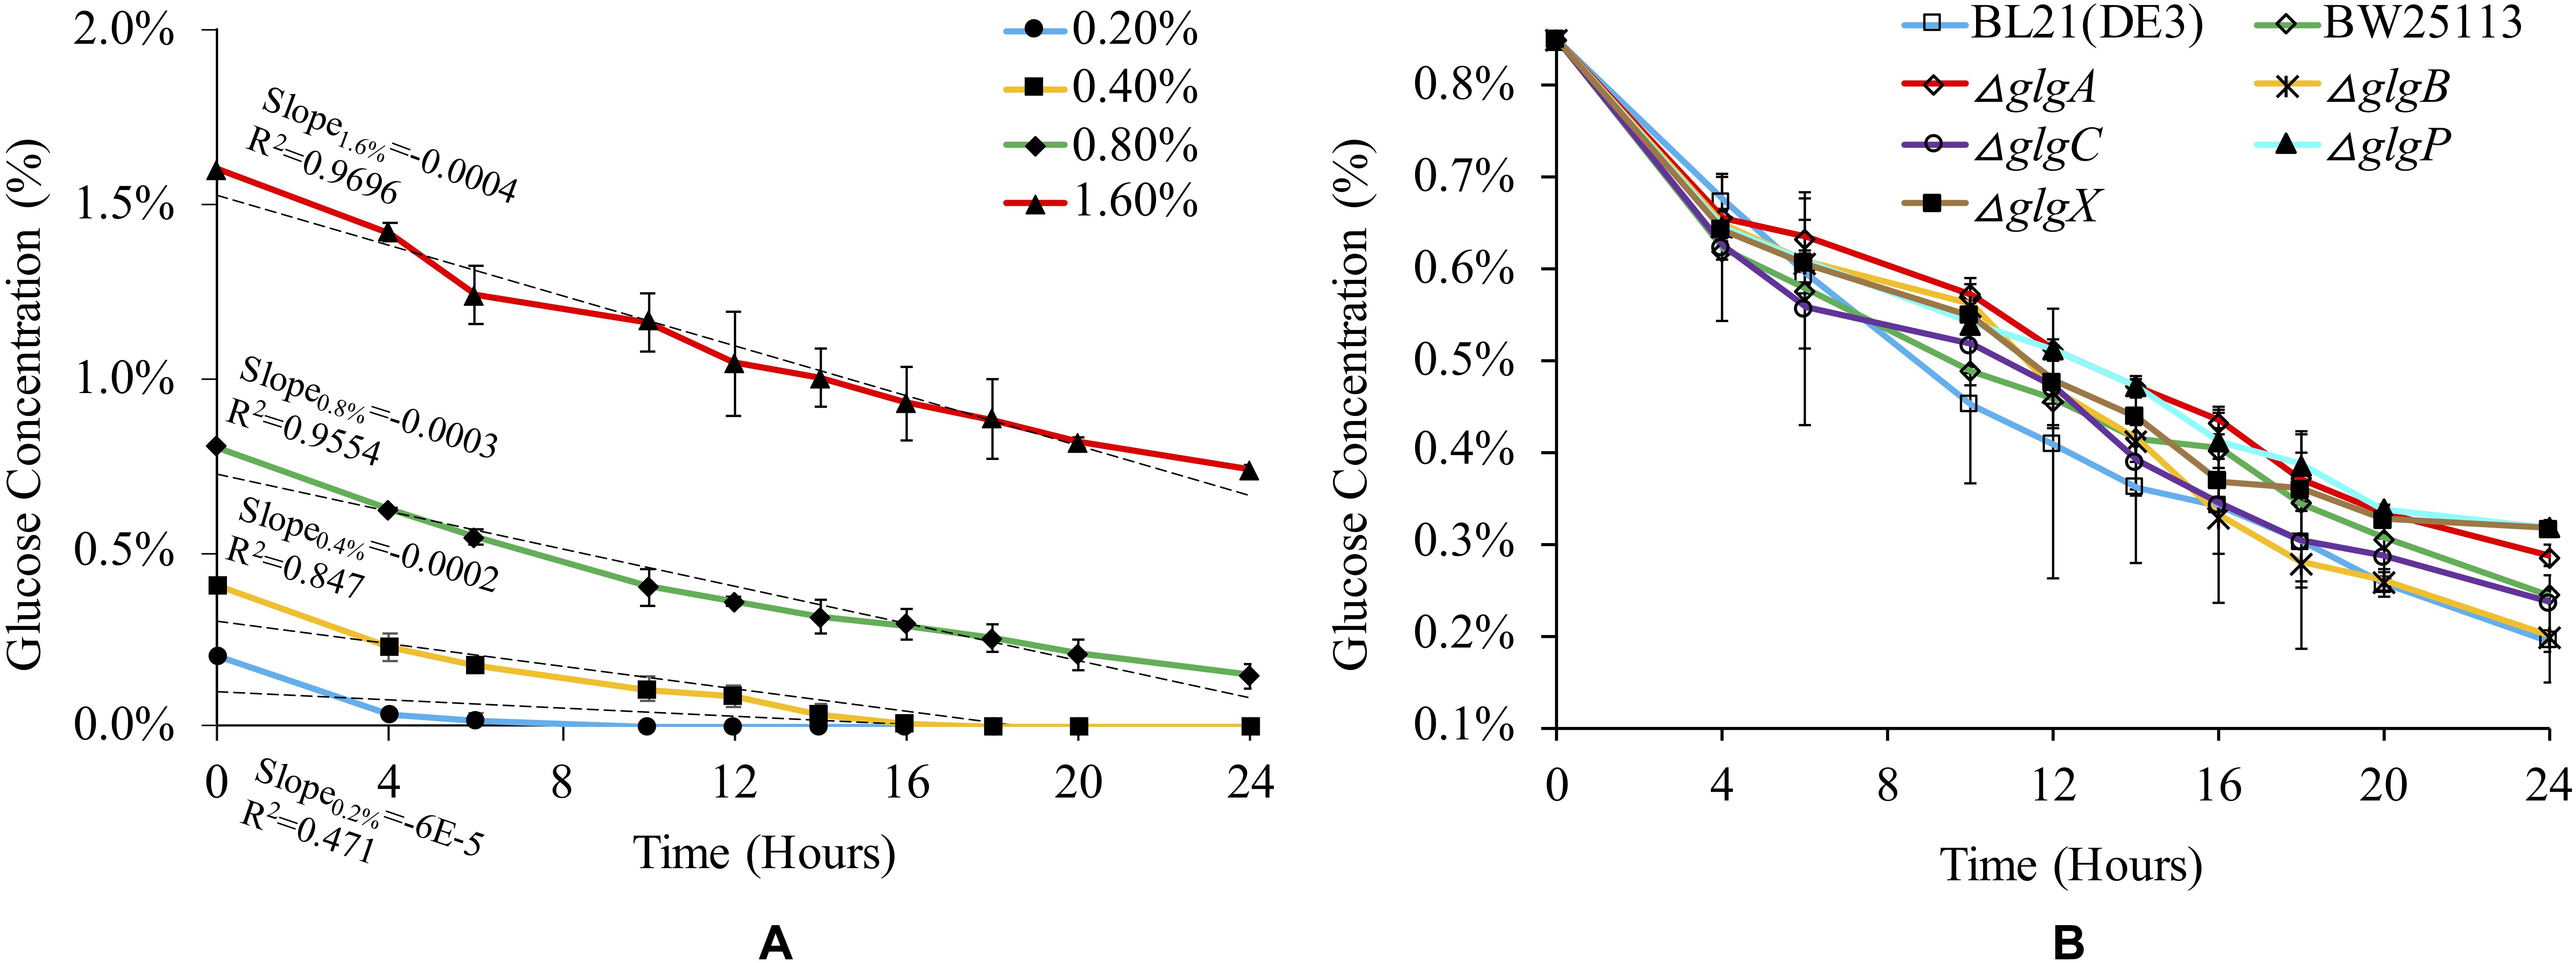
Figure 2. Medium- and strain-dependent glucose consumption rates. (A) Glucose consumption rate of E. coli BL21(DE3) in 1 × M9 minimal medium supplemented with different percentages of glucose (0.2, 0.4, 0.8, and 1.6%). (B) Glucose consumption rate of different E. coli strains in 1 × M9 minimal medium supplemented with 0.8% glucose.
Glycogen Accumulation
Glycogen is normally accumulated in bacteria under limited nitrogen source and abundant carbon source (Wang et al., 2019). It is also reported that glycogen accumulation in many bacteria occurs during stationery phase under conditions of limited growth (Bonafonte et al., 2000). In this study, we firstly investigated how glucose concentration influences glycogen accumulation in BL21(DE3) (Figure 3A). The results show that higher glucose concentration in the medium will lead to significantly higher peak amount of accumulated glycogen in the following order: glycogen1.6% glucose, 20 h > glycogen0.8% glucose, 20 h > glycogen0.4% glucose, 10 h > glycogen0.2% glucose, 6 h (P < 0.05). In specificity, as for media supplemented with 0.8 and 1.6% glucose, glycogen accumulation starts from the beginning until 20 h, after which glycogen begins to degrade. In contrast, glycogen accumulation pattern is very different in media supplemented with 0.2 and 0.4% glucose, in which the peak glycogen amount arrives at 6 and 10 h, respectively. No glycogen could be detected at 14 and 16 h due to degradation processes.
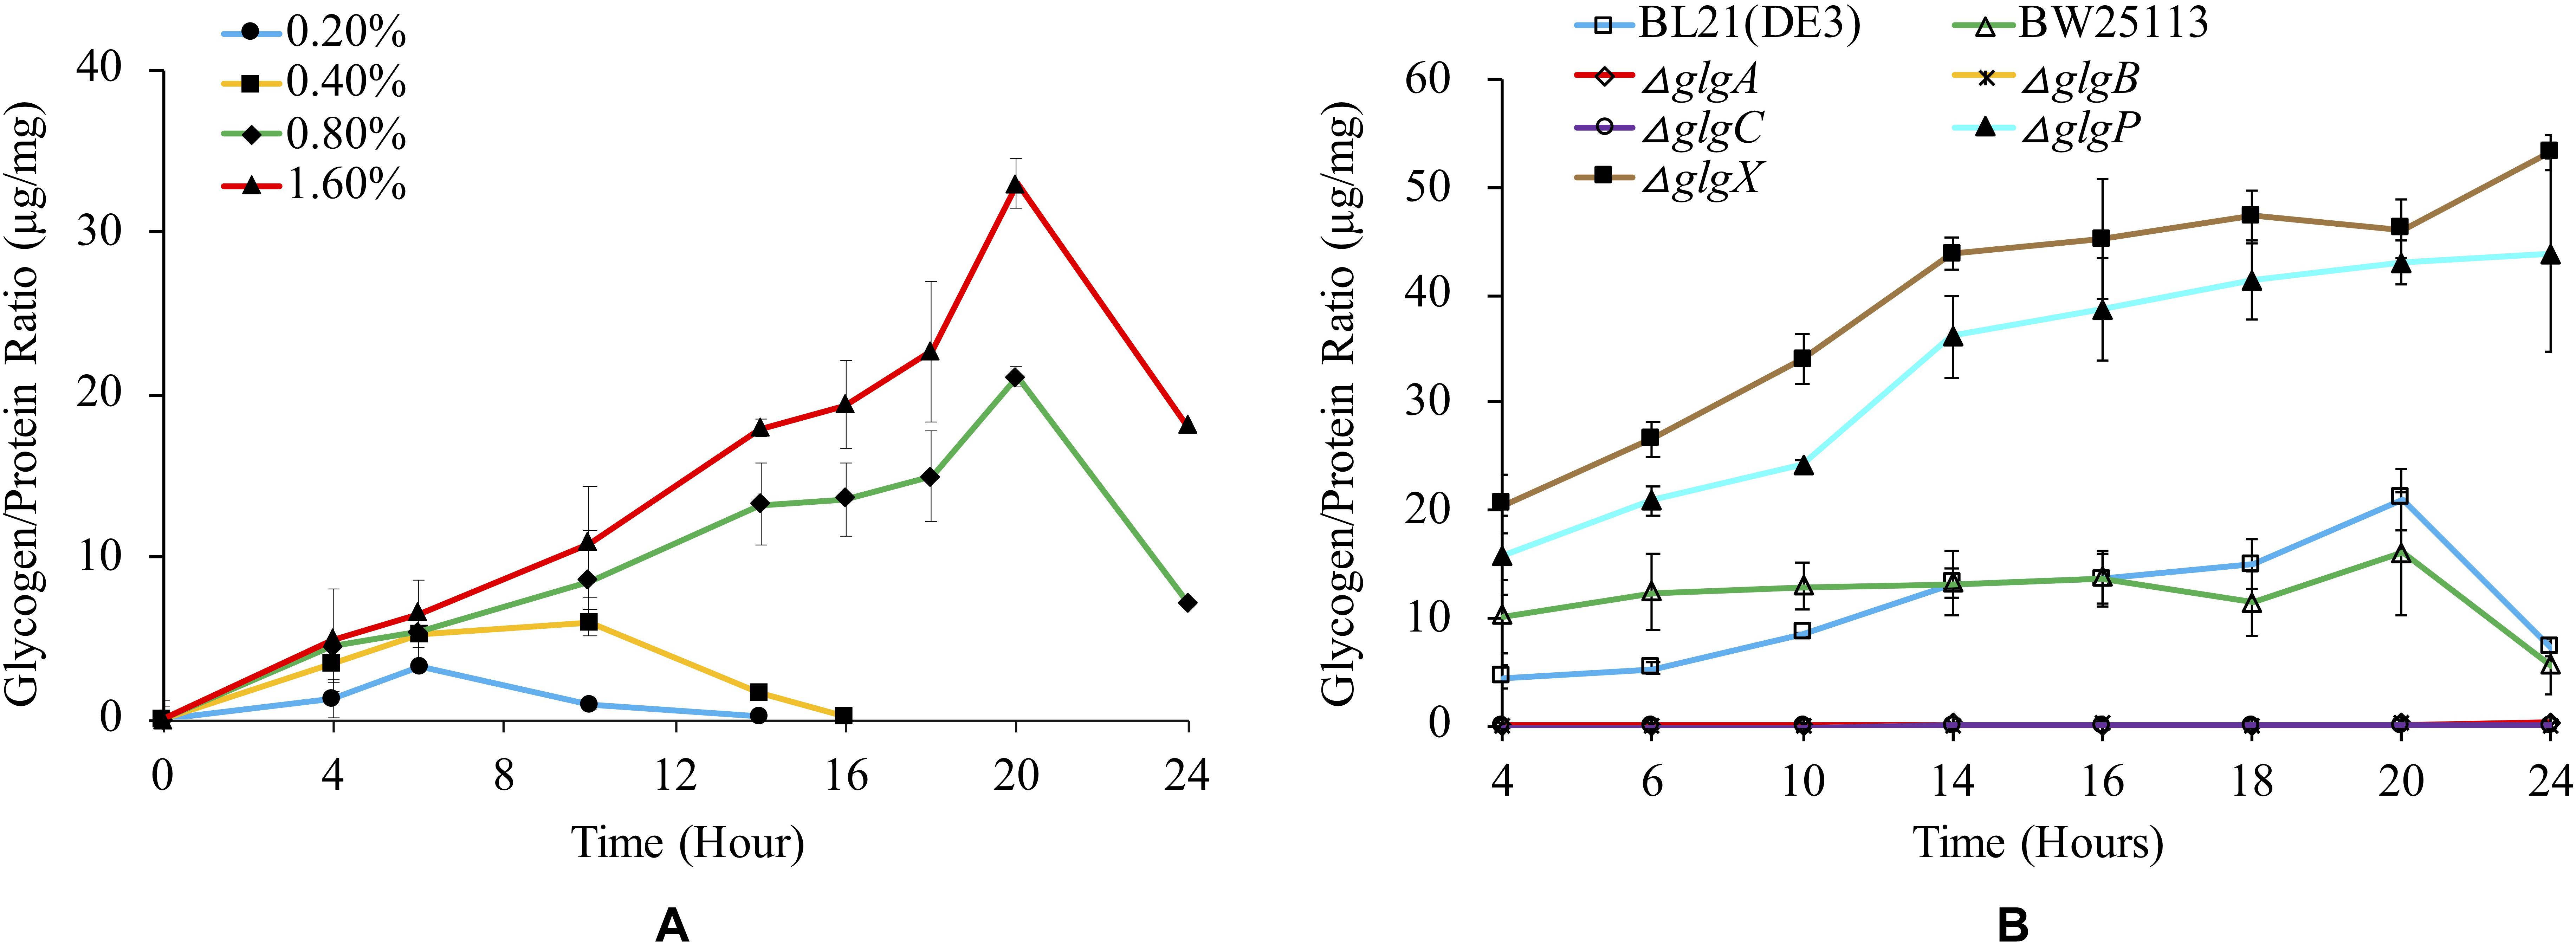
Figure 3. Quantification of glycogen accumulation in E. coli strains with different media. (A) Glycogen accumulation of E. coli BL21(DE3) in 1 × M9 minimal medium supplemented with different percentages of glucose (0.2, 0.4, 0.8, and 1.6%). (B) Glycogen accumulation of a variety of E. coli strains in 1 × M9 minimal medium supplemented with 0.8% glucose. In order to remove the influence of the biomass change during bacterial growth, glycogen amount (μg) was adjusted by total protein amount (mg). Three independent replicates were performed, and error bars were present.
We then studied how glycogen accumulation pattern changed in E. coli wild-type and single-gene mutants in 1 × M9 minimal medium with 0.8% glucose (Figure 3B). According to the results, three mutated strains (ΔglgC, ΔglgA, ΔglgB) disrupted in glycogen synthesis pathway showed non-detectable glycogen accumulation while two mutated strains (ΔglgP and ΔglgX) disrupted in glycogen degradation pathway accumulated abnormally higher amount of glycogen than that in wild-type strains BL21(DE3) and BW25113. The general trend of glycogen accumulation level in ΔglgP and ΔglgX mutants kept increasing during the 24 h culture. There is no statistical significance between the two mutants in terms of overall trend of glycogen accumulation (P > 0.05). As for the glycogen accumulation pattern in the two wild-type strains, both of them showed similar pattern, reaching peak value at 20 h and then starting to decline due to degradation. There is also no significant difference identified (P > 0.05). However, when comparing wild-type strains, BW25113 and BL21(DE3), and the mutated strains, ΔglgP and ΔglgX, pair-wisely, the difference is statistically significant (P < 0.001).
Glycogen Primary Structure
Previous studies confirmed that glycogen structure was co-ordinately controlled by the glgBXCAP operon (Wang and Wise, 2011). Deletion of glgA and glgC genes had no accumulated glycogen while deletion of glgB leads to accumulation of amylose-like linear polysaccharides. Thus, we only compared glycogen primary structure in three strains BW25113, ΔglgP and ΔglgX (Figure 4). The isoamylase-debranched linear chains showed a typically near bell-shaped distribution pattern for all the three strains. The ACL of glycogen are 12.04 ± 0.28 DP, 13.27 ± 0.73 DP, and 12.5 ± 0.32 DP while all the chain lengths at 9 DP have the highest molar percentages of 10.59, 8.5, and 8% for BW25113, ΔglgP and ΔglgX, respectively. Differential plot was generated by subtracting the molar percentages of the respective ΔglgP and ΔglgX oligosaccharide DPs from the corresponding WT molar percentages (Figure 4D). In particular, a significant reduction in the proportion of shorter chains from 5 to 12 DP was observed while the percentage of longer chains with DP equal to or larger than 13 DP were significantly increased in ΔglgP. For glycogen chain length distributions in ΔglgX, both molar percentage of shorter chains from 4 to 6 DP and that of longer chains equal to or larger than 17 DP were increased while the molar percentage of oligosaccharide chains from 7 to 16 were greatly reduced.
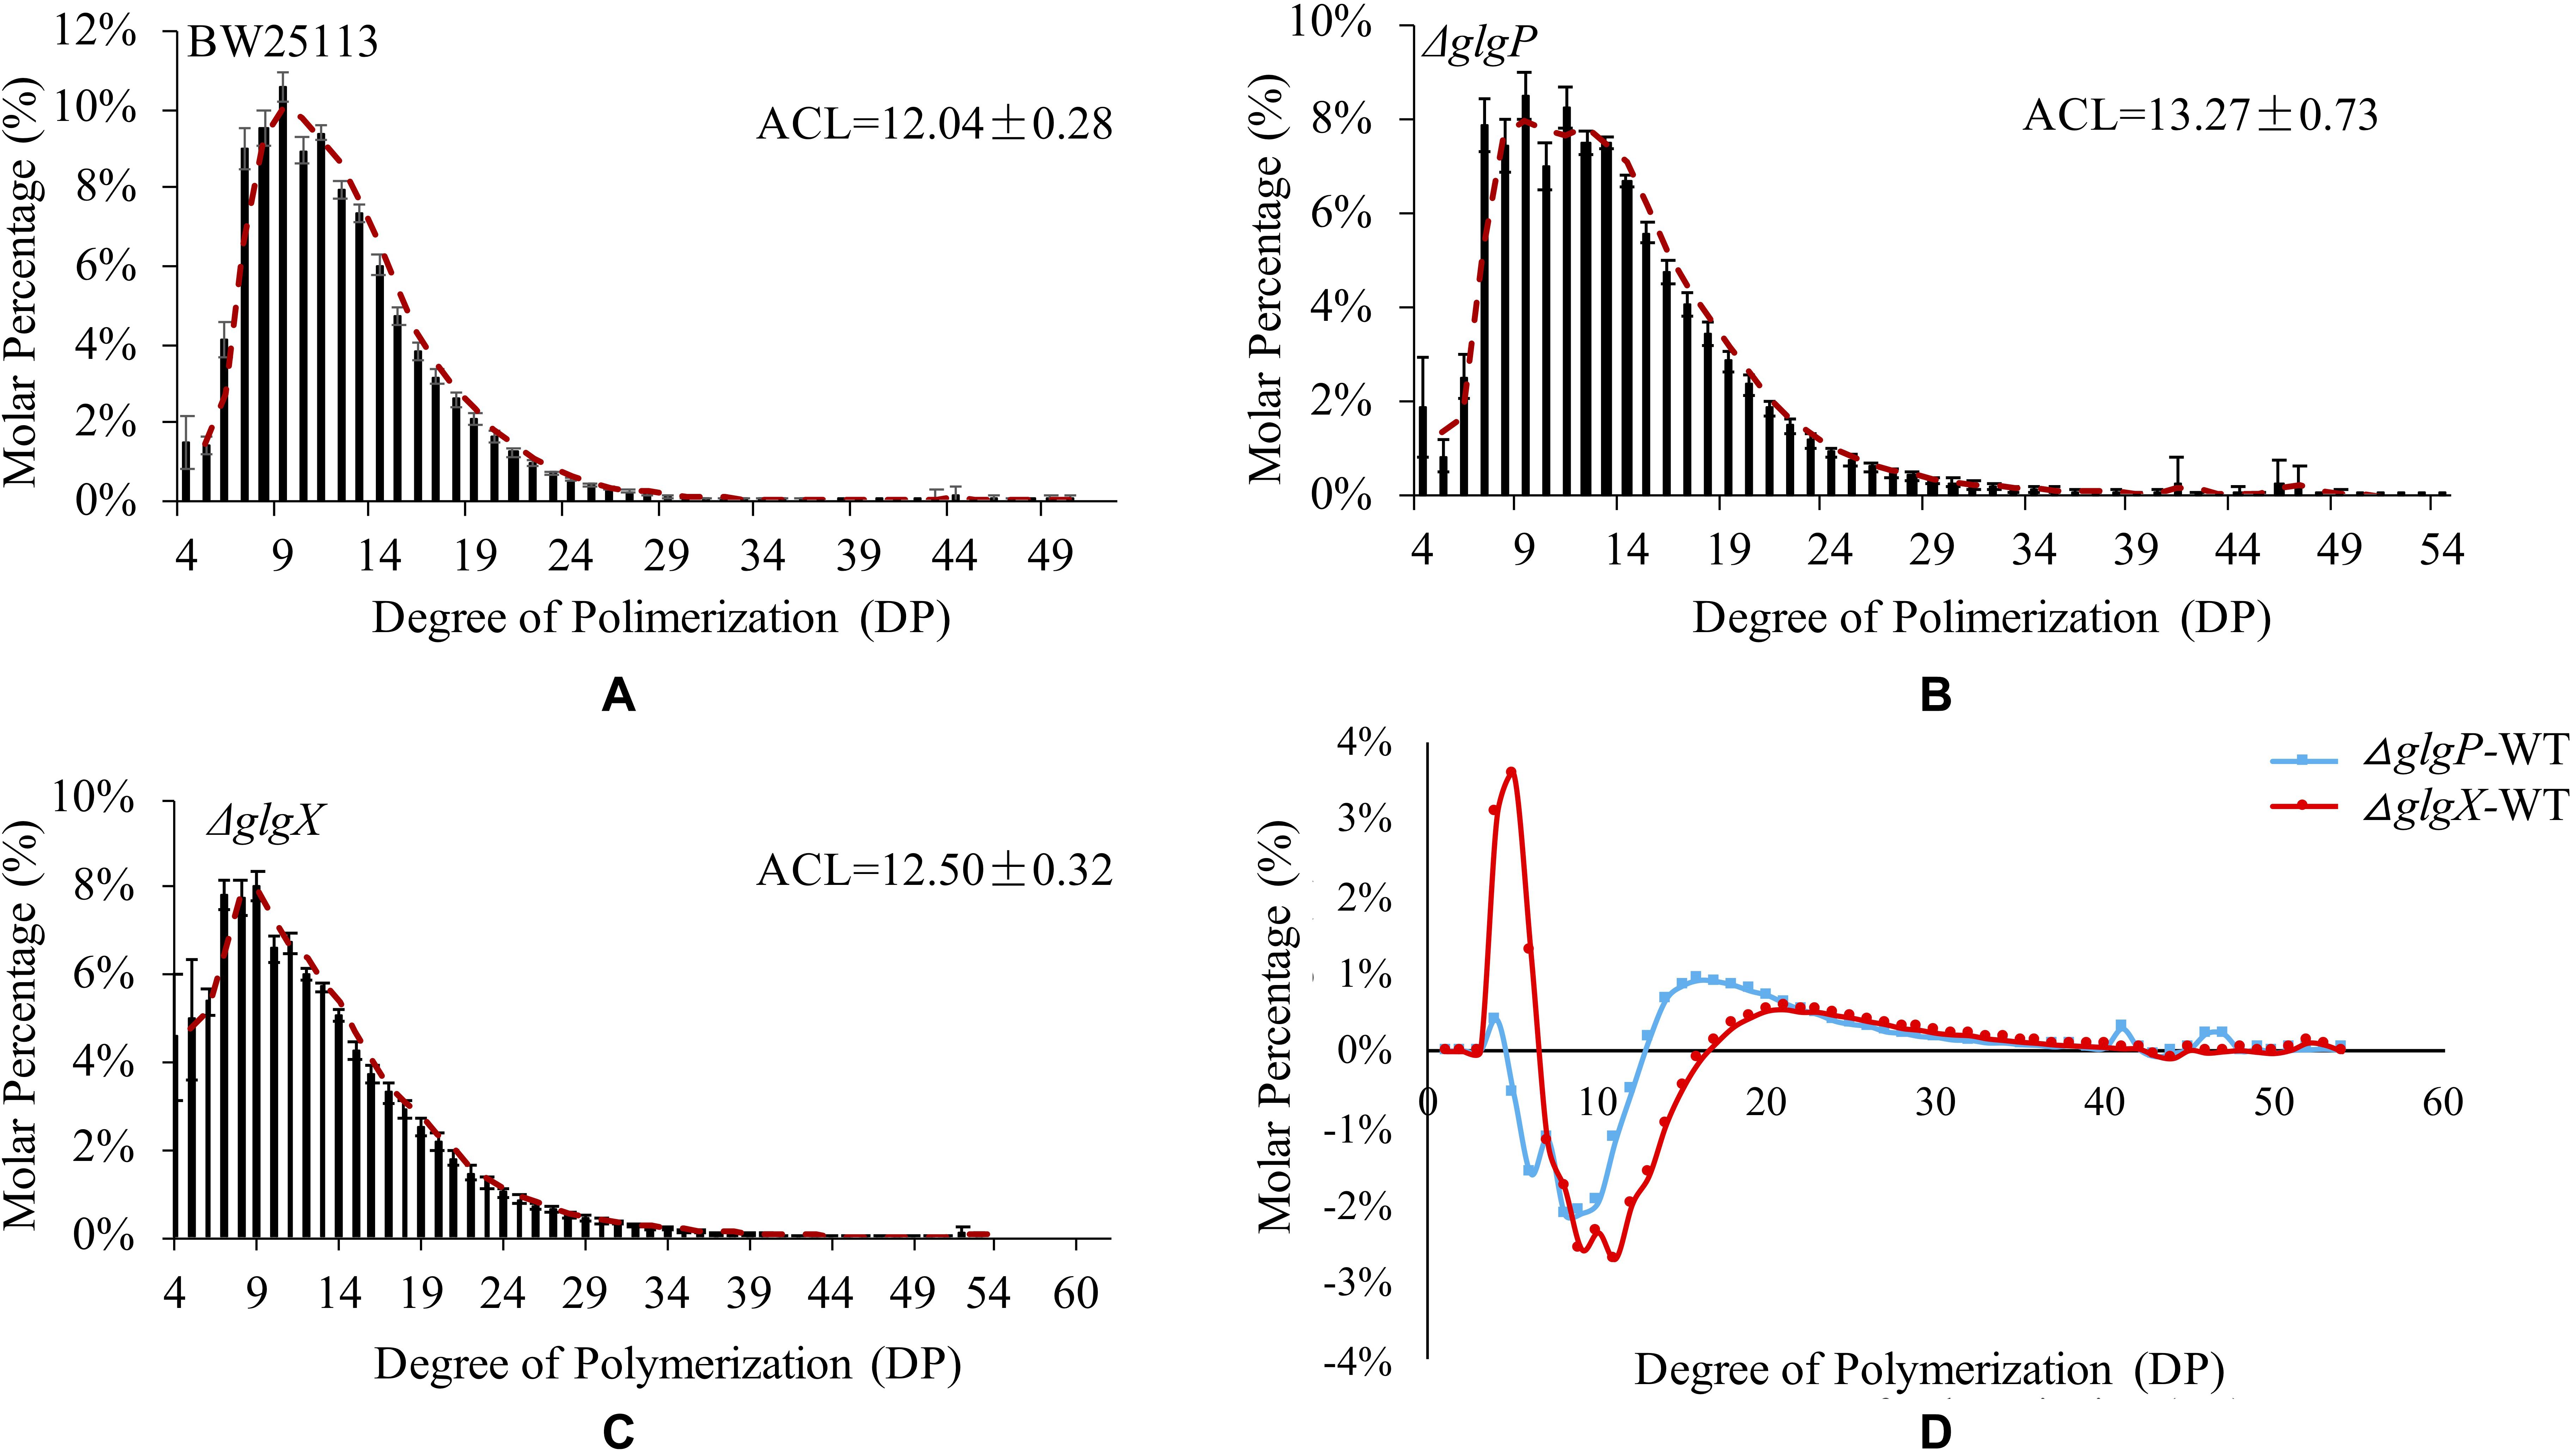
Figure 4. Comparison of glycogen primary structures in E. coli wild-type and mutated strains. (A) Glycogen chain length distribution patters in E. coli BW25113. (B) Glycogen chain length distribution patters in E. coli BW25113 ΔglgP. (C) Glycogen chain length distribution patters in E. coli BW25113 ΔglgX. (D) Differential distributions of chain-length molar percentages among wild-type BW25113, ΔglgP, and ΔglgX.
Biofilm Formation Ability
Biofilm formation abilities were compared among the two wild-type strains and five mutants in LB broth medium (Figure 5) and 1 × M9 minimal medium supplemented with 0.8% glucose (Supplementary Figure 2). According to the Tukey’s HSD test, E. coli and the mutated strains growing in LB broth formed significantly more biofilms than in M9 minimal medium (P < 0.05). When growing in LB broth, BL21(DE3) formed significantly less biofilm than BW25113 (P < 0.05). In addition, all mutated strain had significantly higher biofilm formation abilities than that of BW25113 (P < 0.05). In particular, ΔglgB had the highest biofilm formation potential (OD590 = 0.88). When growing in 1 × M9 minimal medium supplemented with 0.8% glucose, biofilm formation abilities of all the E. coli strains were significantly reduced to very low level (P < 0.05). In sum, 1 × M9 minimal medium (0.8% glucose) did not facilitate the formation of biofilms in E. coli while interruption of glycogen metabolism pathway in E. coli leads to increased biofilm formation. However, no specific molecular mechanisms are available to interpret such phenotype changes, which we aim to explore via transcriptomics analysis in follow-up studies.
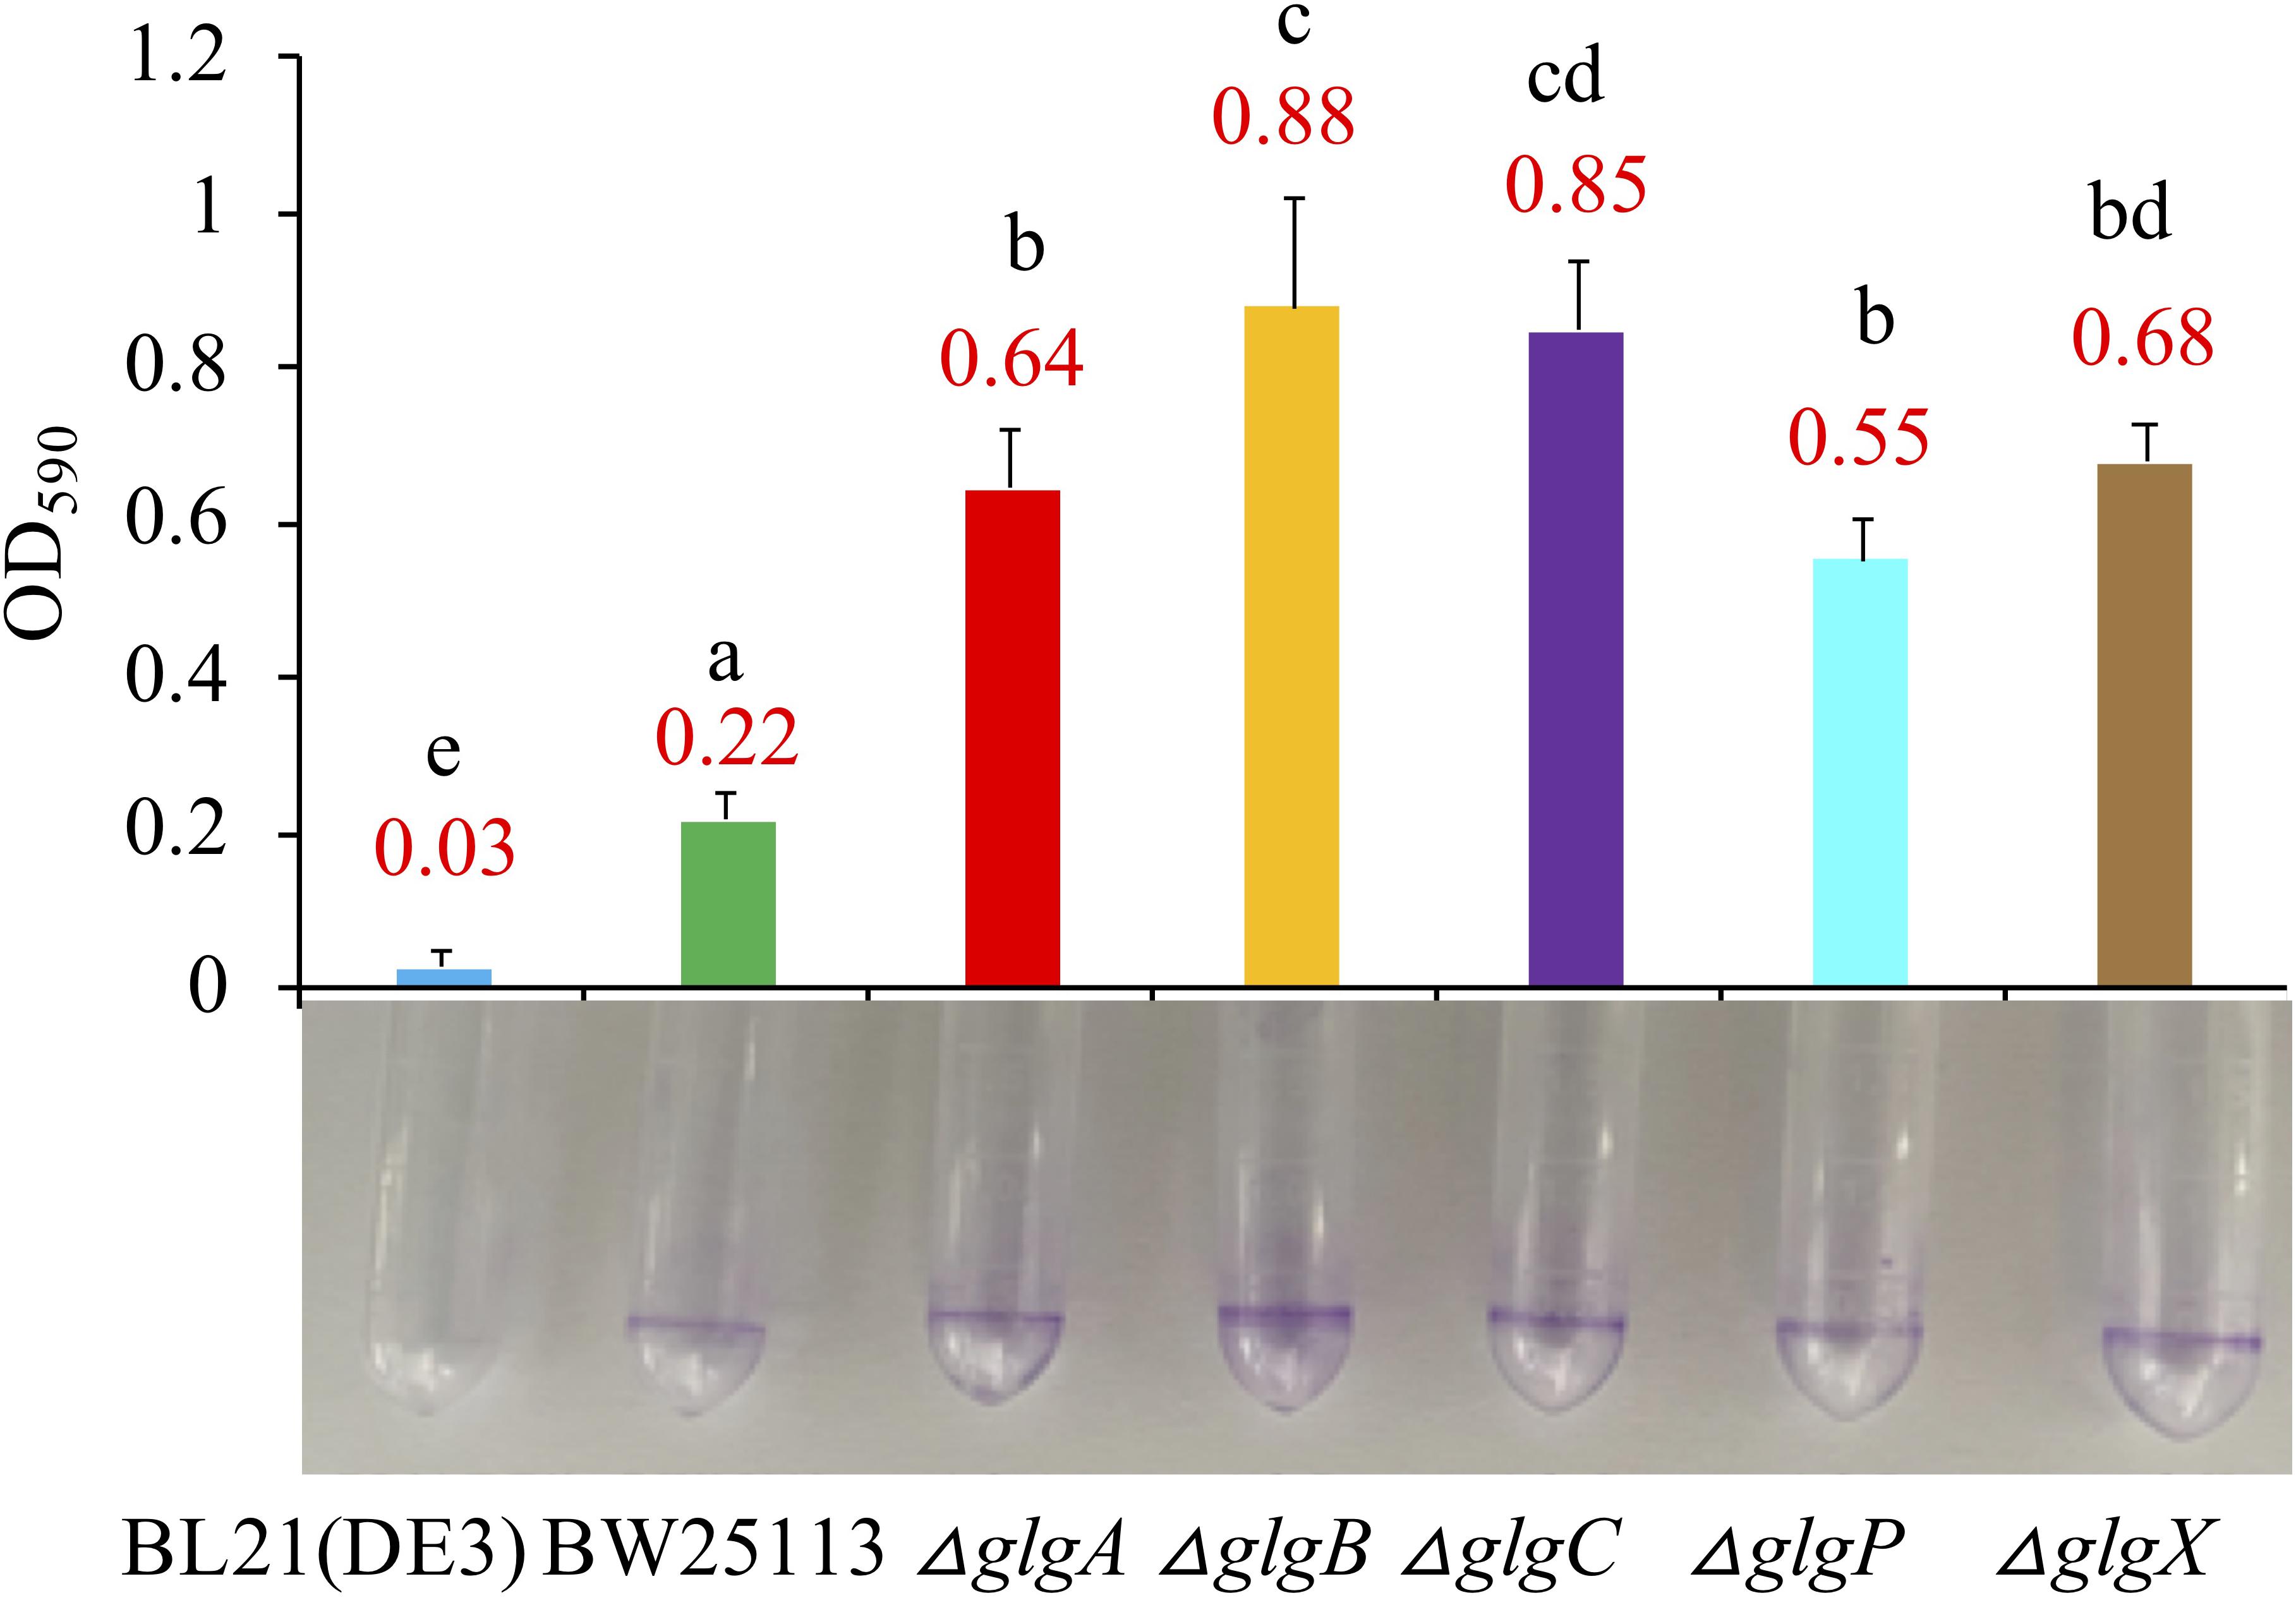
Figure 5. Comparison of biofilm formation abilities of E. coli wild-type strains, BL21(DE3) and BW25113, and five mutated strains, ΔglgA, ΔglgB, ΔglgC, ΔglgP, and ΔglgX in Luria-Bertani broth medium. Biofilm formation abilities in 2 mL plastic round-bottom EP tubes stained with 0.1% crystal violet solution were matched with bar chart that corresponded to mean values and standard errors. Tukey’s HSD test was performed for statistical analysis. Means denoted by a different letter indicated significant differences between groups (P < 0.05).
E. coli Viabilities Under Environmental Stresses
Glycogen accumulation has been confirmed to facilitate bacterial environmental survival under abiotic stresses (Wang and Wise, 2011). In this study, we systematically studied how the deletions of single genes in the classical glgBXCAP operon influence E. coli survival under a variety of environmental stresses. Such studies could improve our understanding of glycogen functions further. Parental strain BW25113 and the five single-gene knock-out mutants were re-suspended for starvation in PBS buffer at room temperature for 12 days, during which viable cells in each strain were numerated every 2 days and the results are shown in Figure 6A. It is obvious to see that ΔglgX survives the best than all other strains under the starvation conditions for 12 days, which was tightly followed by ΔglgP (SΔglgX > SΔglgP). There is no significant difference between ΔglgX and ΔglgP in terms of the overall trend of starvation survival and when compared at each time point. Viability of the wild-type strain BW25113 is generally lower than ΔglgX and ΔglgP during the first 4-day starvation, but higher than the other three mutants with glycogen-deficient phenotype (SΔglgX > SΔglgP > SWT > SΔglgCor ΔglgBor ΔglgA). At day 6, viabilities of all the strains clustered together except for ΔglgC that had the lowest viability. In addition, wild-type strain survived better than ΔglgP with no statistical significance at day 6. Since it is already known that ΔglgX and ΔglgP store the highest and the second highest amount of glycogen, it is rational to conclude that glycogen accumulation improves bacterial survival under starvation conditions.
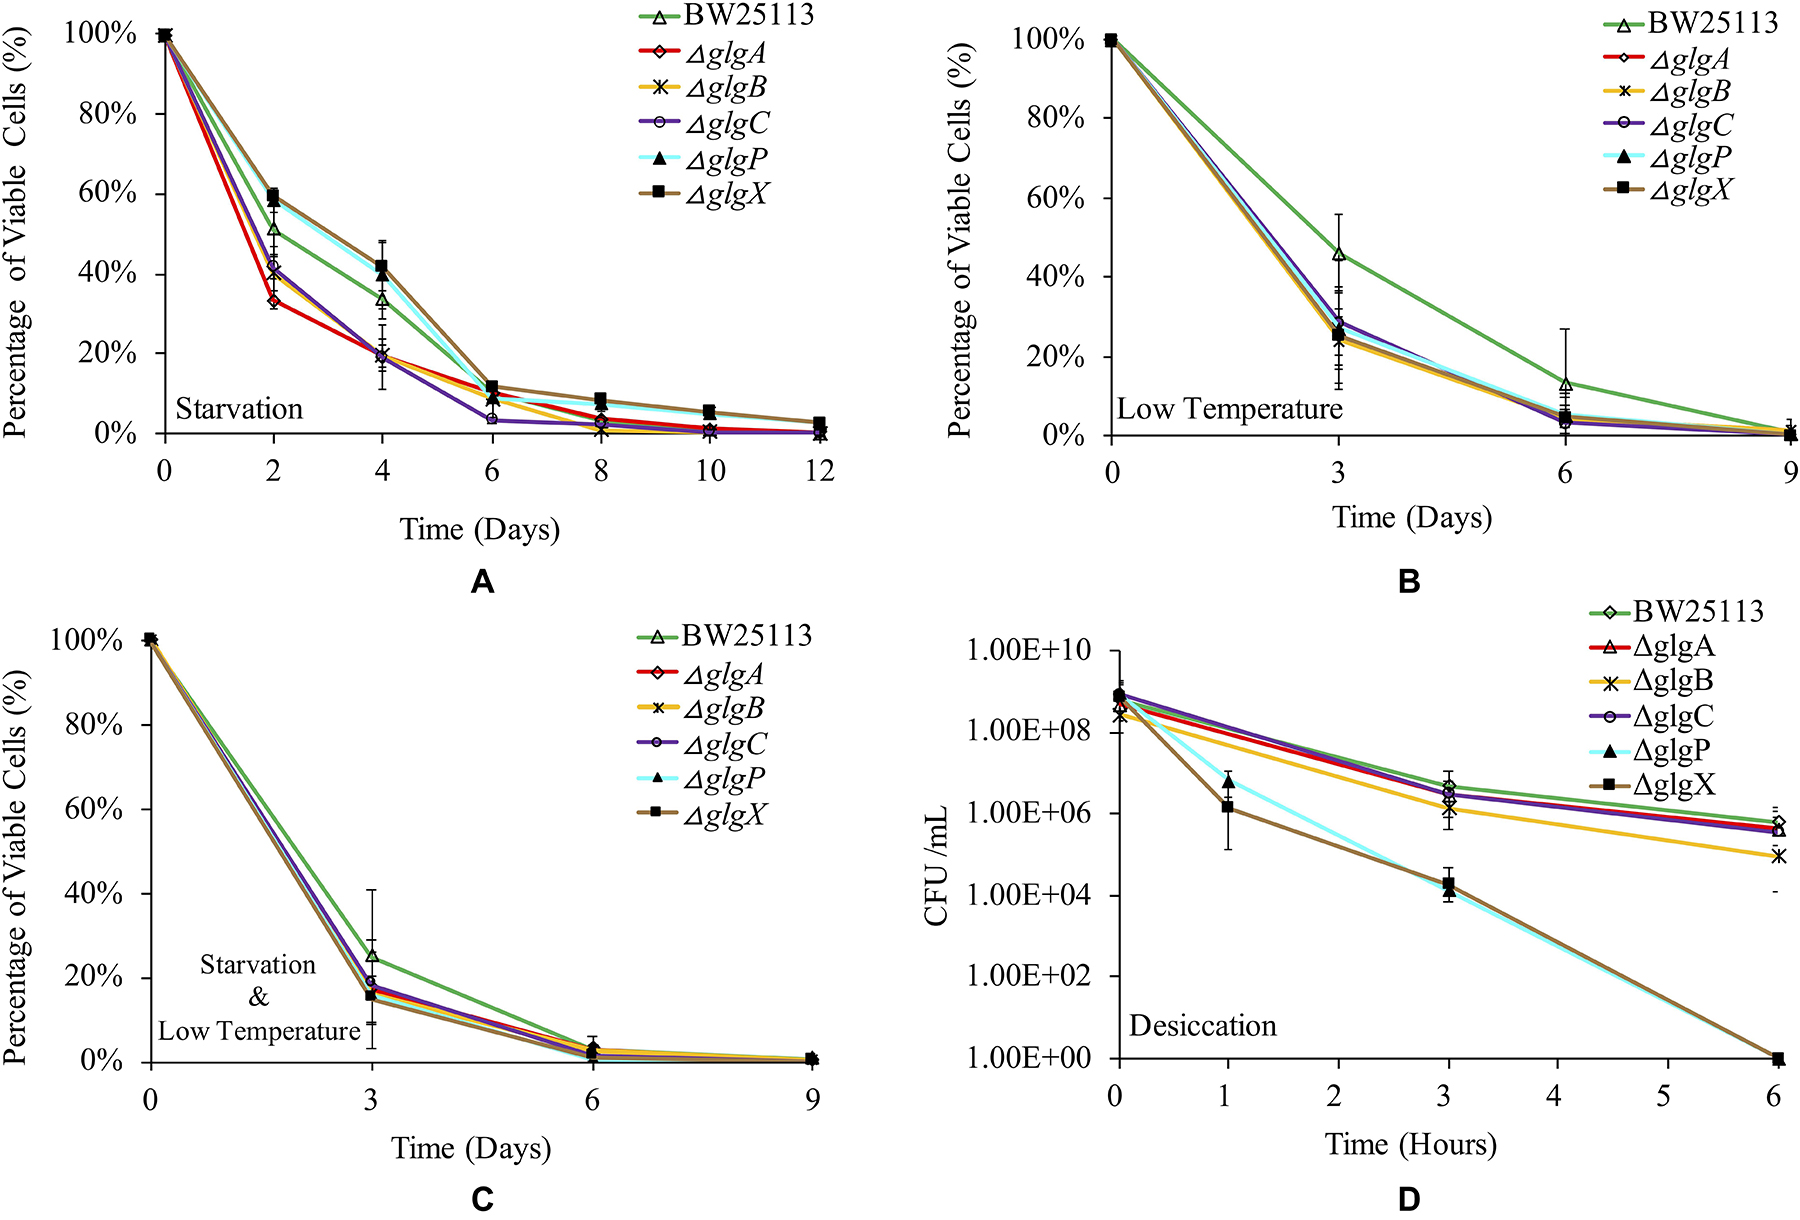
Figure 6. Viabilities of E. coli BW25113 wide-type strain and mutated strains under a variety of environmental stress. (A) Starvation. (B) Low temperature. (C) Starvation coupled with low temperature. (D) Desiccation.
As for the survival ability of E. coli strains at low temperature, the wild-type BW25113 showed consistently higher viability than all mutated strains until day 9, after which no bacterial viability could be detected for all the strains (Figure 6B). This indicated that disruption of glycogen metabolism pathway led to compromised survival ability of E. coli when dealing with cold stress. However, statistical analysis indicated that viability of wild-type BW25113 was only significantly higher than ΔglgA and ΔglgX at day 3 (P < 0.05). No significant difference was detected in terms of the overall trend of cold viability among E. coli BW25113 and the five mutants. We then tested the dual effects of starvation and low temperature on the survival rate of E. coli. According to the result, wild-type BW25113 had the best viability until day 6 (Figure 6C). Similarly, no statistical significance was found in terms of overall viability under low temperature and starvation environment among E. coli strains. Interestingly, the overall survival rate decreased more rapidly when compared with the effects of either starvation or low temperature. At day 9 and beyond, no viable strains could be identified based on the current method.
Desiccation is a strong selective stress on bacterial survival ability during their living in the environment. Due to the rapid death of E. coli strains under desiccation condition, we only investigated their viabilities within 6 h (Figure 6D). According to the result, wild-type BW25113 survives the best under desiccation stress. After 6 h, viable cells of wild-type BW25113 dropped from around 109 CFU/ml to 106 CFU/ml. The three glycogen-deficient mutants (ΔglgC, ΔglgA and ΔglgB) decreased their survival abilities more rapidly when compared with the wild-type strain, among which ΔglgB performed the worst. As for the mutated strains ΔglgP and ΔglgX, they died off very quickly, which dropped from around 109 CFU/ml to 104 CFU/ml within only 3 h, and then to 0 CFU/ml within 6 h. The two mutants ΔglgP and ΔglgX formed an obviously separated cluster from other strains in terms of desiccation viabilities. However, no statistical significance was found among strains in terms of overall survival of desiccation stress.
In order to determine whether the genes in glgBXCAP operon could affect the growth of E. coli under the oxidative stress condition, bacteria were cultured in LB agar plates and 1 × M9 minimal medium supplemented with 0.8% glucose agar plate. A 6 mm sterilized paper disc contained 10 μl of 6.6 mol/L H2O2 was then placed in the center of each plate. The diameters of inhibition zones were recorded and compared (Figure 7). According to the statistical analysis, wild-type BW25113 (diameter = 3.51 cm) is slightly but significantly more resistant to H2O2 than wild-type BL21(DE3) (diameter = 3.81 cm) when cultured in 1 × M9 minimal medium (0.8% glucose) agar plate. As for the five single-gene mutants, oxidative stress resistance was consistently and significantly increased in ΔglgA, ΔglgB, and ΔglgP strains (P < 0.05) but insignificantly decreased in ΔglgC and ΔglgX strains (P > 0.05) in both LB and 1 × M9 minimal medium agar plates, when compared with wild-type strain BW25113.
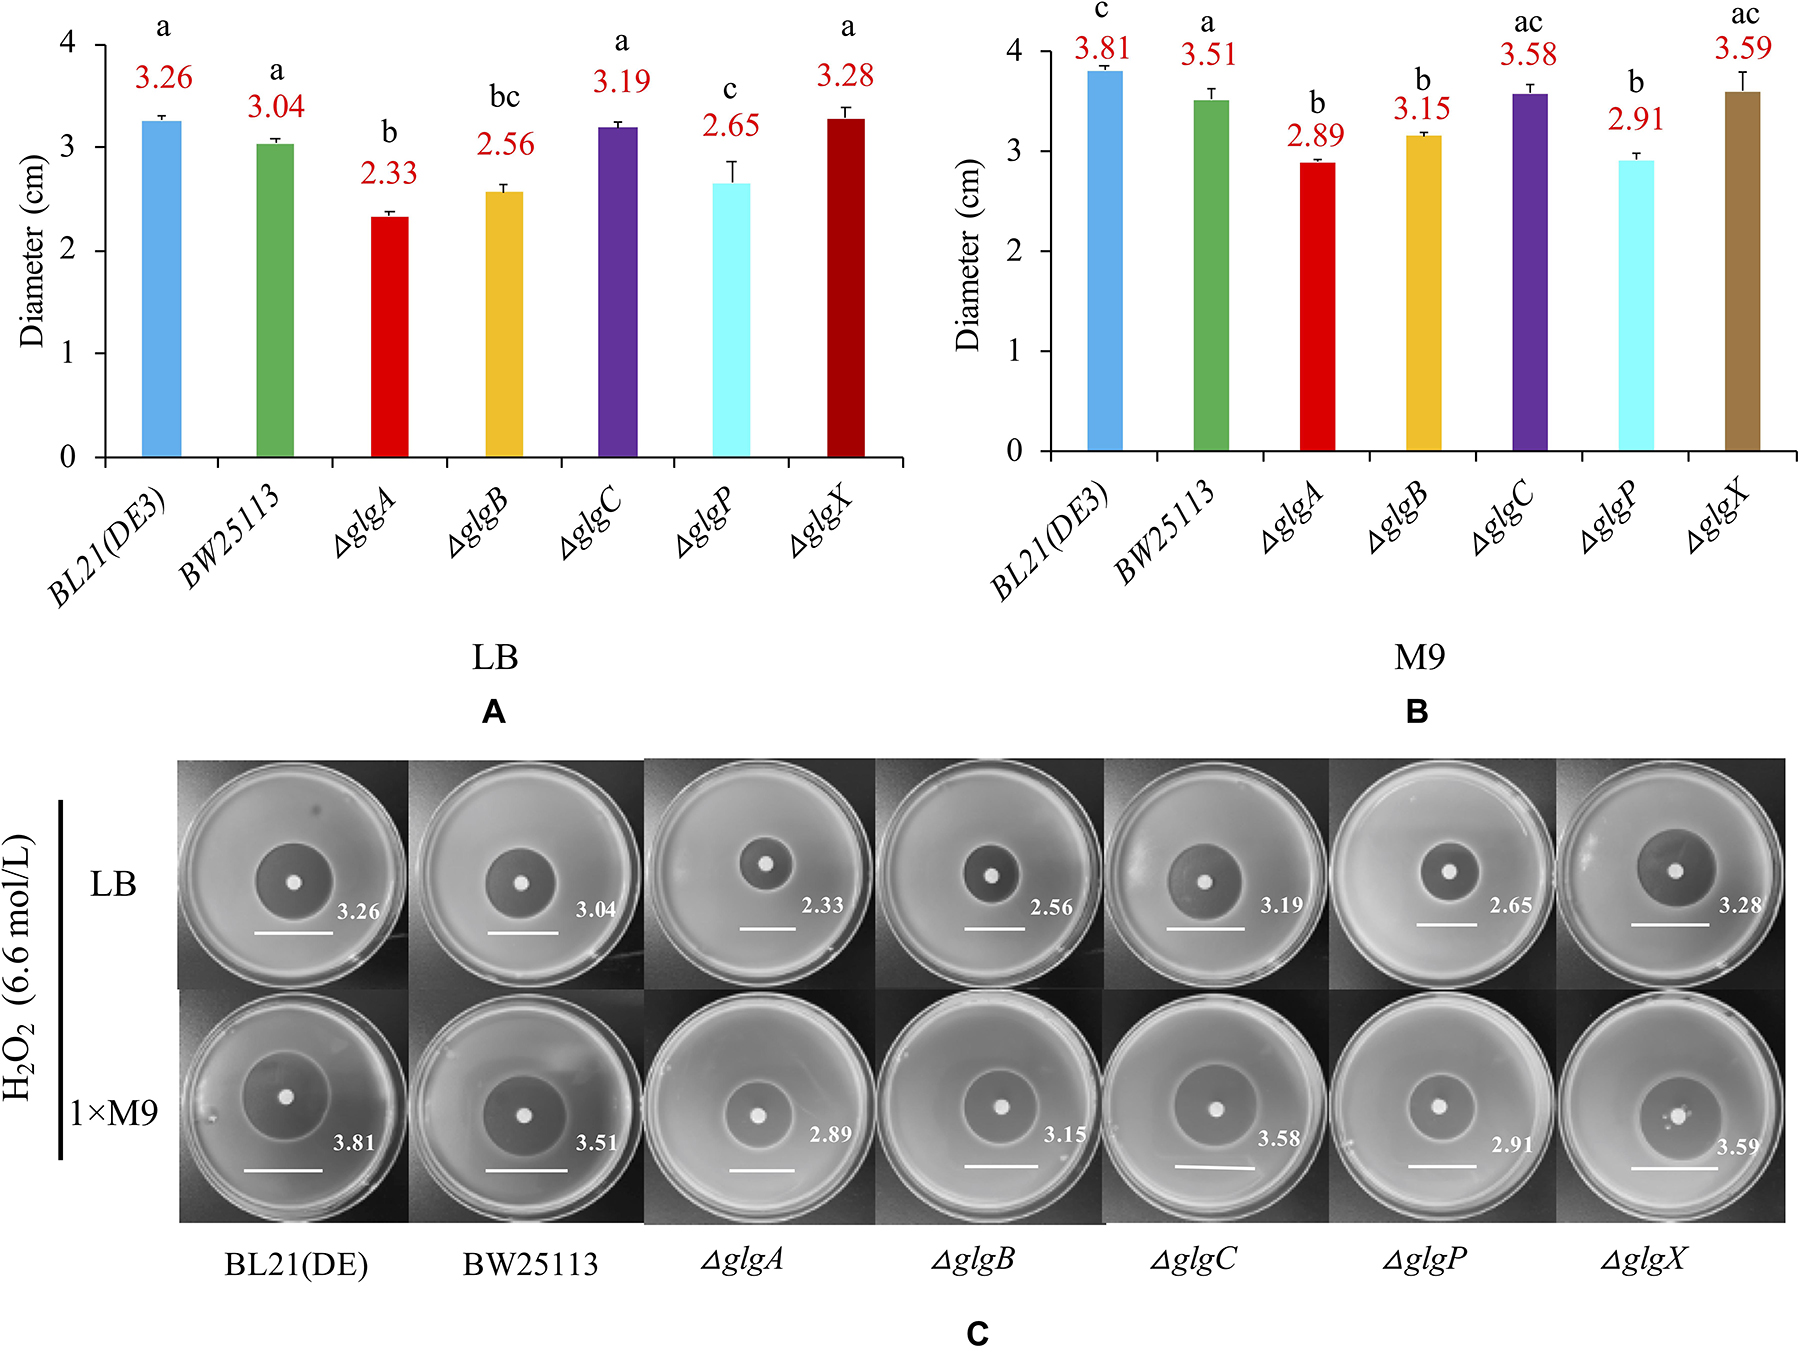
Figure 7. Oxidative stress resistance of E. coli strains. (A) LB agar plate. (B) 1 × M9 minimal medium supplemented with 0.8% glucose agar plate. (C) Strain-specific growth inhibition circles. Wild-type strains: BL21(DE3), BW25113. Mutants: ΔglgC, ΔglgA, ΔglgB, ΔglgP, and ΔglgX. Tukey’s HSD test was performed for statistical analysis. Means denoted by a different letter indicated significant differences between groups (P < 0.05).
Discussion
Glycogen accumulation has been linked with bacterial growth, biofilm formation, and environmental survival abilities in a variety of species, some of which are important human pathogens (Seibold and Eikmanns, 2007; Bourassa and Camilli, 2009; Lerner et al., 2009). According to previous studies, many genes were associated with glycogen metabolism in E. coli (Eydallin et al., 2007b, 2010). Among these genes, five of them are very important and form a single operon glgBXCAP with an alternative suboperonic promoter within glgC that directs glgAP expression (Montero et al., 2010). Although these genes have been studied sporadically and scatteringly in different species under different conditions, there is currently no systematic and comparative studies for their physiological functions in E. coli. In this study, we cultured E. coli wild-type strains, BL21(DE3) and BW25113, and mutated strains, ΔglgC, ΔglgA, ΔglgB, ΔglgP, and ΔglgX, in LB broth medium and standardized 1 × M9 minimal medium, with a focus on the functions of the five genes in bacterial growth, glycogen accumulation and structure, biofilm formation and environmental survival abilities.
Many studies supported that bacterial glycogen storage and over-accumulation could lead to a better growth or a higher OD600 value (Strange, 1968; Dedhia et al., 1994). However, E. coli BW25113 ΔglgX showed no growth advantage in 1 × M9 medium supplemented with 0.4% glucose, though it accumulated excessive glycogen (Dauvilleìe et al., 2005). The influence of glycogen deficiency or complete depletion on bacterial growth is also disputable. The growth of C. glutamicum and its survival in the stationary phase were not altered with complete loss of intracellular glycogen due to inactivation of ΔglgC (Seibold et al., 2007). In addition, growth curve of E. coli DH5αΔglgB is nearly the same as wild-type strain (Wang et al., 2015). However, V. cholerae ΔglgC exhibits growth defects during growth under high and low nitrogen conditions (Bourassa and Camilli, 2009). Recently, a genome-wide phenotypic analysis via screening E. coli Keio collection reveals that glycogen-excess strains ΔglgP (OD600 = 0.76) and ΔglgX (OD600 = 0.76) have higher maximal OD600 values than glycogen-deficient strains ΔglgC (OD600 = 0.69), ΔglgA (OD600 = 0.43), and ΔglgB (OD600 = 0.61) (Campos et al., 2018). In this study, we reached similar conclusions: ΔglgP and ΔglgX had a clearly better growth than the wild-type strain that grew better than other glycogen-deficient mutants (Figure 1). It is worth mentioning that the growth curve of strain ΔglgC is similar to wild-type strains initially and then starts to decrease at 14 h. Such a growth defect was previously reported for V. cholerae ΔglgC1 and ΔglgC1/ΔglgC2 mutants when compared with wild-type strain (Bourassa and Camilli, 2009). The possible explanation for this is that growth of V. cholerae halts under glycogen−inducing conditions even when glycogen cannot accumulate (Bourassa and Camilli, 2009). However, molecular mechanisms for this phenotype are not clear, which should be explored in future studies. In addition, we also observed that at 24 h, ΔglgP and ΔglgX had the highest glucose concentration left in the culture, which suggested that glycogen accumulation in ΔglgP and ΔglgX was due to the disruption of glycogen degradation pathway, rather than higher glucose absorption and utilization rate.
Glycogen accumulation and structure have been widely studied in many bacteria (Wang and Wise, 2011; Wang et al., 2020). In general, bacteria could synthesize glycogen during exponential growth or in stationary phase, but accumulation mainly occurs in excess of carbon source during the stationary phase (Bonafonte et al., 2000; Goh and Klaenhammer, 2014). For wild-type strain E. coli BL21(DE3) and BW25113, continuous glycogen accumulation was observed from 4 h until 20 h. Thus, glycogen can be accumulated at exponential phase in E. coli, which might be due to low nitrogen concentration in 1 × M9 minimal medium and the high concentration of glucose (0.8%) in the culture. After 20 h culture when glycogen accumulation reaches the peak, its amount starts to decrease sharply, though there was still sufficient glucose left in the medium (Figure 2). Thus, there might be some other regulatory mechanisms that broke the balance of glycogen synthesis and degradation at the stationary phase, which is worthy of further investigation. It was also observed that deletions of ΔglgC, ΔglgA or ΔglgB led to a glycogen loss phenotype, which is consistent with previous reports, while ΔglgP or ΔglgX knock-out strain caused glycogen over-accumulation with no sign of content reduction.
Glycogen phosphorylase and GDE are responsible for glycogen degradation: GP works by removing glucose units from the non-reducing ends of outer chains in glycogen until four glucose residues left, which are then truncated enzymatically by GDE at α-1,6-glycosidic linkages (Wang and Wise, 2011). Glycogen structures in E. coli mutated strains ΔglgP and ΔglgX have been studied independently (Dauvilleìe et al., 2005; Alonso-Casajuìs et al., 2006). Here we compared the primary structure of glycogen extracted from ΔglgP and ΔglgX with that in wild-type strain BW25113 after culturing in the same medium for 24 h. The general pattern of structural alterations is consistent with previous conclusions with some variation, which confirms that loss of GP greatly reduces the percentage of short chains while largely increases the percentage of longer chains. As for the deletion of glgX, a large portion of very short chains (4–6 DP) were found in the accumulated glycogen particles. However, it is interesting to notice that a certain portion of long chains (17 DP and beyond) also exists, which raises the questions of why these long chains are not degraded by GP and how these chains are organization spatially. Answering these questions would generate a better understanding of glycogen structure and metabolism in bacteria.
Biofilm formation is clinically important because around 80% of microbial infections in the body could be attributed to it (Davies, 2003). There is currently no fixed conclusion in terms of the influences of glucose and glycogen on bacterial biofilm formation (Moreira et al., 2013). A study of Salmonella enteritidis revealed that increased glucose concentration in the media facilitated the biosynthesis of intracellular glycogen and biofilm formation (Bonafonte et al., 2000). However, another study showed that biofilm formation was repressed by glucose in several species of Enterobacteriaceae, such as E. coli (Jackson et al., 2002a). In this study, we identify that BW25113 is a better biofilm former than BL21(DE3) in LB broth. In addition, glycogen metabolism disruption significantly improves biofilm formation in the same medium. In contrast, biofilm formation in 1 × M9 minimal medium supplemented with 0.8% glucose for all strains is strongly and significantly repressed. Thus, biofilm formation is species-dependent and also greatly influenced by environmental factors (Jackson et al., 2002a).
Glycogen accumulation facilitates bacterial environmental survival under a variety of harsh conditions (Klotz and Forchhammer, 2017). In addition, glycogen with short ACL has also been linked with bacterial environmental durability due to its slow degradation rate (Wang and Wise, 2011). In this study, we investigated the influences of glycogen on the survival abilities of E. coli BW25113 and its single-gene mutants under starvation, low temperature, desiccation, and oxidative stress. As an important energy reserve, bacterial glycogen was able to provide both short-term benefits in changing environments (Sekar et al., 2020) and long-term persistence in the environment (Bourassa and Camilli, 2009). Our study further confirmed that glycogen over-accumulating strains survived much better than wild-type and other mutated strains under starvation conditions, even though glycogen utilization was disrupted. Such an advantage also suggested that there might be other unknown enzyme(s) that can release glucose and/or maltodextrins from intracellular glycogen (Strydom et al., 2017).
Survival of temperature fluctuation is important for pathogens during prolonged transfer between hosts (Chakravortty et al., 2012). Trehalose is known to be essential for viability of E. coli at low temperatures (Kandror et al., 2002). Meanwhile, metabolism of trehalose and glycogen are interconnected through treS–pep2–glgE-glgB pathway (Wang and Wise, 2019). Previous studies have already found that both glycogen and trehalose are highly accumulated as a response to cold stimulation in Propionibacterium freudenreichii (Dalmasso et al., 2012). In this study, low temperature (4°C) was imposed on E. coli wild-type strain BW25113 and five mutated strains for nine consecutive days, the result of which showed that wild-type strain survived the best while other mutants had a similarly compromised survival. When coupling starvation with low temperature, the general trend was similar as the stress of low temperature alone except that all E. coli strains died off much faster. Thus, disruption of glycogen metabolism pathway compromised E. coli survival in cold environment, no matter whether glycogen was over- or less accumulated, which suggested that a complete glgBXCAP operon was necessary for E. coli to combat cold stress.
Desiccation is an environmental and food industry stress that bacteria commonly face, which significantly affects bacterial viability more than other stresses (Esbelin et al., 2018). glgP deletion in A. brasilense showed significantly higher survival rate than wild-type in 1-h desiccation (Lerner et al., 2009). However, glgB deletion in E. coli DH5α greatly reduced its survival rate when desiccated for 6 h (Wang et al., 2015). Through systematic comparison of E. coli BW25113 and its five single-gene mutants in glgBXCAP operon, we found out that wild-type survives the best under the stress while glycogen over-accumulating strains ΔglgP and ΔglgX were more sensitive to desiccation than the other three mutants. However, there is currently no clear molecular mechanism to explain this difference. As for the oxidative stress, recent studies showed that glucose released from glycogen could be used for NADPH/glutathione reduction, which protects nematodes and human hepatocytes from oxidative stress; however, the accumulation of glycogen itself paradoxically shortens the lifespan of Caenorhabditis elegans (Gusarov et al., 2017). In bacteria, oxidative stress resistance normally include two distinct responses, peroxide stimulon and superoxide stimulon, which involves around 44 genes with no direct relationship with glycogen metabolism (Farr and Kogoma, 1991). In this study, there is no consistent conclusion about oxidative resistance in terms of glycogen accumulation and deficiency. Meanwhile, ΔglgA unexpectedly showed the highest resistance toward oxidative stress, which requires further experimental investigation. For a complete summary of all these phenotypic changes influenced by the disruption of glycogen metabolism pathway, please refer to Figure 8.
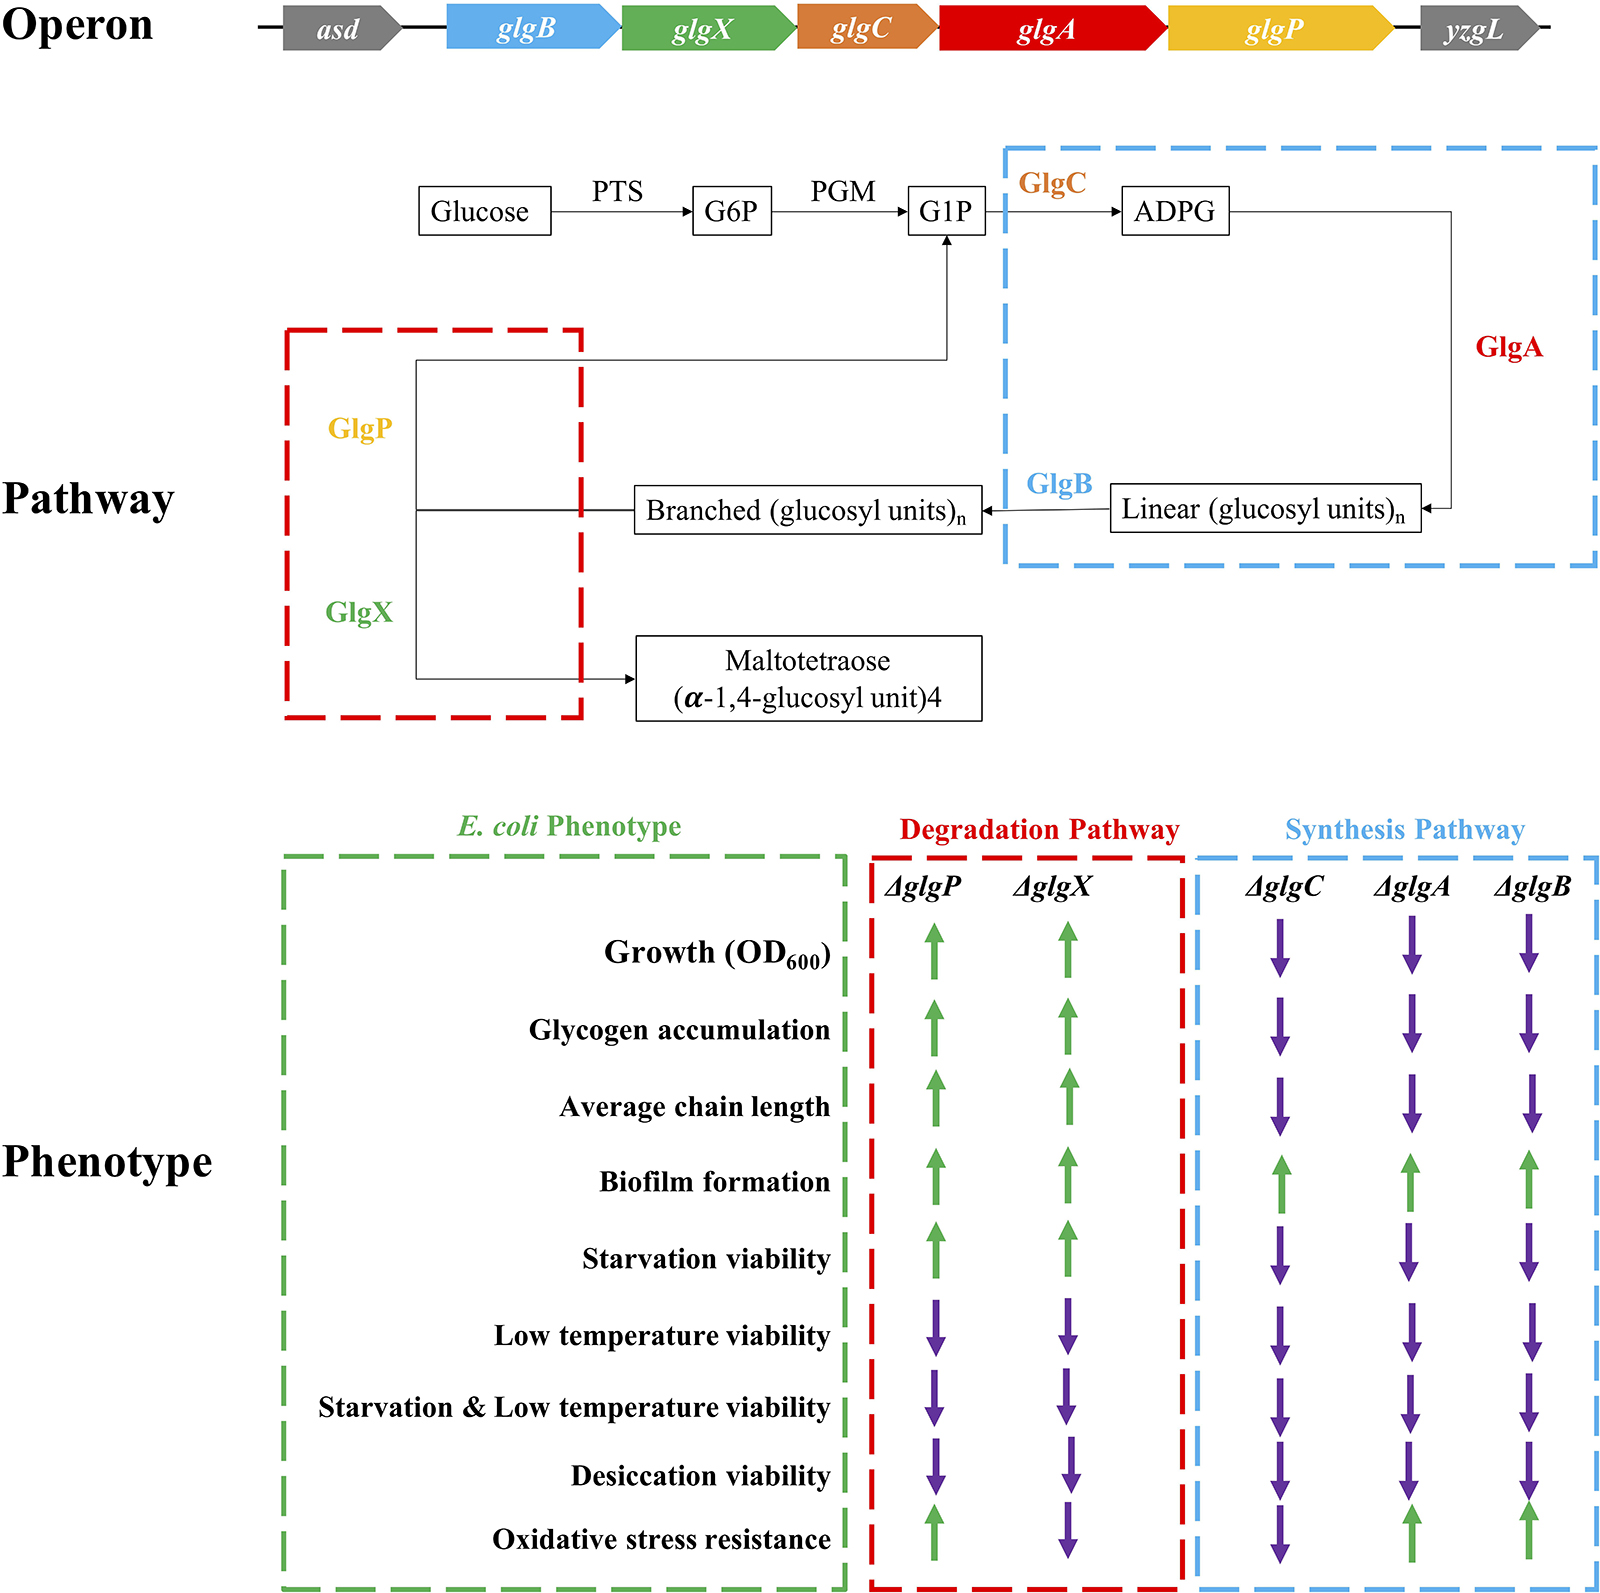
Figure 8. Schematic illustration of glgBXCAP operon and the corresponding protein functions in E. coli growth, glycogen accumulation and structure, biofilm formation, and environmental stress endurance. ↑: increment when compared to wild-type BW25113 (green arrow); ↓: decrement when compared to wild-type BW25113 (violet arrow).
Conclusion
Taken together, this study systematically and comparatively investigates how single gene deletion in the important and classical glgBXCAP operon influences the physiological activities of E. coli. Differences have been identified in terms of growth rate, glycogen accumulation and structure, biofilm formation, and environmental stress endurance, which confirms the importance of glycogen metabolism in bacteria. However, molecular basis for some of these phenotypic differences are still missing. Further investigation into the molecular mechanisms are needed, which could provide a better understanding of glycogen functions in bacteria.
Data Availability Statement
All datasets presented in this study are included in the article/Supplementary Material.
Author Contributions
LW conceived and designed the experiments. LW, DT, and XZ contributed to project administration. LW, MW, QL, and XK carried out the experimental work. LW, DT, MW, QL, MG, YD, XZ, and XX wrote and revised the manuscript. LW, DT, XZ, ZZ, and HY provided platform, resources, and student supervision. All authors read and approved the final manuscript.
Conflict of Interest
The authors declare that the research was conducted in the absence of any commercial or financial relationships that could be construed as a potential conflict of interest.
Acknowledgments
LW gratefully acknowledges the financial support of National Natural Science Foundation of China (No. 31900022), Natural Science Foundation of Jiangsu Province (BK20180997), Open Project from the Jiangsu Key Laboratory of New Drug Research and Clinical Pharmacy at Xuzhou Medical University (No. KFXY201905), Young Science and Technology Innovation Team of Xuzhou Medical University (No. TD202001), and Jiangsu Qinglan Project (2020).
Supplementary Material
The Supplementary Material for this article can be found online at: https://www.frontiersin.org/articles/10.3389/fmicb.2020.588099/full#supplementary-material
References
Alonso-Casajuìs, N., Dauvilleìe, D., Viale, A. M., Munþoz, F. J., Baroja-Fernaìndez, E., Moraìn-Zorzano, M. A. T., et al. (2006). Glycogen phosphorylase, the product of the glgp gene, catalyzes glycogen breakdown by removing glucose units from the nonreducing ends in Escherichia coli. J. Bacteriol. 188, 5266–5272. doi: 10.1128/jb.01566-05
Bonafonte, M. A., Solano, C., Sesma, B. A., Alvarez, M., Montuenga, L., García-Ros, D., et al. (2000). The relationship between glycogen synthesis, biofilm formation and virulence inSalmonella enteritidis. FEMS Microbiol. Lett. 191, 31–36. doi: 10.1111/j.1574-6968.2000.tb09315.x
Bourassa, L., and Camilli, A. (2009). Glycogen contributes to the environmental persistence and transmission of Vibrio cholerae. Mol. Microbiol. 72, 124–138. doi: 10.1111/j.1365-2958.2009.06629.x
Campos, M., Govers, S. K., Irnov, I., Dobihal, G. S., Cornet, F., and Jacobs-Wagner, C. (2018). Genomewide phenotypic analysis of growth, cell morphogenesis, and cell cycle events in Escherichia coli. Mol. Syst. Biol. 14:e7573. doi: 10.15252/msb.20177573
Chakravortty, D., Onyango, L. A., Dunstan, R. H., Gottfries, J., von Eiff, C., and Roberts, T. K. (2012). Effect of low temperature on growth and ultra-structure of Staphylococcus spp. PLoS One 7:e0029031. doi: 10.1371/journal.pone.0029031
Dalmasso, M., Aubert, J., Even, S., Falentin, H., Maillard, M.-B., Parayre, S., et al. (2012). Accumulation of intracellular glycogen and trehalose by propionibacterium freudenreichii under conditions mimicking cheese ripening in the cold. Appl. Environ. Microbiol. 78, 6357–6364. doi: 10.1128/aem.00561-12
Dauvilleìe, D., Kinderf, I. S., Li, Z., Kosar-Hashemi, B., Samuel, M. S., Rampling, L., et al. (2005). Role of the Escherichia coli glgX Gene in glycogen metabolism. J. Bacteriol. 187, 1465–1473. doi: 10.1128/jb.187.4.1465-1473.2005
Davies, D. (2003). Understanding biofilm resistance to antibacterial agents. Nat. Rev. Drug Discov. 2, 114–122. doi: 10.1038/nrd1008
Dedhia, N. N., Hottiger, T., and Bailey, J. E. (1994). Overproduction of glycogen in Escherichia coli blocked in the acetate pathway improves cell growth. Biotechnol. Bioeng. 44, 132–139. doi: 10.1002/bit.260440119
Esbelin, J., Santos, T., and Hébraud, M. (2018). Desiccation: an environmental and food industry stress that bacteria commonly face. Food Microbiol. 69, 82–88. doi: 10.1016/j.fm.2017.07.017
Eydallin, G., Montero, M., Almagro, G., Sesma, M. T., Viale, A. M., Munoz, F. J., et al. (2010). Genome-wide screening of genes whose enhanced expression affects glycogen accumulation in Escherichia coli. DNA Res. 17, 61–71. doi: 10.1093/dnares/dsp028
Eydallin, G., Morán-Zorzano, M. T., Muñoz, F. J., Baroja-Fernández, E., Montero, M., Alonso-Casajús, N., et al. (2007a). An Escherichia coli mutant producing a truncated inactive form of GlgC synthesizes glycogen: further evidences for the occurrence of various important sources of ADPglucose in enterobacteria. FEBS Lett. 581, 4417–4422. doi: 10.1016/j.febslet.2007.08.016
Eydallin, G., Viale, A. M., Morán-Zorzano, M. T., Muñoz, F. J., Montero, M., Baroja-Fernández, E., et al. (2007b). Genome-wide screening of genes affecting glycogen metabolism inEscherichia coliK-12. FEBS Lett. 581, 2947–2953. doi: 10.1016/j.febslet.2007.05.044
Farr, S. B., and Kogoma, T. (1991). Oxidative stress responses in Escherichia coli and Salmonella typhimurium. Microbiol. Rev. 55, 561–585. doi: 10.1128/mmbr.55.4.561-585.1991
Gehre, L., Gorgette, O., Perrinet, S., Prevost, M.-C., Ducatez, M., Giebel, A. M., et al. (2016). Sequestration of host metabolism by an intracellular pathogen. eLife 5:e12552. doi: 10.7554/eLife.12552
Goh, Y. J., and Klaenhammer, T. R. (2014). Insights into glycogen metabolism in Lactobacillus acidophilus: impact on carbohydrate metabolism, stress tolerance and gut retention. Microb. Fact. 13:94. doi: 10.1186/s12934-014-0094-3
Gusarov, I., Pani, B., Gautier, L., Smolentseva, O., Eremina, S., Shamovsky, I., et al. (2017). Glycogen controls Caenorhabditis elegans lifespan and resistance to oxidative stress. Nat. Commun. 8:15868. doi: 10.1038/ncomms15868
Jackson, D. W., Simecka, J. W., and Romeo, T. (2002a). Catabolite repression of Escherichia coli biofilm formation. J. Bacteriol. 184, 3406–3410. doi: 10.1128/jb.184.12.3406-3410.2002
Jackson, D. W., Suzuki, K., Oakford, L., Simecka, J. W., Hart, M. E., and Romeo, T. (2002b). Biofilm formation and dispersal under the influence of the global regulator CsrA of Escherichia coli. J. Bacteriol. 184, 290–301. doi: 10.1128/jb.184.1.290-301.2002
Jiang, X., Zhang, P., Li, S., Tan, X., Hu, Z., Deng, B., et al. (2016). Molecular-size dependence of glycogen enzymatic degradation and its importance for diabetes. Eur. Polym. J. 82, 175–180. doi: 10.1016/j.eurpolymj.2016.07.017
Jones, S. A., Jorgensen, M., Chowdhury, F. Z., Rodgers, R., Hartline, J., Leatham, M. P., et al. (2008). Glycogen and maltose utilization by Escherichia coli O157:H7 in the mouse intestine. Infect. Immun. 76, 2531–2540. doi: 10.1128/iai.00096-08
Kandror, O., DeLeon, A., and Goldberg, A. L. (2002). Trehalose synthesis is induced upon exposure of Escherichia coli to cold and is essential for viability at low temperatures. Proc. Natl. Acad. Sci. U.S.A. 99, 9727–9732. doi: 10.1073/pnas.142314099
Klotz, A., and Forchhammer, K. (2017). Glycogen, a major player for bacterial survival and awakening from dormancy. Future Microb. 12, 101–104. doi: 10.2217/fmb-2016-0218
Lerner, A., Castro-Sowinski, S., Lerner, H., Okon, Y., and Burdman, S. (2009). Glycogen phosphorylase is involved in stress endurance and biofilm formation in Azospirillum brasilense Sp7. FEMS Microbiol. Lett. 300, 75–82. doi: 10.1111/j.1574-6968.2009.01773.x
Liu, Q., Zhu, Z., Wang, M., Wang, Y., Zhang, P., Wang, H., et al. (2020). Characterization of glycogen molecular structure in the worm Caenorhabditis elegans. Carbohydr. Polym. 237:116181. doi: 10.1016/j.carbpol.2020.116181
Miles, A. A., Misra, S. S., and Irwin, J. O. (2009). The estimation of the bactericidal power of the blood. Epidemiol. Infect. 38, 732–749. doi: 10.1017/s002217240001158x
Montero, M., Almagro, G., Eydallin, G., Viale Alejandro, M., Muñoz, Francisco, J., et al. (2010). Escherichia coli glycogen genes are organized in a single glgBXCAP transcriptional unit possessing an alternative suboperonic promoter within glgC that directs glgAP expression. Biochem. J. 433, 107–117. doi: 10.1042/bj20101186
Moreira, J. M. R., Gomes, L. C., Araújo, J. D. P., Miranda, J. M., Simões, M., Melo, L. F., et al. (2013). The effect of glucose concentration and shaking conditions on Escherichia coli biofilm formation in microtiter plates. Chem. Eng. Sci. 94, 192–199. doi: 10.1016/j.ces.2013.02.045
Park, J. T., Shim, J. H., Tran, P. L., Hong, I. H., Yong, H. U., Oktavina, E. F., et al. (2011). Role of maltose enzymes in glycogen synthesis by Escherichia coli. J. Bacteriol. 193, 2517–2526. doi: 10.1128/jb.01238-10
Park, K.-H. (2015). Roles of enzymes in glycogen metabolism and degradation in Escherichia coli. J. Appl. Glycosci. 62, 37–45. doi: 10.5458/jag.jag.JAG-2015_005
Sambou, T., Dinadayala, P., Stadthagen, G., Barilone, N., Bordat, Y., Constant, P., et al. (2008). Capsular glucan and intracellular glycogen of Mycobacterium tuberculosis: biosynthesis and impact on the persistence in mice. Mol. Microbiol. 70, 762–774. doi: 10.1111/j.1365-2958.2008.06445.x
Seibold, G., Dempf, S., Schreiner, J., and Eikmanns, B. J. (2007). Glycogen formation in Corynebacterium glutamicum and role of ADP-glucose pyrophosphorylase. Microbiology 153, 1275–1285. doi: 10.1099/mic.0.2006/003368-0
Seibold, G. M., and Eikmanns, B. J. (2007). The glgX gene product of Corynebacterium glutamicum is required for glycogen degradation and for fast adaptation to hyperosmotic stress. Microbiology 153, 2212–2220. doi: 10.1099/mic.0.2006/005181-0
Sekar, K., Linker, S. M., Nguyen, J., Grünhagen, A., Stocker, R., Sauer, U., et al. (2020). Bacterial glycogen provides short-term benefits in changing environments. Appl. Environ. Microbiol. 86:e00049-20. doi: 10.1128/aem.00049-20
Strange, R. E. (1968). Bacterial “glycogen” and survival. Nature 220, 606–607. doi: 10.1038/220606a0
Strydom, L., Jewell, J., Meier, M. A., George, G. M., Pfister, B., Zeeman, S., et al. (2017). Analysis of genes involved in glycogen degradation in Escherichia coli. FEMS Microbiol. Lett. 364:fnx016. doi: 10.1093/femsle/fnx016
Walther, B. A., and Ewald, P. W. (2004). Pathogen survival in the external environment and the evolution of virulence. Biol. Rev. 79, 849–869. doi: 10.1017/s1464793104006475
Wang, L., Liu, Q., Du, Y., Tang, D., and Wise, M. (2018). Optimized M9 minimal salts medium for enhanced growth rate and glycogen accumulation of Escherichia coli DH5α. Microbiol. Biotechnol. Lett. 46, 194–200. doi: 10.4014/mbl.1804.04010
Wang, L., Liu, Q., Tan, X., Wang, Z., Wang, M., Wise, M. J., et al. (2019). Molecular structure of glycogen in Escherichia coli. Biomacromolecules 20, 2821–2829. doi: 10.1021/acs.biomac.9b00586
Wang, L., Liu, Z., Dai, S., Yan, J., and Wise, M. J. (2017). The sit-and-wait hypothesis in bacterial pathogens: a theoretical study of durability and virulence. Front. Microbiol. 8:2167. doi: 10.3389/fmicb.2017.02167
Wang, L., Regina, A., Butardo, V. M., Kosar-Hashemi, B., Larroque, O., Kahler, C. M., et al. (2015). Influence of in situ progressive N-terminal is still controversial truncation of glycogen branching enzyme in Escherichia coli DH5α on glycogen structure, accumulation, and bacterial viability. BMC Microbiol. 15:96. doi: 10.1186/s12866-015-0421-9
Wang, L., Wang, M., Wise, M. J., Liu, Q., Yang, T., Zhu, Z., et al. (2020). Recent progress in the structure of glycogen serving as a durable energy reserve in bacteria. World J. Microbiol. Biotechnol. 36:14. doi: 10.1007/s11274-019-2795-6
Wang, L., and Wise, M. J. (2011). Glycogen with short average chain length enhances bacterial durability. Naturwissenschaften 98, 719–729. doi: 10.1007/s00114-011-0832-x
Wang, L., and Wise, M. J. (2019). An updated view on bacterial glycogen structure. Microbiol. Austr. 40, 195–199. doi: 10.1071/ma19056
Keywords: glycogen, bacterial viability, environmental endurance, biofilm, low temperature
Citation: Wang M, Liu Q, Kang X, Zhu Z, Yang H, Xi X, Zhang X, Du Y, Guo M, Tang D and Wang L (2020) Glycogen Metabolism Impairment via Single Gene Mutation in the glgBXCAP Operon Alters the Survival Rate of Escherichia coli Under Various Environmental Stresses. Front. Microbiol. 11:588099. doi: 10.3389/fmicb.2020.588099
Received: 28 July 2020; Accepted: 09 September 2020;
Published: 25 September 2020.
Edited by:
Alberto A. Iglesias, CONICET Coastline Agrobiotechnology Institute (IAL), ArgentinaReviewed by:
Ana Ebrecht, North-West University, South AfricaMaria Victoria Busi, Consejo Nacional de Investigaciones Científicas y Técnicas (CONICET), Argentina
Copyright © 2020 Wang, Liu, Kang, Zhu, Yang, Xi, Zhang, Du, Guo, Tang and Wang. This is an open-access article distributed under the terms of the Creative Commons Attribution License (CC BY). The use, distribution or reproduction in other forums is permitted, provided the original author(s) and the copyright owner(s) are credited and that the original publication in this journal is cited, in accordance with accepted academic practice. No use, distribution or reproduction is permitted which does not comply with these terms.
*Correspondence: Liang Wang, healthscience@foxmail.com; leonwang@xzhmu.edu.cn; Daoquan Tang, tangdq@xzhmu.edu.cn
†These authors have contributed equally to this work