 Hongjin Liu1,2†
 Linyong Hu1,2†
 Xueping Han1,2,3
 Na Zhao1,2Tianwei Xu1,2
 Li Ma1,2,3
 Xungang Wang1,2,3Xiaoling Zhang1,2,3Shengping Kang1,2,3Xinquan Zhao1,2*
 Shixiao Xu1,2*
- 1Northwest Institute of Plateau Biology, Chinese Academy of Sciences, Xining, China
- 2Key Laboratory of Adaptation and Evolution of Plateau Biota, Chinese Academy of Sciences, Xining, China
- 3College of Life Sciences, University of Chinese Academy of Sciences, Beijing, China
The rumen microbiota is strongly associated with host health, nutrient absorption, and adaptability. However, the composition, functioning and adaptability of rumen microbiota in Tibetan sheep (TS) across different phenological periods are unclear. In this study we used sequencing of the V4-V5 region of 16S rRNA, qPCR technology and metagenomics to investigate the adaption of rumen microbiota to forage in different stages of phenology. In a grassy period, due to the high nutritional quality of the forage, TS can produce high concentrations of NH3-N and short fatty acids by increasing the content of key bacteria in the rumen, such as Bacteroidetes, Prevotella, Succiniclasticum, Treponema, Butyrivibrio fibrisolvens, Fibrobacter succinogenes, Prevotella ruminicola, Ruminococcus albus, and Ruminococcus flavefaciens to aid in growth. In the withering period, there was a positive correlation between microorganisms which indicated the closely cooperation between microorganisms, and metagenomic analysis showed that the high genes (GHs and CBMs) and subtribe (GH8, GH12, GH45, GH6, GH9, GH5, GH10, GH3, GH52, GH11, GH57, CBM1, CBM4, CBM6, CBM16, CBM37, CBM13, CBM35, CBM42, CBM32, and CBM62) that encode cellulolytic enzymes were significantly increased when the host faced low quantity and quality of forage. Genes involved in metabolic pathways, fatty acid biosynthesis and biosynthesis of antibiotics were significantly enriched, which indicated that rumen microbiota could improve plant biomass deconstruction and energy maintenance in the face of nutritional deficiencies. In the regreen period, both the composition and function of rumen microbiota had obvious disadvantages, therefore, to improve the competitiveness of microorganisms, we suggest TS should be supplemented with high-protein feed. This study is of great significance for exploring the high altitude adaptability of TS.
Introduction
Plant phenology is cyclical, involving stages such as regreening and blossoming (Wolkovich et al., 2014). In China, plant phenology is an ancient discipline with a history comprising thousands of years (Chu, 1973). The Qinghai-Tibet Plateau (QTP) is known as “the roof of the word.” Changes in plant phenology have significant effects on grassland ecosystems, grazing livestock and the global carbon cycle (Xu et al., 2017b). Due to the high altitude of the QTP, its low levels of oxygen, and changeable climate, the QTP has a growing season of about 100–150 days per year. Herbage turns green in May, grassy green from June to October, and withers in November (Ding et al., 2013). In the grassy period, herbage in natural pasture is plentiful and of good quality, with high levels of protein and carbohydrate (Long et al., 1999), therefore, domestic animals usually fully graze on natural pasture. However, in the plant regreening and withering periods, although some herdsmen stable their livestock in warm sheds for supplementary feeding, the traditional nomadic “living by water and grass” still dominates, and much livestock is maintained on full grazing on natural pasture, which leads to significant weight loss in Tibetan sheep (TS) (12.4–43.7%) and Yaks (25–30%) (Long et al., 2005; Xu et al., 2017a).
The rumen is the first chamber of a ruminant’s stomach, where microorganisms play an important role in decomposing proteins, carbohydrate, starch, sugars, and fats through anaerobic fermentation, and provide nutrients to the host in form of volatile fatty acids (VFAs) and microbial proteins (Huang et al., 2017). The rumen also harbors a dense and diverse microbial community, mainly composed of bacteria, fungi archaea and protozoa (Miron et al., 2001). Bacteria comprise 70% of the microorganisms, playing an important role in the nutrition, immunity and physiological processes of the hosts (Dehority, 2003). The growth of TS has changed due to grazing on natural grassland in different phenological periods, and it is therefore questionable whether the rumen microbiota has changed. To some extent, rumen microbial communities are only temporarily stable (Jami et al., 2013), and they will change with time (Ma et al., 2019), environment (Pitta et al., 2014) and host genetic factors (Han et al., 2020). These factors change the composition and structures of rumen microbial communities, but the functioning of the microbiome may or may not change. If there is no change in microbial function, it is beneficial to maintain the adaptability of the hosts (Ley et al., 2006). However, the microbial function may change, indicating that the microorganisms had functional flexibility (Qin et al., 2020).
To date, the rumen microbial communities of many domestic livestock have been studied by using 16S/metagenomic sequencing. Many uncultured species have been found, indicating their important role in rumen fermentation in organisms like daily cow, cattle, bovine and yak (Jami et al., 2013; Jewell et al., 2015; Xue et al., 2017). TS are the dominant sheep breed, with a population of 50 million on the QTP, and are well adapted to the high altitude, cold, hypoxia, and strong ultraviolet environment of the QTP (Langda et al., 2020). The adaption of TS includes physiological adaptions such a well-developed heart and molecular regulation mechanisms, such as a mutation of EPAS1 which promotes the mean corpuscular hemoglobin concentration and mean corpuscular volume (Wei et al., 2016). However, scant research is available for deep study into the adaptability of TS with respect to rumen microorganisms. In this study, we used 16S rRNA and metagenomic sequencing techniques to characterize the rumen microbial composition and function, and to investigate the adaptability of TS during different phenological periods under full grazing. We hypothesized that due to seasonal variations in forage nutrition, the rumen microbial composition and function would change, and the microbiome in full grazing TS would have different adaption mechanisms in different phenological stages. The results of this study have implications for the understanding of the survival adaptability of TS on the QTP.
Materials and Methods
Experimental Site, Design and Sampling Date
The experiment was carried out in the Jiacang ecological animal husbandry professional cooperative of Guinan County, Qinghai province from April 2017 to December 2017. The area has a plateau continental climate with an annual average temperature of 2.3°C, and the herbage growing period is about 120 days. Generally, herbage begins to sprout in May and starts to wither in September. The main grassland type is alpine meadow, and the dominant species are Kobresia humilis and Kobresia capillifolia. Associated species are mainly members of the Compositae, Ranunculaceae, and Gramineae.
During the experiment, 10 healthy 4-year-old Tibetan male sheep with an average weight of 34.08 ± 2.94 Kg were selected from the same herd and labeled with digital ear markers (Qinghai Jingyi Information Technology Co., Ltd.; type ET-YO) and placed in an alpine meadow for annual grazing. During the forage regreen and grassy periods, TS were grazed on summer-autumn natural pasture (N35°28′∼N35°41′, E 100°42′∼100°54′), and during the forage withering period, TS grazed on winter-spring natural pasture (N35°53′∼35°55′, E 100°74′∼E 100°76′). These 10 TS had no supplementary feeding, none were pregnant, and none were exposed to antibiotics. They had free access to water during the experimental stage.
The forage and rumen fluid were collected in the regreen period (May 2), the grassy period (July 12) and the withering period (December 7). Both herbage and rumen fluid had 10 replicates.
Forage and Rumen Fluid Collection
The herbage collection methods used in this study were similar to those reported by Ma et al. (2019). Briefly, 10 quadrats (50 cm × 50 cm), with a distance between plots of more than 10 m, were randomly placed in the alpine meadow and the aboveground biomass was collected at each phenological period. The edible forage was collected, dried in a 60°C oven for 24 h, crushed and filtered through a 1 mm sieve for further dry matter nutrition analysis.
The rumen fluid collected methods were similar to those report by Liu et al. (2019). An esophageal tube with a vacuum pump was inserted through the mouth into the rumen for sampling. The rumen content was filtered by four layers sterile gauze, and approximately 30 mL of fluid was collected in each phenological period before the morning grazing. Two milliliters of fluid was stored in liquid nitrogen for later DNA extraction, 5 mL was used for pH measurement, and the rest was used for volatile fatty acid and NH3-N determination.
Determination of Forage Nutrition Composition and Rumen Fermentation Parameters
The dry matter (DM), crude protein (CP), and ether extract (EE) were measured using AOAC methods (Cunniff, 1995). Acid detergent fiber (ADF) and neutral detergent fiber (NDF) were measured using the method described by Soest (Soest et al., 1991). The pH of the ruminal fluid was measured using a portable pH meter (PHSJ-3F). The NH3-N content was quantified using a continuous flow analyzer (SEAL Auto Analyzer3, Germany), as described by Russell and Diezgonzalez (1998). The measurement of short volatile fatty acids (SVFAs) was same to that reported by Liu et al. (2019).
Quantitative Real-Time PCR (qPCR)
Genomic DNA was extracted using E.Z.N.A. stool DAN kits (Omega Bio-tek, Norcross, GA, United States) according to the manufacturer’s protocol. DNA concentration was determined using a NanoDrop 2000 (Thermo Fisher Scientific, Waltham, MA, United States) and the quality was checked using 1% agarose gel electrophoresis. The DNA was amplified using an ABI 7300 Real-Time PCR system (Thermo Fisher Scientific, United States), with fluorescence detection of SYBR® Premix Ex TaqTM II (Tli RNaseH Plus) in a 10 μL reaction system. Amplification consisted of an initial incubation at 95°C for 30 s, followed by 40 cycles of 95°C for 30 s, annealing primer at 55°C for 30 s and extending at 72°C for 30 s. The total microbial DNA was diluted to 1:10 before qPCR assay. The primers used for detection of Protozoa, Butyrivibrio fibrisolvens, Fibrobacter succinogenes, Prevotella ruminicola, Ruminococcus albus, and Ruminococcus flavefaciens are shown in Table 1. The oligonucleotides were synthesized by Takara Biotechnology CO., Ltd., Beijing China. Quantification of bacteria was depicted as a proportion of total rumen bacteria 16S V4-V5 hypervariable genes as follows:
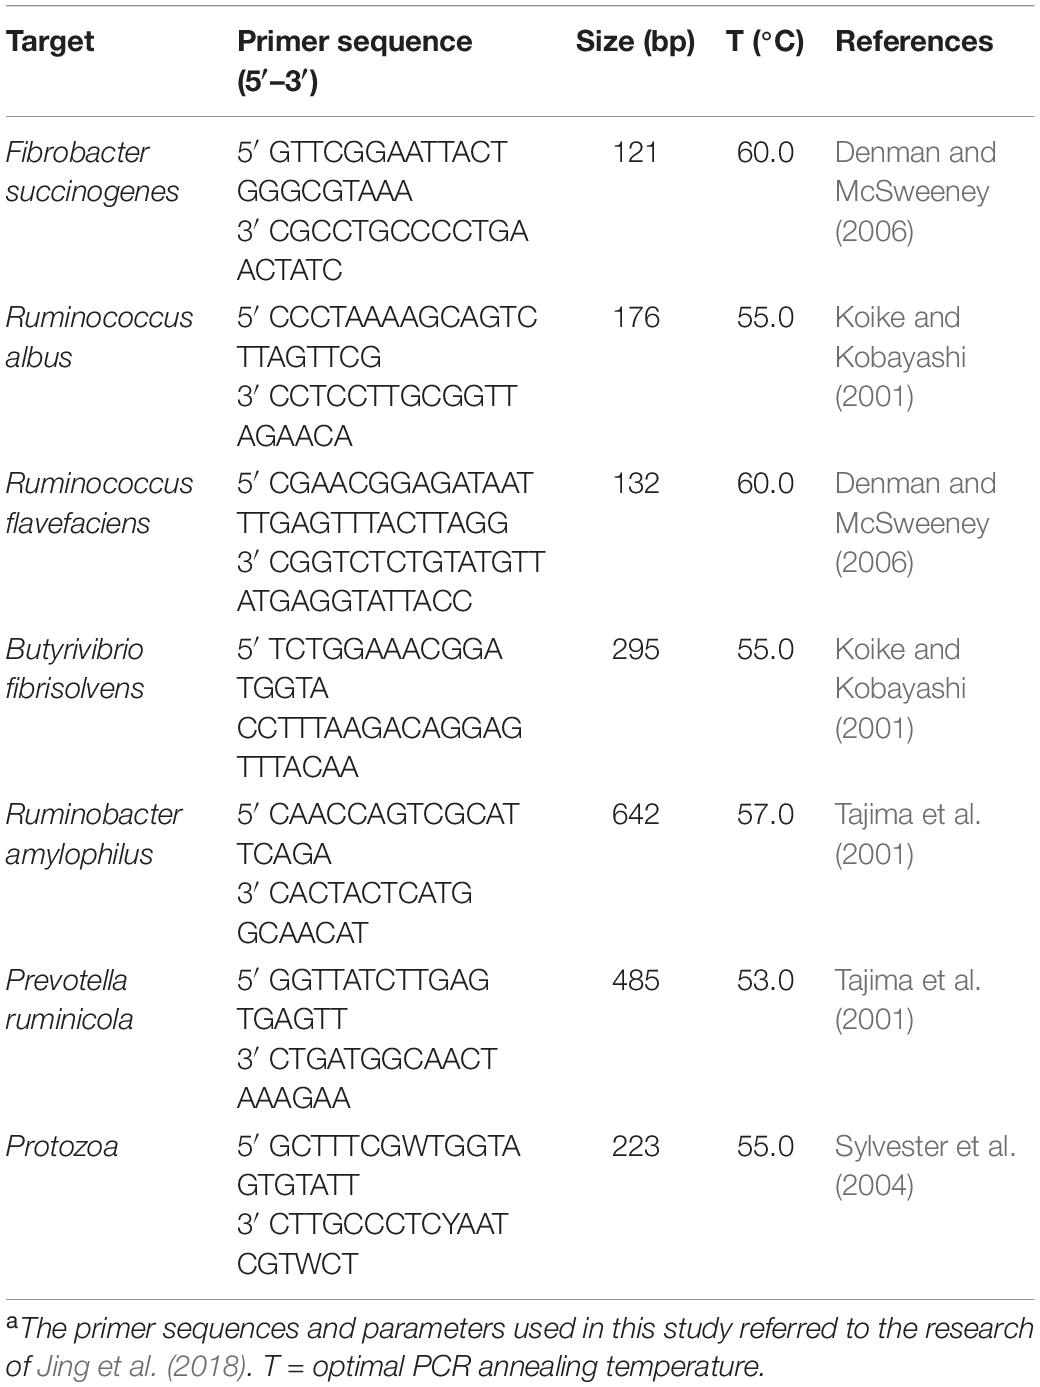
Table 1. Primers sequences and parametersa.
where Ct represents the threshold cycle.
16S rRNA Sequencing and Analysis
The DNA extraction, concentration and qualification method was as described above. The DNA was then diluted to 1 ng/μL using sterile water, and stored at −4°C for downstream processing. PCR was performed as described by Ma et al. (2019). Briefly, for each sample, PCR amplification was performed in duplicate using the universal primer 314F/806R, which can amplify the V3-V4 region of the prokaryotic ribosomal RNA gene. The 5′-end of 314F primer included 8 bp unique barcodes to split each sample. After electrophoresis on 2% agarose gels, PCR products with a bright band between 600 and 650 were mixed and purified using AxyPrep DNA Gel Extraction Kits (Axygen Biosciences, Union City, CA, United States) and quantified using QuantiFluor-ST (Promega, United States). The sequencing library was generated using a Qubit® 2.0 fluorometer (Thermo Fisher Scientific) and an Agilent Bio analyzer system. After quality assessment, the library was sequenced on an Illumina HiSeq 2500 platform (Guangzhou Gene Denovo Biotechnology Co., Ltd.), and 250 bp paired-end reads were generated.
To get high clean reads, the raw reads were filtered according to the following rules: reads containing more than 10% unknown nucleotides, and reads containing less than 80% of bases with quality more than 20 were removed. Flash (version 1.2.11) was then used to merge the clean reads as raw tags with a minimum overlap of 10 bp and mismatch error rates of 2% (Magoc and Salzberg, 2011). The raw tags with noisy sequences were filtered using the QIIME pipeline (version 1.9.0) to obtain high-quality clean tags (Caporaso et al., 2010). The clean tags then underwent chimera detection using the UCHIME algorithm to remove all chimera, and effective tags were obtained (Edgar et al., 2011). A total of 2,649,014 effective tags were kept, with over 88,000 for each sample. Filtered sequences were clustered into operational taxonomic units (OTUs) based on a 97% consensus threshold using the UPARSE pipeline (version 7.0.1001) (Edgar, 2013). Then the representative sequences were classified into organisms using the Ribosomal Database Project (RDP) classifier (version v132) (Wang et al., 2007) against the SILVA database (Pruesse et al., 2007).
Metagenomic Sequencing, Assembly, and Annotation
Fifteen samples (five samples from each phenological period) were selected for metagenomic sequencing. Genomic DNA was extracted using the CTAB method (Porebski et al., 1997). The degree of DNA degradation and potential contamination was measured using 1% agarose gels and quality was measured using a NanoPhotometer® spectrophotometer (IMPLEN, Westlake Village, CA, United States). The concentration was measured using Qubit® dsDNA Assay Kits in a Qubit® 2.0 Fluorometer (Life Technologies, Carlsbad, CA, United States). Using 1 μg DNA per sample as input material, sequencing libraries were generated using NEBNext® UltraTM DNA library Prep Kits (NEB, United States), and sequences with index codes were added to split each sample. A sonication method was used to generate around 350 bp fragmented DNA, then the DNA fragments were cleaned and extracted using the AMPure XP system. Libraries were prepared on a cBot Cluster Generation System according to the manufacturer’s protocol. After cluster generation, the prepared library was sequenced on an Illumina Hiseq2500 platform (Guangzhou Gene Denovo Biotechnology Co., Ltd.) and 150 bp paired-end reads were generated.
To get high quality clean reads, sequences with more than 50% bases with quality scores lower than 20, or reads with more than 10% unidentified nucleotides were filtered. The reads contaminated by adaptor and sheep hosts reads were removed using Bowite2 (Langmead and Salzberg, 2012). The sequence data were then assembled using MEGAHIT (Li et al., 2015), and k-mers ranged from 21 to 99 were generated for sample-derived assembly, and the unmapped reads of each sample were polled for re-assembly using MEGAHIT, to generate a mixed assembly. Subsequently, overall de novo assembly statistics were evaluated by realigning singleton reads using BWA (Li et al., 2015). MetaGeneMark (Zhu et al., 2010) was used to predict the contigs (>500 bp) from each sample, and the Open Reading Frames (ORFs) derived from the assembled contigs were clustered into a non-redundant data set using CD-HIT (Li and Godzik, 2006) with a sequence identify cut-off of 0.95 and 90% read coverage. In order to minimize the number of redundant genes, BWA was used again to count the read numbers which were generated from the re-aligned reads. Finally, a gene catalog was obtained from the non-redundant genes with gene read counts more than two. After read filtering, MetaOthello was used to generate taxonomic profiles. For gene function annotation, all unique ORFs were annotated using DIAMOND (Buchfink et al., 2015) to the KEEG, CAZY and the eggNOG functional database.
Statistical Analysis
QIIME software (version 1.9.0) was used to analyze the differences in the alpha diversity index. The R software (version 3.5.1) packages “ggplot2” and “reshape2” were used to plot rarefaction curves. The vegan and ggplot2 packages in R were used for principle coordinate analysis (PCoA), Mantel test and Variance partitioning analysis (VPA). The abundance heat map and correlation maps were plotted in R using the packages “pheatmap” and “corrplot.” The phylogenetic molecular networks (pMENS)1 were constructed based on random matrix theory (RMT)–based methods (Li H. et al., 2017) and visualized using the Cytoscape software (version 3.3.0). The bar, stack and pie charts were graphed using Origin (version 8.0). SPSS (version 17.0) was used to make single factor ANOVA analysis and Duncan’s multiple test. Effects were considered significant at P < 0.05 and results are shown as the mean ± standard error (SE).
Results
Forage Nutrition Composition and Rumen Fermentation Parameters Under Different Phenological Periods
As shown in Table 2, the CP (12.13%) and EE (1.84%) contents in the grassy stage were significantly higher than in the regreen and withering stages (P < 0.05). In contrast, the ADF content was lowest in the grassy stage and highest in the withering stage (30.21%), and NDF content increased significantly from regreen to withering stage (P < 0.05). Rumen fermentation parameters are shown in Table 3. The proportions of NH3-N, total SVFAs, isobutyric, butyric, and valeric acids were significantly higher in the grassy stage, whereas acetate and A:P ratio were significantly lower compared to the regreen and withering stages (P < 0.01). The withering stage had a significantly increased acetate proportion, but a decreased propionate proportion (P < 0.05). Rumen pH showed no significant difference, but appeared to be lower in the grassy stage (P = 0.519).
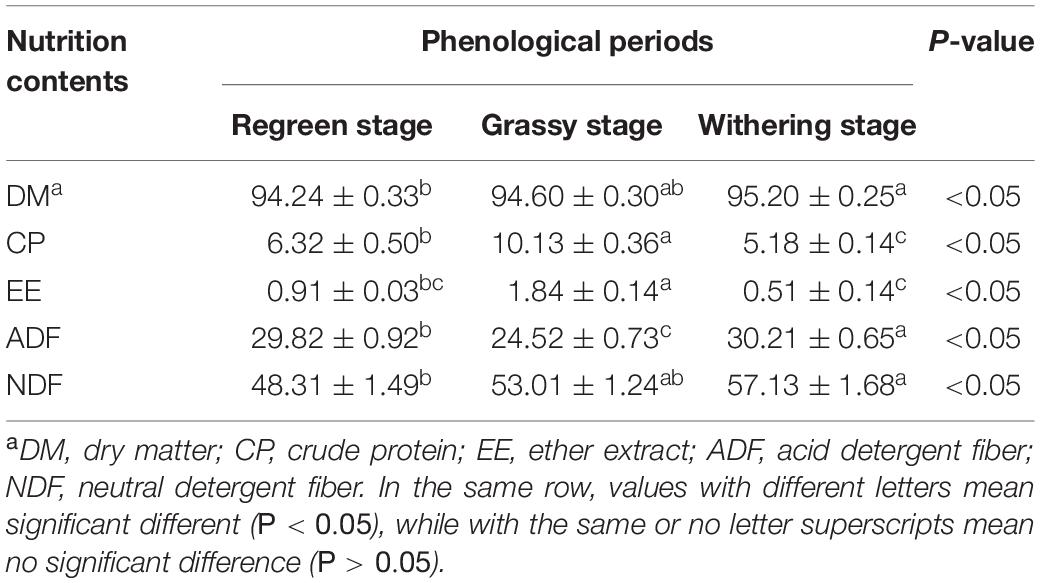
Table 2. The common forage nutrition composition in different phonological periods (air-dry basis).
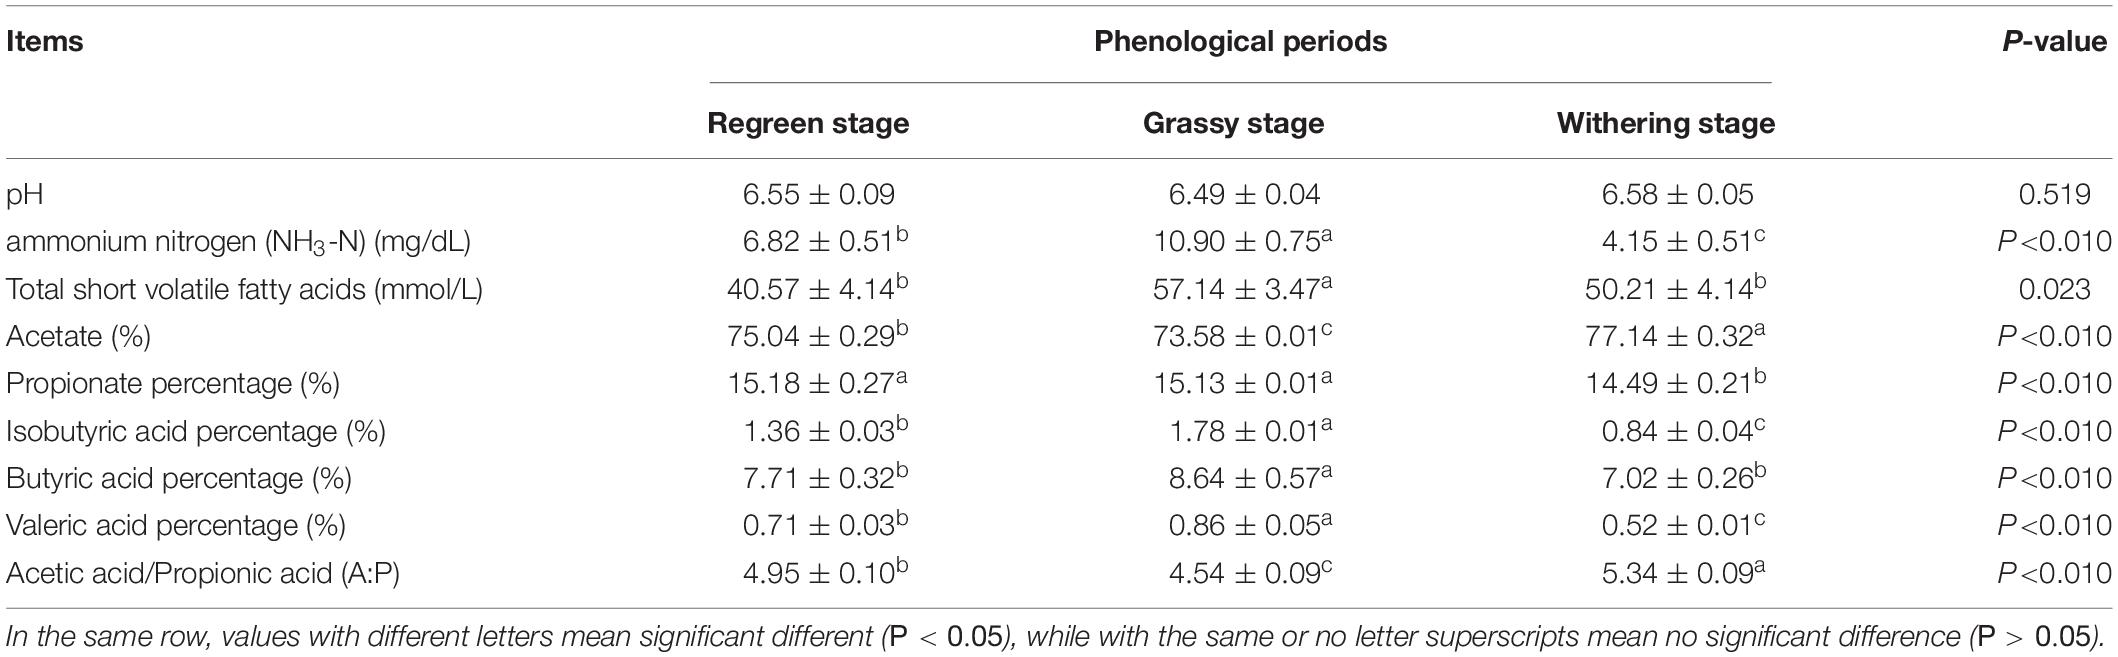
Table 3. The rumen fermentation parameters in the rumen of Tibetan sheep.
Rumen Microbiota Profiles
All rarefaction curves of observed OTUs tended to a plateau at 60,000 tags, revealing that the sequencing depth was saturated (Figure 1A). PCoA (Figure 1B) showed clear differences among the groups, which was confirmed by Anosim analysis (F = 14.85, R2 = 0.52, P < 0.01). There were a total of 2,699,094 clean reads detected and an average of 89,969 reads via 16S rRNA sequencing (Supplementary Table S1). Of the three phenological periods (Figures 1C,D), the grassy stage had the lowest bacterial diversity in evenness and richness. All indices are shown in Supplementary Table S2.
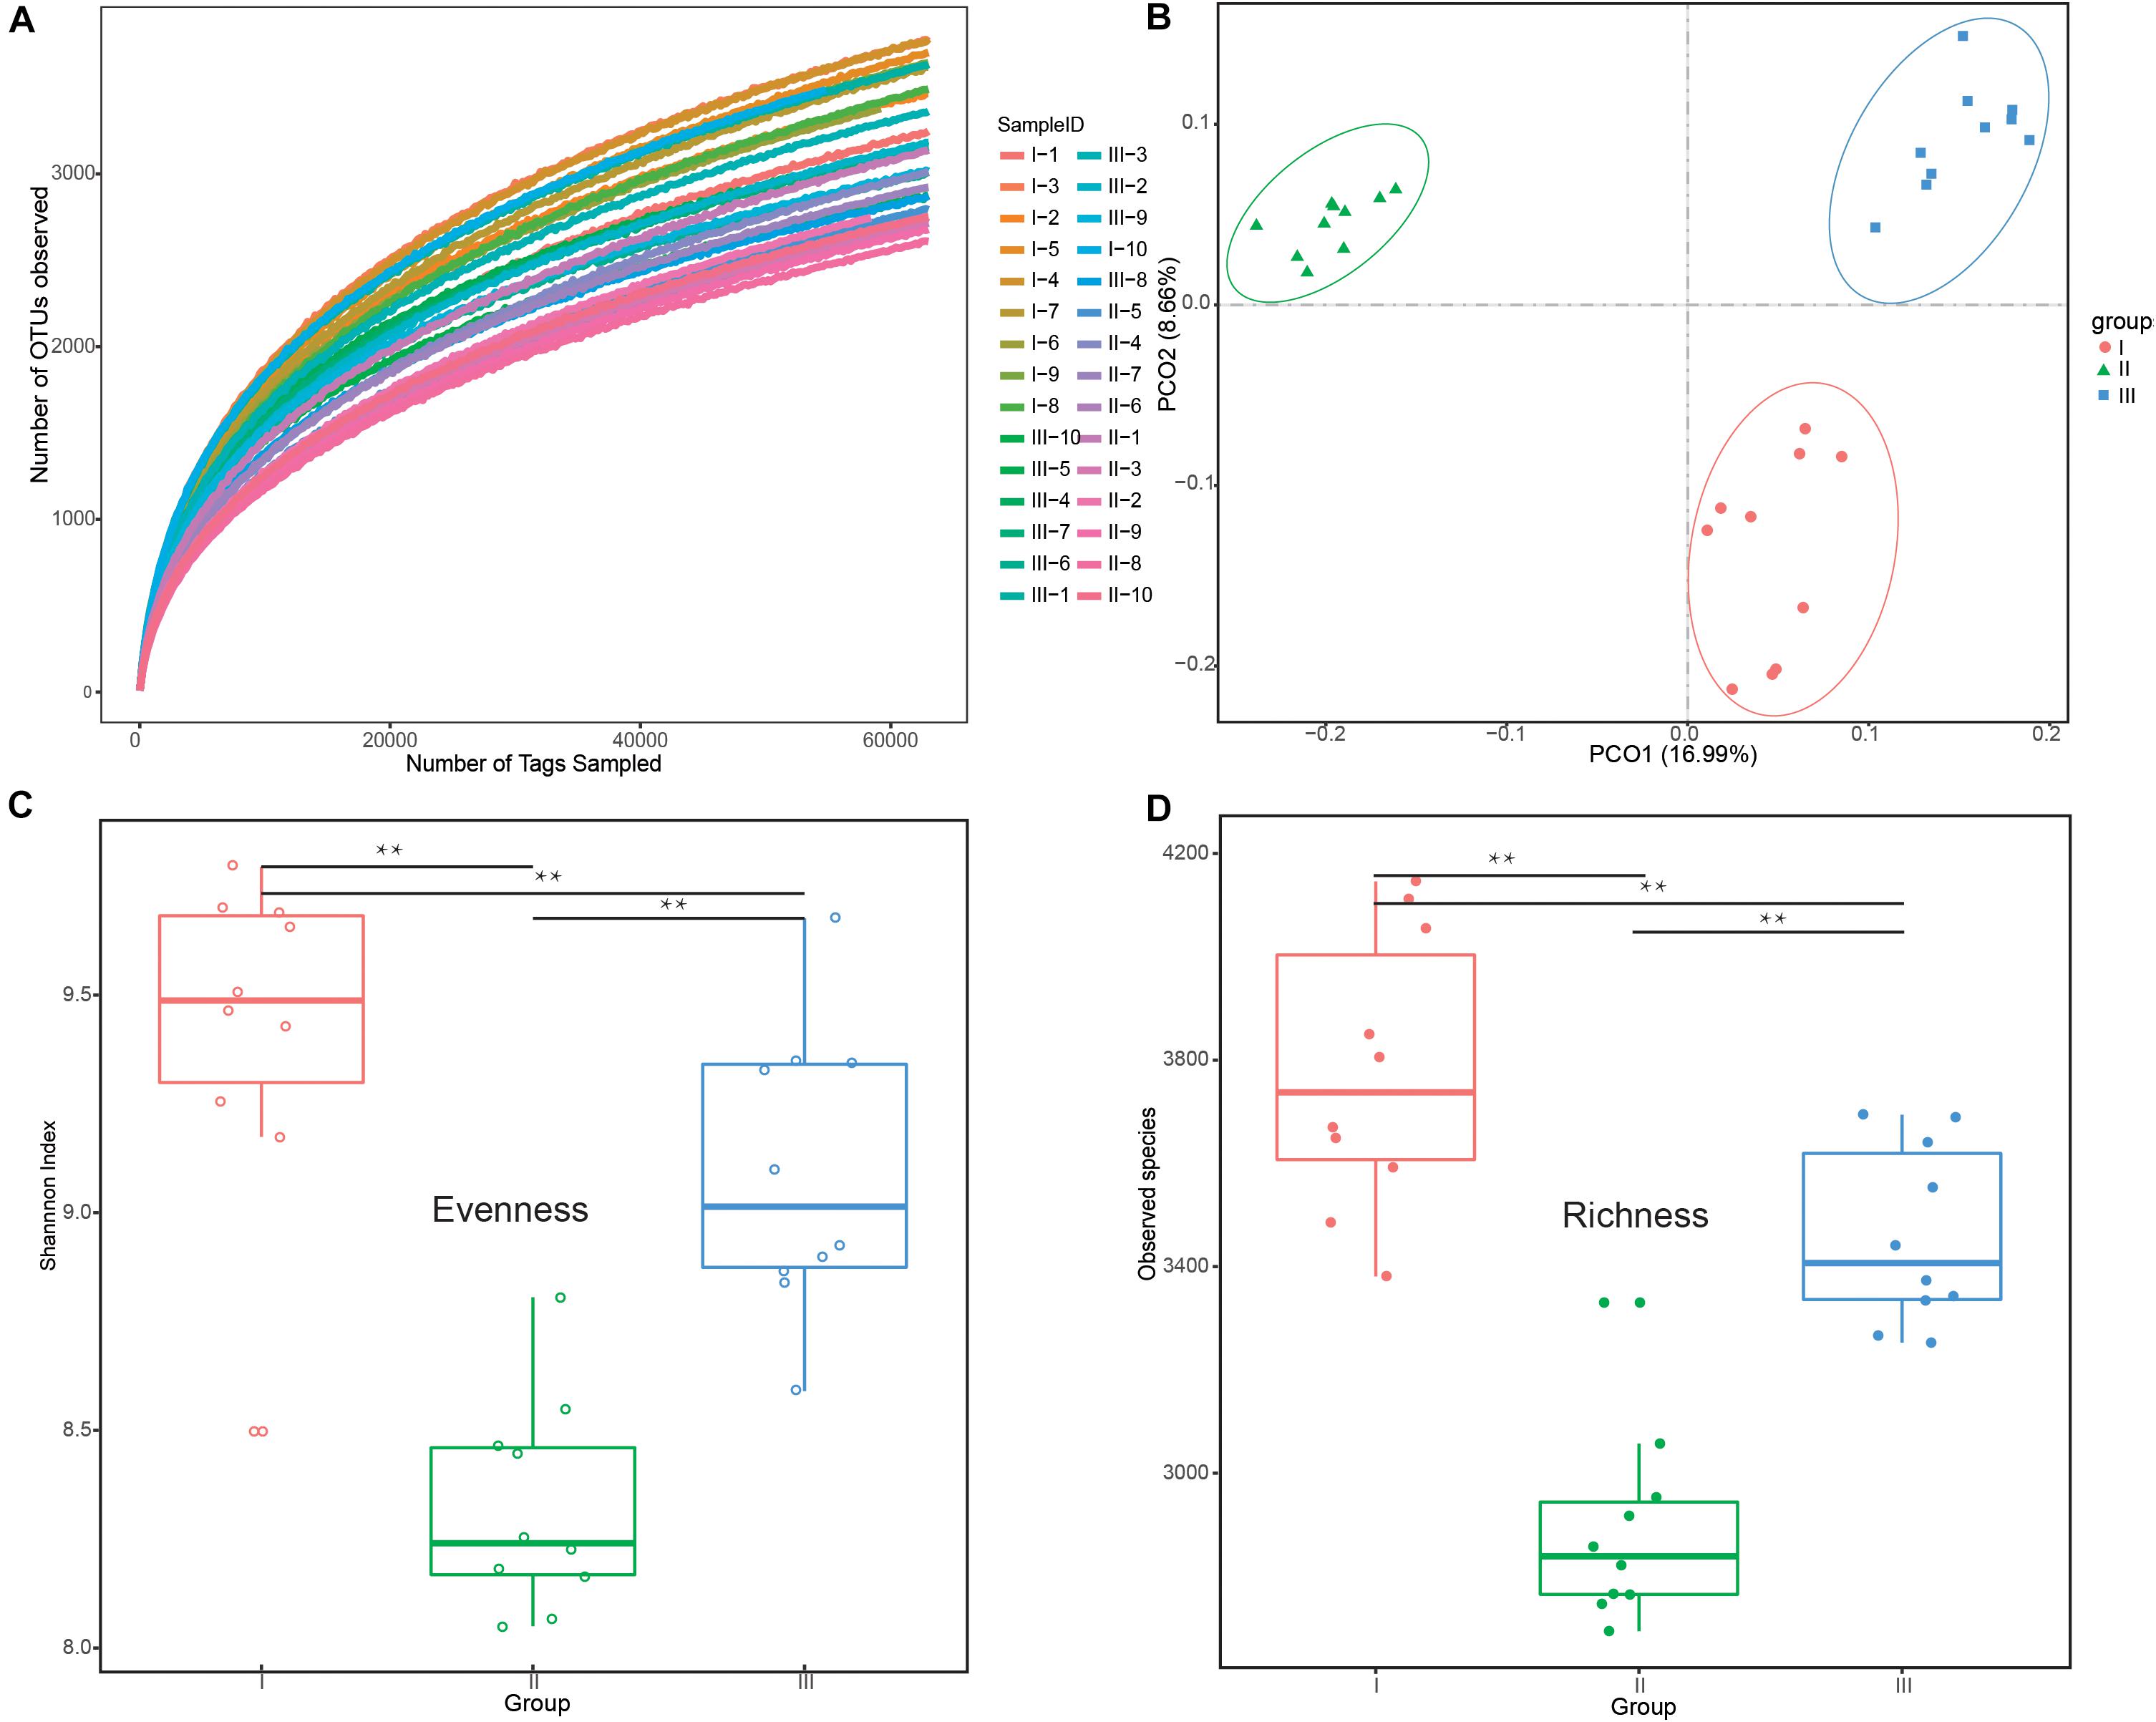
Figure 1. Differences in bacterial diversity and richness under different phenological periods. (A) Rarefaction analysis among the 30 different samples at the OTU level. (B) Principle coordinate analysis (PCoA) profile of rumen bacteria diversity (C) Evenness (Shannon’s diversity index values) at the 3% dissimilarity level. (D) Richness (number of observed species) at the 3% dissimilarity level. **P < 0.01 by Tukey test. The groups are regreen stage (I), grassy stage (II), and withering stage (III).
From the Venn profile (Figure 2), 11,711 OTUs were obtained from 30 rumen samples after data quality control. A total of 4922 (42.03% of the total OTU number) were shared by the phenological stages. Theses OTUs were associated with the phyla Bacteroidetes (42.87%), Firmicutes (35.15%), and Verrucomicrobia (6.52%). The results of annotation of unique OTUs at the phylum level in the grassy stage showed that none of these unique OTUs belong to the phyla Actinobacteri, Firmicutes or Synergistetes. In the withering stage, the unique OTUs were not annotated to Acidobacteria and Elusimicrobia, indicating the unique microbial community composition in different phenological periods.
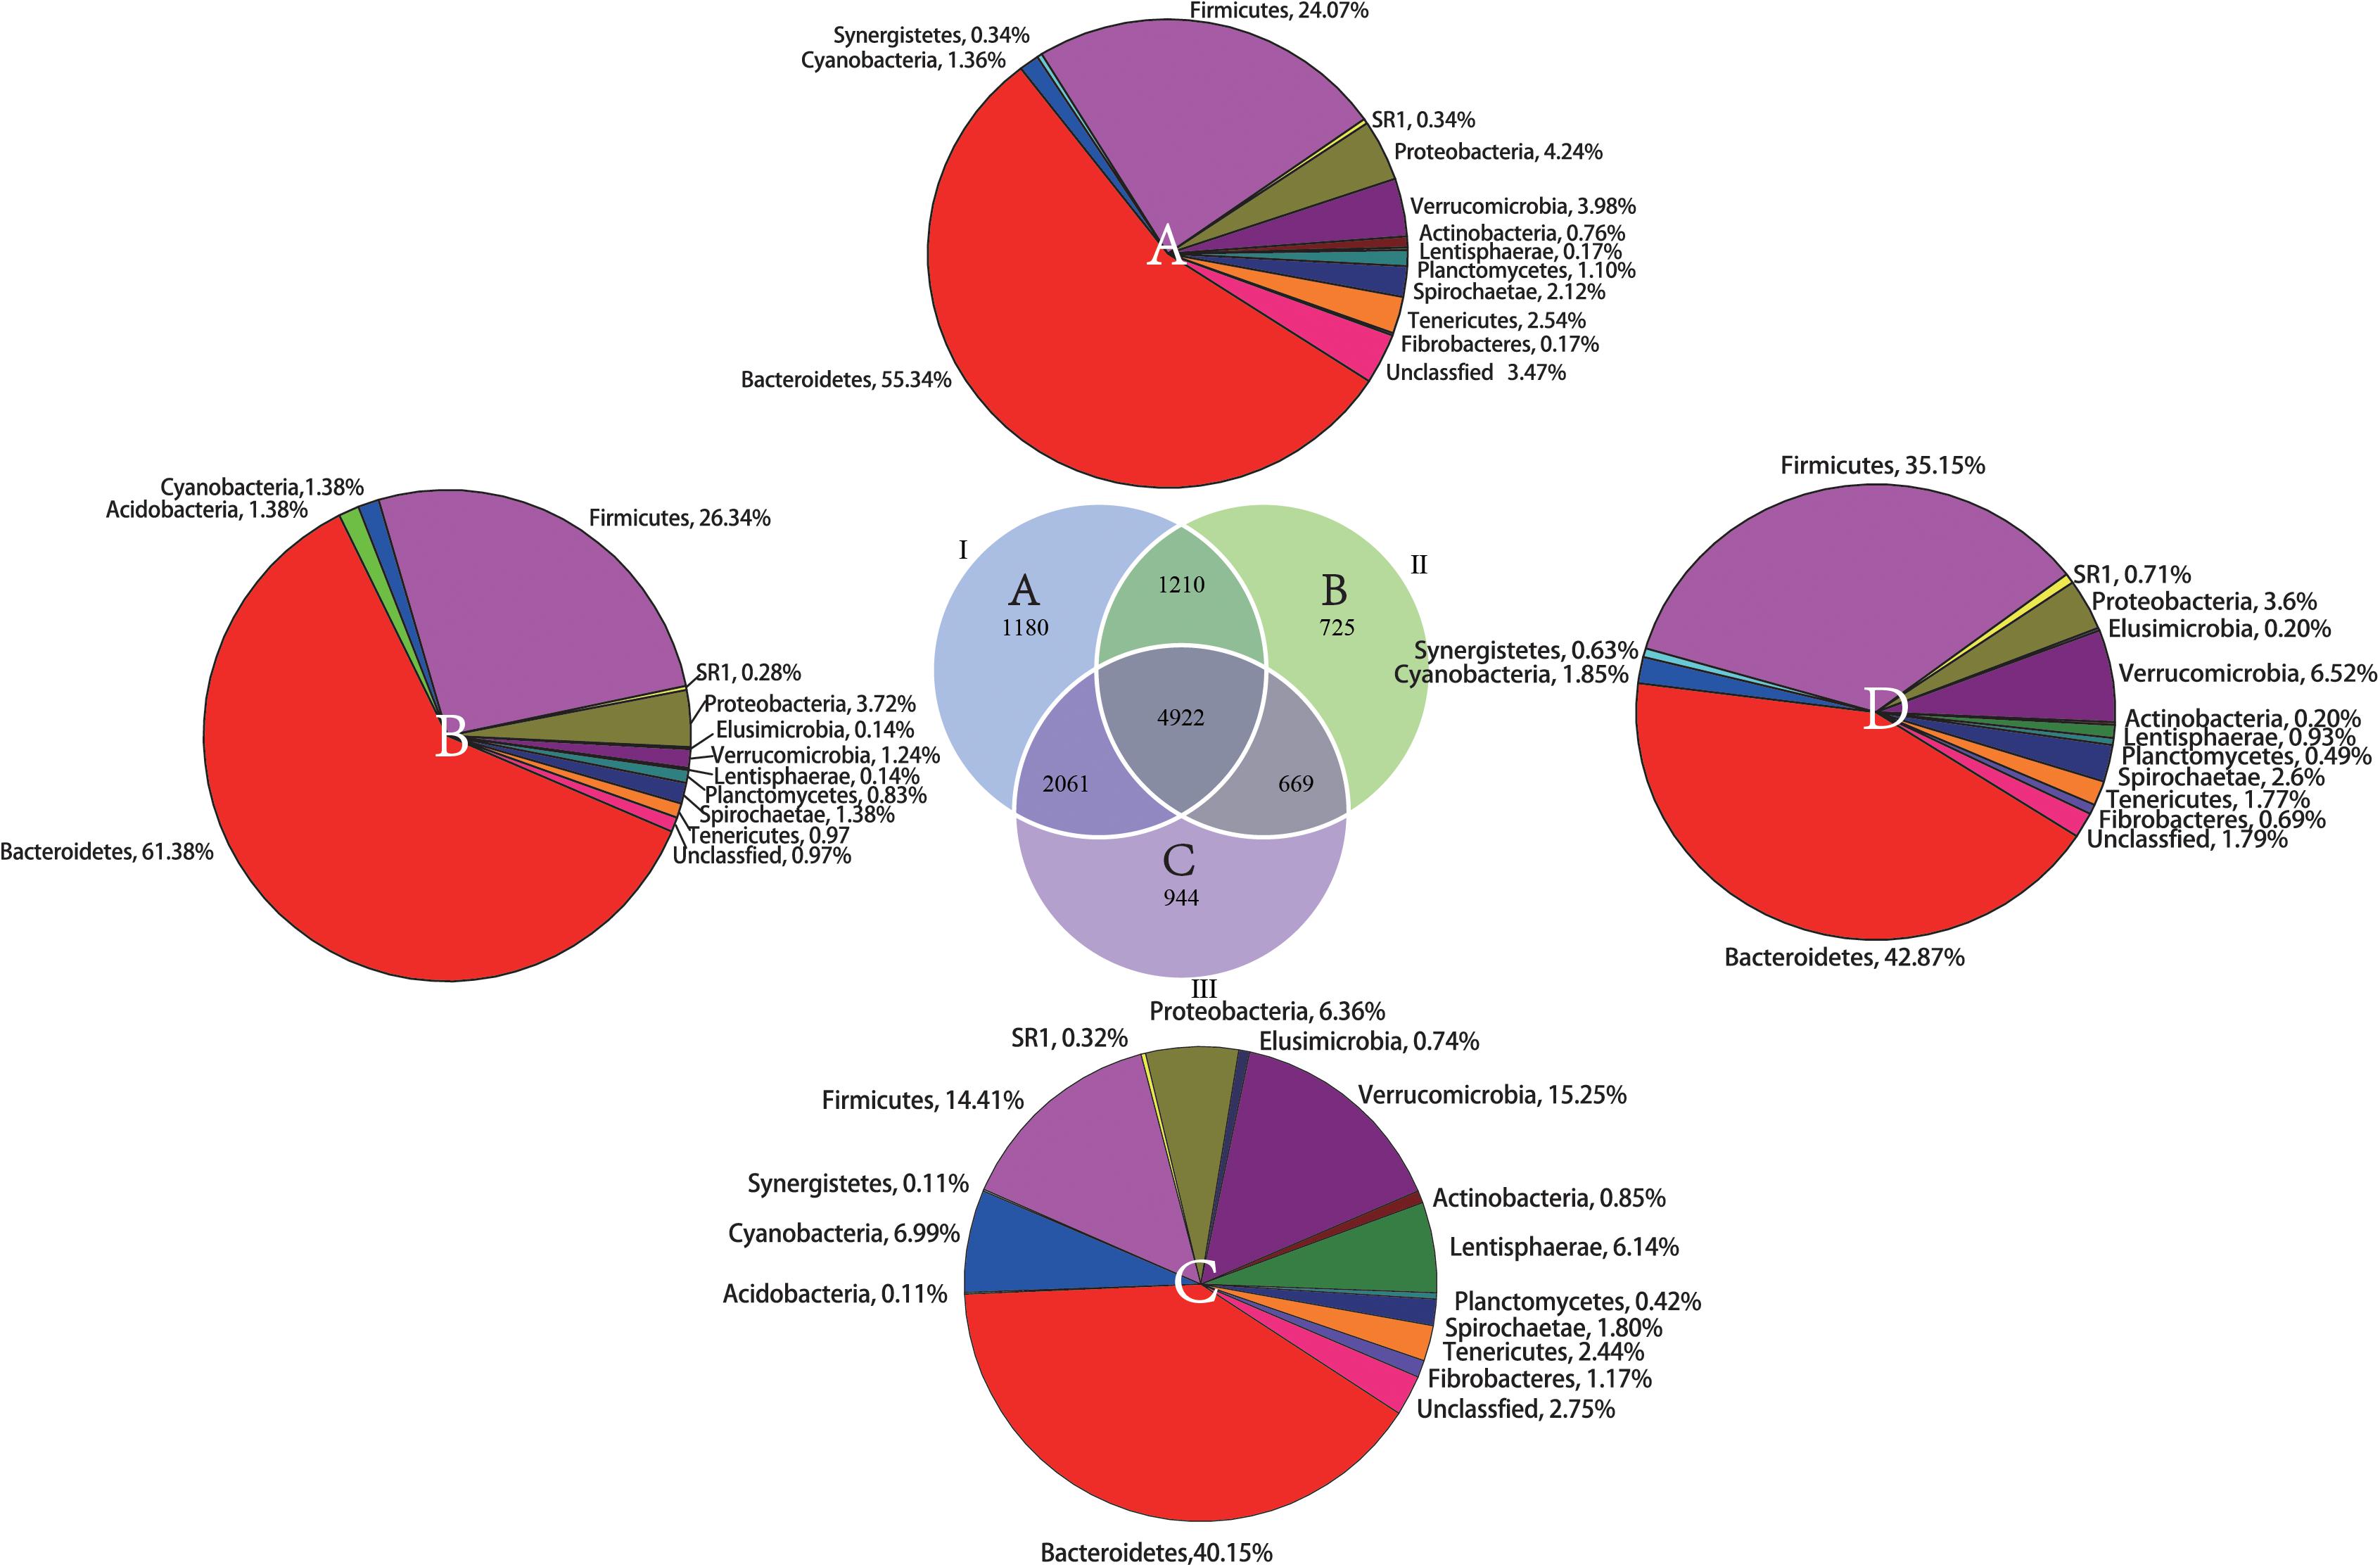
Figure 2. Shared and unique OTUs found in the rumen samples during the different phenological periods. The parenthetical numbers indicate total OTUs proportion in each group, whereas numbers in Venn diagram indicate unique (non-overlapping panels) and shared OTUs (overlapping panels). A total of 11,711 OTUs were detected. (A) unique OTUs annotated to the phylum level in the regreen stage, (B) unique OTUs annotated to the phylum level in grassy stage, (C) unique OTUs annotated to the phylum level in the withering stage. (D) The shared OTUs annotated to the phylum level among the three phenological periods.
Composition of Rumen Microbiota Structure
In the 30 rumen samples, the dominant phyla were Bacteroidetes (59.69%) and Firmicutes (22.34%) (Figure 3A and Supplementary Table S3). Significant shifts were detected in 10 phyla, including Bacteroidetes, Firmicutes, Verrucomicrobia, Cyanobacteria, Proteobacteria, Lentisphaerae, SR1, Tenericutes, Spirochaetae, Fibrobacteres, and Fibrobacteres (P < 0.01). Among these phyla, Bacteroidetes and Firmicutes had the highest relative abundance during the grassy stage, but the lowest abundance in the withering stage (P < 0.001) (Figure 3C). At the genus level (Figure 3B), Prevotella (23.46%) and members of the RC9_gut group (10.75%) were the predominant genera in all samples. Of the 16 genera that changed significantly (Figure 3D and Supplementary Table S4), of these, the relative abundances of Prevotella, Treponema Selenomonas, Succiniclasticum, and Quinella were significantly higher in the grassy stage (P < 0.01).
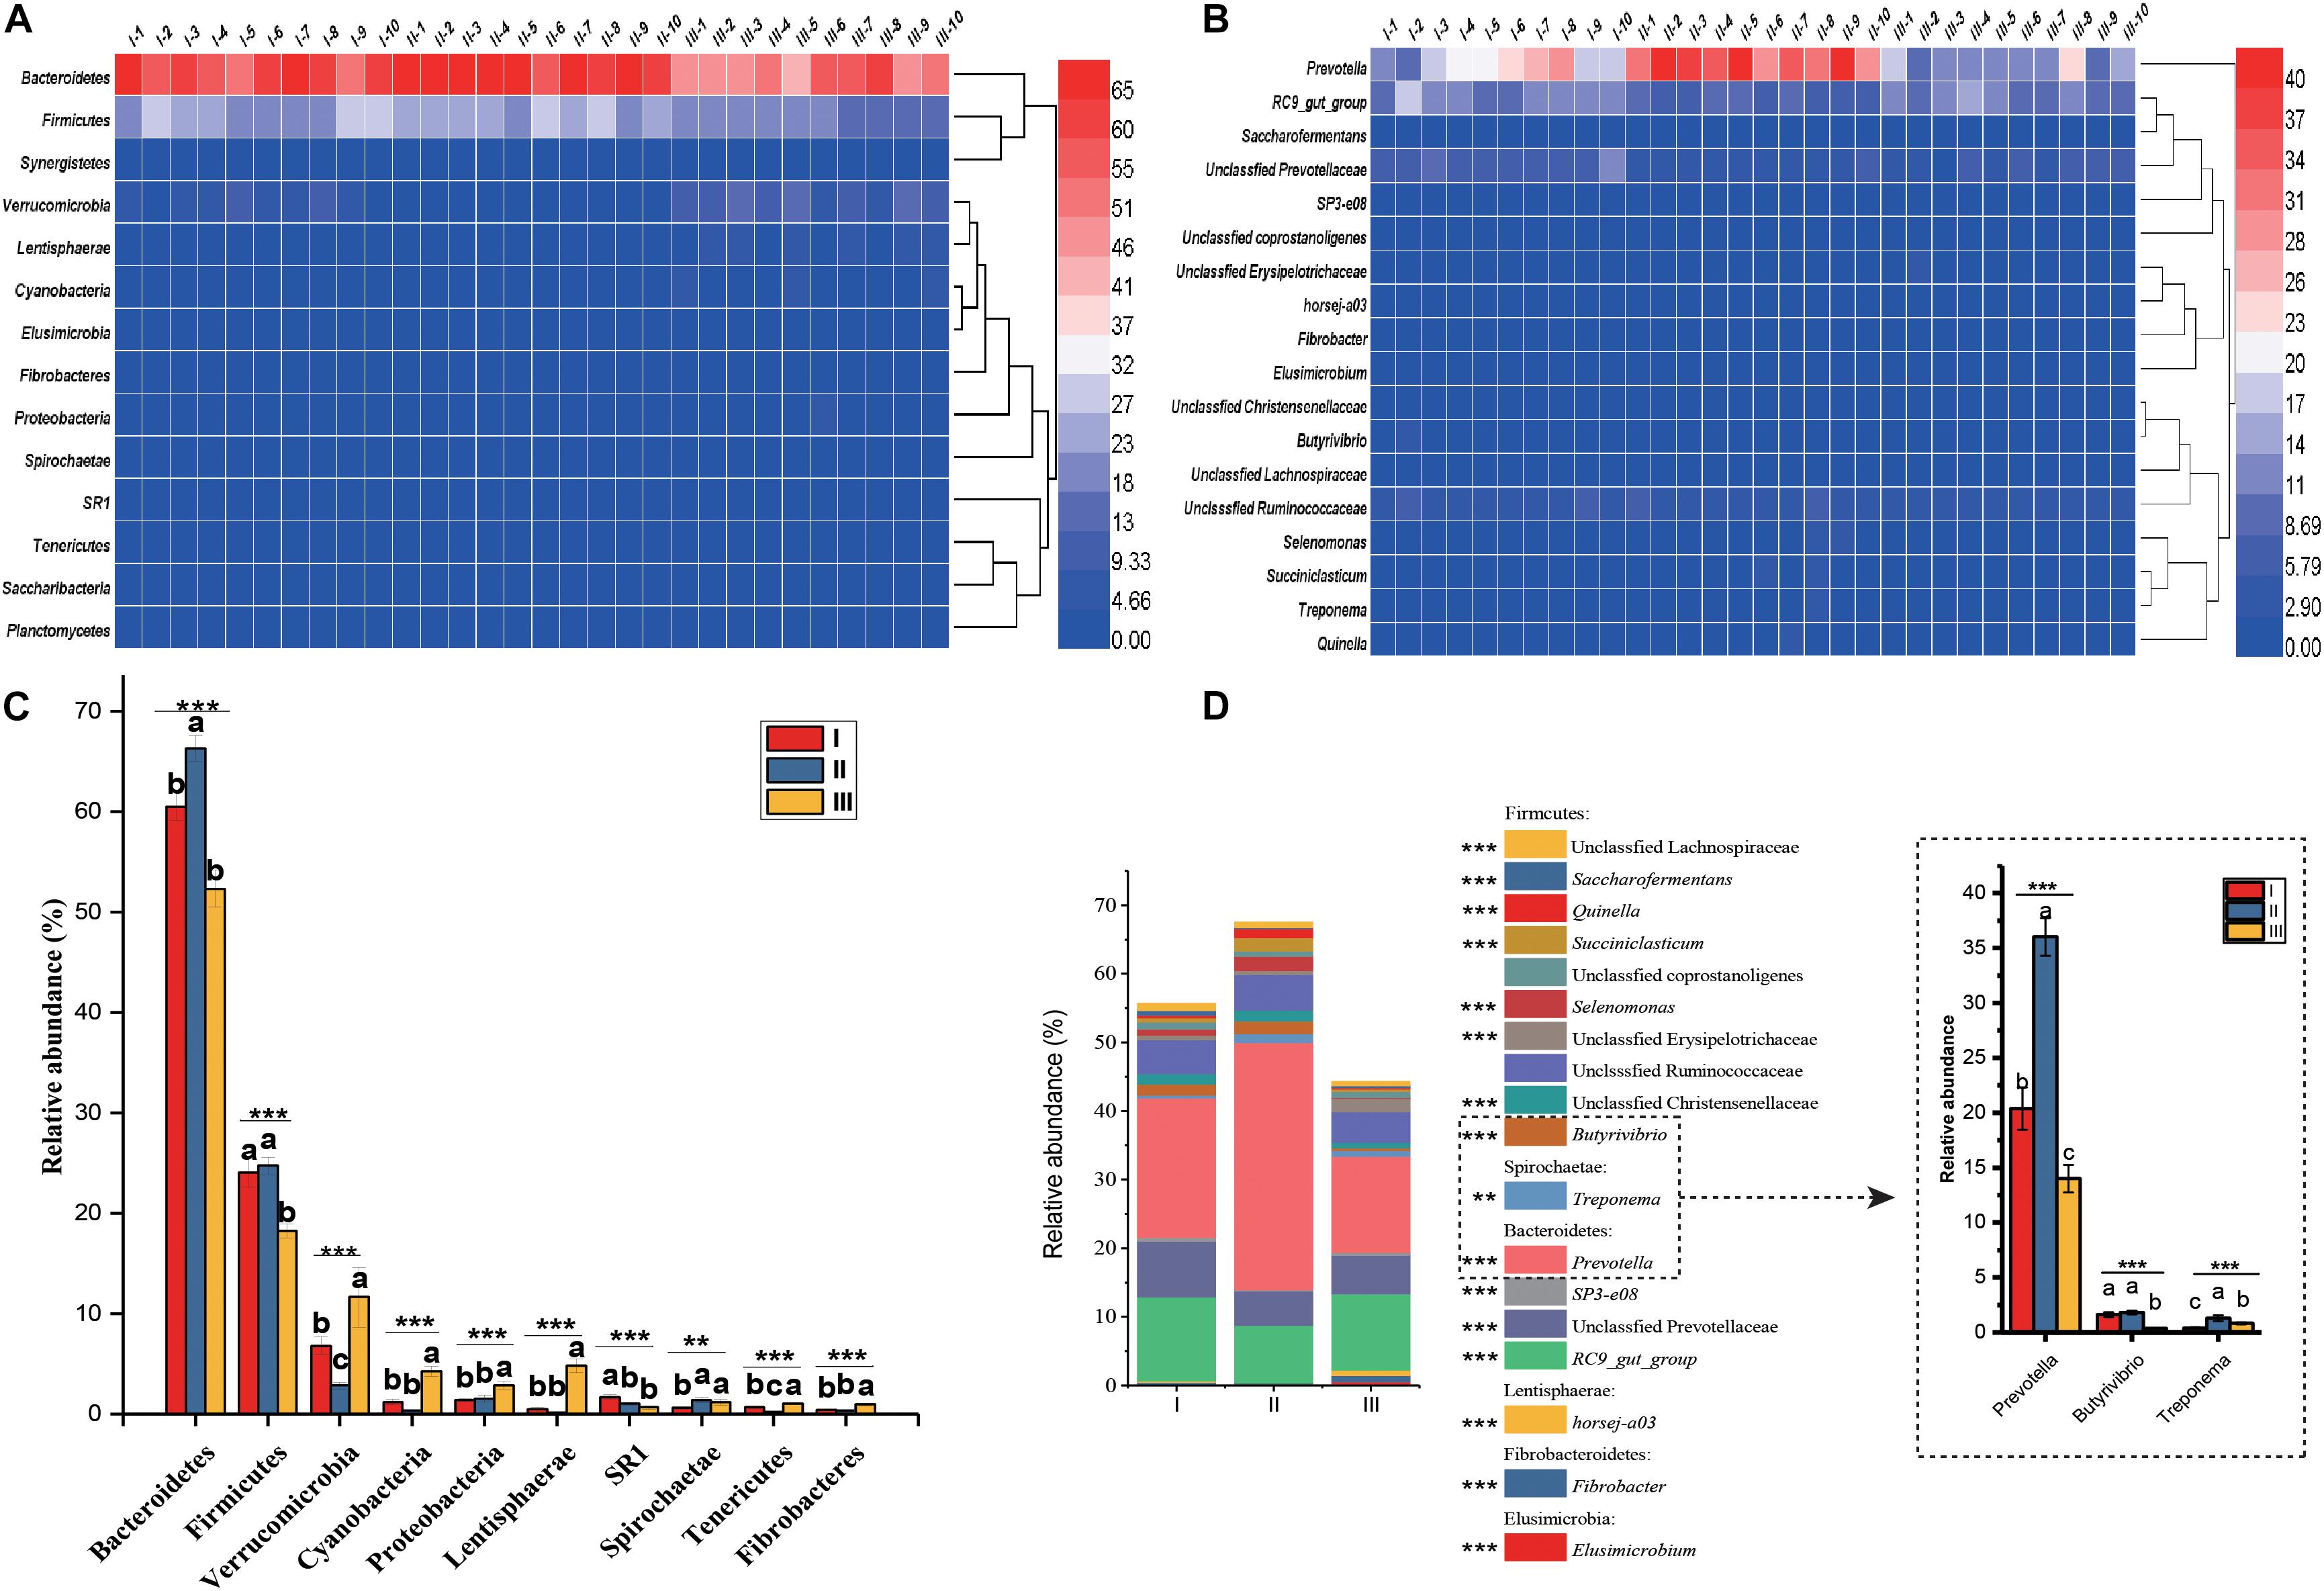
Figure 3. Distribution and significance analysis of rumen bacterial through the 30 samples. Heatmap showing the bacterial relative abundance at phylum (A) and genus (B) level. The significance analysis of rumen bacteria at phylum (C) and genus (D) level. The groups are regreen stage (I-1, 2 …10), grassy stage (II-1, 2 …10) and withering stage (III-1, 2 …10). Only the dominant phyla and genus with relative abundance more than 0.5% in one group were listed. Different letters denote statistically significant differences at P < 0.01. ∗∗P < 0.01 and ∗∗∗P < 0.001 by Tukey test.
Forage Nutrition Determined Rumen Microbial Diversity
In order to explore the factors that affected rumen microflora in different phenological periods, we analyzed the nutrition matrix distance and OTUs matrix distance using a Mantel test, as shown in Figure 4A. The forage nutrition was significantly correlated with rumen microbial community structure (P = 0.001, r = 0.694). To further determine the forage nutrition factors affecting microbial community structure, we analyzed the correlation between microorganisms and NDF (Figure 4B), ADF (Figure 4C) and CP (Figure 4D). These factors were significantly correlated with the structure of the microbial community, with CP having the greatest impact (P = 0.001, r = 0.812).
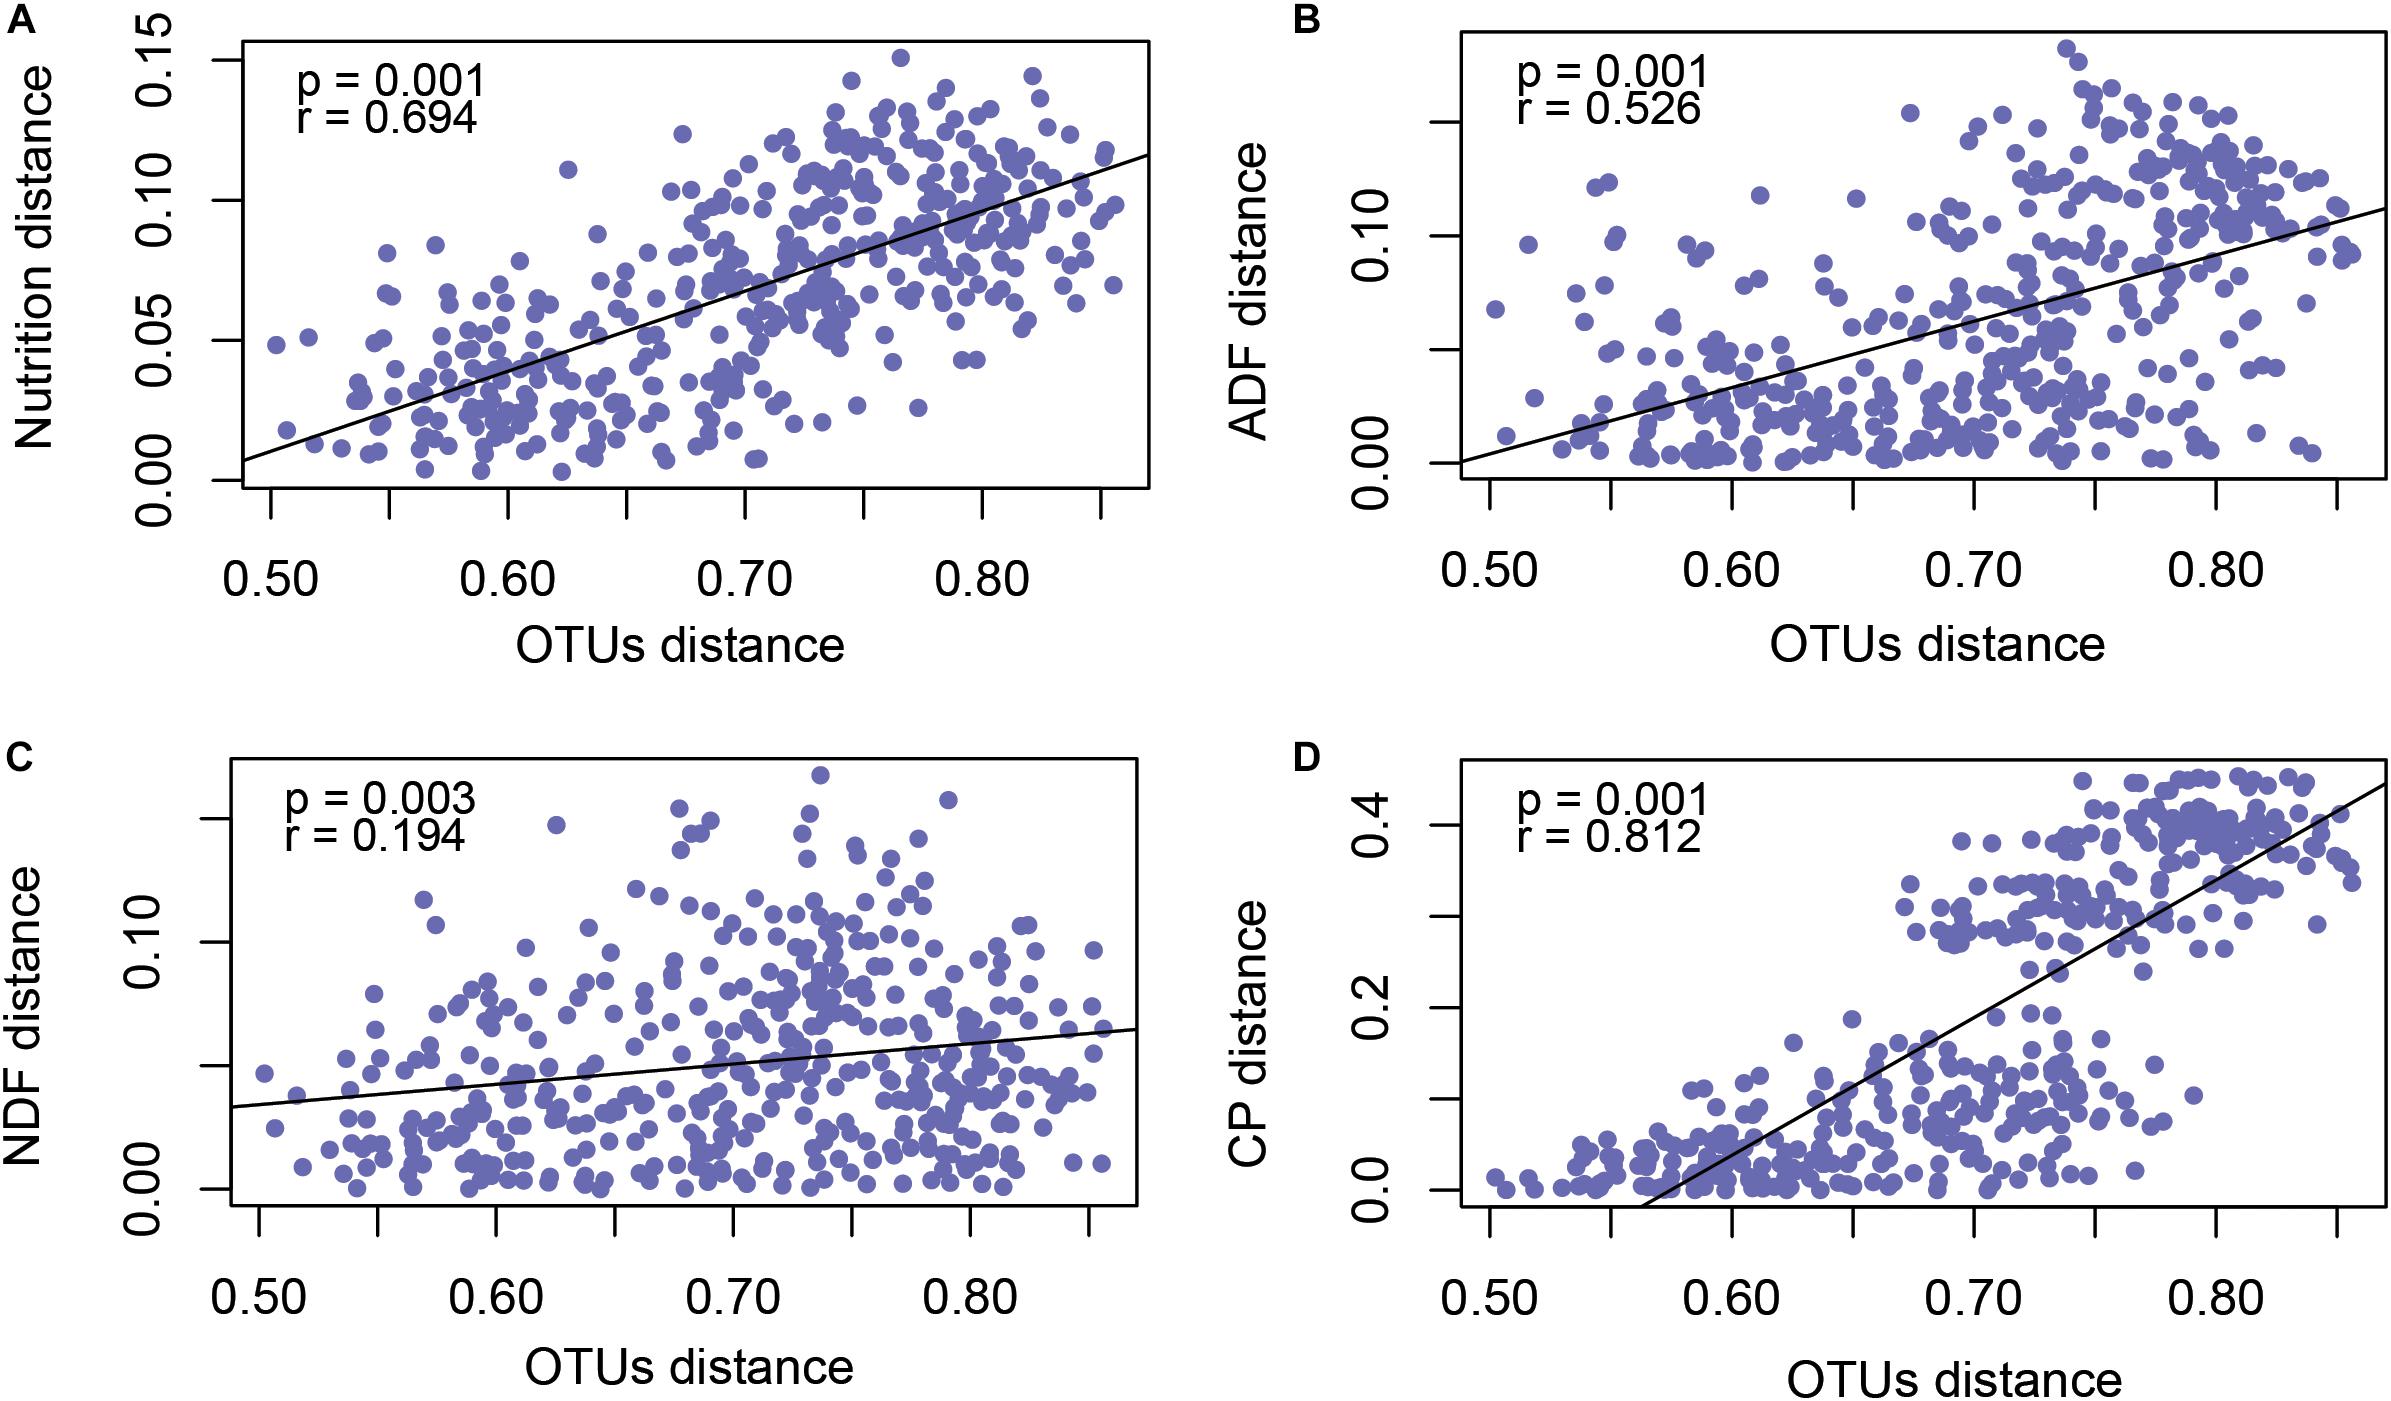
Figure 4. Mantel test revealed the correlation between forage nutrition (A), ADF (B), NDF (C), CP (D) and rumen microbiota (OTU level).
Rumen Microbial Structure Was Related to Rumen Fermentation Parameters
Mantel test analysis indicated that the bacterial communities were significantly correlated with rumen fermentation parameters (P = 0.001, r = 0.517) (Figure 5A). Redundancy analysis (Figure 5B) indicated that the synthesis of NH3-N was positively correlated with the abundance of Bacteroidetes. Firmicutes as the second largest phyla was positively correlated with NH3-N, acetate, propionate, butyrate, isobutyric, and valeric. Spearman correlation analysis revealed that the genera Prevotella, Butyrivibrio, Selenomonas, Succiniclasticum, Anaerovorax, Papillibacter, and Pseudobutyrivibrio were significantly positively correlated NH3-N (P < 0.05), indicating that these genera were sensitive to the synthesis of NH3-N. The levels of fibrolytic bacteria Prevotella, Butyrivibrio, Selenomonas, Paeudobutyrivibrio, and the plant polysaccharide degradation bacterium Treponema, were significantly positive correlated with various VFAs (P < 0.05) (Figure 5C).
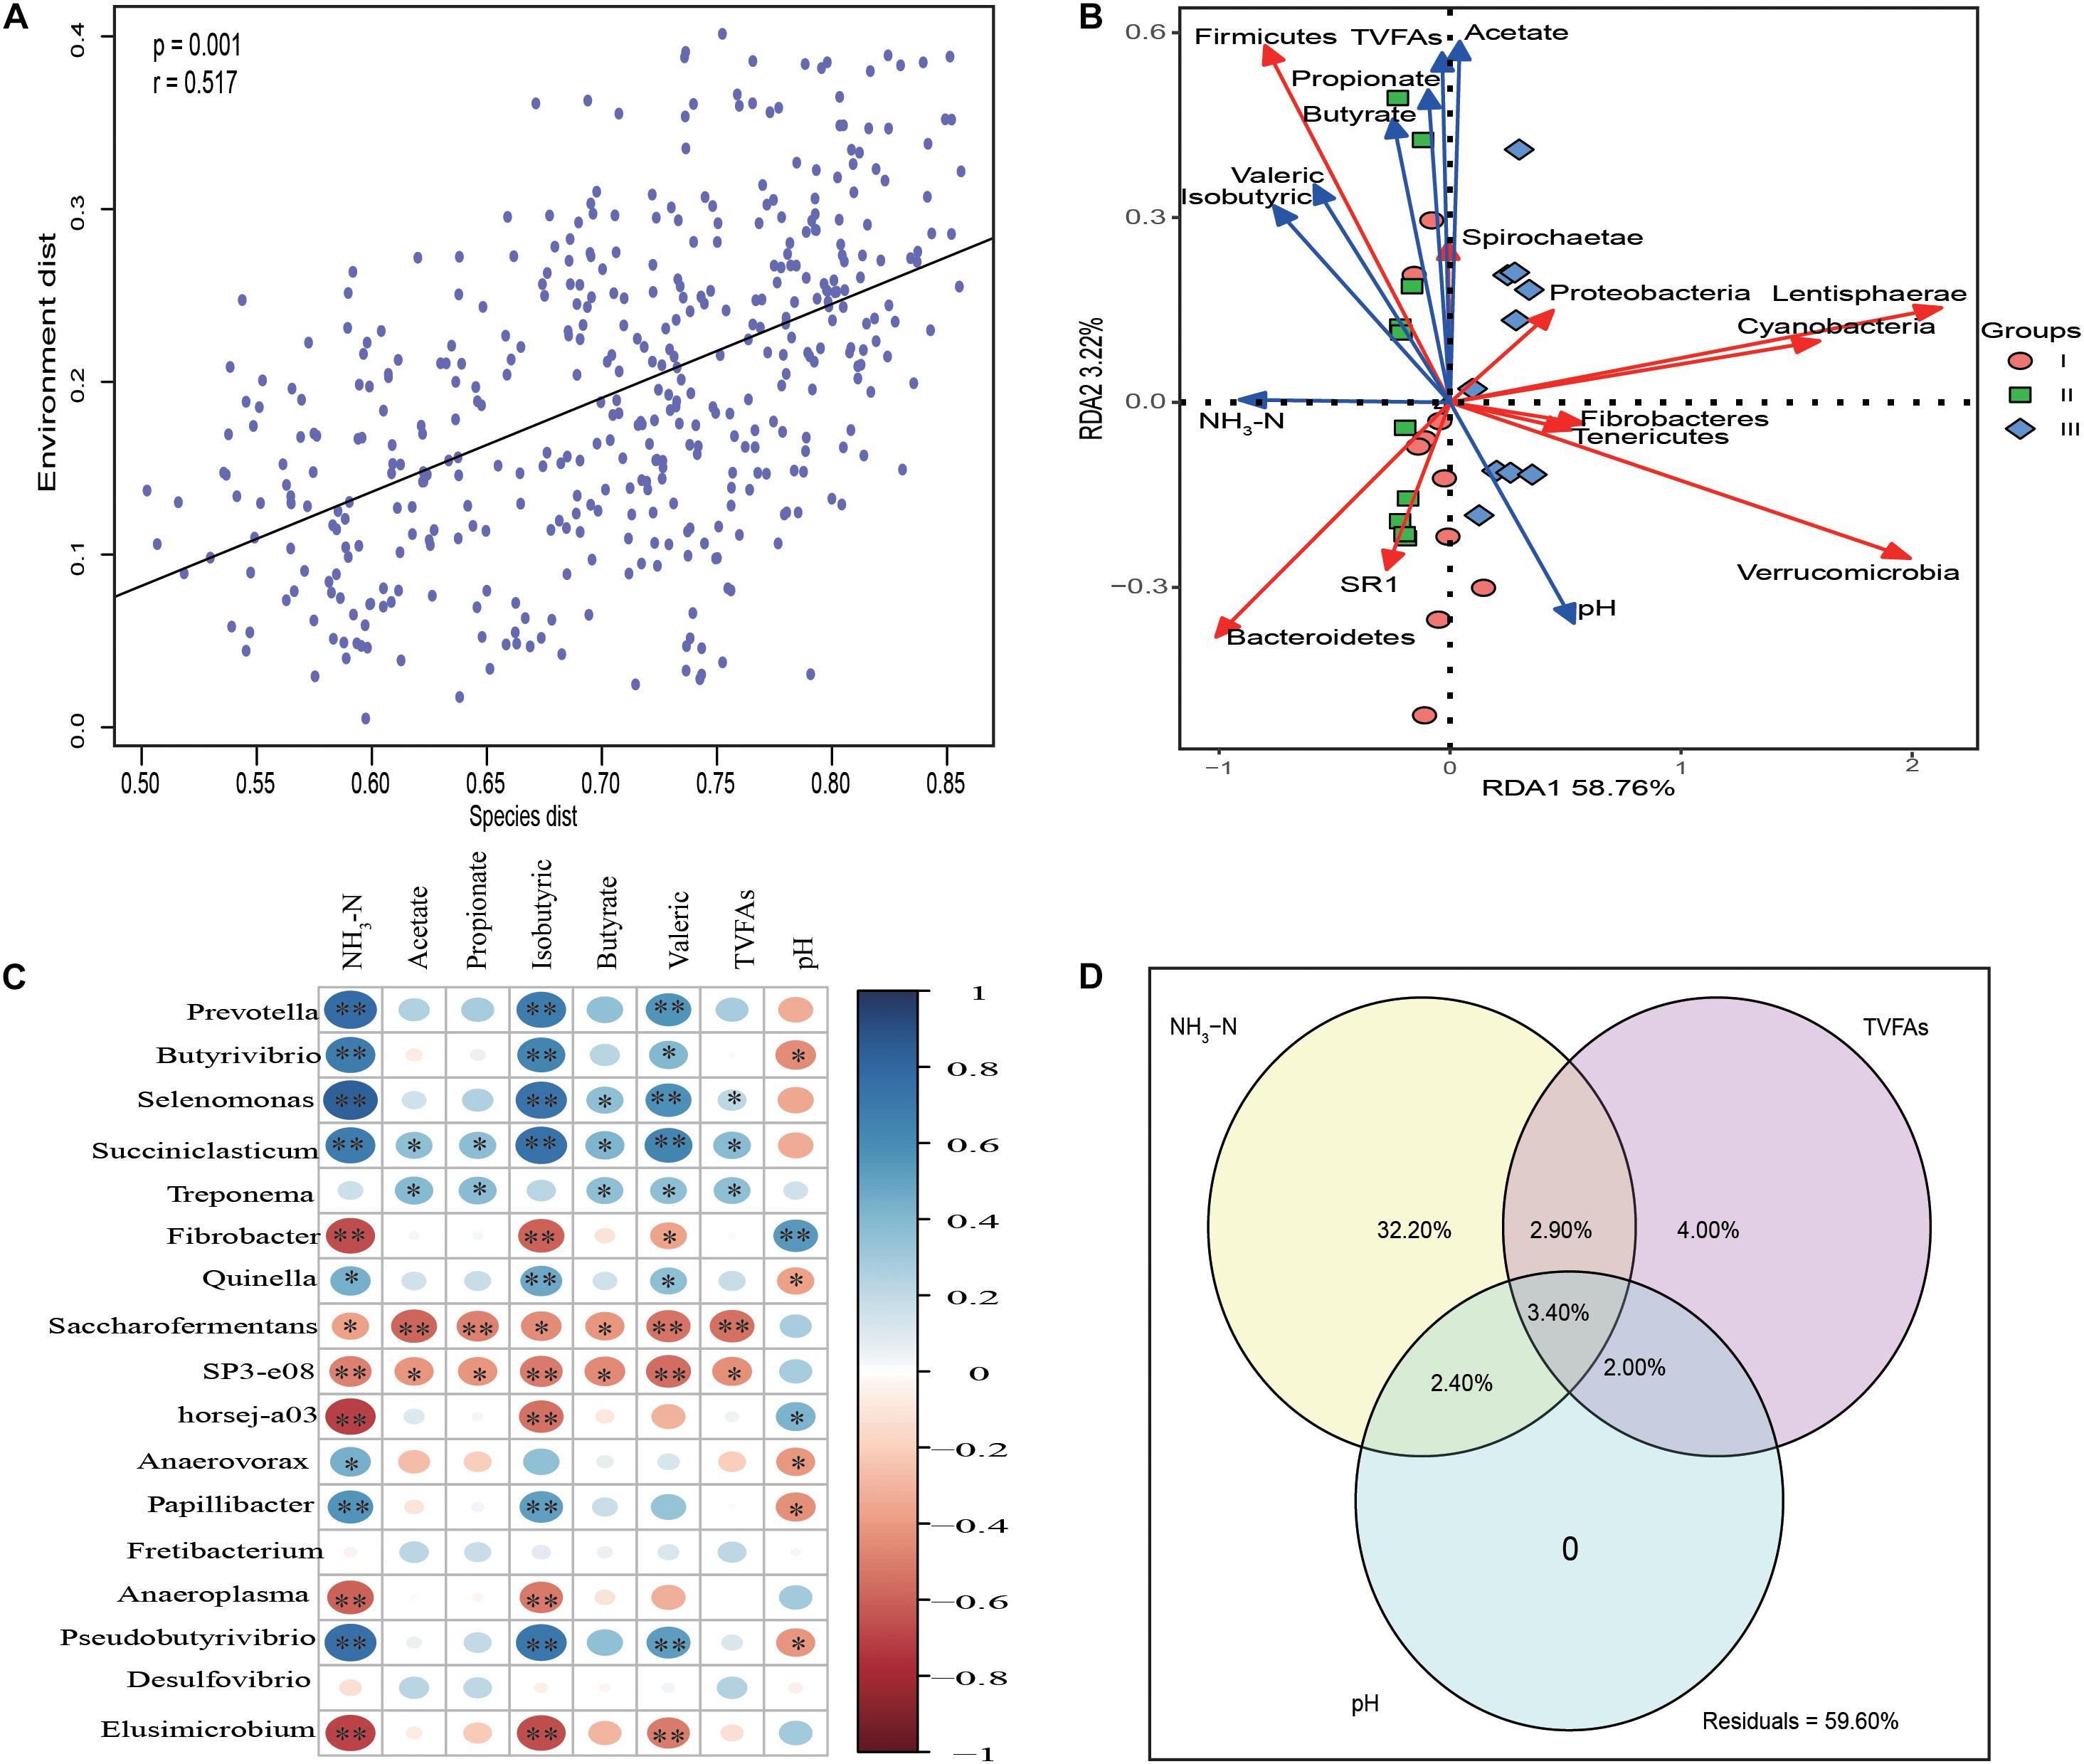
Figure 5. Statistic analysis of the relationship between rumen bacteria community and fermentation parameters. (A) Mantel test analysis between bacteria communities (OTU level) and rumen fermentation parameters. (B) Redundancy analysis (RDA) of the top 10 phyla in association with rumen fermentation parameters. (C) The correlation heatmap using spearman analysis between the top 17 rumen bacteria communities and rumen fermentation parameters. (D) Variation partition analysis (VPA) of different factors to the variation of bacteria community structure in rumen samples. The relative abundance of top 17 genera whose relative abundance >0.5% in at least one group are used for spearman analysis and the relative abundance of the genera are used as input for VPA analysis.
Variance partitioning analysis (Figure 5D) showed that 41.4% of the variance in bacterial community structure could be explained by three major variables; NH3-N and total volatile fatty acids (TVFAs) could independently explain 32.2, 4% of total variation, respectively. pH had no effect on bacterial community structure. Significant interactions between NH3-N and TVFAs (6.30%), NH3-N and pH (5.80%) and TVFAs with pH (5.40%) were observed.
Network Analysis of Bacterial Communities
To understand the microbial interactions of TS rumen bacterial communities, a bacterial network for each phenological stage was constructed (Figure 6). Using the same threshold (0.85), 314, 261, and 258 links were identified for the hosts in the regreen, grassy, and withering periods, respectively. Notably, in the withering stage, the positive correlations were predominant (160 out of 258), while negative and positive correlations were almost equal in the regreen (152 and 162, respectively) and grassy stages (131 and 130, respectively). We found that the values of average degree and network density in the grassy stage were higher than those in the regreen and withering stages. However, TS in the grassy stage harbored a low level of centralization of betweenness than in the regreen and withering stages.
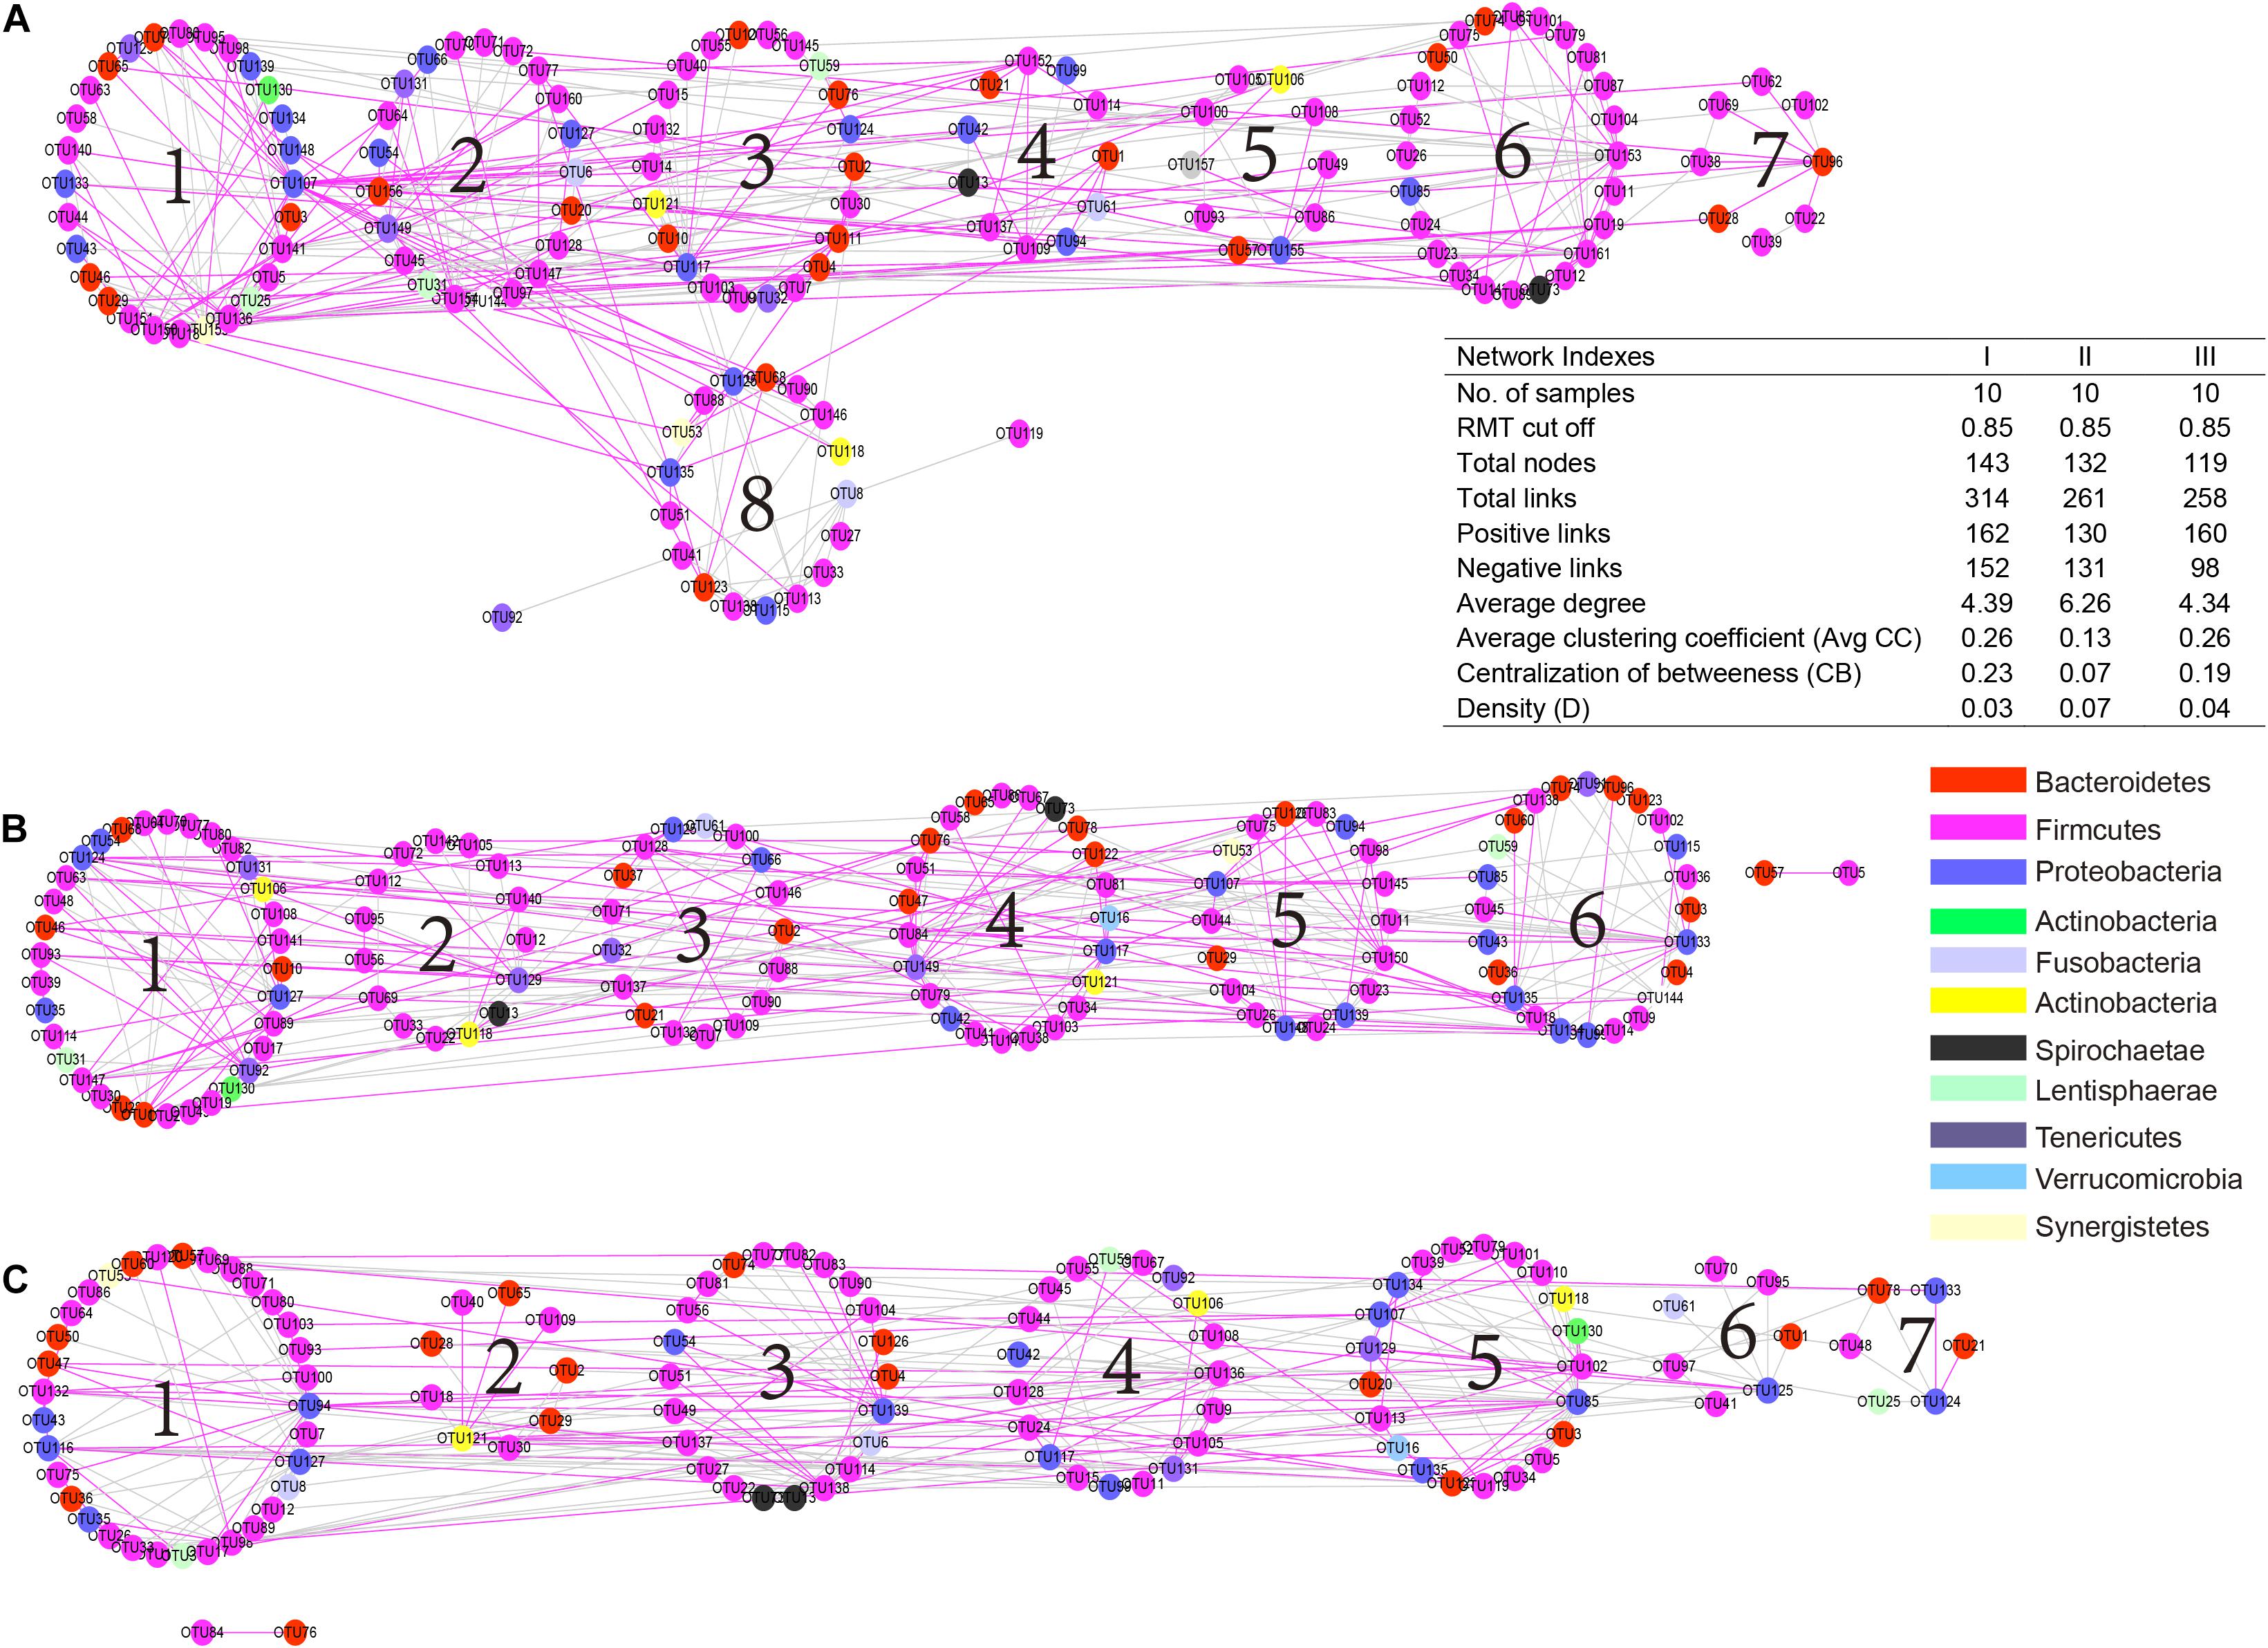
Figure 6. Comparison of rumen bacteria networks during the regreen (A), grassy (B), and withering periods (C). A highly positive correlation is described by pink color, whereas highly negative correlation by green color. Higher average degree (avg k) and density (D) mean a more complex network. A lower average clustering coefficient (avgCC) indicate that bacterial network is mainly composed of relatively isolated nodes. A low level centralization betweenness (CB) signifies a similar bacteria status and more community stability of rumen bacteria. The serial number indicates the number of modules in each group.
Quantitative Analysis of the Major Cellulose Decomposing Bacteria
As shown in Table 4, the number of rumen protozoa in the grassy stage were significantly higher than in the regreen and withering stages (P < 0.05). The numbers of B. fibrisolvens, F. succinogenes, P. ruminicola, and R. flavefaciens in the grassy stage were significantly higher than that of other two stages (P < 0.05).
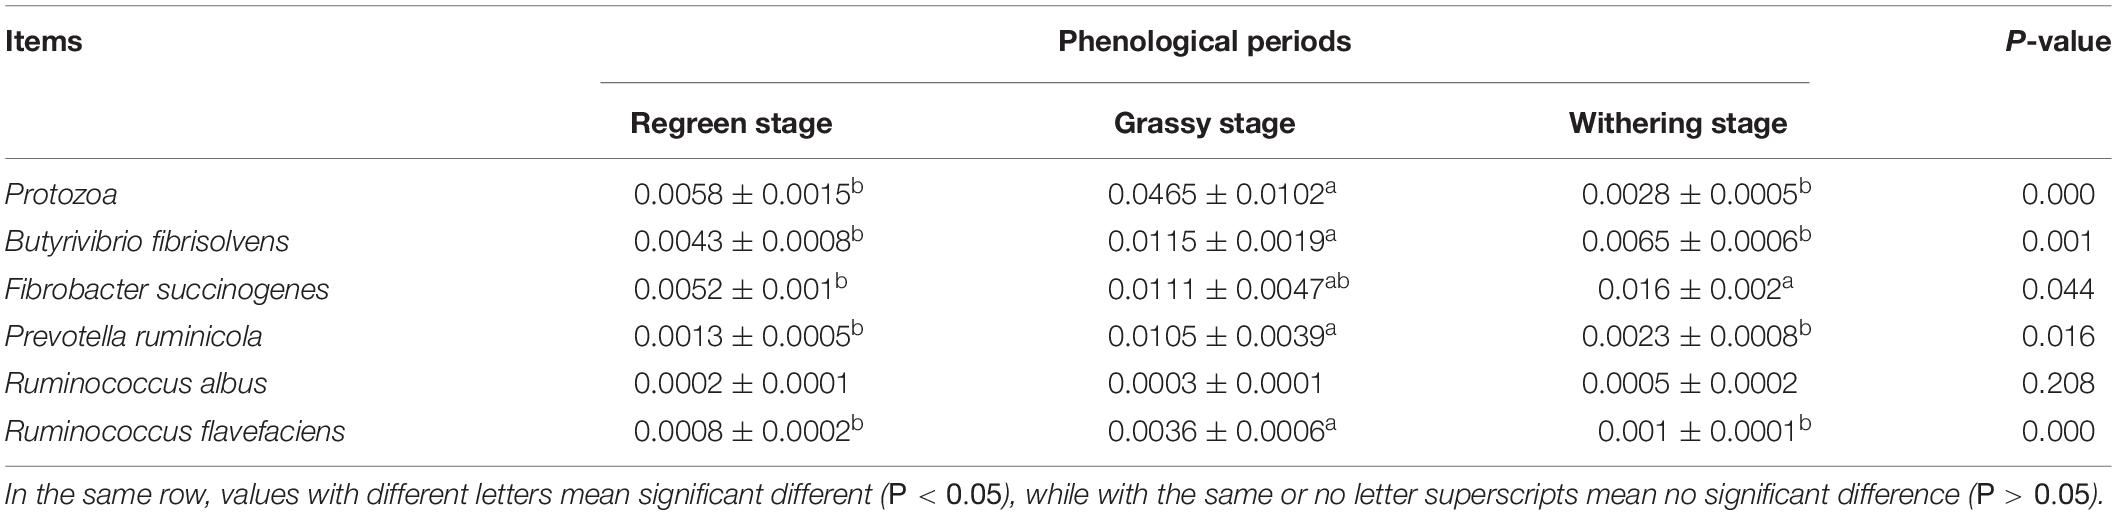
Table 4. The relative quantification of ruminal microbes in Tibetan sheep under different phenological periods.
Function of Rumen Bacteria
Based on rumen bacteria diversity and the UniFrac metric (Figure 1B), 15 samples were selected (n = 5 each) for metagenomic sequencing. Metagenome sequencing yielded about 14.58G clean bases per sample (Supplementary Table S5), with an average N90 length of 1.65 kb, including 10.5 million non-redundant unigenes and an average ORF length of 580 bp. The number of these non-redundant unigenes reads in the withering stage was significantly higher than in the regreen and grassy stages (P < 0.05) (Supplementary Figure S4). Of these unigenes, 10.85% were classified as carbohydrate-active enzymes (CAZy), 30.57% were assigned to KEEG pathways, and 28.59% were classified into eggNOG genes.
Carbohydrate Genes Related to Cellulolytic Enzymes
To explore the bacterial potential for herbage decomposition during the different phenological periods, we looked for CAZymes in the non-redundant gene sets. A total of 729,643 unique genes were generated after Cazy classification. These genes were assigned to 130 distinct families of GHs, 78 families of GTs, 16 families of CEs, 12 families of AAs, and 73 families of CBMs, as well as 26 families of associated PLs. According to CAZy annotation, there was an increasing trend over the phenological periods in genes encoding GHs, GTs, PLs, CEs, AAs, and CBMs, among which the GHs, PLs, and CBMs in the withering period were present at significantly higher levels than in the regreen and grassy stages (P < 0.05) (Supplementary Figure S4 and Supplementary Table S6).
Venn diagrams were constructed for the comparison of CAZyme (Supplementary Figure S1), GHs (Supplementary Figure S2) and CBMs (Supplementary Figure S3), annotated to show the number of proteins either shared or unique to a particular relationship. Overall, 248,129, 231,665, and 251,600 unique CAZyme were annotated in the metagenome of the regreen, grassy, and withering periods, respectively. Of these, 7,023, 8,299, and 11,101 CAZymes were exclusively annotated in respective metagenomes. GHs accounted for 38.81% of the total CAZyme, while 55,624, 50,783, and 56,106 were annotated in the regreen, grassy and withering stags. Of these 2218, 3494, and 3461 GHs were exclusively annotated in respective metagenomes. As with the GHs, the most diverse CBMs (29,097) were annotated in withering metagenomes, with 954 exclusive CBMs. Comparatively high numbers of CAZymes (251,600), GHs (56,106), and CBMs (29,097) along with the presence of elite CAZymes (11,101), GHs (3461), and CBMs (954) indicated the proficiency of the rumen microbiome in the withering stage toward efficient biomass hydrolysis.
To further investigate the pivotal cellulose microbial degradation process, we screened for cellulolytic enzymes, including endoglueanases, cellobiohydrolase, β-xylanase, endoxylanase, and α-amylases (Figure 7). In a sequenced-based classification CAZymes of GHs, we found most of genes were enriched in the withering stages, among which GH8, GH12, GH45, GH6, GH9, GH5, GH10, GH3, GH11, GH57 were significantly higher than in the other two stages (P < 0.05).
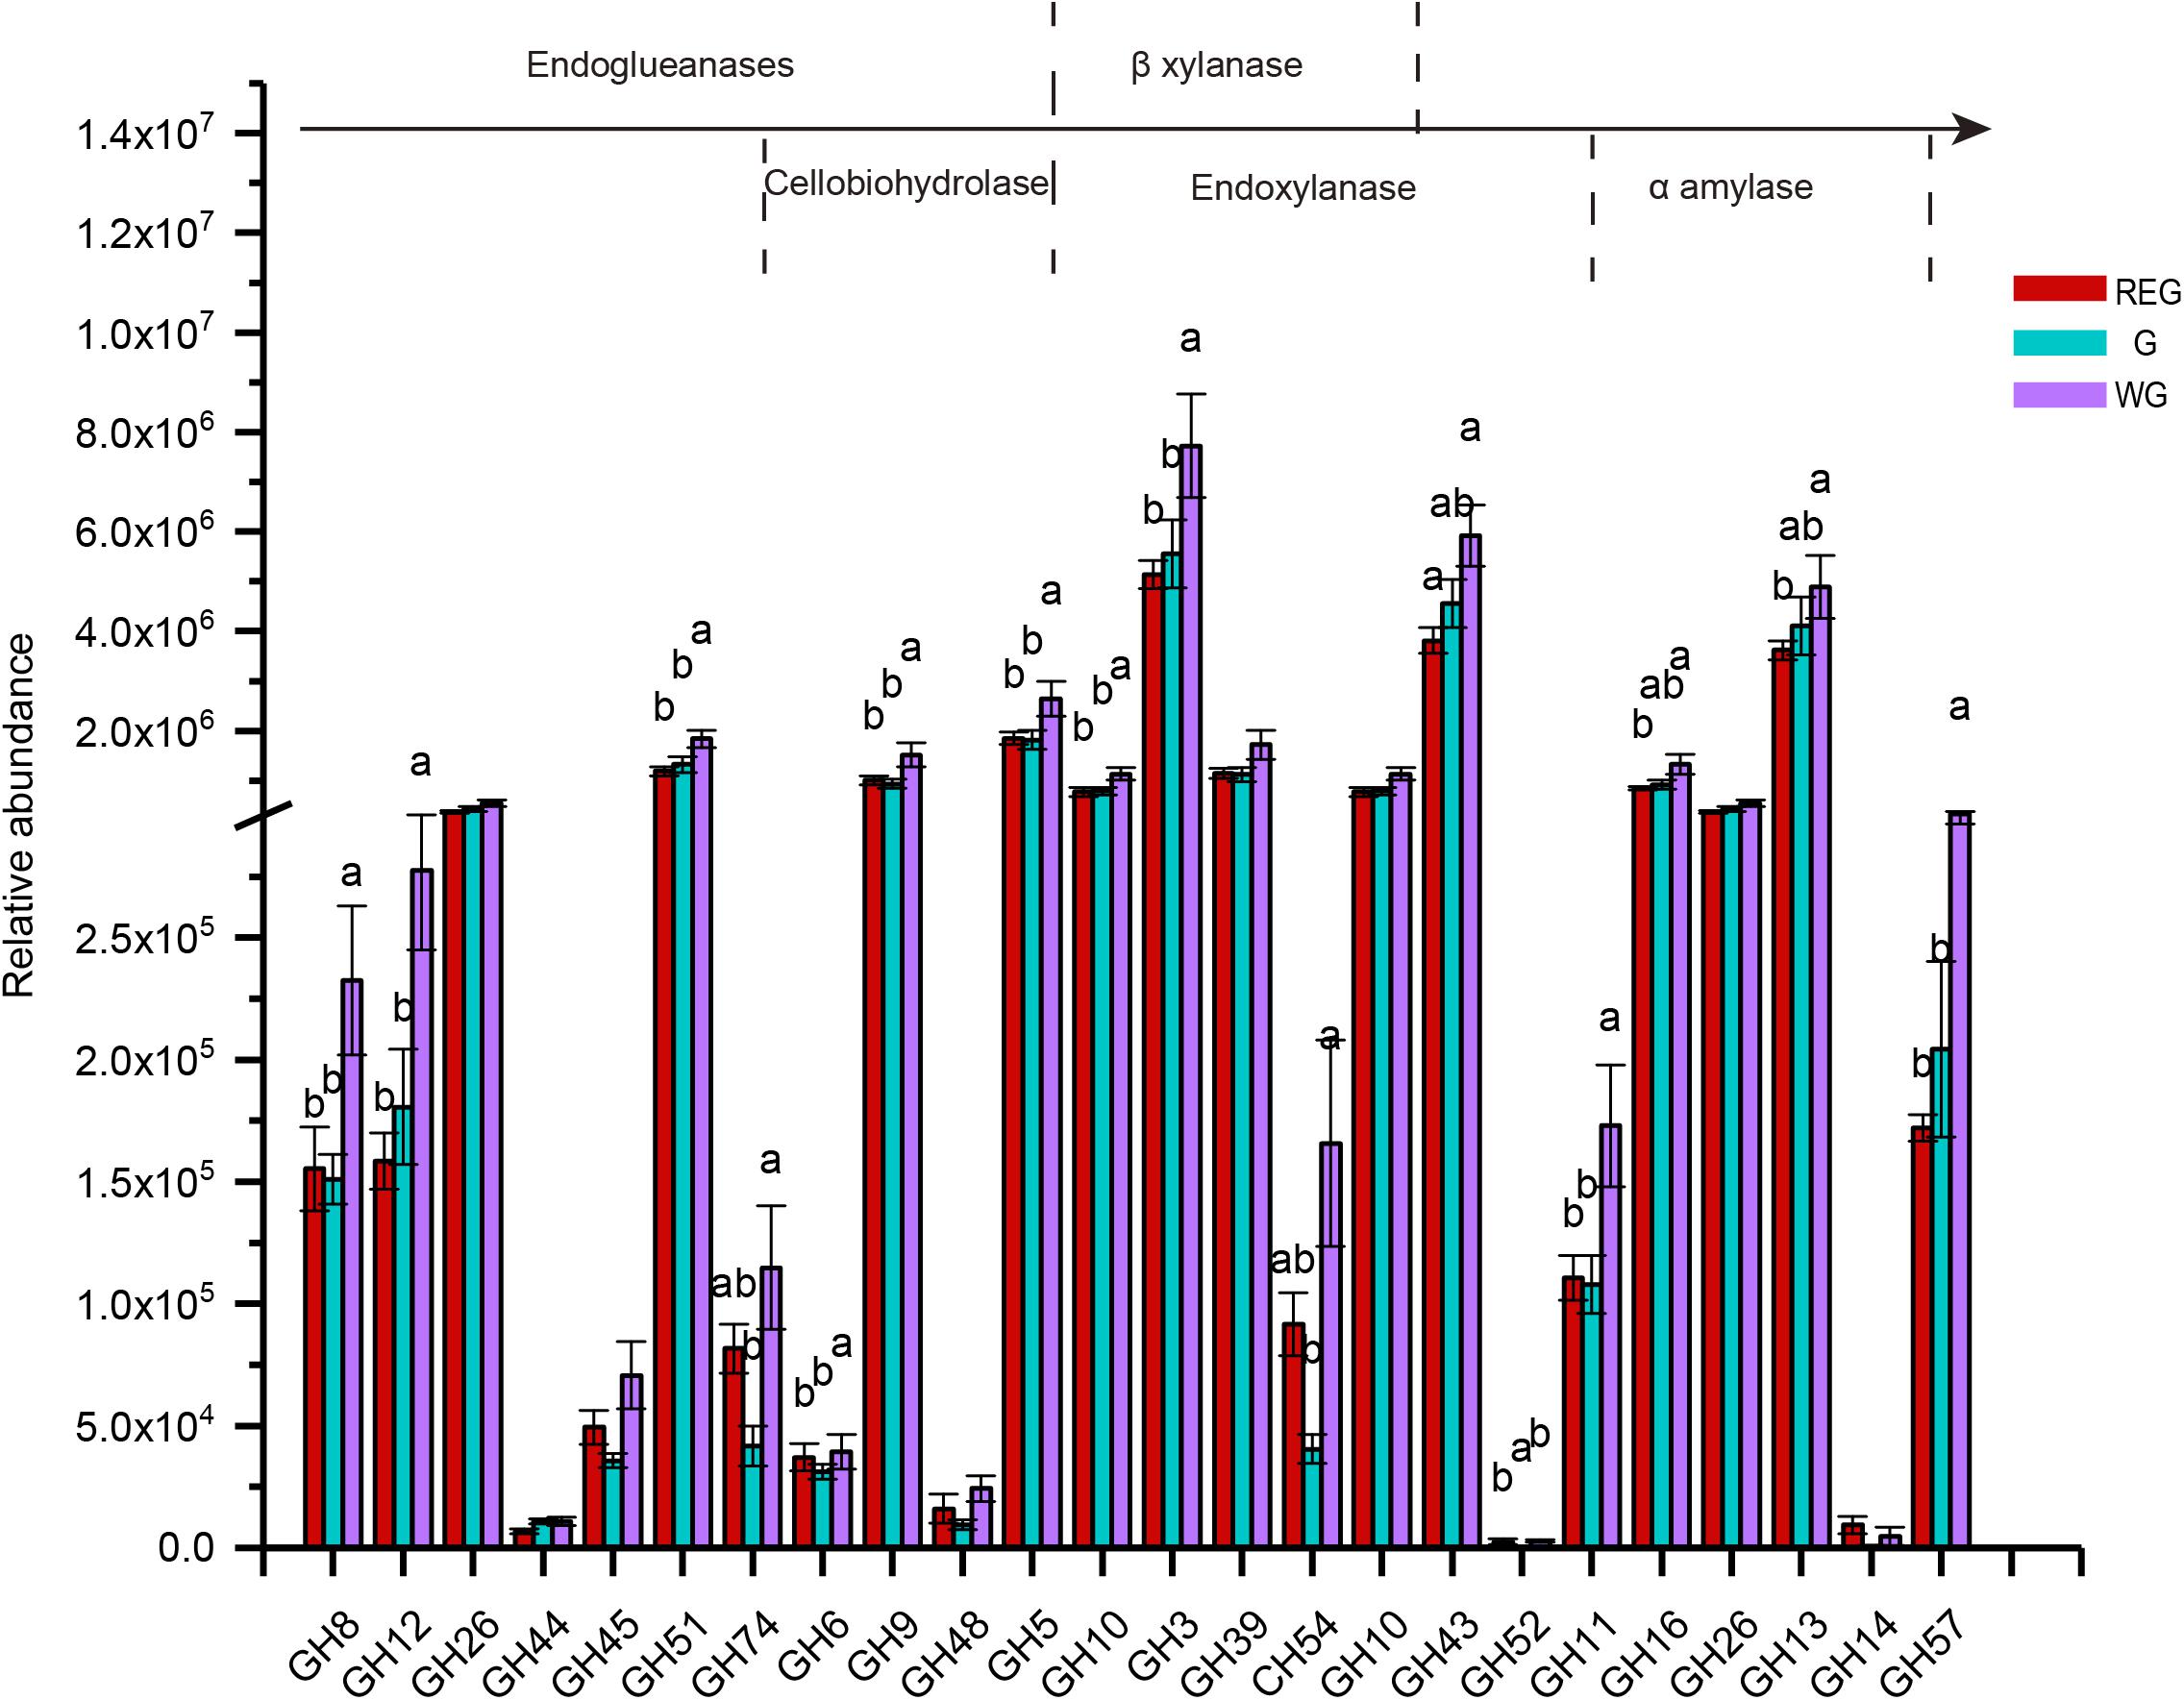
Figure 7. The genes encoding glycoside hydrolases (GH) and the families to which they belong. Different letters denote statistically significant difference at P < 0.05.
CAZymes often exhibited bound carbohydrate known as CBMs, which are vital in the initial stage of crystalline cellulose degradation (Figure 8 and Supplementary Table S7). In total, 14 CBMs which decomposed both cellulose and hemicellulose were annotated in the rumen microbiome. Eight CBMs associated with cellulose and 11 CBMs associated with hemicellulose were annotated. Most of the genes – CBM4, 6, 16, 37, 1, 13, 35, 42, 62, 32 – were highest in the withering stage, decreased in the grassy stage, and lowest in the regreen stage.
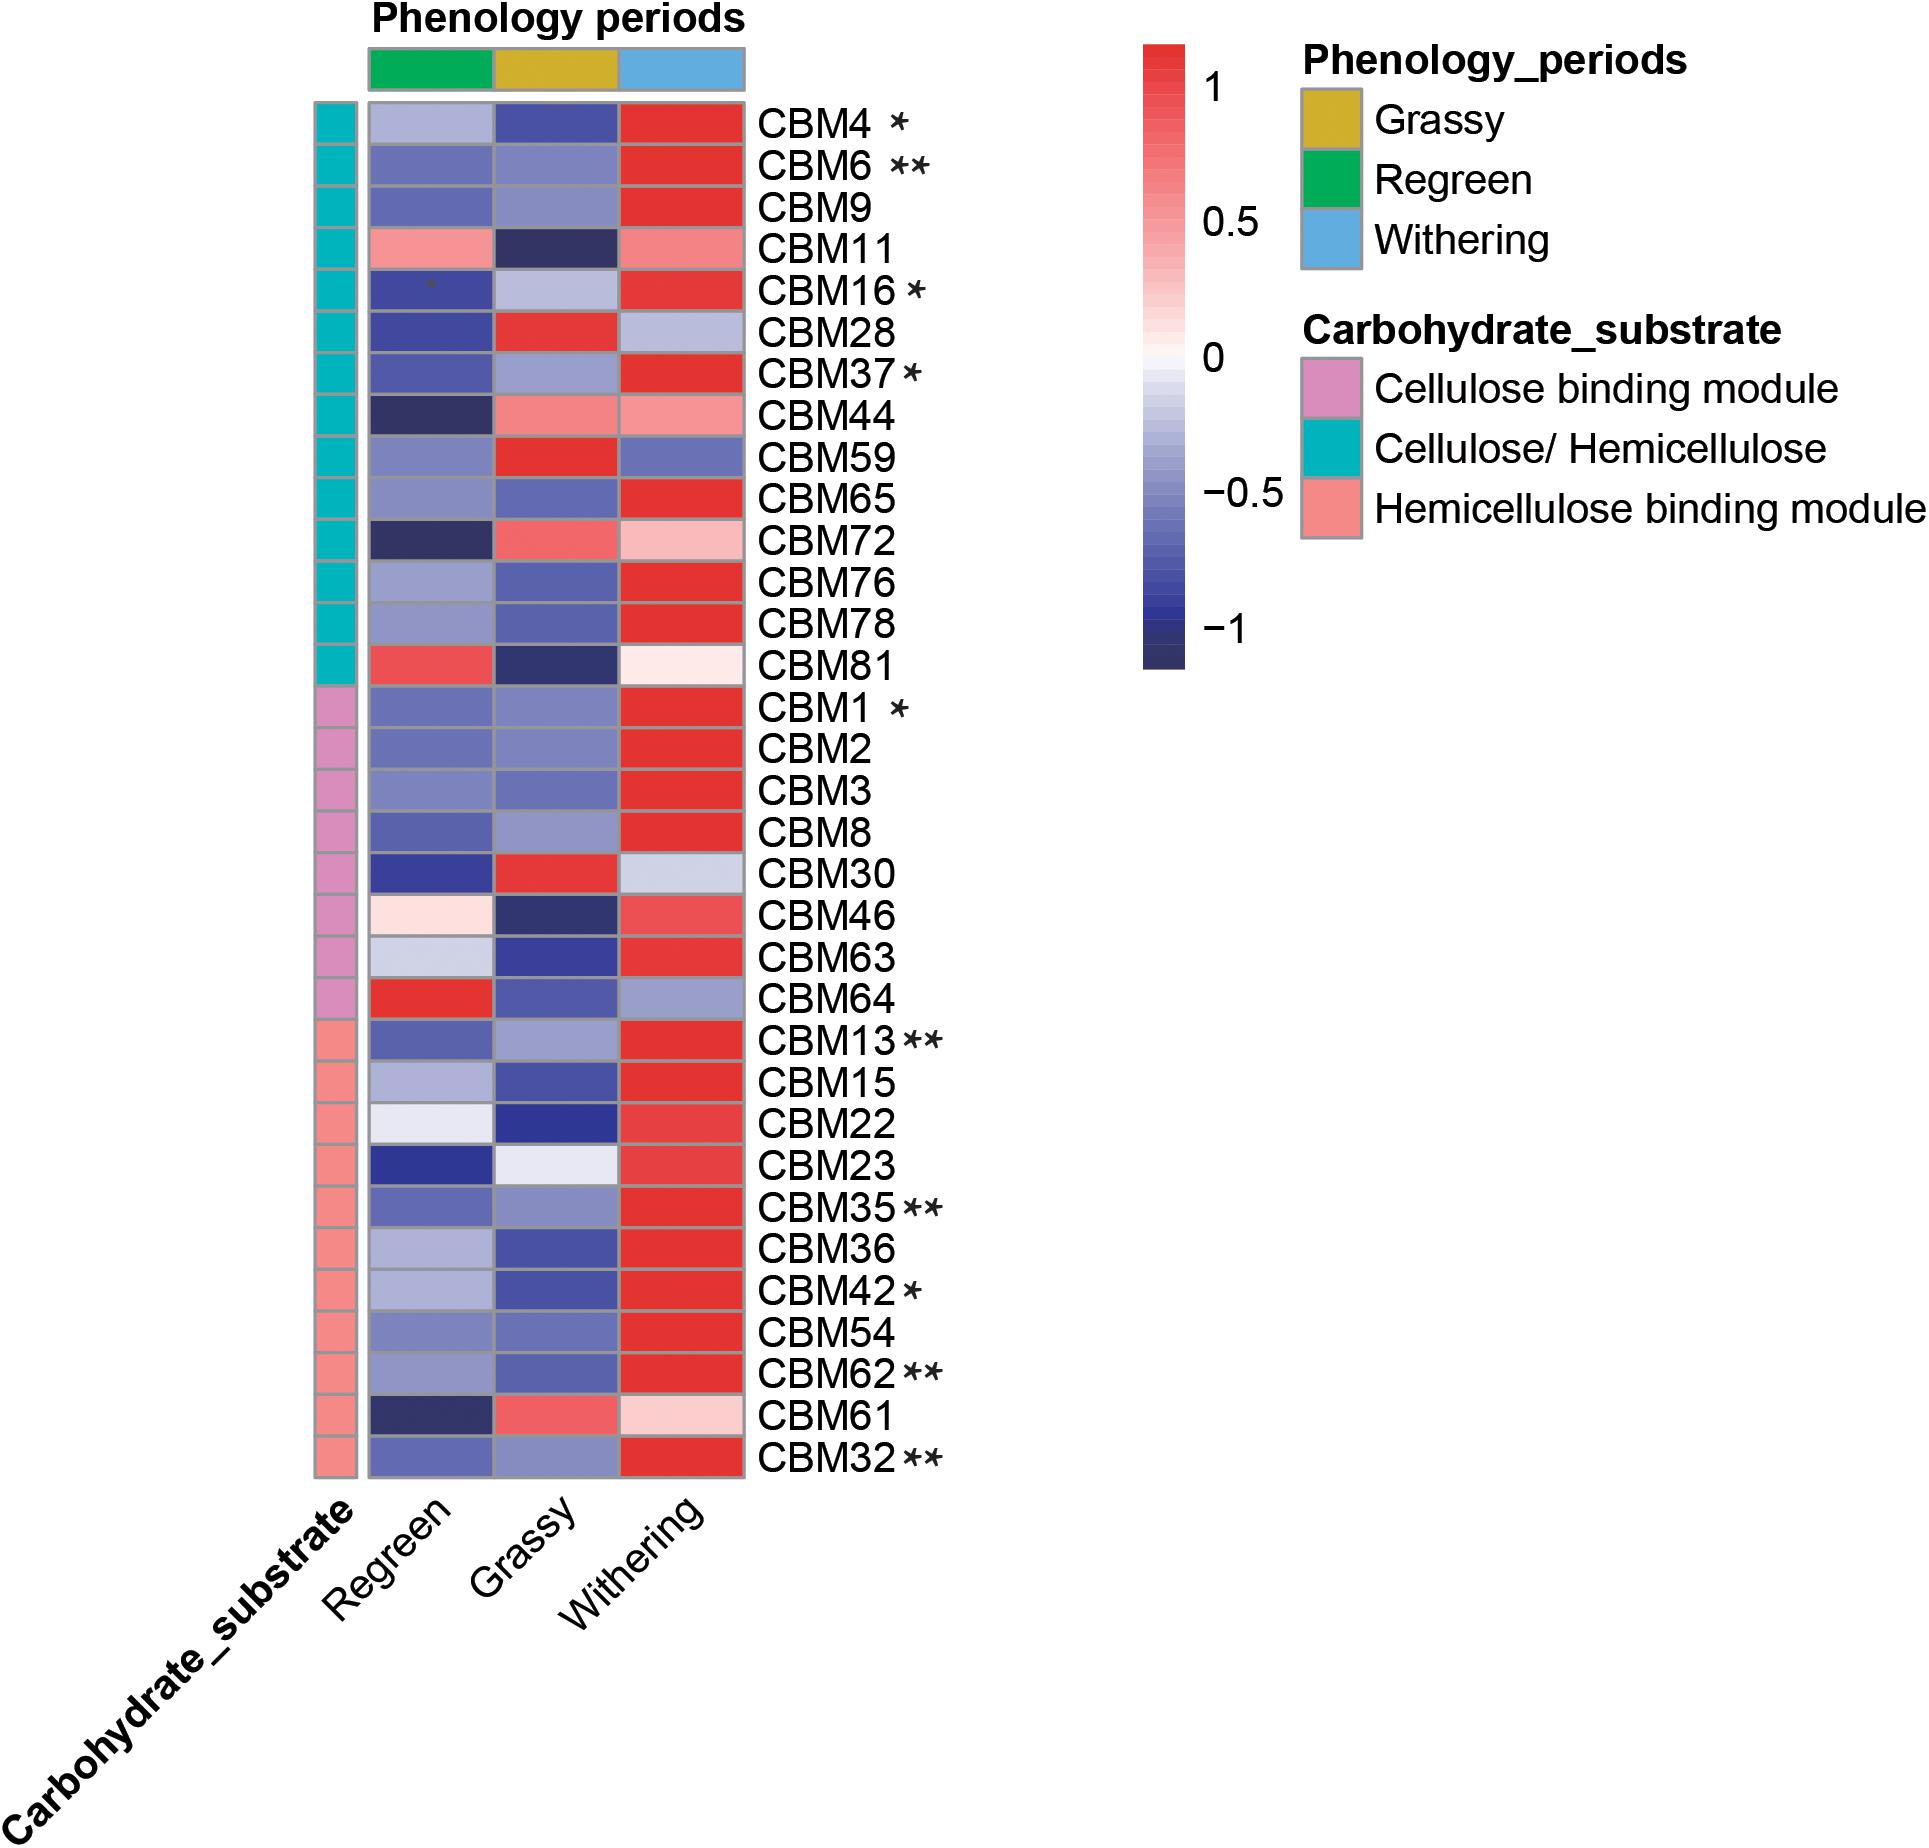
Figure 8. Comparison of CBMs linkd to various cellulose and hemicellulose in rumen metagenome samples during different phenological periods. Heatmap list the abundance of different CBMs. * meat there were significantly difference among groups (P < 0.05) and ** meant P < 0.01.
Metabolic Pathway Analysis of Different Phenological Periods
Among the six metabolic pathways, there were no significant differences in metabolism, environmental information processing, organism system or human disease using functional annotation with the KEEG database. The expression of genes related to genetic information processing were significantly lower in the regreen stage (Supplementary Figure S4).
A total of 29 pathways with significant differences were identified by pairwise comparison between the three phenological periods (Figure 9A). Enrichment analysis of metabolic pathways in which genes were involved showed that the main metabolic pathways in the rumen of full grazing TS were metabolic pathways and biosynthesis of secondary metabolites, and the enrichment degree was in the following stages: withering period > grassy period > regreen period. The same results were found in genes related to fatty acid synthesis (q < 0.01) (Figures 9B–D). The gene enrichment of the antibiotic biosynthesis pathway in the withering period was significantly higher than that of other phenological stages (q < 0.01).
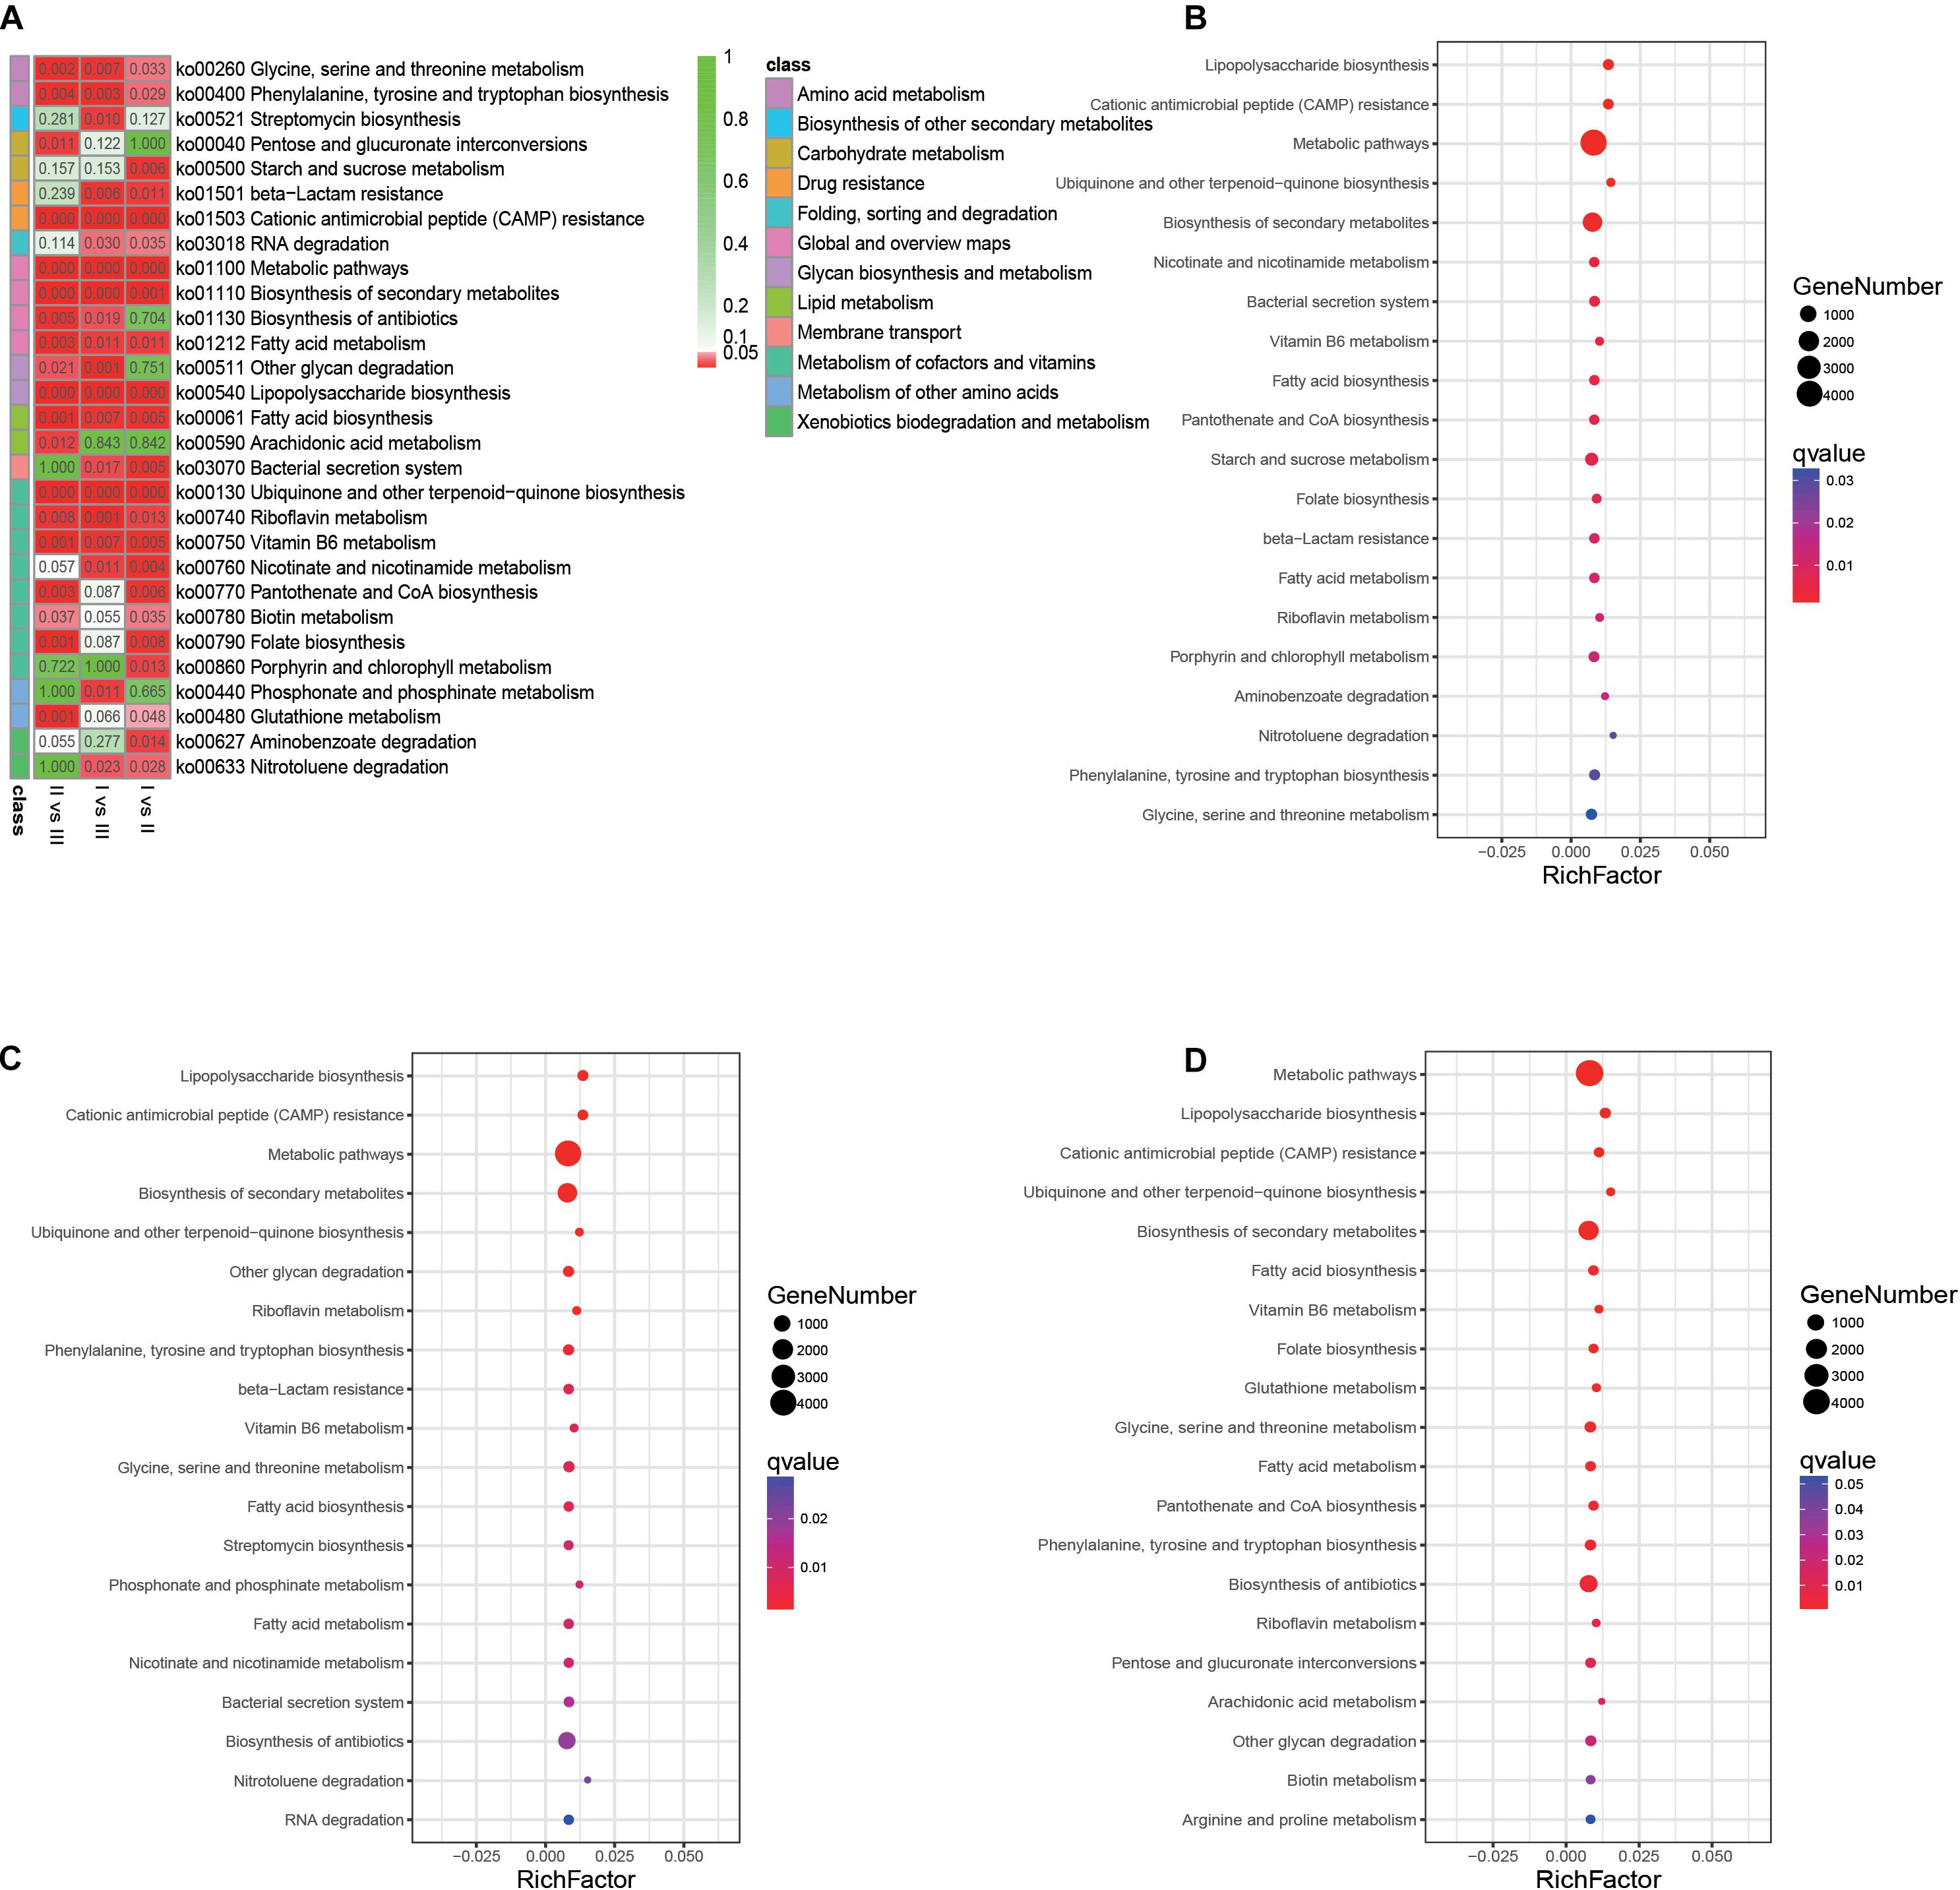
Figure 9. Analysis of metabolic pathways in which genes involved. (A) Heatmap showing the significantly different metabolic pathways. (B) Gene’s enrichment analysis in the grassy period when compared with the regreen period. (C) Gene’s enrichment analysis in the withering period when compared with the regreen period. (D) Gene’s enrichment analysis in the withering period when compared with the grassy period. The q-value represent the P-value corrected by FDR.
Discussion
Major Factors Determining Rumen Microbial Diversity
Although rumen microorganisms are relatively stable, they are highly responsive to changes in host genetics (Huang et al., 2017), feeding paradigms (Xue et al., 2017) and diet (Lin et al., 2018; Liu et al., 2019), age (Jami et al., 2013) and environmental factors (Uyeno et al., 2010). Of these, diet was the key factor in determining microbial community structure (Tajima et al., 2001). Ma et al. (2019) studied the rumen microorganism of full grazing yaks and found that the seasonal change in forage composition was the main factor that affected the distribution of microorganisms. In our study, the species, sex, and age of the experimental animals were identical. After removing these factors, we speculated that the significant differences in rumen microbiota structures during different phenological periods would be caused by changes in forage nutrition.
In the grassy period, there was an increased supply of forage, in quality and quantity (Xue et al., 2005), TS could consume forage with high nutrient levels within a small range of activities (Qin et al., 2020). During the regreen and withering periods, in order to obtain more food resources, TS had to seek a wider range of forage with lower nutrition levels. To investigate this hypothesis, we analyzed the correlation between forage nutrition and microbiota. We found that forage nutrition significantly affected rumen microbiota communities, and CP played a major role. Rumen microbial diversity was related to the feeding ecology of the host (Xue et al., 2017). In the grassy period, TS consumed more diverse forage with high nutrition, such as Poa annua L, Stipa capillata L, Kobresia humips, Kobresia lineata, and Leguminosae sp., whereas, in the regreen and withering periods, as the biomass of forage decreased and some dominant species were eaten out, high nutrition forage species could not meet the growth demand. TS had to eat broad-leaved forage with poor palatability and nutritional composition (Xiao et al., 2020). We therefore speculated that although food diversity (richness and evenness) indexes of TS in the grassy period were higher than in the regreen and withering periods, due to the differences in feeding niches and forage nutrition structure, the rumen microbiota diversity was lower than in the regreen and withering periods. Li et al. (2016) studied the gut microorganisms of pika living on the plateau and found that the pika could select rare but diverse bacteria in the soil to promote the digestion and absorption of high fiber content forage in the intestinal tract. In our study, due to the low vegetation coverage and the large amount of bare land in alpine meadows during the regreen and withering periods, TS found it easier to access soil from grassland to promote ruminant (McDowell, 1985). Whether or not the increase in the number of soil microorganisms in the rumen caused the increase in the rumen microbial diversity cannot be proven at present, and needs further confirmation.
Adaptability of Rumen Microbiota in TS on the QTP
Tibetan sheep, a key species in the QTP, have adapted to the harsh plateau environment by changing the morphological characteristics of their organs and physiological-biochemical index (Wei et al., 2016). From the perspective of rumen microbial regulation, Zhang et al. (2016) found that high altitude ruminants, Yak and TS, harbored high levels of Prevotella spp. and low levels of Methanobrevibacter gottschalkii, which promoted the forage fermentation to produce high levels of acetate, propionate and butyric, and also reduced methane production to avoid energy losses (Shi et al., 2014). Although some researchers have suggested that the unique rumen microbial community composition in TS might relate to their adaptation to high altitude (Huang et al., 2017), little research has been conducted into the adaptability of rumen microorganisms in full-grazing TS using 16S RNA and metagenomic sequencing. In our study, the predominant phyla in the TS rumen were Bacteroidetes and Firmicutes, with average proportions of 59.69 and 22.34%, respectively. The distribution of the main phyla in the rumen were similar to those found in other research into the QTP (Liu et al., 2019; Ma et al., 2019). Kim et al. (2011) have summarized the rumen bacterial distribution of the major domesticated livestock through a meta-analysis of all curated 16S rRNA sequences deposited in the RDP and found the proportion of Bacteroidetes and Firmicutes was about 31 and 56%, respectively. Cunha et al. (2011) investigated the rumen microbiome composition in goats living in semi-arid regions in Brazil and concluded that the proportion of Bacteroidetes and Firmicutes were 37.9 and 56.3%, respectively. Interestingly, in our study, the relative abundance of Bacteroidetes exceeded the mean proportion of Bacteroidetes, while the Firmicutes content was lower than the mean proportion of rumen bacteria that belonged to Firmicutes of the predominant ruminants around the word. The former study showed that members of the phylum Bacteroidetes had ability to efficiently break down proteins and carbohydrate in forage (Huo et al., 2014; Pitta et al., 2014). Therefore, we concluded that the huge number of bacteria in Bacteroidetes in plateau ruminants highlights the vital role of these bacteria, which might be beneficial in providing nutrients to the host by degrading the limited resources in the QTP.
Adaption Strategies of Rumen Microorganisms in Tibetan Sheep at Different Phenological Periods
The rumen microorganisms of TS adapts to the different phenological periods of the QTP. The grassy period is the key stage in which grazing TS gain weight rapidly, due to the high aboveground biomass and profuse nutrition (Sun et al., 2015). Research has shown that Bacteroidetes plays an important role in forge nutrition utilization and host disease immunity (Huo et al., 2014; Li Y. et al., 2017; Zhang et al., 2018). Prevotella appears to be associated with propionic acid production and plays a pivotal role in degrading and utilizing plant non-cellulosic polysaccharides, protein, starch and xylans (Strobel, 1992; Liu et al., 2019). In our study, the relative abundance of Bacteroidetes and Prevotella in the grassy stage provided significant advantages over the regreen and grassy periods. RDA and correlation analysis indicated that the relative abundance of Bacteroidetes and Prevotella were positively correlated with the content of NH3-N, and the high relative abundance of Succiniclasticum and Treponema in the grassy period were significant positively correlated with the synthesis of acetate and propionate. Through qPCR analysis, we found that amounts of the main cellulolytic and proteolytic bacteria (Michalet-Doreau et al., 2001), such as Protozoa, B. fibrisolvens, P. ruminicola, and R. flavefaciens in the grassy period were significantly higher than that in regreen and withering periods. These results were consistent with the higher dry matter digestibility and growth rate of TS in the grassy period (Sun et al., 2015; Yang et al., 2018). Therefore, we concluded that a higher abundance of functional bacteria in the rumen improves forage digestibility, while producing high concentrations of NH3-N and short VFAs to rapidly improve the growth performance of TS in the grassy period.
In September, alpine meadows begin to enter the withering period. With the advance of the withering period, the quality and quantity of forage decreases sharply, especially in winter, which is the most difficult period for TS to survive (Long et al., 1999). In our study, although the relative abundance of Bacteroidetes and Firmicutes in the withering period were lower than in other phenological periods, some phyla of lower abundance, such as Verrucomicrobia, Cyanobacteria, Proteobacteria, Lentisphaerae, Spirochaetae, Tenericutes, and Fibrobacteres were significantly increased. Research has shown that Verrucomicrobia contain a wide range of glycoside hydrolases, which play an important role in the decomposition of polysaccharides and cellobiose (Godoy-Vitorino et al., 2012; Gharechahi et al., 2015). These rumen microbiotas allow TS to obtain energy through the utilization of food, whereas energy compensation strategies permit TS survival in harsh withering period environments.
There are complex interactions among microorganisms, including competition, mutualism, predation, parasitism, and amensalism (Faust and Raes, 2012). Network analysis could shed light upon species interactions according to their co-occurrence (positive) or mutual exclusion (negative) (Li H. et al., 2017). A negative interaction may result in competition or amensalism, while a positive relationship is most likely to lead to mutualism and commensalism (Faust and Raes, 2012). In our networks, in TS in the regreen and grassy periods, the number of positive and negative links was nearly the same, whereas in the withering period positive correlations predominated. We speculated that due to the lack of forage in the withering period, microorganisms could make full use of limited forage resources through increased cooperation. The total number of links in the regreen period were higher than in other periods, indicating that the relationships between microorganisms were closer, and the interactions were more frequent.
A ruminant’s capability to deconstruct plant biomass into fermentable sugars is entirely due to polysaccharide hydrolyzing enzymes produced by rumen microflora (Bohra et al., 2019). The CAZy database provides information concerning all CAZyme families; GHs, GTs, PLs, CEs, CBMs, and AAs, amongst which GHs are the most diverse and abundant group of enzymes, followed by GTs, CBM, CEs, PLs, and AAs (Cantarel et al., 2009; Bohra et al., 2019). GHs are responsible for facilitating the hydrolysis of cellulose (Hess et al., 2011). In our study, the enzymes in GHs family in the rumen metagenome of the withering period showed a more complex process of cellulose degradation. To obtain more information about the GHs family, we classified the families to which GHs belongs, according to Krause et al. (2003). Many genes encoding endocellulase, cellobiohydrolase, endoxylanase, β-Xylosidase and α-Amylase were highly enriched in the rumen microbiota of the withering period. CBMs itself does not exhibit enzymatic activity, but does help in binding GHs to polysaccharides, strengthening their activity (Du et al., 2018; Bernardes et al., 2019). Levels of CBMs in the withering period were significantly higher than in the other two periods. Given these results we speculated that during the long cold season, the genes highly expressed in the rumen microbiota could provide the rumen with the ability to efficiently deconstruct the plant biomass, and promote forage conversion. The functions of the rumen microbiota pathways demonstrate how TS enhance the functions of metabolic pathways, biosynthesis of secondary metabolites, fatty acid biosynthesis and biosynthesis of antibiotics to account for a loss of food quality in the withering period (Kaoutari et al., 2013).
Conclusion
In this study, the composition and function of rumen microbiota in TS during different phenological periods were compared. We assessed the adaptation strategies of TS using non-invasive methods, laying the foundation for understanding the adaptability of TS in the QTP. Our results indicated that the nutritional quality of herbage, especially the CP content, was the key factor in determining the composition of the rumen microorganisms. Further analysis revealed that rumen microorganisms of grazing TS have varying adaptive mechanisms in different phenological periods. In the grassy period, the high relative abundance of Bacteroidetes, Firmicutes and Prevotella promoted forage fermentation to produce a high concentration of NH3-N and TVFAs, while some functional flora mainly involved in cellulose decomposition were significantly enriched, potentially increasing plant biomass decomposition and improving the growth of TS. During the withering period, a high abundance of cellulose degrading enzyme genes, more cooperation between microorganisms, and a higher metabolic pathway enrichment could enable TS to make maximum use of the reduced forage resources in winter. During the regreening period, the microorganisms are at a disadvantage in terms of composition and function.
Data Availability Statement
The datasets presented in this study can be found in online repositories. The names of the repository/repositories and accession number(s) can be found in the article/Supplementary Material.
Ethics Statement
The animal study was reviewed and approved by Northwest Institute of Plateau Biology, CAS-Institutional Animal Care and Use Committee (OGRD# 2016YFC0501905). Written informed consent was obtained from the owners for the participation of their animals in this study.
Author Contributions
HL wrote the manuscript. HL, LH, and XH analyzed the data. HL, LM, XW, XiaZ, SK, NZ, and TX contributed to sampling and laboratory. XinZ and SX designed the study and reviewed the drafts of the manuscript. All authors read and approved the final manuscript.
Funding
This study was funded by the Strategic Priority Research Program of the Chinese Academy of Sciences (XDA2005010406 and XDA23060603), National Key Research and Development Project (2016YFC0501805 and 2018YFD0502301), the Chinese Academy of Sciences-“Light of West China” Program in 2018 (by Dongdong Chen), the Key R&D and transformation plan of Qinghai Province (2019-SF-149, 2019-SF-153, 2019-NK-173,and 2019- NK-118).
Conflict of Interest
The authors declare that the research was conducted in the absence of any commercial or financial relationships that could be construed as a potential conflict of interest.
Supplementary Material
The Supplementary Material for this article can be found online at: https://www.frontiersin.org/articles/10.3389/fmicb.2020.587558/full#supplementary-material
Footnotes
References
Bernardes, A., Pellegrini, V., Curtolo, F., Camilo, C., Mello, B., Johns, M., et al. (2019). Carbohydrate binding modules enhance cellulose enzymatic hydrolysis by increasing access of cellulases to the substrate. Carbohyd. Polym. 211, 57–68. doi: 10.1016/j.carbpol.2019.01.108
Bohra, V., Dafale, N. A., and Purohit, H. J. (2019). Understanding the alteration in rumen microbiome and CAZymes profile with diet and host through comparative metagenomic approach. Arch. Microbiol. 201, 1385–1397. doi: 10.1007/s00203-019-01706-z
Buchfink, B., Xie, C., and Huson, D. H. (2015). Fast and sensitive protein alignment using DIAMOND. Nat. Methods 12, 59–60. doi: 10.1038/nmeth.3176
Cantarel, B. L., Coutinho, P. M., Rancurel, C., Bernard, T., Lombard, V., and Henrissat, B. (2009). The carbohydrate-active EnZymes database (CAZy): an expert resource for glycogenomics. Nucleic Acids Res. 37, D233–D238. doi: 10.1093/nar/gkn663
Caporaso, J. G., Kuczynski, J., Stombaugh, J., Bittinger, K., Bushman, F. D., Costello, E. K., et al. (2010). QIIME allows analysis of high-throughput community sequencing data. Nat. Methods 7, 335–356. doi: 10.1038/nmeth.f.303
Chu, K.-C. (1973). A preliminary study on the climatic fluctuations during the last 5,000 Years In China. Sci. Sin. 16, 168–192. doi: 10.1360/ya1973-16-2-226
Cunha, I. S., Barreto, C. C., Costa, O. Y., Bomfim, M. A., Castro, A. P., Kruger, R. H., et al. (2011). Bacteria and Archaea community structure in the rumen microbiome of goats (Capra hircus) from the semiarid region of Brazil. Anaerobe 17, 118–124. doi: 10.1016/j.anaerobe.2011.04.018
Denman, S. E., and McSweeney, C. S. (2006). Development of a real-time PCR assay for monitoring anaerobic fungal and cellulolytic bacterial populations within the rumen. FEMS Microbiol. Ecol. 58, 572–582. doi: 10.1111/j.1574-6941.2006.00190.x
Ding, M., Zhang, Y., Sun, X., Liu, L., Wang, Z., and Bai, W. (2013). Spatiotemporal variation in alpine grassland phenology in the qinghai-tibetan plateau from 1999 to 2009. Chin. Sci. Bull. 58, 396–405. doi: 10.1007/s11434-012-5407-5
Du, L., Ma, L., Ma, Q., Guo, G., Han, X., and Xiao, D. (2018). Hydrolytic boosting of lignocellulosic biomass by a fungal lytic polysaccharide monooxygenase. AnLPMO15g from Aspergillus niger. Ind. Crops Prod. 126, 309–315. doi: 10.1016/j.indcrop.2018.10.029
Edgar, R. C. (2013). UPARSE: highly accurate OTU sequences from microbial amplicon reads. Na. Methods 10, 996–998. doi: 10.1038/nmeth.2604
Edgar, R. C., Haas, B. J., Clemente, J. C., Quince, C., and Knight, R. (2011). UCHIME improves sensitivity and speed of chimera detection. Bioinformatics 27, 2194–2200. doi: 10.1093/bioinformatics/btr381
Faust, K., and Raes, J. (2012). Microbial interactions: from networks to models. Nat. Rev. Microbiol. 10:538. doi: 10.1038/nrmicro2832
Gharechahi, J., Zahiri, H. S., Noghabi, K. A., and Salekdeh, G. H. (2015). In-depth diversity analysis of the bacterial community resident in the camel rumen. Syst. Appl. Microbiol. 38, 67–76. doi: 10.1016/j.syapm.2014.09.004
Godoy-Vitorino, F., Goldfarb, K. C., Karaoz, U., Leal, S., Garcia-Amado, M. A., Hugenholtz, P., et al. (2012). Comparative analyses of foregut and hindgut bacterial communities in hoatzins and cows. ISME J. 6, 531–541. doi: 10.1038/ismej.2011.131
Han, X., Liu, H., Hu, L., Ma, L., Xu, S., Xu, T., et al. (2020). Impact of sex and age on the bacterial composition in rumen of Tibetan sheep in Qinghai China. Livestock Sci. 238:104030. doi: 10.1016/j.livsci.2020.104030
Hess, M., Sczyrba, A., Egan, R., Kim, T.-W., Chokhawala, H., Schroth, G., et al. (2011). Metagenomic discovery of biomass-degrading genes and genomes from cow rumen. Science 331, 463–467. doi: 10.1126/science.1200387
Huang, J., Li, Y., and Luo, Y. (2017). Bacterial community in the rumen of Tibetan sheep and Gansu alpine fine-wool sheep grazing on the Qinghai-Tibetan Plateau. China. J. Gen. Appl. Microbiol. 63, 122–130. doi: 10.2323/jgam.2016.08.003
Huo, W., Zhu, W., and Mao, S. (2014). Impact of subacute ruminal acidosis on the diversity of liquid and solid-associated bacteria in the rumen of goats. World J. Microbiol. Biotechnol. 30, 669–680. doi: 10.1007/s11274-013-1489-8
Jami, E., Israel, A., Kotser, A., and Mizrahi, I. (2013). Exploring the bovine rumen bacterial community from birth to adulthood. ISME J. 7, 1069–1079. doi: 10.1038/ismej.2013.2
Jewell, K. A., McCormick, C. A., Odt, C. L., Weimer, P. J., and Suen, G. (2015). Ruminal bacterial community composition in dairy cows is dynamic over the course of two lactations and correlates with feed efficiency. Appl. Environ. Microbiol. 81, 4697–4710. doi: 10.1128/aem.00720-15
Jing, X. P., Peng, Q. H., Hu, R., Zou, H. W., Wang, H. Z., and Yu, X. Q. (2018). Dietary supplements during the cold season increase rumen microbial abundance and improve rumen epithelium development in Tibetan sheep. J. Anim. Sci. 96, 293–305. doi: 10.1093/jas/skx032
Kaoutari, A. E., Armougom, F., Gordon, J. I., Raoult, D., and Henrissat, B. (2013). The abundance and variety of carbohydrate-active enzymes in the human gut microbiota. Nat. Rev. Microbiol. 11, 497–504. doi: 10.1038/nrmicro3050
Kim, M., Morrison, M., and Yu, Z. (2011). Status of the phylogenetic diversity census of ruminal microbiomes. FEMS Microbiol. Ecol. 76, 49–63. doi: 10.1111/j.1574-6941.2010.01029.x
Koike, S., and Kobayashi, Y. (2001). Development and use of competitive PCR assays for the rumen cellulolytic bacteria: Fibrobacter succinogenes, Ruminococcus albus and Ruminococcus flavefaciens. FEMS Microbiol. Lett. 204, 361–366. doi: 10.1111/j.1574-6968.2001.tb10911.x
Krause, D. O., Denman, S. E., Mackie, R. I., Morrison, M., Rae, A. L., Attwood, G. T., et al. (2003). Opportunities to improve fiber degradation in the rumen: microbiology, ecology, and genomics. FEMS Microbiol. Rev. 27, 663–693. doi: 10.1016/s0168-6445(03)00072-x
Langda, S., Zhang, C., Zhang, K., Gui, B., Ji, D., Deji, C., et al. (2020). Diversity and composition of rumen bacteria, fungi, and protozoa in goats and sheep living in the same high-altitude pasture. Animals 10:186. doi: 10.3390/ani10020186
Langmead, B., and Salzberg, S. L. (2012). Fast gapped-read alignment with Bowtie 2. Nat. Methods 9, 357–359. doi: 10.1038/nmeth.1923
Ley, R. E., Turnbaugh, P. J., Klein, S., and Gordon, J. I. (2006). Human gut microbes associated with obesity. Nature 444, 1022–1023. doi: 10.1038/4441022a
Li, D., Liu, C. M., Luo, R., Sadakane, K., and Lam, T. W. (2015). MEGAHIT: an ultra-fast single-node solution for large and complex metagenomics assembly via succinct de Bruijn graph. Bioinformatics 31, 1674–1676. doi: 10.1093/bioinformatics/btv033
Li, H., Li, T., Tu, B., Kou, Y., and Li, X. (2017). Host species shapes the co-occurrence patterns rather than diversity of stomach bacterial communities in pikas. Appl. Microbiol. Biotechnol. 101, 5519–5529. doi: 10.1007/s00253-017-8254-0
Li, Y., Hu, X., Yang, S., Zhou, J., Zhang, T., Qi, L., et al. (2017). Comparative analysis of the gut microbiota composition between captive and wild forest musk deer. Front. Microbiol. 8:1705. doi: 10.3389/fmicb.2017.01705
Li, H., Li, T., Yao, M., Li, J., Zhang, S., Wirth, S., et al. (2016). Pika gut may select for rare but diverse environmental Bacteria. Front. Microbiol. 7:1269. doi: 10.3389/fmicb.2016.01269
Li, W., and Godzik, A. (2006). Cd-hit: a fast program for clustering and comparing large sets of protein or nucleotide sequences. Bioinformatics 22, 1658–1659. doi: 10.1093/bioinformatics/btl158
Lin, X., Wang, J., Hou, Q., Wang, Y., Hu, Z., Shi, K., et al. (2018). Effect of hay supplementation timing on rumen microbiota in suckling calves. Microbiologyopen 7:e00430. doi: 10.1002/mbo3.430
Liu, H., Xu, T., Xu, S., Ma, L., Han, X., Wang, X., et al. (2019). Effect of dietary concentrate to forage ratio on growth performance, rumen fermentation and bacterial diversity of Tibetan sheep under barn feeding on the Qinghai-Tibetan plateau. PeerJ 7:e7462. doi: 10.7717/peerj.7462
Long, R., Apori, S., Castro, F., and Ørskov, E. (1999). Feed value of native forages of the Tibetan Plateau of China. Anim. Feed Sci. Technol. 80, 101–113. doi: 10.1016/s0377-8401(99)00057-7
Long, R. J., Dong, S. K., Wei, X. H., and Pu, X. P. (2005). The effect of supplementary feeds on the bodyweight of yaks in cold season. Livestock Prod. Sci. 93, 197–204. doi: 10.1016/j.livprodsci.2004.08.016
Ma, L., Xu, S., Liu, H., Xu, T., Hu, L., Zhao, N., et al. (2019). Yak rumen microbial diversity at different forage growth stages of an alpine meadow on the Qinghai-Tibet Plateau. PeerJ 7:e7645. doi: 10.7717/peerj.7645
Magoc, T., and Salzberg, S. L. (2011). FLASH: fast length adjustment of short reads to improve genome assemblies. Bioinformatics 27, 2957–2963. doi: 10.1093/bioinformatics/btr507
McDowell, L. (1985). Contribution of Tropical Forages and Soil Toward Meeting Mineral Requirements of Grazing Ruminants. New York, NY: Academic Press.
Michalet-Doreau, B., Fernandez, I., Peyron, C., Millet, L., and Fonty, G. (2001). Fibrolytic activities and cellulolytic bacterial community structure in the solid and liquid phases of rumen contents. Reprod. Nutr. Dev. 41, 187–194. doi: 10.1051/rnd:2001122
Miron, J., Ben-Ghedalia, D., and Morrison, M. (2001). Invited review: adhesion mechanisms of rumen cellulolytic bacteria. J. Dairy Sci. 84, 1294–1309. doi: 10.3168/jds.s0022-0302(01)70159-2
Pitta, D. W., Kumar, S., Veiccharelli, B., Parmar, N., Reddy, B., and Joshi, C. G. (2014). Bacterial diversity associated with feeding dry forage at different dietary concentrations in the rumen contents of Mehshana buffalo (Bubalus bubalis) using 16S pyrotags. Anaerobe 25, 31–41. doi: 10.1016/j.anaerobe.2013.11.008
Porebski, S., Bailey, L. G., and Baum, B. R. (1997). Modification of a CTAB DNA extraction protocol for plants containing high polysaccharide and polyphenol components. Plant Mol. Biol. Rep. 15, 8–15. doi: 10.1007/bf02772108
Pruesse, E., Quast, C., Knittel, K., Fuchs, B. M., Ludwig, W., Peplies, J., et al. (2007). SILVA: a comprehensive online resource for quality checked and aligned ribosomal RNA sequence data compatible with ARB. Nucleic Acids Res. 35, 7188–7196. doi: 10.1093/nar/gkm864
Qin, W., Song, P., Lin, G., Huang, Y., Wang, L., Zhou, X., et al. (2020). Gut microbiota plasticity influences the adaptability of wild and domestic animals in co-inhabited areas. Front. Microbiol. 11:125. doi: 10.3389/fmicb.2020.00125
Russell, J. B., and Diezgonzalez, F. (1998). The effects of fermentation acids on bacterial growth. Adv. Microb. Physiol. 39, 205–234. doi: 10.1016/s0065-2911(08)60017-x
Shi, W., Moon, C. D., Leahy, S. C., Kang, D., Froula, J., Kittelmann, S., et al. (2014). Methane yield phenotypes linked to differential gene expression in the sheep rumen microbiome. Genome Res. 24, 1517–1525. doi: 10.1101/gr.168245.113
Soest, P. J. V., Robertson, J. B., and Lewis, B. A. (1991). Methods for dietary fiber, neutral detergent fiber, and nonstarch polysaccharides in relation to animal nutrition. J. Dairy Sci. 74, 3583–3597. doi: 10.3168/jds.s0022-0302(91)78551-2
Strobel, H. J. (1992). Vitamin B12-dependent propionate production by the ruminal bacterium Prevotella ruminicola 23. Appl. Environ. Microbiol. 58, 2331–2333. doi: 10.1128/aem.58.7.2331-2333.1992
Sun, Y., Angerer, J. P., and Hou, F. J. (2015). Effects of grazing systems on herbage mass and liveweight gain of tibetan sheep in eastern qinghai-tibetan plateau. China. Rang. J. 37, 181–190. doi: 10.1071/rj14062
Sylvester, J. T., Karnati, S. K. R., Yu, Z., Morrison, M., and Firkins, J. L. (2004). Development of an assay to quantify rumen ciliate protozoal biomass in cows using real-time PCR. J. Nutr. 134, 3378–3384. doi: 10.1093/jn/134.12.3378
Tajima, K., Aminov, R. I., Nagamine, T., Matsui, H., Nakamura, M., and Benno, Y. (2001). Diet-dependent shifts in the bacterial population of the rumen revealed with real-time PCR. Appl. Environ. Microbiol. 67, 2766–2774. doi: 10.1128/AEM.67.6.2766-2774.2001
Uyeno, Y., Sekiguchi, Y., Tajima, K., Takenaka, A., Kurihara, M., and Kamagata, Y. (2010). An rRNA-based analysis for evaluating the effect of heat stress on the rumen microbial composition of Holstein heifers. Anaerobe 16, 27–33. doi: 10.1016/j.anaerobe.2009.04.006
Wang, Q., Garrity, G. M., Tiedje, J. M., and Cole, J. R. (2007). Naive Bayesian classifier for rapid assignment of rRNA sequences into the new bacterial taxonomy. Appl. Environ. Microbiol. 73, 5261–5267. doi: 10.1128/AEM.00062-07
Wei, C., Wang, H., Liu, G., Zhao, F., Kijas, J. W., Ma, Y., et al. (2016). Genome-wide analysis reveals adaptation to high altitudes in Tibetan sheep. Sci. Rep. 6:26770. doi: 10.1038/srep26770
Wolkovich, E. M., Cook, B. I., and Davies, T. J. (2014). Progress towards an interdisciplinary science of plant phenology: building predictions across space, time and species diversity. New Phytol. 201, 1156–1162. doi: 10.1111/nph.12599
Xiao, X., Zhang, T., Peter Angerer, J., and Hou, F. (2020). Grazing seasons and stocking rates affects the relationship between herbage traits of alpine meadow and grazing behaviors of tibetan sheep in the qinghai-tibetan plateau. Animals 10:488. doi: 10.3390/ani10030488
Xu, T., Xu, S., Hu, L., Zhao, N., Liu, Z., Ma, L., et al. (2017a). Effect of dietary types on feed intakes, growth performance and economic benefit in tibetan sheep and yaks on the qinghai-tibet plateau during cold season. PLoS One 12:e0169187. doi: 10.1371/journal.pone.0169187
Xu, T., Zhao, N., Hu, L., Xu, S., Liu, H., Ma, L., et al. (2017b). Characterizing CH4, CO2 and N2O emission from barn feeding Tibetan sheep in Tibetan alpine pastoral area in cold season. Atmos. Environ. 157, 84–90. doi: 10.1016/j.atmosenv.2017.03.023
Xue, B., Zhao, X. Q., and Zhang, Y. S. (2005). Seasonal changes in weight and body composition of yak grazing on alpine-meadow grassland in the Qinghai-Tibetan plateau of China1. J. Anim. Sci. 83, 1908–1913. doi: 10.2527/2005.8381908x
Xue, D., Chen, H., Zhao, X., Xu, S., Hu, L., Xu, T., et al. (2017). Rumen prokaryotic communities of ruminants under different feeding paradigms on the Qinghai-Tibetan Plateau. Syst. Appl. Microbiol. 40, 227–236. doi: 10.1016/j.syapm.2017.03.006
Yang, C., Gao, P., Hou, F., Yan, T., Chang, S., Chen, X., et al. (2018). Relationship between chemical composition of native forage and nutrient digestibility by Tibetan sheep on the Qinghai-Tibetan Plateau. J. Anim. Sci. 96, 1140–1149. doi: 10.1093/jas/sky002
Zhang, H., Shao, M., Huang, H., Wang, S., Ma, L., Wang, H., et al. (2018). The dynamic distribution of small-tail han sheep microbiota across different intestinal segments. Front. Microbiol. 9:32. doi: 10.3389/fmicb.2018.00032
Zhang, Z., Xu, D., Wang, L., Hao, J., Wang, J., Zhou, X., et al. (2016). Convergent evolution of rumen microbiomes in high-altitude mammals. Curr. Biol. 26, 1873–1879. doi: 10.1016/j.cub.2016.05.012
Keywords: Tibetan sheep, rumen microbiota diversity, rumen microbiota function, phenological periods, adaptability
Citation: Liu H, Hu L, Han X, Zhao N, Xu T, Ma L, Wang X, Zhang X, Kang S, Zhao X and Xu S (2020) Tibetan Sheep Adapt to Plant Phenology in Alpine Meadows by Changing Rumen Microbial Community Structure and Function. Front. Microbiol. 11:587558. doi: 10.3389/fmicb.2020.587558
Received: 26 July 2020; Accepted: 22 September 2020;
Published: 26 October 2020.
Edited by:
Anil Kumar Puniya, National Dairy Research Institute (ICAR), IndiaReviewed by:
Neeta Agarwal, Indian Veterinary Research Institute (IVRI), IndiaBirbal Singh, Indian Veterinary Research Institute (IVRI), India
Copyright © 2020 Liu, Hu, Han, Zhao, Xu, Ma, Wang, Zhang, Kang, Zhao and Xu. This is an open-access article distributed under the terms of the Creative Commons Attribution License (CC BY). The use, distribution or reproduction in other forums is permitted, provided the original author(s) and the copyright owner(s) are credited and that the original publication in this journal is cited, in accordance with accepted academic practice. No use, distribution or reproduction is permitted which does not comply with these terms.
*Correspondence: Shixiao Xu, c3h4dUBud2lwYi5jYXMuY24=; Xinquan Zhao, eHF6aGFvQG53aXBiLmNhcy5jbg==; eHF6aGFvQG53aXBiLmFjLmNu
†These authors have contributed equally to this work