 Jorge A. Arias-del-Angel1
 Rebeca G. Manning-Cela
 Moisés Santillán
94% of researchers rate our articles as excellent or good
Learn more about the work of our research integrity team to safeguard the quality of each article we publish.
Find out more
ORIGINAL RESEARCH article
Front. Microbiol., 02 October 2020
Sec. Systems Microbiology
Volume 11 - 2020 | https://doi.org/10.3389/fmicb.2020.559660
This article is part of the Research TopicMultiscale Computational Approaches in Infectious Diseases View all 8 articles
In a recent work we demonstrated that Trypanosoma cruzi trypomastigotes change their motility patterns in the presence of mammalian cells, that the extent of the changes depends on the cell line, and that this extent is positively correlated with the efficiency with which parasites invade the different cell lines. These results open the question of what cellular characteristics are relevant for parasite identification and invasion. In the present work, we tackled such question. We performed infection-kinetics experiments on various cell lines, and developed a mathematical model to simulate the experimental outcomes. An analysis of the cell-parasite mechanisms included in the model, together with the parameter values that allowed it to replicate the experimental results, suggests that a process related to the cell replication rate may strongly influence the parasite invasion efficiency, and the infection dynamics in general.
Chagas disease was first described in 1909 by the Brazilian physician Carlos Chagas, after whom it is named. It is one of the neglected tropical diseases (NTDs) recognized by the World Health Organization (Rassi et al., 2012; Pérez-Molina and Molina, 2018). This disease, also known as American trypanosomiasis, is a tropical parasitic disease endemic to Latin America, that is caused by the protist Trypanosoma cruzi. Chagas disease is commonly spread to humans and other mammals by the blood-sucking kissing bugs of the subfamily Triatominae. The disease may also be spread through blood transfusion, organ transplantation, eating food contaminated with the parasites, and by vertical transmission (from a mother to her fetus). It is estimated that 8 million people, mostly in Mexico, Central America, and South America, have Chagas disease (WHO, 2020). Large-scale population movements have increased the areas where Chagas disease can be found, and these include many European countries, some African, Eastern Mediterranean and Western Pacific countries, Canada and the United States of America.
The interest in Chagas disease has increased over the last few years (Tanowitz et al., 1992; Paucar et al., 2016; Fonseca-Berzal et al., 2018; Lidani et al., 2019). Different aspects such as: development of new drugs, interaction of the parasite with the host immune system, parasite genomics, vaccine development, improved diagnosis methods, etc. are currently investigated by several groups worldwide. However, in spite of this increased interest, research on the parasite cell interaction from the standpoints of biophysics or non-linear dynamics is scarce.
It was shown than even when all T. cruzi stages are capable of establishing a cell infection in vitro, trypomastigote and amastigote stages exhibit a better infective performance than epimastigotes (Florencio-Martínez et al., 2010). However, in an in vivo scene, it has been demonstrated that only trypomastigotes and amastigotes are able to establish an infection; starting it within macrophages, smooth and striated muscle cells, as well as fibroblast (Andrade and Andrews, 2005). During this first cell-parasite interaction, T. cruzi amastigotes and trypomastigotes can employ different mechanism to get inside a cell (Burleigh and Woolsey, 2002; Andrade and Andrews, 2005). It has also been proposed that an interaction between a non-infected cell with an infected cell could encourage the infection of the first. This has been speculated as the movement of a parasite from the infected cell to the non-infected cell though the membrane of both cells, however this process has not been demonstrated yet.
In a recent work (Arias-del Angel et al., in press), we demonstrated that T. cruzi trypomastigotes of CL Brener strain change their motility patterns in the presence of in vitro cultured mammalian cells, albeit to a different extent depending on the cell line. Moreover, the extent of these changes is positively correlated with the efficiency with which trypomastigotes invade the studied cell lines. Although these results are quite suggestive, we were unable to pinpoint possible cell characteristics that influence parasite recognition and invasion. The present work is aimed at tackling this question, by means of an approach that combines experimental work and mathematical modeling.
The manuscript is organized as follows. In section 2, we present the materials and methods employed in our experiments. In section 3, we introduce a mathematical model for the interaction between parasites and mammalian cell cultures. In section 4, we present the results of infection-kinetics experiments with various mammalian cell lines, together with the corresponding numerical simulations. Finally, in section 5, we discuss the experimental and numerical results and derive the corresponding conclusions.
3T3 NIH embryonic mouse fibroblasts (ATCC® CRL-1658™), 3T3 Swiss-Albino (3T3-S) embryonic mouse fibroblasts (ATCC® CCL-92™), H9c2(2-1) rat myoblasts (ATCC® CRL-1446™), and Caco2 human colon epithelial (ATCC® HTB-37™) cells were grown in Dulbecco's Modified Eagle Medium (DMEM), supplemented with 10% fetal bovine serum (FBS) and 0.5% penicillin/streptomycin (100 μl/ml penicillin/streptomycin), at 37°C in an atmosphere of 5% CO2.
Fluorescent epimastigotes from CL Brener strain were maintained in liver infusion tryptose (LIT) medium, supplemented with 10% fetal bovine serum (FBS), 0.5% penicillin (10,000 IU)/streptomycin (10,000 μg), and 1% hemin (5 mg/ml), at 28°C. These stable transfected parasites were obtained in a previous work by electroporation with pTREXn-GFP DNA (Florencio-Martínez et al., 2010). Cell-culture-derived trypomastigotes (CCDT) were obtained from supernatant of 3T3 NIH fibroblast monolayers infected with GFP-transfected parasites, as described below.
Inoculums of 2 × 10⁴ cells were seeded in well plates with DMEM + 10% FBS. To estimate the cell count in a given well, they were washed with PBS and dyed with 200 μl of Hoechst. The plates were then incubated in darkness at 37°C and 5% CO2 for at least 30 min. Afterwards, the wells were excited with a 405 nm laser diode, and 8 pictures were taken at random positions by means of a fluorescence microscope with a 10X objective. This configuration yielded images corresponding to well surfaces of 1.056 × 0.0845 mm. The obtained images were analyzed with a custom software implemented in MatLab. Basically, this software employs the bwdist and watershed functions to segment the parts of the image corresponding to nucleus. The nucleus in an image were then counted using the regionprops function.
To obtain CCDTs, monolayers of NIH 3T3 cells grown to 50% confluence, were infected with 1 × 10⁶ mid-log-phase epimastigotes suspended in DMEM plus 2% FBS, on a final volume of 5 ml. The cells were washed 48 h after cell-parasites interaction with DMEM to remove non-adherent parasites, and fresh DMEM medium plus 2% FBS was added. This process was repeated every other day, following previous reports (Manning-Cela et al., 2001). The first released CCDTs were used for all experiments, because they contained very little amount of contaminating amastigotes. In infection kinetics, 1.95 × 10⁵ (1-3 parasites per cell) fluorescent CCDTs, obtained from the primary infection, were used to infect 3T3 NIH, 3T3-S, H9c2(2-1) and Caco2 cells grown over coverslips at 50% confluence. After 2 h of cell-parasite interaction, the cultures were washed with DMEM to remove non-adherent parasites, and the culture medium (DMEM plus 2% FBS) was renewed every 48 h during 18 days. Coverslips were recovered at different times (0.75, 2, 3, 5, 7, 9, 11, 13, and 18 days post initial-interaction) and then washed with 1X PBS, fixed with formaldehyde at 3.7% for 20 min at room temperature, washed again with 1X PBS, and finally mounted and stained with Vectashield with DAPI (Vector, Cat. 1,500). The samples were analyzed with a LEICA confocal microscope, with a 40X oil-immersion objective (NO 24) and the fluorescence images captured and analyzed using the software MatLab. As the trypomastigote stage was used to initiate the infections, a host cell was considered infected if at least one amastigote was observed inside a cell (Lentini et al., 2017). The percentage of infected cells was calculated by comparing the number of cells containing parasites to the total number of cells.
In this section, we develop a model for the dynamics of mammalian cell infection by T. cruzi trypomastigotes—see Figure 1 for a schematic representation. The model is inspired on the classical epidemiological model first introduced by Kermack and McKendrick (1991). It considers three different populations: susceptible cells (S), infected cells (I), and free parasites (P), whose evolution is governed by the following set of delay differential equations:
The model assumes that the susceptible cells can get infected when they get in contact with either parasites or infected cells; that infected cells undergo an incubation period of length τ, after which they are lysed and liberate several parasites to the environment; and that susceptible and infected cells can replicate according to logistic equations, while they compete for medium resources. Equations (1)–(3) are balance equations, and the meaning of the corresponding right-hand-side (rhs) terms is as follows. The first rhs terms in Equations (1) and (2) respectively account for the growth rates of susceptible and infected cells. Regarding the parameters in these terms, rS and rI are the intrinsic growth rate constants of susceptible and infected cells, while K is the environment carrying capacity. The second rhs terms in Equations (1) and (2) stand for the rate of infection of susceptible cells due to interactions with parasites or infected cells. These terms assume mass-action-law kinetics. β is the rate constant for the infection of susceptible cells by parasites, and γ is the rate constant for the infection of susceptible cells when they get in contact with infected ones. The last term in Equation (3) accounts for the fact that, when a trypomastigote invades a cell, it stops being a free parasite. The third rhs term in Equation (2) takes into consideration that the number of infected cells that die at time t, equals the number of them that got infected at time t − τ (Xτ denotes X(t − τ)), times a factor of the form —with μ(t′) the replication rate of infected cells—which accounts for the replication of infected cells in the interval [t − τ, t] (see the Appendix A1 for a formal derivation). Finally, the first rhs term in Equation (3) accounts for the fact that each time an infected cell is lysed, it liberates δ trypomastigotes to the environment. Observe that Equations (1)–(3) lack death rate terms for parasites and cells (other than the lysis of infected cells). The reasons for this are that: in the case of mammalian cells, such death rates are intrinsically incorporated into the logistic growth rates; whereas in the case of parasites, our experimental protocol contemplates the removal of the culture medium (and thus of the majority of free parasites) every other day, and parasite death is negligible in such period of time.
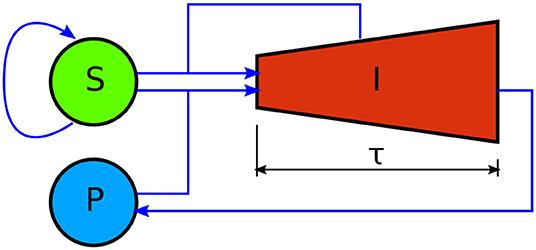
Figure 1. Schematic representation of the mathematical model here developed to account for the dynamics of mammalian cell infection by T. cruzi trypomastigotes. S, I, and P, respectively stand for the amount of susceptible mammalian cells, infected mammalian cells, and parasites. Blue arrows denote interactions between compartments. Susceptible cells self-replicate. They get infected via interactions with infected cells and parasites. Unlike the other model variables, infected cells have an age structure, indicated by the shape of the corresponding compartment. They undergo an incubation period of length τ, after which they are lysed and liberate numerous new parasites to the medium. Infected cells also self-replicate. This is represented by the increasing height of compartment I.
We started by characterizing the growth kinetics of the different cell lines here studied. Following the methodology in the section 2, we cultured the 3T3 S, Caco2, 3T3 NIH, and H9c2(2-1) cell lines, and measured the time evolution of the corresponding cell counts. The obtained results are presented in Figure 2. Notice that the cell growth curves can be fitted by the solution of Equation 1, without the infection terms, which corresponds to the following logistic function:
We performed the fitting by means of MatLab's algorithm lsqcurvefit. The best fitting curves are shown in Figure 2 for all cell lines, and the corresponding best-fitting parameter values are tabulated in Table 1. The resulting values for rS and K can be respectively interpreted as the intrinsic growth rates of susceptible cells and the corresponding carrying capacities.
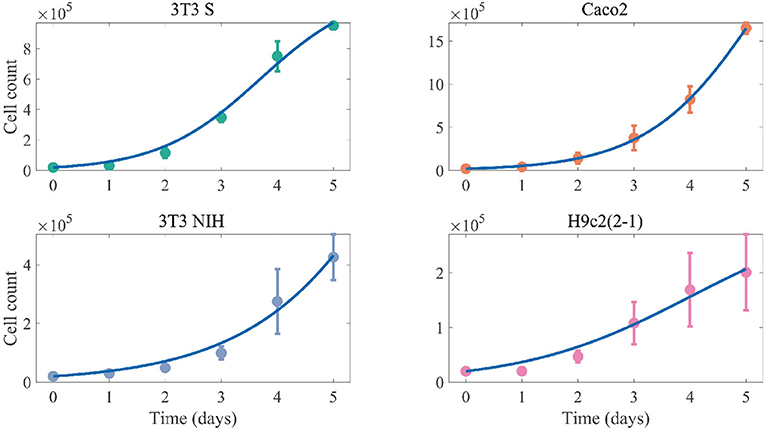
Figure 2. Cell-count time evolution in cultures of different mammalian cell lines. The dots represent experimental values (averaged over 3 independent experiments), while the error bars denote standard deviations. The solid lines correspond to the best fitting logistic functions.
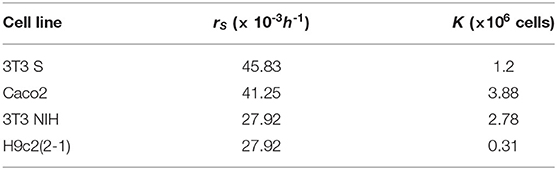
Table 1. Logistic-function best fitting parameter values for all analyzed cell lines.
We followed the infection kinetics of the 3T3 S, Caco2, 3T3 NIH, and H9c2(2-1) cells, using the methodology described in the section 2. In short, we added 1-3 parasites per cell to ~50%-confluence cell cultures, and let them interact for 2 h before exchanging the culture medium. Afterwards, we washed and changed the culture medium (repeating this procedure every other day), and measured the fraction of infected cells at different times. Since we employed GFP-transfected parasites, and given that amastigote is the parasite obligated intracellular stage, a recently infected cell could be identified because there is at least one amastigote (a spherical green spot) nearby the cell nucleus (Lentini et al., 2017). The fraction of infected cells was then calculated as the ratio of cells with amastigotes (or trypomastigotes for advanced infections) within to the total cell count in a picture. Regarding the number of parasites per infected cell, we estimated this parameter by means of a custom program in MatLab when only amastigotes were present. In the case of the cells with trypomastigotes, we could not perform the estimation due to the geometrical irregularity of this parasite stage. The average parasite count at 18 h and 7 days post intractions are tabulated in Table 2.

Table 2. Average parasite count per infected cell at different times post interaction (TPI).
The results concerning the evolution of the fraction of infected cells are shown in Figure 3. Interestingly, the employed cell lines follow very different infection kinetics, despite the infectious agent being the same in all cases. To better make sense of the infection-kinetics results, we performed simulations using the formerly introduced mathematical model. To this end, we implemented in MatLab the following numerical protocol, which involves numerically solving the model equations by means of the Euler's algorithm (with Δt = 0.01 h):
1. This step simulates the process of culturing the mammalian cells until they get a ~50% confluence. Notice that, when I = P = 0, the model equation system reduces to the logistic model for the susceptible compartment. Taking this into account, we solved the resulting logistic ordinary differential equation, with S(t0) = 0.01 K, for a time long enough so that S(tf) = K/2, with tf the final simulation time. Then, we set t ← t − tf so the next step starts at time zero.
2. To simulate the interaction between cells and parasites, we numerically solved the model system of delay differential equations for 2 h, using the solution of the previous step as initial condition for S. The initial condition for I was set to zero for all t ≤ 0. The initial condition for P was zero for t < 0, and to P0 for t = 0, with (which correspond to 1-3 parasites per cell at a confluence of 50%).
3. The next simulation step consisted in numerically solving the model delay differential equation system for 48 h (i.e., the initial and final simulation times were t = 2 h and t = 50 h), with the accumulated solution for S, I, and P as initial condition, except that P was set to zero at t = 2 h to simulate the culture medium replacement.
4. Step 3 was iterated, increasing the simulation time by 48 h in each iteration, until the total simulation time reached the duration of the experiment (18 days).
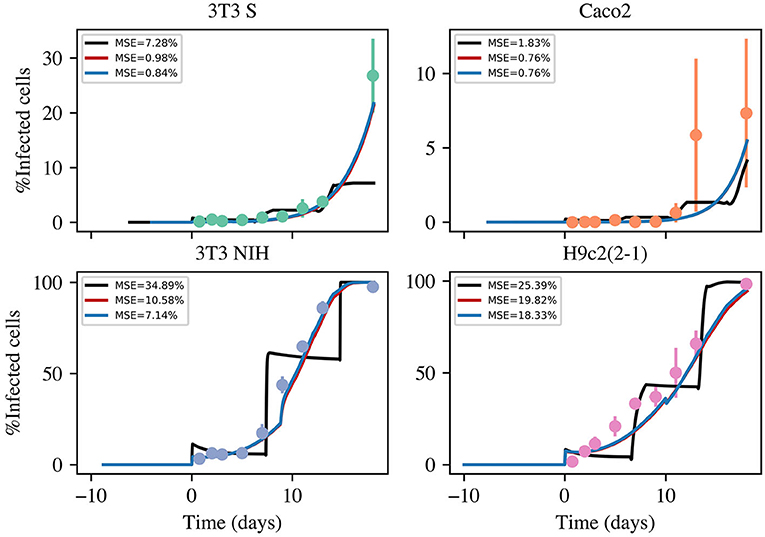
Figure 3. Time evolution of the fraction of infected cells in infection kinetics experiments with different mammalian cell lines. The dots represent experimental values (averaged over 3 independent experiments), while the error bars denote standard deviations. The solid lines correspond to the best fitting curves obtained from numerical solutions of three model versions. The color code is as follows: black, basic model; red, intermediate model; and blue, most complete model. The acronym MSE in the figure legends stands for mean standard error.
We attempted to use Matlab's dde23 built method to numerically solve the model equations. However, it was not possible to adapt it to the specific needs of our simulations. More specifically, in the experimental setup, we let parasites interact with ~50%-confluence cell cultures for 2 h, and then renewed the cell culture medium (and thus removed free swimming parasites) every other day, to guarantee cell viability. Thus, to mimic such experiments, we needed to numerically solve the model equations in time intervals of different lengths, and use the accumulated partial solution as the initial condition for the next step. Since the format of dde23's returned solution is incompatible with these requirements, we decided to program our own numeric algorithm.
In principle, we can simulate the infection-kinetics experiments by running the above described numerical protocol, provided we have accurate parameter estimations. As explained above, we were able to experimentally obtain estimates for rS and K. For the rest of the parameters (β, γ, δ, τ, and rI), we do not have good estimates. Thus, we performed the Inverse Analysis by inferring these parameter's values using Bayesian statistics (Colin et al., 2013). We assumed Gaussian priors for all parameters. The corresponding mean values were selected by empirically finding parameter values that rendered a good fit. The standard deviations were set equal to 1/10 times the mean values. We experimented with wider priors, but we did not obtain satisfactory fits. Let be the fraction of infected cells experimentally measured at times , and let f(s)(t) = I(t)/(I(t) + S(t)) be the fraction of infected cells predicted by the simulation with a given set of parameter values. From this, the likelihood function we used for the Bayesian inference analysis is as follows:
with σ = 2.5. To obtain Monte Carlo samples from the posterior distribution, we made use of a t-walk Markov chain Monte Carlo (MCMC) method (Christen and Fox, 2010). This is a self-adjusting MCMC algorithm and the resulting sampler is efficient in most cases for this low dimensional problem.
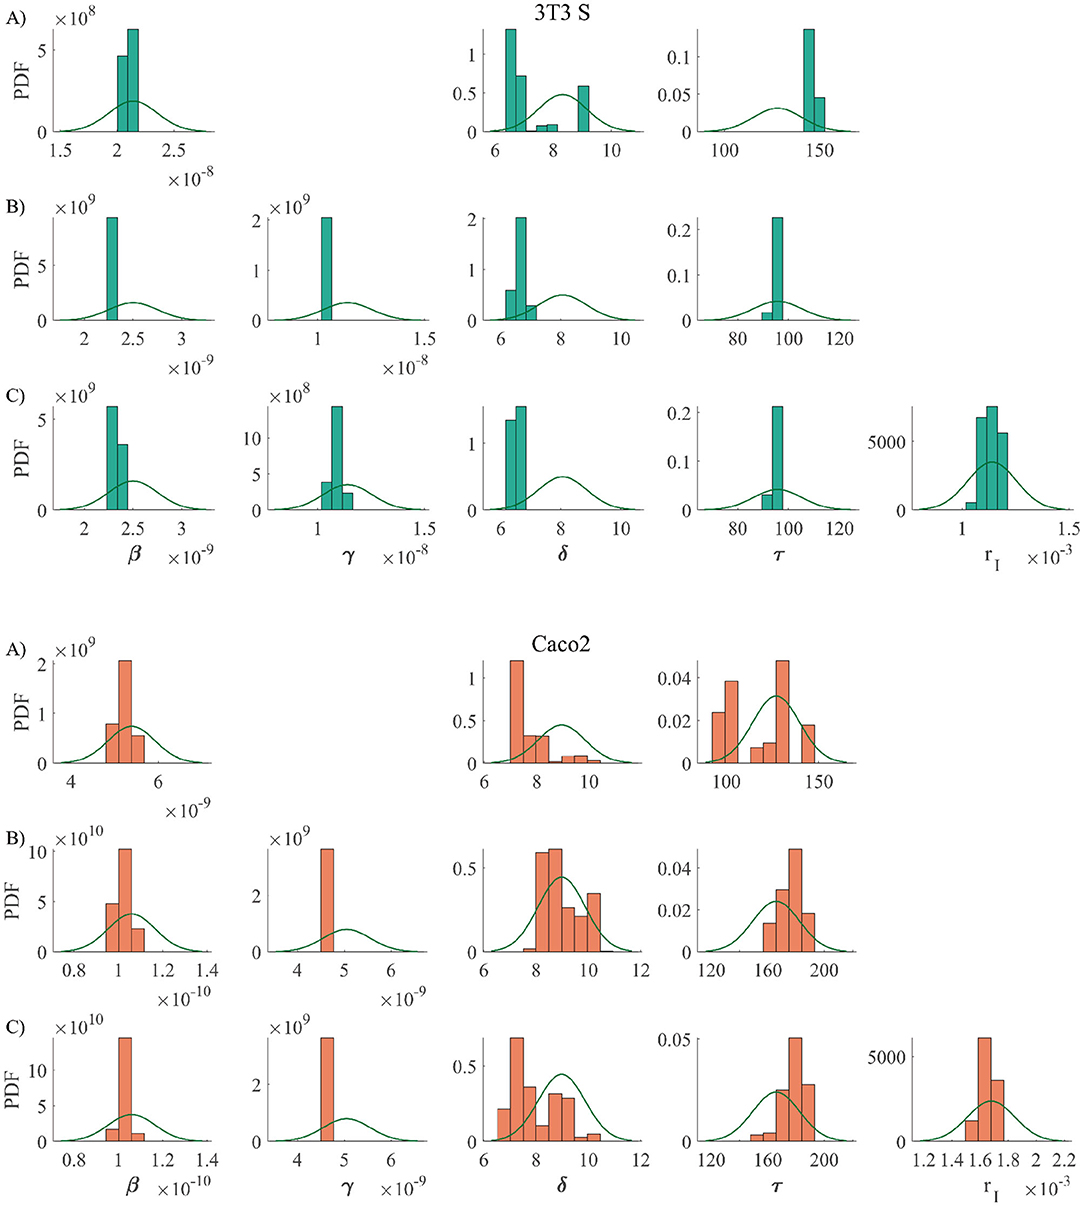
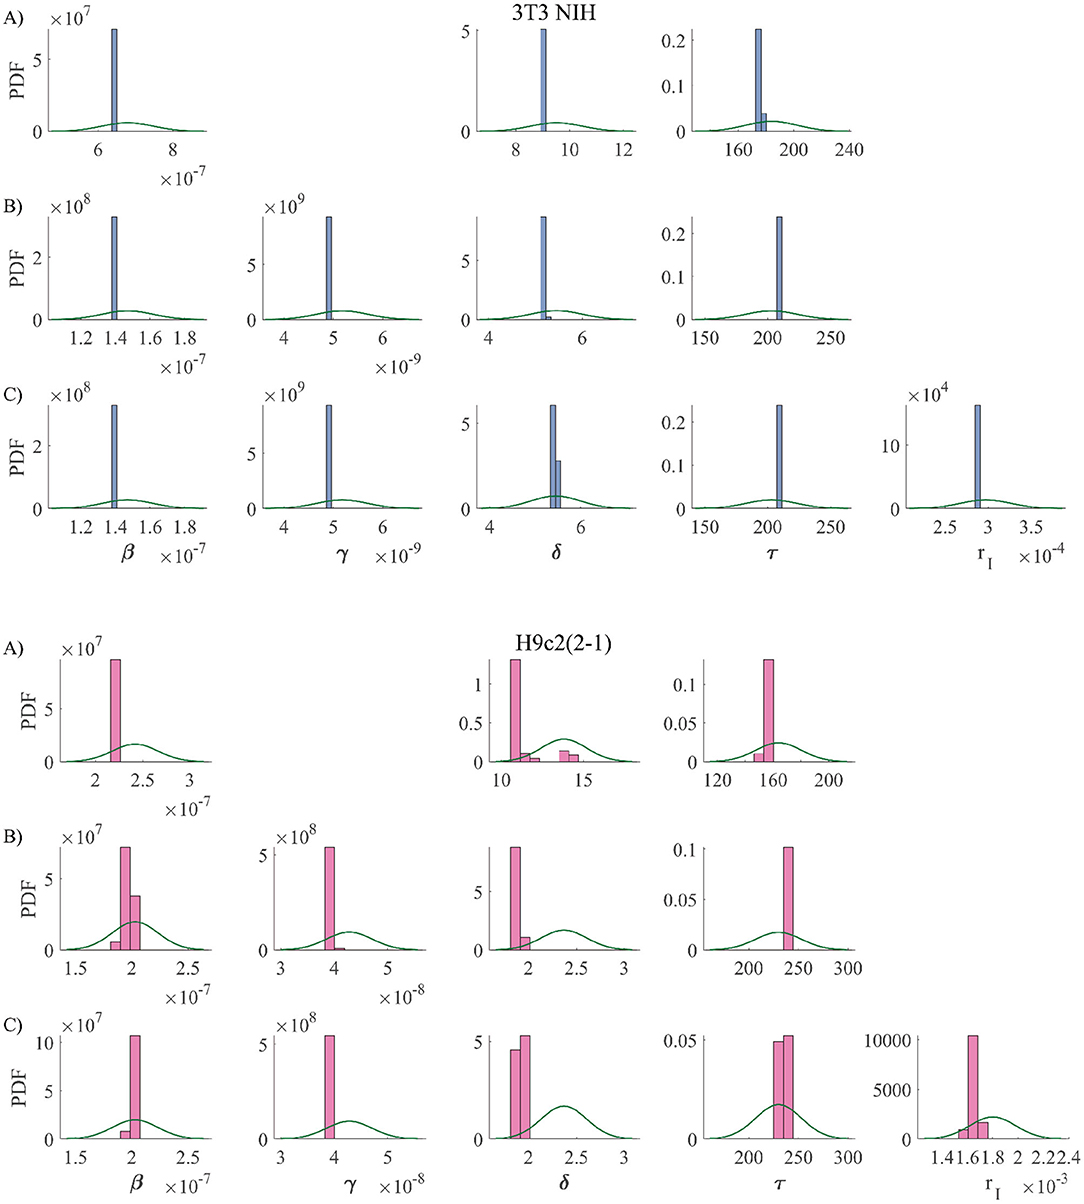
Using the above described method, we considered three different version models. One (the simplest) which only considers infections via cell-parasite interactions and replication of non-infected cells. An intermediate model that also takes into account cell-to-cell infections. And, finally, the most complete model, which contemplates cell-to-cell infections and replication of infected cells. The results are summarized in Figure 3. The priors for all parameters and the histograms of the corresponding posterior samples are shown in Appendix A2 for all model versions. The model solutions plotted in Figure 3 were computed with the mean values of the corresponding posterior samples. Observe that the most basic model is incapable of reproducing the experimental results. Instead of yielding monotonically growing curves, it returns stair-like responses. The reason is that, when parasites are removed every other day, the infection stops abruptly and one has to wait until new parasites are released for cell infection to continue. When cell-to-cell infections are taken into consideration, the infection process can continue, even when parasites are removed from the culture medium. This is the reason why the intermediate model is able to reproduce the experimental results. Finally, when proliferation of infected cells is incorporated into the model, the fitting errors are reduced a little, but not significantly. In conclusion, our results suggest that cell-to-cell infection plays an important role during the kinetics of T. cruzi infections, while replication of infected cells is not so important from an infection-dynamics perspective. From the above discussion, we decided to use the intermediate model version from now on. The mean values and standard deviations (obtained from the posterior samples) for all the parameters in the intermediate model are tabulated in Table 3.
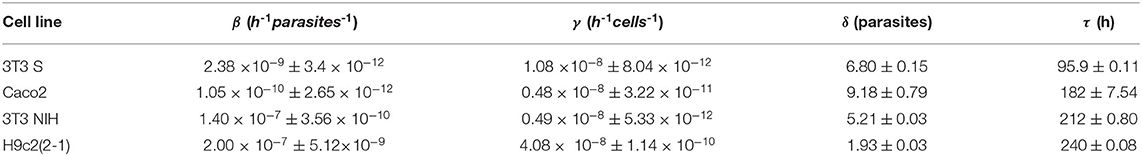
Table 3. Intermediate-model best fitting parameter values for all analyzed cell lines.
In this work we have performed in vitro infection-kinetics experiments with T. cruzi CL Brener strain and different mammalian cell lines. The variability of the obtained results is noteworthy. Intriguingly, the infections progresses are considerably more slowly in 3T3 S than on 3T3 NIH cells, in spite of both being fibroblasts. Whereas the totality of 3T3 NIH cells are infected by day 15, only about one third of 3T3 S have been infected at day 18. This difference on the infectious behavior of T. cruzi trypomastigotes has already been reported, indicating that the infectious performance can change, not only among parasite strains, but also according to the infected cell line (Melo and Brener, 1978; Bertelli and Brener, 1980; Vargas-Zambrano et al., 2013; Zingales, 2018). It is also interesting that Caco2 cells are very hard to infect (only about 10 percent of the cultured cells have been infected by day 18), despite they are derived from colon, and this is one of the more infected organs by CL Brener T. cruzi strain (Zingales et al., 2012). We attempted to extend the experiments for longer periods of time in the case of 3T3 S and Caco2 cells. However, it was not possible because the cells detached from the glass substrate. Since, in vivo infection experiments have shown that T. cruzi parasites show some preference to infect cardiac and digestive-system tissues, it could be expected that Caco2 cells were more efficiently infected that other cell lines. However, we obtained the opposite result. Interestingly, our experimental results agree with those of Martello et al. (2013), who found that, when infected with trypomastigotes (Brazillian strain), the percentage of infected Caco2 cells never exceeded 0.15% after 11 days of the initial interaction. We believe this paradoxical result has to do with the fact that Caco2 cells are derived from cancerous tissue, and some of the genetic modifications caused by this disease have made them resistant to infection by T. cruzi trypomastigotes.
To help us make sense of the above discussed results, we developed a mathematical model for the infection dynamics. The results of the model simulations are shown in Figure 3, where we can appreciate how the simulations fit the experimental results. To get these fits, we had to incorporate into the model the assumption that susceptible cells can get infected when they interact with infected cells. We also considered the possibility that infected cells can replicate, but it resulted unnecessary. In this regard, our modeling results suggest that cell-to-cell transmission of the parasite plays a non-negligible role in the infection dynamics.
A few facts about the parameter values in Table 3 deserve further discussion:
• The obtained τ values correspond to incubation times in the range from 4 to 10 days, which agree with experimental observations.
• The value of parameter γ resulted to be at least twice as large for the H9c2(2-1) than for any other cell line. This makes sense if we consider that H9c2(2-1) cells are myoblasts, and thus cell contacts are more prominent than in other cell lines, even at medium confluences.
• Intriguingly, the estimated values of δ (average number of parasites released per lysed infected cell) are consistently smaller than the measured average count of amastigotes per infected cell (Table 2). We do not have a proper explanation for this discrepancy, but believe that it may be to the fact that parasite-cell interactions are modeled via the mass action law, which implicitly assumes that the system is well mixed. In our experimental setup, the system not only cannot be considered well mixed, because the cells are immobile, but the distribution of mammalian cells is 2-dimensional, while that of parasites is 3-dimensional. This topology implies that only those parasites in the vicinity of the monolayer can eventually infect the cells in it. Thus, the mass action law approximation would only be valid for a small region above the cell monolayer. Since in our experiments, most of the parasites released by infected cells swim away, this could explain the low δ values. Interestingly, Sibona et al. (2005) fitted a different population model to T. cruzi populations in mice. They found a relatively small number of parasites emerging from a cell burst (between 2.2 and 14), depending on mice and parasite strain. These values are not too far from the ones we obtained here for the in vitro experiments.
One can notice the existence of some correlations among the best-fitting parameter values in Table 3. For instance, parameter rS, seems to be negatively correlated with β. To explore this in a more quantitative way, we computed the Pearson correlation coefficient between all pairs of parameters, considering the four studied cell lines. The results are illustrated in Figure 4. Observe that only a few correlations have absolute values larger than 0.9, among them, that between rS and β. Although it is impossible to demonstrate a cause-effect relation from variable correlations, the notion (derived from the correlation network in Figure 4) that a mechanism related to the cell replication rate, rS, may strongly influence the efficiency of infection, β, is very suggestive. Indeed, it could help us understand why Caco2 cells are so resistant to T. cruzi infection (being derived from cancerous tissue, they have a large proliferation rate). If a functional relation could be identified between the rate of proliferation and the rate of infection of a given cell line, it could have potential biomedical implications.
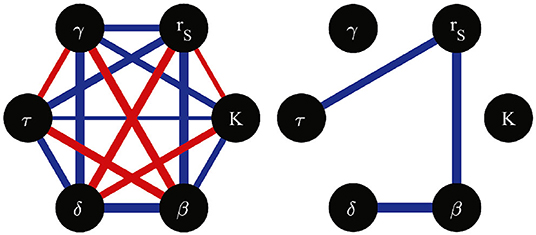
Figure 4. Network of correlation coefficients between pairs of model parameters, computed from the parameter values estimated for the four studied cell lines. Red (blue) edges indicate positive (negative) correlations. The absolute value of the correlation coefficient is represented by the corresponding edge width. All possible edges are illustrated in the left hand side graph. The right hand side graph only shows the edges corresponding to correlation coefficients with absolute vales larger than 0.9.
The raw data supporting the conclusions of this article will be made available by the authors, without undue reservation.
JA-d-A performed research, contributed analytic tools, analyzed data, and contributed to writing the manuscript. RM-C and MS designed research, contributed analytic tools, performed research, analyzed data, and wrote the manuscript. All authors reviewed the manuscript.
This work was partially financially supported by CONACYT-México: grant Nos. 6671 (RM-C) and INFRA-302610 (MS), as well as by SEP-CINVESTAV: grant No. 244 (RM-C). JA-d-A was granted a doctoral scholarship by CONACYT-México (No. 457791).
The authors declare that the research was conducted in the absence of any commercial or financial relationships that could be construed as a potential conflict of interest.
The authors are grateful to Dr. Marcos A. Capistrán-Ocampo, for generously sharing a Bayesian-inference code implemented by his group; to Claudia Marquéz-Dueñas for her invaluable technical assistance; and to Armando M. Moreno-Amador and Abel E. Martinez-Luna for their fruitful data-analysis suggestions and technical assistance.
Andrade, L. O., and Andrews, N. W. (2005). The Trypanosoma cruzi–host-cell interplay: location, invasion, retention. Nat. Rev. Microbiol. 3, 819–823. doi: 10.1038/nrmicro1249
Arias-del Angel, J. A., Santillan, M., and Manning-Cela, R. G. (in press). Motility patterns of Trypanosoma cruzi trypomastigotes are correlated to parasite invasion efficiency in vitro. Sci. Rep. doi: 10.1038/s41598-020-72604-4
Bertelli, M. S. M., and Brener, Z. (1980). Infection of tissue culture cells with bloodstream trypomastigotes of Trypanosoma cruzi. J. Parasitol. 66, 992–997. doi: 10.2307/3280403
Burleigh, B. A., and Woolsey, A. M. (2002). Cell signalling and Trypanosoma cruzi invasion. Cell. Microbiol. 4, 701–711. doi: 10.1046/j.1462-5822.2002.00226.x
Christen, J. A., and Fox, C. (2010). A general purpose sampling algorithm for continuous distributions (the t-walk). Bayesian Anal. 5, 263–281. doi: 10.1214/10-ba603
Colin, F., Heikki, H., and Andrés, C. J. (2013). “Inverse problems,” in Bayesian Theory and Applications, eds P. Damien, P. Dellaportas, N. G. Polson, and D. A. Stephens (Oxford: Oxford University Press), 619–643. doi: 10.1093/acprof:oso/9780199695607.003.0031
Florencio-Martínez, L., Márquez-Dueñas, C., Ballesteros-Rodea, G., Martínez-Calvillo, S., and Manning-Cela, R. (2010). Cellular analysis of host cell infection by different developmental stages of Trypanosoma cruzi. Exp. Parasitol. 126, 332–336. doi: 10.1016/j.exppara.2010.04.015
Fonseca-Berzal, C., Arán, V. J., Escario, J. A., and Gómez-Barrio, A. (2018). Experimental models in chagas disease: a review of the methodologies applied for screening compounds against Trypanosoma cruzi. Parasitol. Res. 117, 3367–3380. doi: 10.1007/s00436-018-6084-3
Kermack, W. O., and McKendrick, A. G. (1991). Contributions to the mathematical theory of epidemics—i. Bull. Math. Biol. 53, 33–55. doi: 10.1007/bf02464423
Lentini, G., Pacheco, N. D. S., and Burleigh, B. A. (2017). Targeting host mitochondria: a role for the Trypanosoma cruzi amastigote flagellum. Cell. Microbiol. 20:e12807. doi: 10.1111/cmi.12807
Lidani, K. C. F., Andrade, F. A., Bavia, L., Damasceno, F. S., Beltrame, M. H., Messias-Reason, I. J., et al. (2019). Chagas disease: from discovery to a worldwide health problem. Front. Public Health 7:166. doi: 10.3389/fpubh.2019.00166
Manning-Cela, R., Cortes, A., Gonzalez-Rey, E., Voorhis, W. C. V., Swindle, J., and Gonzalez, A. (2001). LYT1 protein is required for efficient in vitro infection by Trypanosoma cruzi. Infect. Immun. 69, 3916–3923. doi: 10.1128/iai.69.6.3916-3923.2001
Martello, L. A., Wadgaonkar, R., Gupta, R., Machado, F. S., Walsh, M. G., Mascareno, E. (2013). Characterization of Trypanosoma cruzi infectivity, proliferation, and cytokine patterns in gut and pancreatic epithelial cells maintained in vitro. Parasitol. Res. 112, 4177–4183. doi: 10.1007/s00436-013-3609-7
Melo, R. C., and Brener, Z. (1978). Tissue tropism of different Trypanosoma cruzi strains. J. Parasitol. 64:475. doi: 10.2307/3279787
M'Kendrick, A. G. (1925). Applications of mathematics to medical problems. Proc. Edinburgh Math. Soc. 44, 98–130. doi: 10.1017/s0013091500034428
Paucar, R., Moreno-Viguri, E., and Pérez-Silanes, S. (2016). Challenges in chagas disease drug discovery: a review. Curr. Med. Chem. 23, 3154–3170. doi: 10.2174/0929867323999160625124424
Pérez-Molina, J. A., and Molina, I. (2018). Chagas disease. Lancet, 391, 82–94. doi: 10.1016/s0140-6736(17)31612-4
Rassi, A., Rassi, A., and de Rezende, J. M. (2012). American trypanosomiasis (chagas disease). Infect. Dis. Clin. N. Am. 26, 275–291. doi: 10.1016/j.idc.2012.03.002
Sibona, G. J., Condat, C. A., and Isasi, S. C. (2005). Dynamics of the antibody-t.cruzicompetition during chagas infection: Prognostic relevance of intracellular replication. Phys. Rev. E 71:020901. doi: 10.1103/physreve.71.020901
Tanowitz, H. B., Kirchhoff, L. V., Simon, D., Morris, S. A., Weiss, L. M., and Wittner, M. (1992). Chagas' disease. Clin. Microbiol. Rev. 5, 400–419. doi: 10.1128/cmr.5.4.400
Vargas-Zambrano, J. C., Lasso, P., Cuellar, A., Puerta, C. J., and González, J. M. (2013). A human astrocytoma cell line is highly susceptible to infection with Trypanosoma cruzi. Memórias do Instituto Oswaldo Cruz 108, 212–219. doi: 10.1590/0074-0276108022013014
WHO. World Health Organization. Available online at: https://www.who.int/chagas/en/
Zingales, B. (2018). Trypanosoma cruzi genetic diversity: something new for something known about chagas disease manifestations, serodiagnosis and drug sensitivity. Acta Trop. 184, 38–52. doi: 10.1016/j.actatropica.2017.09.017
Zingales, B., Miles, M. A., Campbell, D. A., Tibayrenc, M., Macedo, A. M., Teixeira, M. M., et al. (2012). The revised Trypanosoma cruzi subspecific nomenclature: Rationale, epidemiological relevance and research applications. Infect. Genet. Evolut. 12, 240–253. doi: 10.1016/j.meegid.2011.12.009
Consider a population of mammalian cells that got infected at different times. Let a represent the time since a given cell got infected. For simplicity let us call a the age of the infected cell. Following M'Kendrick (1925), the age structure of this population can be represented by i(t, a)da, which represents the number of cells that have ages in the interval [a, a + da] at time t. The time evolution of i(t, a) is governed by the following partial differential equation:
The first term in the right hand side of the former equation accounts for the decrease of variable i due to the aging of cells, while the second term represents cell proliferation. If we take into account that a is not independent from t but obeys the relation a = t − t0, with t0 the time of infection, then: ∂i/∂t + ∂i/∂a = di/dt, which leads to the following differential equation:
According to the method of characteristics, the solution to this differential equation is:
Recalling that a = t − t0, the above expression can be rewritten as:
where σ(t) = i(t, 0) is the flux of newly infected cells at time t. Let be the total number of infected cells at time t (τ is the age at which infected cells complete maturation and are lysed, liberating several new parasites to the environment). Substitution of the last equation allows us to translate the integral from the axis of age to that of time as follows—see Figure 5:
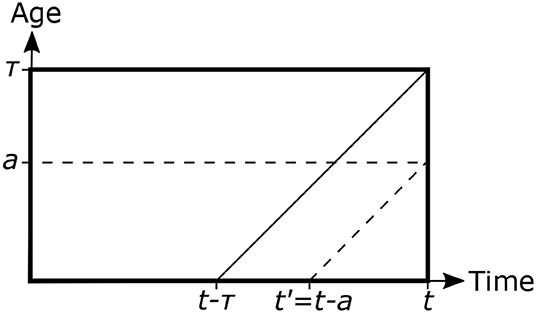
Figure 5. Scheme representing the age structure of a population of infected mammalian cells. τ represents the age at which infected cells are lysed and liberated the incubated parasites to the environment. Inclined lines are the characteristics of the partial differential equation governing the system dynamics, and indicate how the solution at any (t, a) point can be traced back to the a = 0 axis.
Let us now differentiate I(t) with respect to time
By making use of the fundamental theorem of calculus we obtain:
This last equation can be interpreted as a balance equation. The rate of change of infected cells is given by appearance of new cells due to proliferation, plus the flux of newly infected cells, minus the flux of cells undergoing lysis (which equals the flux of newly infected cells at time t − τ, times an exponential term that account for cell proliferation in the interval [t − τ, t]).
Priors are shown with solid lines, while the histograms resulting from posterior samples are shown with bar plots. The model versions are coded as follows: A), B) y C) corresponds to the simplest, intermediate, and most complete model, respectively.
Keywords: Trypanosoma cruzi, mammalian cell invasion, host-parasite interaction, infection kinetics, population dynamics model, time-delayed mathematical model
Citation: Arias-del-Angel JA, Manning-Cela RG and Santillán M (2020) Dynamics of Mammalian Cell Infection by Trypanosoma cruzi trypomastigotes. Front. Microbiol. 11:559660. doi: 10.3389/fmicb.2020.559660
Received: 06 May 2020; Accepted: 18 August 2020;
Published: 02 October 2020.
Edited by:
Jorge X. Velasco-Hernandez, National Autonomous University of Mexico, MexicoReviewed by:
Carlos Alberto Condat, National University of Cordoba, ArgentinaCopyright © 2020 Arias-del-Angel, Manning-Cela and Santillán. This is an open-access article distributed under the terms of the Creative Commons Attribution License (CC BY). The use, distribution or reproduction in other forums is permitted, provided the original author(s) and the copyright owner(s) are credited and that the original publication in this journal is cited, in accordance with accepted academic practice. No use, distribution or reproduction is permitted which does not comply with these terms.
*Correspondence: Rebeca G. Manning-Cela, cm1hbm5pbmdAY2ludmVzdGF2Lm14; Moisés Santillán, bXNhbnRpbGxhbkBjaW52ZXN0YXYubXg=
Disclaimer: All claims expressed in this article are solely those of the authors and do not necessarily represent those of their affiliated organizations, or those of the publisher, the editors and the reviewers. Any product that may be evaluated in this article or claim that may be made by its manufacturer is not guaranteed or endorsed by the publisher.
Research integrity at Frontiers
Learn more about the work of our research integrity team to safeguard the quality of each article we publish.