 Marie-Aurore Caillaud1,2Martine Abeilhou1
 Ignacio Gonzalez1Marjorie Audonnet1Frédéric Gaucheron3Muriel Cocaign-Bousquet1*Hélène Tormo2
 Marie-Line Daveran-Mingot1
- 1TBI, Université de Toulouse, CNRS, INRAE, INSA, Toulouse, France
- 2Université de Toulouse, Ecole d’Ingénieurs de Purpan, INPT, Toulouse, France
- 3Centre National Interprofessionnel de l’Economie Laitière (CNIEL), Paris, France
Lactococcus lactis group (composed of the lactis and cremoris subspecies, recently reassigned as two distinct species) plays a major role in dairy fermentations. Usually present in starter cultures, the two species enable efficient acidification and improve the organoleptic qualities of the final product. Biovar diacetylactis strains produce diacetyl and acetoin, aromas from the citrate metabolization. As these populations have distinct genomic and phenotypic characteristics, the proportions of each other will affect the final product. Today, there is no quantitative test able to distinguish between the two species and the biovar in dairy ecosystems. In this study, we developed a specific, reliable, and accurate strategy to quantify these populations using, species-, and diacetylactis-specific fluorescent probes in digital droplet PCR assays (ddPCR). Species were distinguished based on three single nucleotide polymorphisms in the glutamate decarboxylase gadB gene, and the citD gene involved in citrate metabolism was used to target the biovar. Used in duplex or singleplex, these probes made it possible to measure the proportion of each population. At 59°C, the probes showed target specificity and responded negatively to the non-target species usually found in dairy environments. Depending on the probe, limit of detection values in milk matrix ranged from 3.6 × 10³ to 1.8 × 10⁴ copies/ml. The test was applied to quantify sub-populations in the L. lactis group during milk fermentation with a commercial starter. The effect of temperature and pH on the balance of the different populations was pointed out. At the initial state, lactis and cremoris species represent, respectively, 75% and 28% of the total L. lactis group and biovar diacetylactis strains represent 21% of the lactis species strains. These ratios varied as a function of temperature (22°C or 35°C) and acidity (pH 4.5 or 4.3) with cremoris species promoted at 22°C and pH4.5 compared to at 35°C. The biovar diacetylactis strains were less sensitive to acid stress at 35°C. This methodology proved to be useful for quantifying lactis and cremoris species and biovar diacetylactis, and could complete 16S metagenomics studies for the deeply description of L. lactis group in complex ecosystems.
Introduction
In dairy industries, starters are simple ecosystems that transform milk into different final products depending on the biochemical and microbial composition and the technology applied. Qualitative and quantitative descriptions of these ecosystems are thus useful to monitor milk transformation. Among the microorganisms involved in food fermentations, Lactococcus lactis species, the primary component of starter cultures, plays a major role. During cheese making, Lactococcus lactis acidifies the milk, changing its physico-chemical characteristics and preventing the growth of pathogenic and spoilage bacteria. Moreover, Lactococcus lactis creates appropriate biochemical conditions for ripening and contributes to the final texture and flavor of cheeses (Parente and Cogan, 2004; Smit et al., 2005).
Lactococcus lactis species is divided into different subspecies, among which the two subspecies lactis and cremoris are of industrial interest. Before the advent of molecular methods for strain identification, these subspecies were identified using phenotypic tests (Schleifer et al., 1985). Later, several studies based on genome-wide (Kelleher et al., 2017; Torres Manno et al., 2018) and comparative analysis of ANI parameters (Cavanagh et al., 2015a) support the idea that these two subspecies can be considered as two distinct species lactis and cremoris. The use of this new denomination is now well admitted. In the lactis group, both species are associated with well described growth characteristics (Wels et al., 2019). However, cremoris species have different phenotypes (Cavanagh et al., 2015a), with strains identified as “true” cremoris, and strains showing a Lactis phenotype (growth at 40°C, in the presence of 4% NaCl and pH 9.2, and the ability to degrade arginine). Dairy starters are usually a mix of strains of the two genotypes. The proportion of each genotype is important because it affects the characteristics of the final product (Fernández et al., 2011). Several methods are available for the identification of lactis and cremoris genotypes (Cavanagh et al., 2015b), including glutamate decarboxylase activity in L. lactis species (Nomura et al., 1999). In L. cremoris, the non-functional activity is related to a frameshift mutation in the glutamate decarboxylase gene, gadB, thus encoding a non-functional protein (Nomura et al., 2000). The study that followed these works produced a successful method to distinguish the two reassigned species, based on PCR amplification and RFLP analysis of the gadB gene in pure cultures (Nomura et al., 2002).
Among lactis species, the biovar diacetylactis is usually of considerable interest for the dairy industry as it includes strains that produce diacetyl and acetoin, thus improving product flavor by adding a creamy or buttery aroma to the final products. This aroma is related to citrate metabolism. Citrate is uptaken by a citrate permease encoded by the plasmidic citP gene (García-Quintáns et al., 1998). After internalization, citrate is converted into oxaloacetate and acetate by the citrate lyase, an enzyme encoded by the chromosomic citDEF genes. Finally, oxaloacetate is decarboxylated into pyruvate, leading to C4 compounds among which diacetyl and acetoin. The citrate-fermenting capacity of the biovar diacetylactis strains is usually identified by the growth of blue colonies on Kempler and McKay medium (Kempler and McKay, 1980) or by the presence of the PCR amplified citP gene, systematically associated with the presence of the chromosomal cluster (Passerini et al., 2013).
To our knowledge, no quantitative test has yet been developed to quantify cremoris and lactis species or the biovar diacetylactis population in dairy ecosystems. Specific identification and quantification require a reliable and accurate strategy. PCR-based assays using TaqMan probes technology are suitable to detect specific targets of interest (Law et al., 2015). This strategy can be very useful to distinguish nucleotide variants with single nucleotide polymorphism (SNP) precision (Billard et al., 2012; Strayer et al., 2016). However, the choice of the target is a crucial step to ensure the reliability, and the accuracy of the detection and the quantification.
Quantitative PCR assays (qPCR or real-time PCR) are widely used to describe microbial communities in the environment (Smith and Osborn, 2009) or in food samples (Tessonnière et al., 2009; Zago et al., 2009; Postollec et al., 2011). However, qPCR has some limitations for the absolute quantification (Morisset et al., 2013; Ren et al., 2017; Gobert et al., 2018). The recent digital droplet PCR (ddPCR) technology has been particularly successful in clinical diagnosis or in detecting foodborne pathogens (Elizaquível et al., 2012; Day et al., 2013). In fact, ddPCR is more accurate, sensitive, precise and resistant to inhibitors (Wang et al., 2018) than qPCR. Moreover, the end point measurement and the partitioning technology allow the absolute quantification in copies per microliter, based on Poisson distribution, without a need for standard curves.
The aim of this study was to develop a reliable, fast, sensitive, precise and specific method to describe and quantify the proportions of the two species and the biovar diacetylactis of L. lactis group in dairy ecosystems like starters. The method was used to monitor variations in different subpopulations in a commercial starter during the production of a fermented milk under different pH (4.5 and 4.3) and temperature (22°C or 35°C) conditions.
Materials and Methods
Bacterial Strains and Culture Conditions
All analyzed strains of Lactococcus lactis, Lactococcus cremoris, Lactococcus lactis biovar diacetylactis, Streptococcus thermophilus, Lactococcus garvieae, Enterococcus faecalis, Enterococcus faecium, Leuconostoc mesenteroïdes, Leuconostoc citreum, Leuconostoc faecium and Leuconostoc lactis are listed in Table 1.
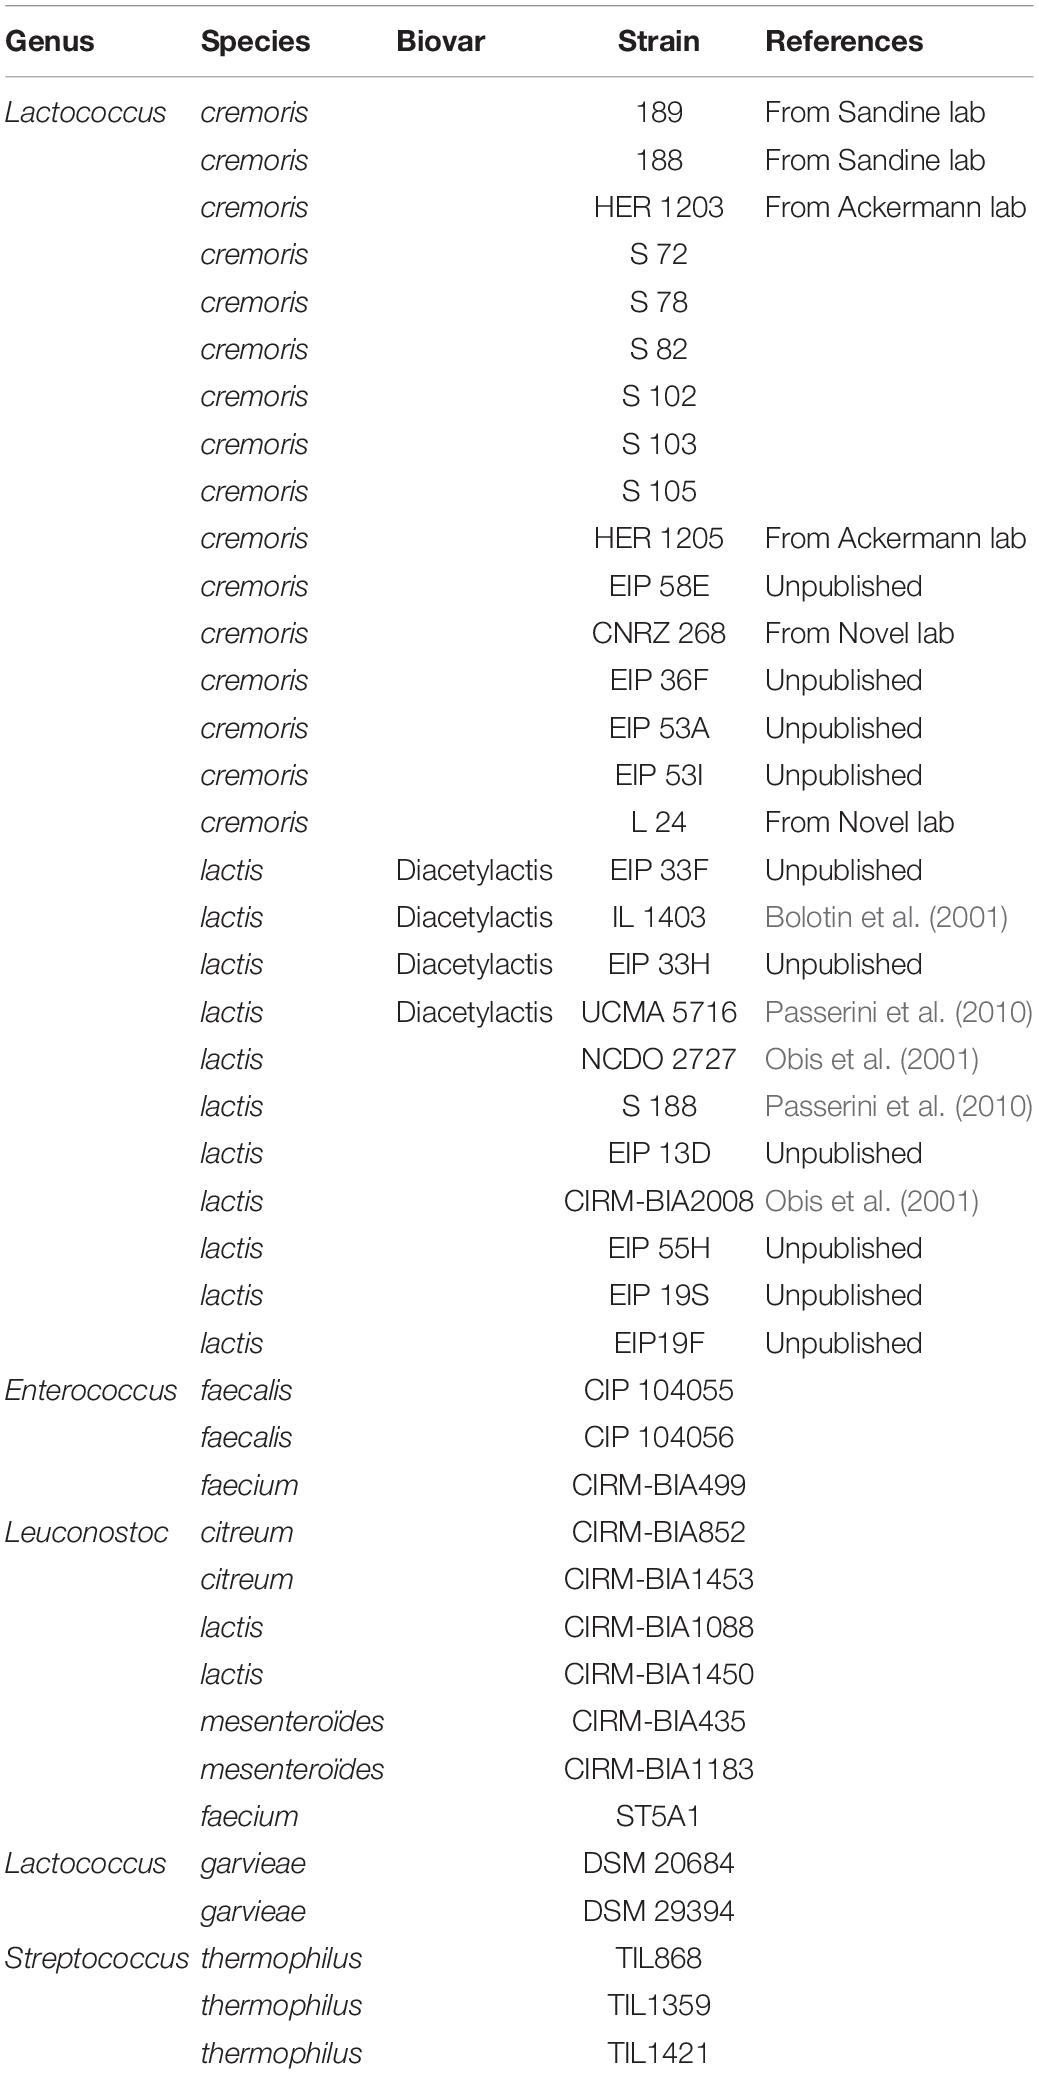
Table 1. List of genus, species and strains tested to develop the test.
All the species were grown in GM17 medium at 30°C or 37°C for Streptococcus thermophilus strains, except for Leuconostoc species which were cultivated in MRS broth at 30°C.
Reconstituted Starters
Mixtures of the two strains were reconstituted by combining IL1403 and S72 strains (Table 1). Each strain was grown in GM17 medium overnight at 30°C. This preculture was used to inoculate a new GM17 medium at OD580nm = 0.05. The OD580nm was measured during cultivation and growth was stopped at the beginning of the stationary phase (3.85 < OD580nm < 4.29). Five mixtures were produced with theoretical ratios (v/v) of IL1403 to S72 of 5:95, 20:80, 50:50, 80:20 and 95:5. After centrifugation at 13,000 rpm for 5 min, the pellets were recovered and stored at −20°C until DNA extraction. The experiment was independently repeated three times.
Commercial Starter
MM100 commercial starter (DANISCO, CHOOZIT MM 100 LYO 25 DCU, PD 207167-10.0FR, N°50434) is composed of Lactococcus lactis, Lactococcus cremoris and Lactococcus lactis biovar diacetylactis. The proportion of each species, which affects the features of the fermented product, is not provided by the supplier, but the technological characteristics are specified for use at 35°C. The lyophilized starter was re-hydrated at the concentration of 25 DCU/l in peptone water and then diluted at 5 DCU/100l in 10% (w/v) sterile skimmed milk (Sigma-Aldrich) and left to grow at 22°C or 35°C until the pH reached 4.5 or 4.3. Temperature and pH ranges were closely linked to specific production processes of fermented milks and fresh soft cheeses. At each temperature, the acidification of two independent cultures was measured using the Cinac system (AMS Alliance France) (Spinnler and Corrieu, 1989) and showed highly reproducible curves that were consequently averaged. At both temperatures and at three time points during the process, before growth (T0) and after growth until pH reached 4.5 (T1) and then 4.3 (T2), the MM100 starter was characterized for L. lactis populations with ddPCR assays.
DNA Extraction
DNA of all strains and reconstituted starters were extracted using the GenElute Bacterial Genomic DNA Kit (Sigma-Aldrich) according to the manufacturer’s instructions. The DNA of the fermented milks was extracted with DNeasy PowerFood Microbial Kit (Qiagen) according to the manufacturer’s instructions with the following modifications: first, the cell pellet was resuspended in the MBL solution and incubated at 70°C for 10 min. The genomic DNA concentration (Cng/μl) was obtained by measuring absorbance at 260 nm on a Nanodrop ND2000. For the sake of convenience, Cng/μl was converted into Ccopies/μl according to the following equation: Ccopies/μl = Na × Cng/μl × 10–9/(L × 660), where Na is the Avogadro constant (6.02 × 10²³/mol, and L is the average size of a lactococcal genome (2.5 × 10⁶ bp). This calculation provides only an estimated value in copies/μl since A260 measurement depends on various factors and does not distinguish between intact and fragmented targets.
DNA purity was evaluated by the ratio of absorbance 260 nm/280 nm. Extracted DNA was diluted and used for the ddPCR assays at appropriate dilutions.
Primers and Probes for ddPCR
Sequences of the gadB gene available on the National Centre for Biotechnology Information (NCBI)1 were retrieved and aligned using ClustalW in MEGA7 (Kumar et al., 2016). SNPs specific to the lactis and cremoris species (positions 1332, 1335, and 1336 in IL1403 chromosome) and a conserved region in the L. lactis group (position 1283), were chosen to design specific hydrolysis probes. Two different fluorophores (HEX and FAM) were used to enable multiplex ddPCR. Locked nucleic acids (LNAs) were added to enhance oligonucleotide melting temperature and probe affinity and specificity (Letertre et al., 2003; Mouritzen et al., 2003). The conserved regions surrounding these probes were used to design specific primers allowing the amplification of a 149 bp fragment for the ddPCR experiments. Melting temperature predictions and the thermodynamic parameters of the primers and probes were calculated using the IDTs oligo-analyzer tools2. The primers, probe sequences and amplicon size are listed in Table 2. Primers were synthesized by Eurofins (Ebersberg, Germany) and probes by Eurogentec (Angers, France). All primers and probes were diluted in ultra-pure water at a concentration of 100 μM and solutions were stored at −20°C.
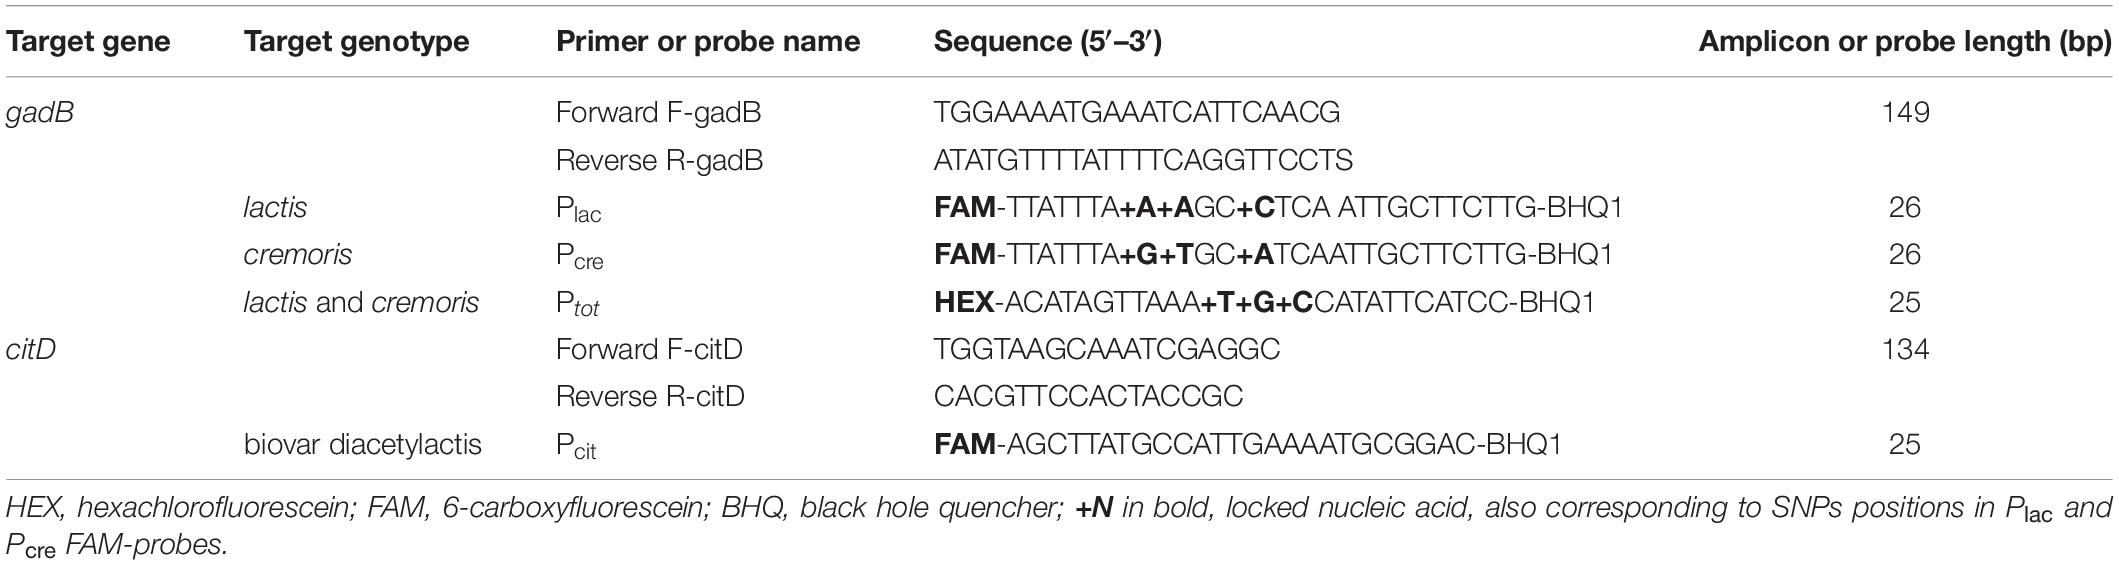
Table 2. Primers/probe(s) sets targeting the gadB and citD genes of L. lactis and L. cremoris species.
Droplet Digital PCR (ddPCR) Assays and Procedure
ddPCR was performed with the QX200 AutoDG Droplet Digital PCR system (Bio-Rad) according to the manufacturer’s protocol. The ddPCR mastermix had a final volume of 22 μl and contained 2.2 μl of DNA, 11 μL of 2x ddPCR Supermix for Probes (No dUTP) (Bio-Rad, Ref catalog 186-3024), 1.1 μl of 18 μM forward plus reverse primers mixture, 1.1 μl of 5 μM HEX and FAM probes or 1.1 μl of 5 μM FAM probe for singleplex assay (Table 2), and 5.5 μl or 6.6 μl of nuclease free water, for the duplex or singleplex assay, respectively. Only 20 μl of the mixture was used to generate droplets using the QX200 Droplet generator. Subsequently, the droplet suspension was transferred into 96-wells plate and PCR amplification was performed on a T100 Touch thermal cycler (Bio-Rad) with the following program: 10 min at 95°C followed by 40 cycles of 30 s at 94°C and 60 s at 59°C, ending with 10 min at 98°C, at a ramp rate of 2°C/s. After PCR, each reaction was analyzed by the droplet reader (Bio-Rad) and acquired data were treated with QuantaSoft software V1.7 (Bio-Rad). Thresholds were set manually considering the double negative droplets cluster from the negative control and the FAM- and/or HEX-specific positive droplets cluster from the control strains.
The DNA concentration must be in the dynamic range of the ddPCR (0.25 copies/μl to 5,000 copies/μl) (Droplet Digital PCR Applications Guide, Bio-Rad). DNA is often diluted to obtain one theoretical copy per droplet. For limits of detection and quantification (LoD and LoQ) assays, five dilutions were tested, from the initial dilution by serial diluting to the tenth.
Statistical Analysis
Statistical data analysis was carried out using the R statistical programming environment (R Development Core Team, 2005). The effect of pH on the lactis (Plac/Ptot) and cremoris (Pcre/Ptot) species and the biovar diacetylactis (Pcit/Plac) during milk fermentation at two different temperatures, 22°C and 35°C, was evaluated using a one-way analysis of variance (ANOVA). A further two-way ANOVA was carried out on Plac/Ptot and Pcre/Ptot ratios to assess the effects of interactions between pH (4.5, 4.3) and temperature (22°C, 35°C). Normality of the samples was checked using the Shapiro-Wilk test, which showed no evidence of significant differences to a normal distribution, and homogeneity of the variances was checked with the Levene test. Conventional ANOVA with Tukey’s post hoc test was used when variances were homogeneous, whereas Welch’s ANOVA and the Games-Howell post hoc test were used when variances were heteroscedastic. Average Plac/Ptot, Pcre/Ptot and Pcit/Plac ratios were calculated from n independent sample measurements: n = 6 at the initial condition, n = 8 and n = 9 at 22°C and 35°C, respectively, and at pH 4.5, and n = 6 at each temperature and pH 4.3.
Results
Judicious Selection of Target Genes to Identify and Quantify the L. lactis, L. cremoris, and Biovar Diacetylactis Populations
The glutamate decarboxylase gene (gadB) was used in previous studies to distinguish the two phylogenetic groups corresponding to lactis and cremoris genotypes among the L. lactis strains (Nomura et al., 2002). However, the PCR-restriction fragment length polymorphism targeting gadB does not enable quantification of the two genotypes in simple or complex ecosystems. In order to identify specific SNPs in this gene, nucleotide sequences from 57 strains, including 21 lactis genotype and 36 cremoris genotype strains (Supplementary Table S1), were aligned. Three SNPs (positions 1332, 1335, and 1336 in IL1403 gene) were genotype-specific and served to design two probes: Plac (lactis species) and Pcre (cremoris species). A region with no polymorphism was used for the design of primers (F-gadB and R-gadB) and a consensus probe Ptot L. lactis group-specific (Figure 1A). Because the droplet reader allows fluorescence reading at two wavelengths, duplex reactions were tested (FAM-Plac and HEX-Ptot or FAM-Pcre and HEX-Ptot probes) to detect and determine the proportions of each species in the total Lactococcus lactis population present in a sample.
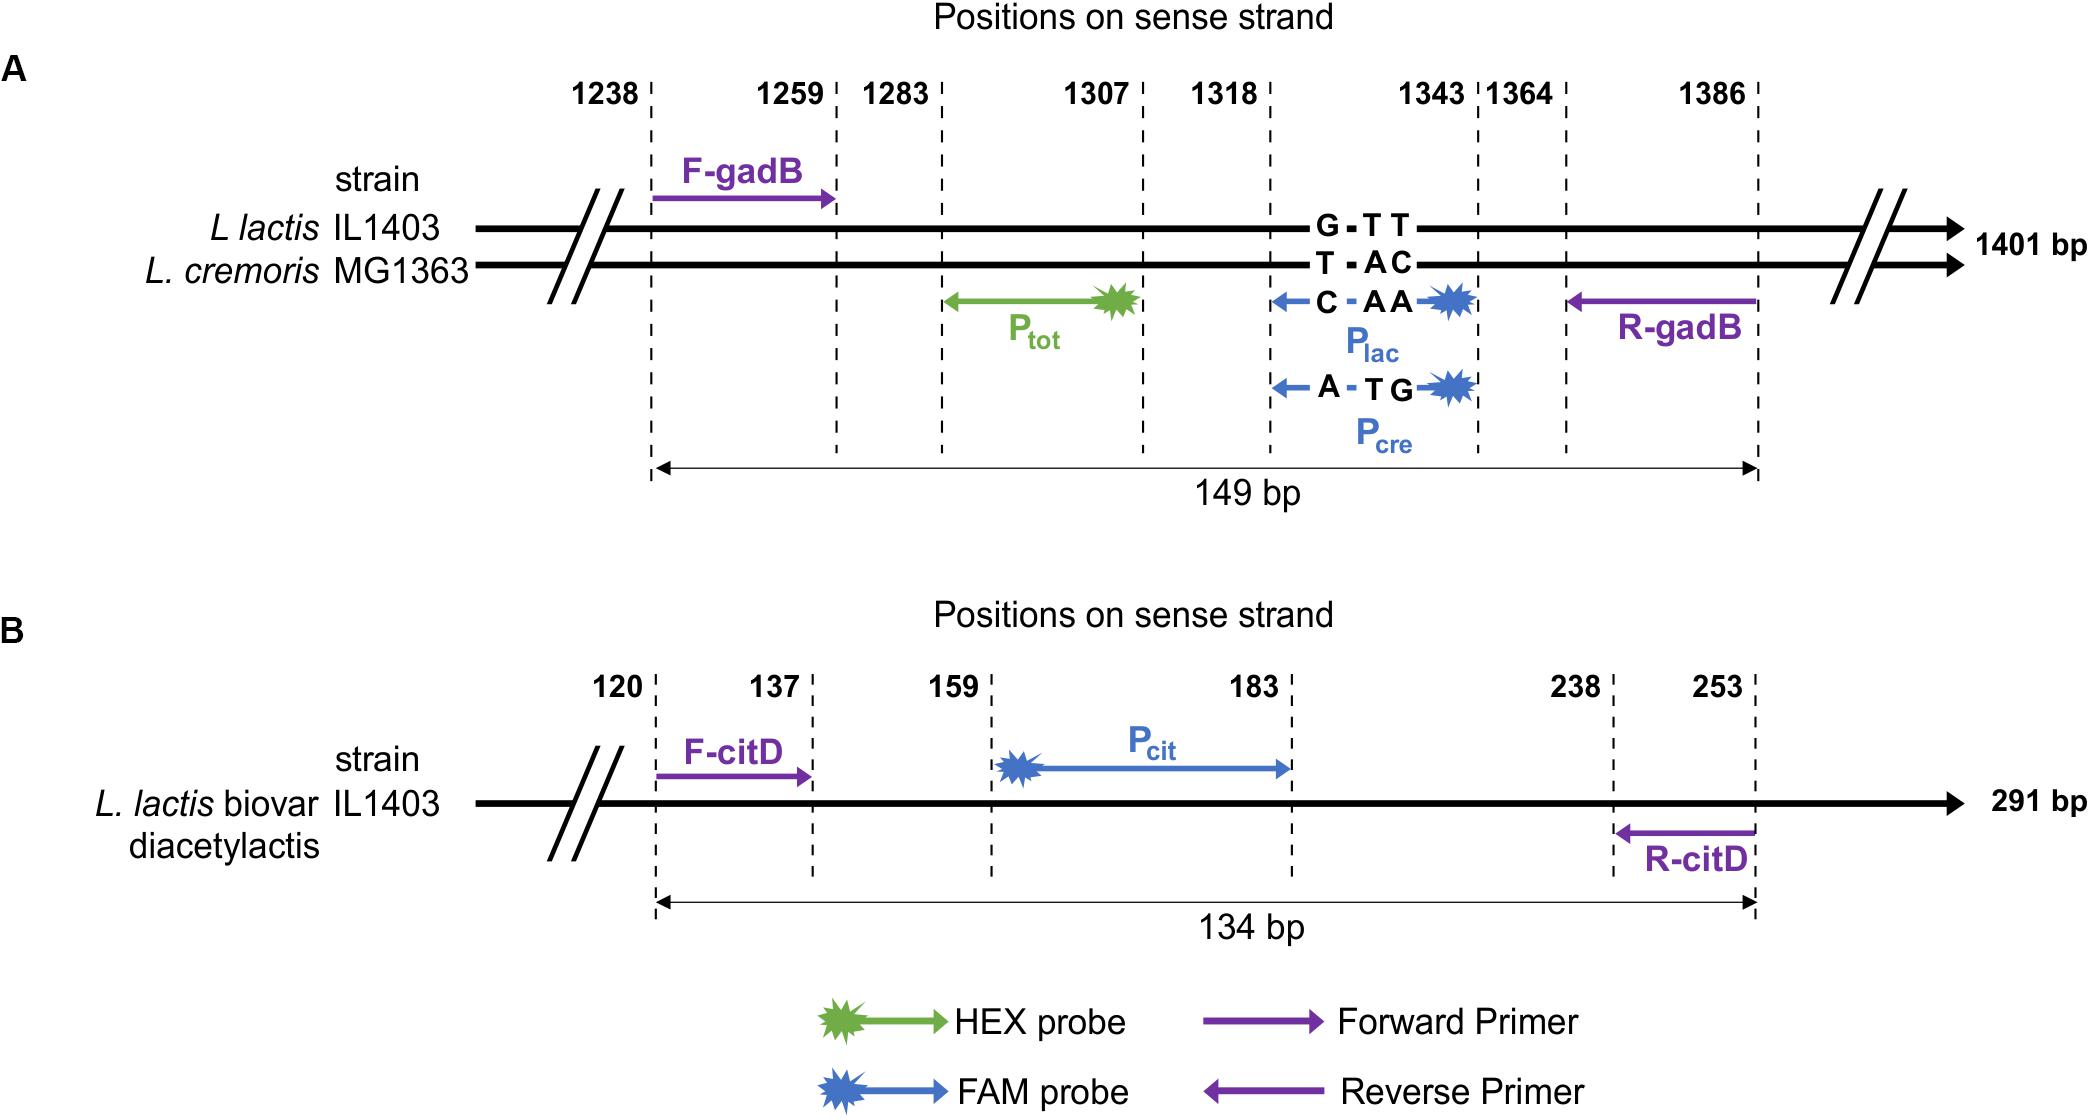
Figure 1. Schematic representation of the positions of primers and probes for: (A) gadB gene of two Lactococcus strains. IL1403 and MG1363 strains belong, respectively, to lactis and cremoris species. Positions are aligned on the 1401 bp sequence of the gadB gene of IL1403 strain. Nucleotides between positions 1318 and 1343 correspond to lactis and cremoris genotypes probes. (B) citD gene sequence of IL1403 strain.
Most descriptions of the biovar diacetylactis include citrate-utilizing strains. This metabolism has been investigated in detail in the dairy strain CRL264 (Zuljan et al., 2016). The citrate is transported by the plasmid-encoded citrate permease CitP, after which its transformation into oxaloacetate and pyruvate is mediated by a chromosomal cluster encoding citDEFXG and citM, respectively (de Felipe et al., 1995). The citD gene encoding the citrate lyase acyl carrier protein was targeted to identify and quantify this biovar. This gene sequence is highly conserved among the biovar and regions with no polymorphism were chosen to design primers, R-citD and F-citD, and a FAM-probe, FAM-Pcit, from 11 sequences retrieved from the GenBank database (Figure 1B and Supplementary Table S2).
Test Development
A thermal-gradient from 65°C to 55°C was used to establish the optimal hybridization temperature. Each set of primers/probe(s) was tested on both target and non-target strains and gradient results were compared. A temperature of 59°C that specifically dissociated specific positive droplets from the negative ones was chosen for all primers/probe(s) sets.
Specificity of Probes
The specificity of primers and probes was tested first in silico using the Nucleotide Basic Local Alignment Search Tool3. Specificity was then further tested experimentally using DNA from samples of target and non-target species (Table 1). The selected non-target species corresponded to phylogenetically closely related species or species commonly present in the dairy environment. Firstly, the test was conducted at 59°C on 15 non-target strains belonging to Streptococcus thermophilus, Lactococcus garvieae, Enterococcus faecalis, Enterococcus faecium, Leuconostoc mesenteroïdes, Leuconostoc citreum, Leuconostoc faecium, and Leuconostoc lactis species. No cross amplification was detected in any of the three primers/probe(s) sets. Next, 27 target strains (16 L. cremoris and 11 L. lactis among which 4 biovar diacetylactis) were tested for each primers/probe(s) set. Ptot, Plac, Pcre, and Pcit only showed positive results with their target strains, thereby confirming the specificity of the probes.
Comparison Between Singleplex and Duplex Assays
As the test was designed to quantify the ratio of each species among the total L. lactis group, two probes were mixed in duplex in the reaction. The aim was to check whether the quantification of one specific target (Plac or Pcre) is affected by the presence of the consensus target (Ptot) and vice versa. Five technical replicates were tested for L. lactis EIP33F strain and for L. cremoris HER1205 strain, with Plac, Pcre, and Ptot in singleplex (a specific probe and a consensus probe in two different wells) or in duplex (a specific probe plus a consensus probe in the same well). For each probe or pair of probes, no significant variation of the measured target copy number was observed between the duplex and the singleplex assays (Table 3). The difference between the duplex and the singleplex average values was lower than the coefficient of variation representing inter-well variation in the same condition (duplex or singleplex).
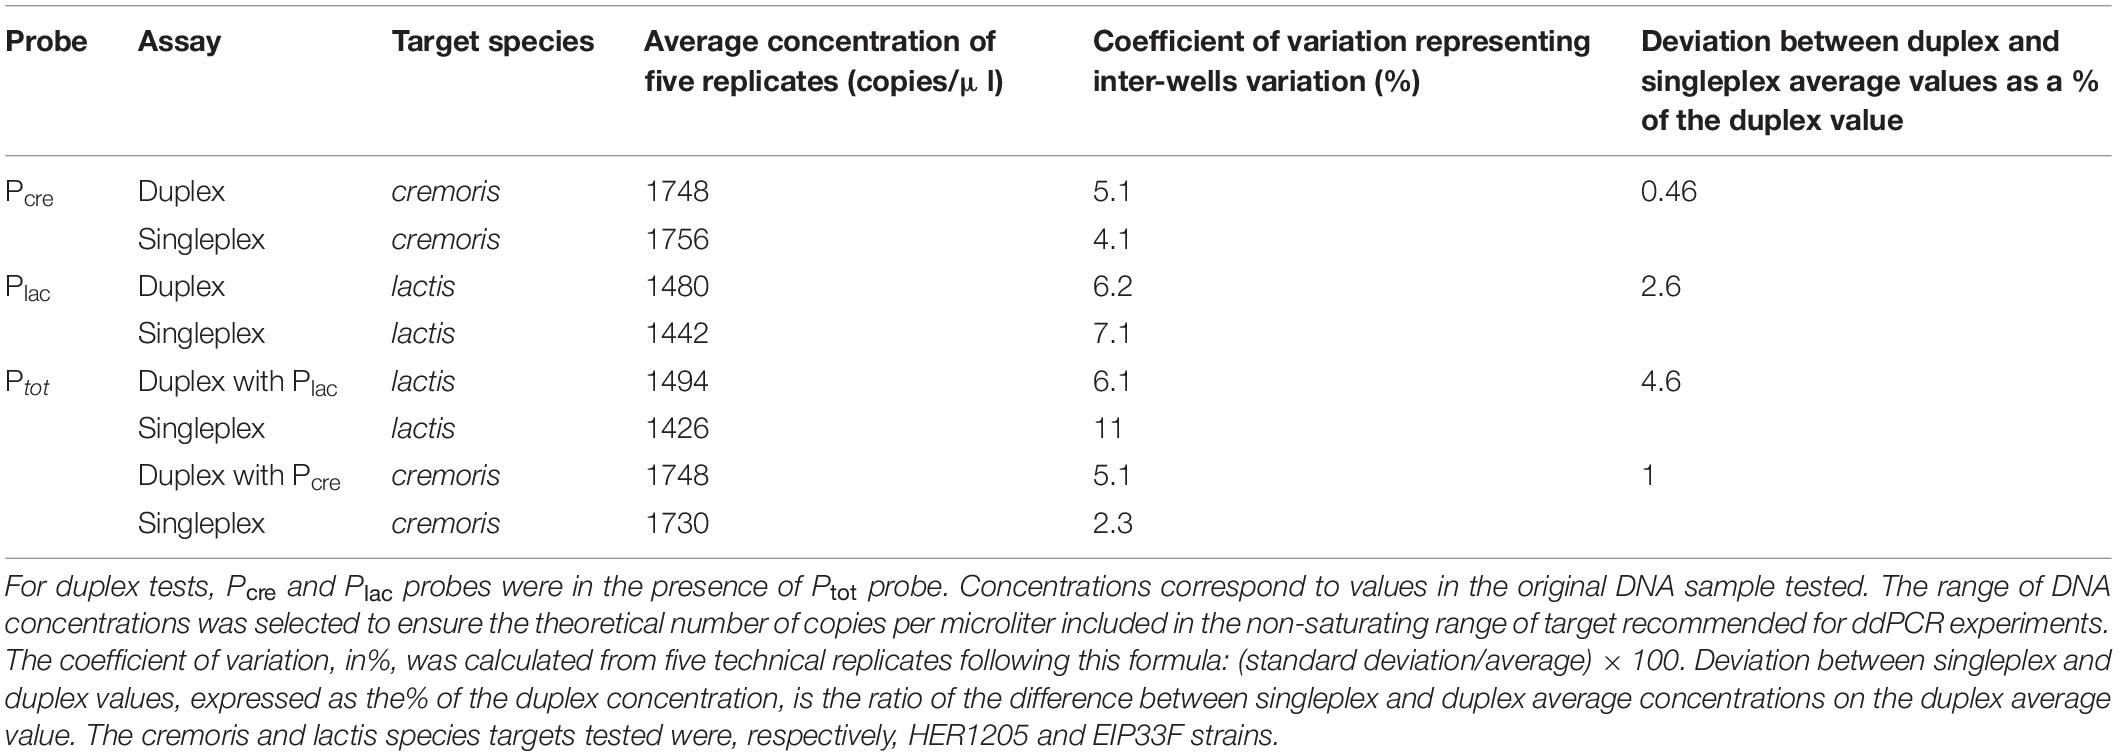
Table 3. Comparison between singleplex and duplex assays.
Limits of Detection (LoD) and Quantification (LoQ)
Limits of detection and quantification were determined by testing five DNA dilutions of a mixture containing the two species lactis (including the biovar diacetylactis) and cremoris. Each measurement was carried out in triplicate. For data analysis, the merge well function of QuantaSoft software was used to allow a more reliable, precise and accurate quantification based on “mega-wells” data, thus taking both intra- and inter-well variability into account.
As no significant differences were found between singleplex and duplex assays, Plac and Pcre probes were used in duplex with Ptot probe. LoD corresponds to the lowest value of copies per microliter detected. It was defined as at least five positive droplets detected per well since the maximum number of positive droplets detected in negative controls was 4 (Table 4). For all probes, LoD was reached at dilution 3 with 11.6, 18.2, 9.5, 17.2 and 3.6 copies/μl, respectively, for Plac, Ptot (duplex with Plac), Pcre, Ptot (duplex with Pcre) and Pcit probes (Table 4). LoQ corresponds to the lowest target concentration quantified when specific positive droplets detected allow an accurate and reliable Poisson-estimated value with a deviation of the 95% confidence interval values from the estimated value <25% (Table 4). The 95% confidence interval is calculated from three technical replicates of merged wells. For Plac, Pcre and Pcit probes, LoQ is reached at dilution 2, respectively, with 98, 74 and 26.1 copies/μl present in the tested dilution. Indeed, at next dilutions, numbers 3, 4 and 5, the deviation of the highest and lowest values of the 95% CI from the estimated value was >25% (Table 4). For Ptot, the deviation of the highest value of the 95% CI from the Poisson estimated concentration was > 25% (26% for Ptot in duplex with Plac and with Pcre) but the deviation of the lowest value of the 95% CI from the estimated concentration was <25% (22% for Ptot in duplex with Plac and with Pcre). As the strength of duplex assays is obtaining a reliable and accurate ratio value of lactis or cremoris targets for the entire Lactococcus population, LoQ values of 176 and 166 copies/μl for Ptot in duplex with Plac and Pcre, respectively, were retained, thus ensuring a quantification variability strictly below 25%.
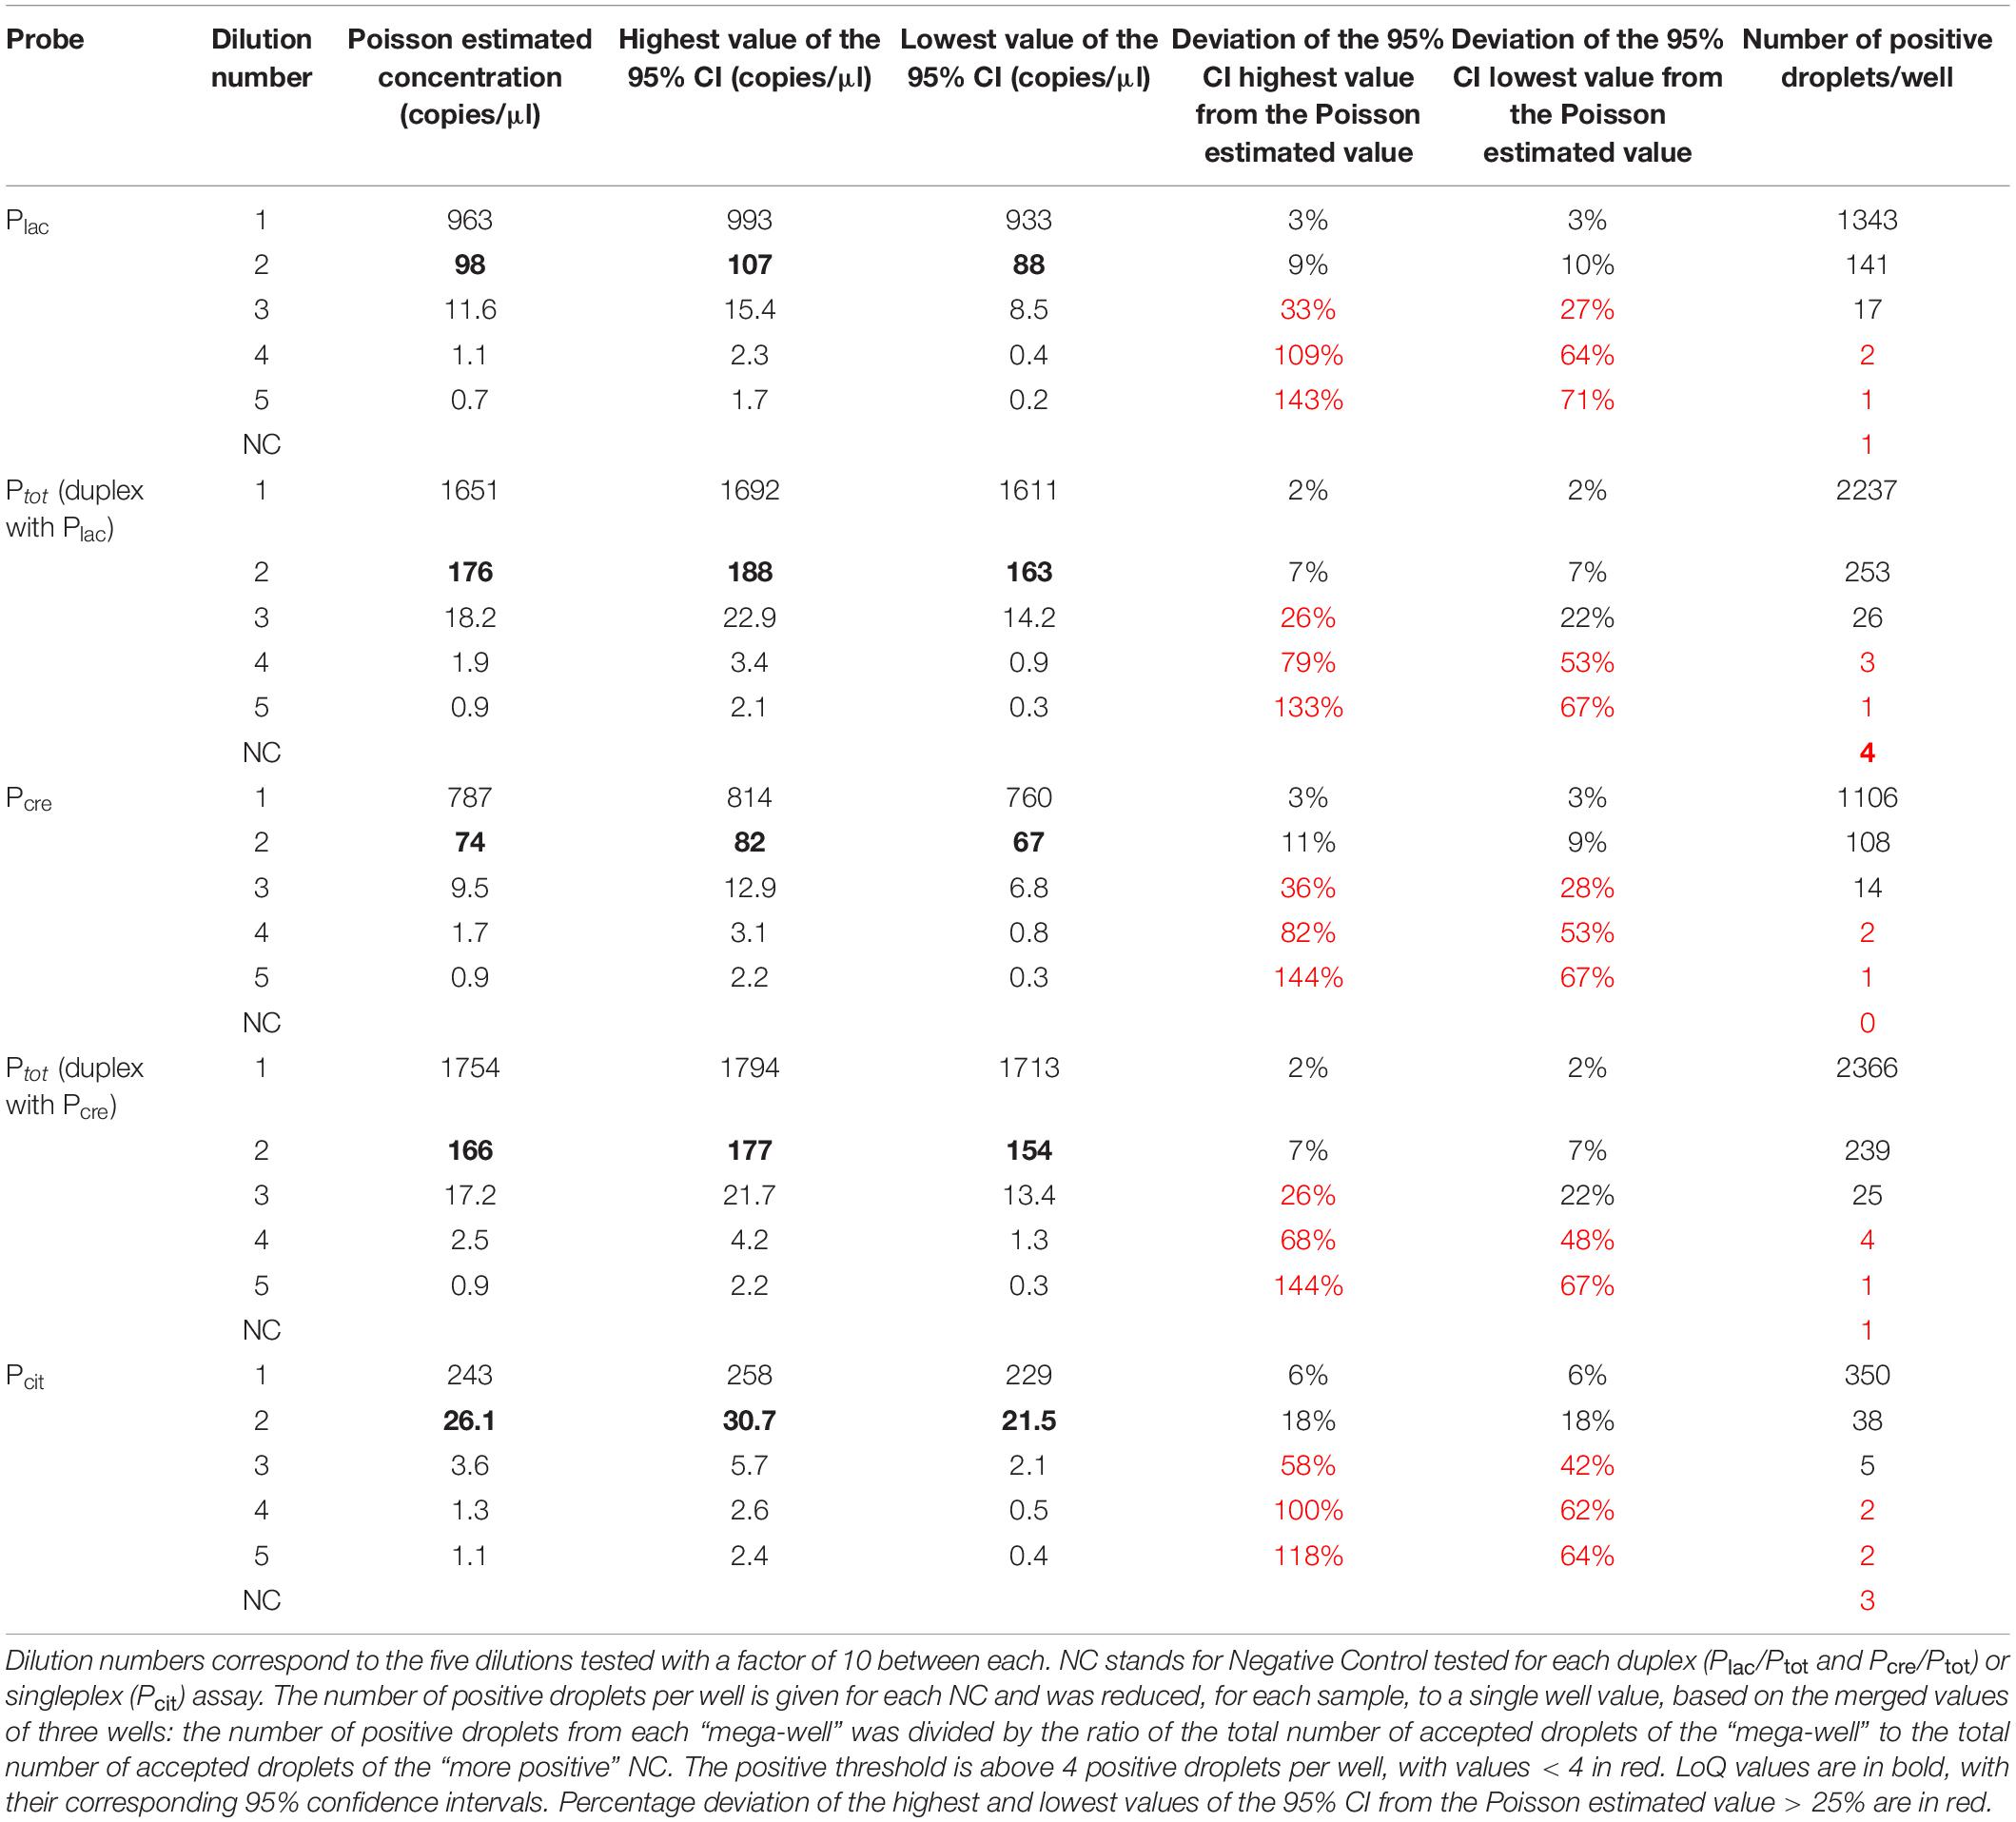
Table 4. Determination of LoD and LoQ values for the four probes.
Test Validation on Reconstituted Starters
The accuracy and reliability of the FAM/HEX ratios were validated on three independently repeated experiments using reconstituted starters with known proportions of each species and the biovar. IL1403 (species lactis biovar diacetylactis) and S72 (species cremoris) strains were mixed at ratios of IL1403 to S72 of 5:95, 20:80, 50:50, 80:20, and 95:5. For each mixture, the attempted proportions of IL1403 and S72 strains were confirmed with both duplex assays Plac/Ptot and Pcre/Ptot (Figure 2). Moreover, IL1403 strain proportions were also confirmed with the Pcit probe. These results highlight the accurate and reliable detection and relative quantification of the two species and the biovar with this test.
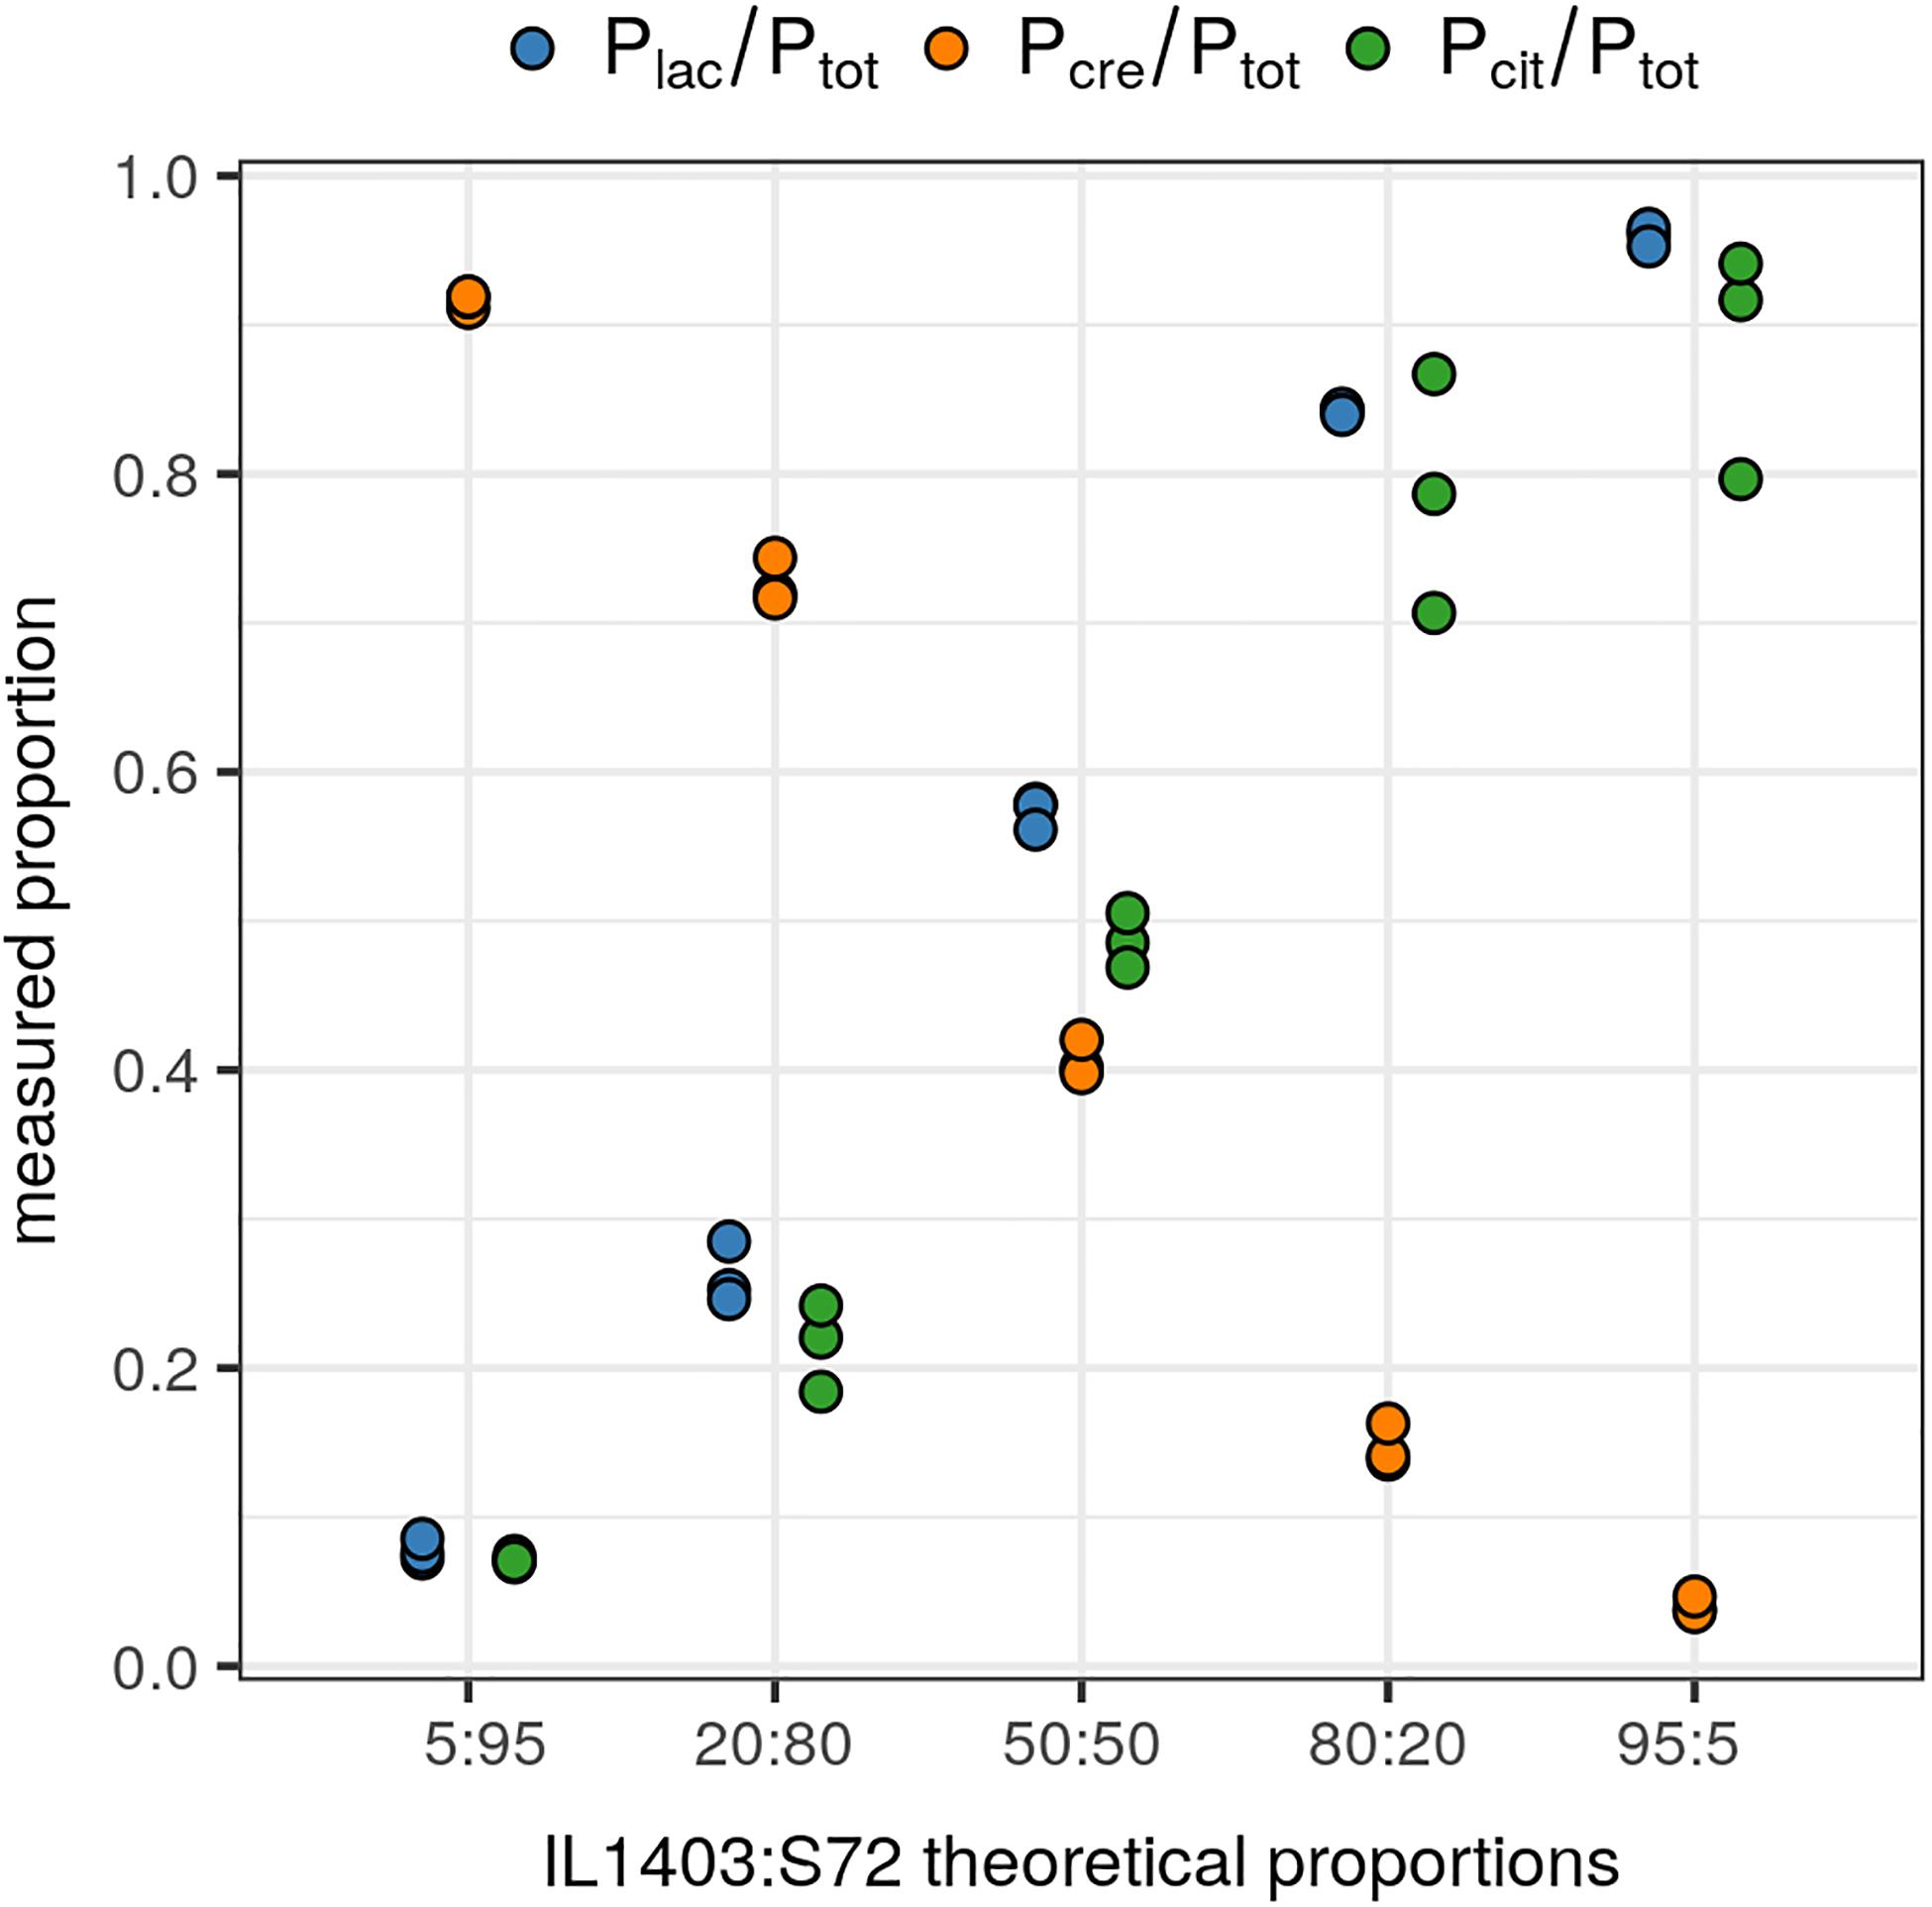
Figure 2. Relative quantification of the lactis and cremoris species and the biovar diacetylactis in reconstituted starters. Quantified proportions of lactis species and the biovar diacetylactis (IL1403 strain), and cremoris species (S72 strain), on the total Lactococcus population, in reconstituted starters with theoretical ratios of IL1403 to S72 of 5:95, 20:80, 50:50, 80:20, and 95:5. Data points represent ratios from three independently repeated experiments. Plac: lactis species-specific probe; Pcre: cremoris species-specific probe; Pcit: biovar diacetylactis-specific probe; Ptot: L. lactis group-specific probe. Each Plac/Ptot and Pcre/Ptot ratio was calculated from a duplex single well assay and Pcit/Ptot ratio was obtained from the values of two independent wells.
Monitoring Lactococcus Populations During the Milk Fermentation Process: Effect of Temperature and pH on the Balance of the Two Species and the Biovar
During the milk fermentation process, MM100 starter was described for Lactococcus populations considering temperature and pH conditions. The proportions of the two species lactis and cremoris were measured among the total Lactococcus population, and the biovar diacetylactis was analyzed regarding lactis species population. Table 5 lists descriptive statistics for the populations quantified. Acidification kinetics were also measured, and the pH curves revealed different activity depending on the temperature (Figure 3), with maximum acidification rates of −0.282 and −0.48 UpH/h at 22°C and 35°C, respectively. T0 refers to the initial state before growth, and T1 and T2 correspond to fermentation times when pH reached 4.5 and 4.3, respectively. At 22°C, T1 was reached after 22 h of fermentation and T2 after 47 h, and at 35°C, T1 was reached after 9 h and T2 after 19 h (Figure 3). We considered the cells remained under acid stress between T1 and T2. Figure 4 shows changes in the populations of lactis and cremoris species and biovar diacetylactis during the milk fermentation process under different temperature and pH conditions. The results of the ANOVA and of the post hoc test for the contrast of interest are listed in Supplementary Table S3. At T0, the mesophilic starter was dominated by the lactis species strains (75%). Among this population, 21% belonged to biovar diacetylactis. Strains of cremoris species represented 28% of the total Lactococcus population (Figures 4A–D and Table 5).
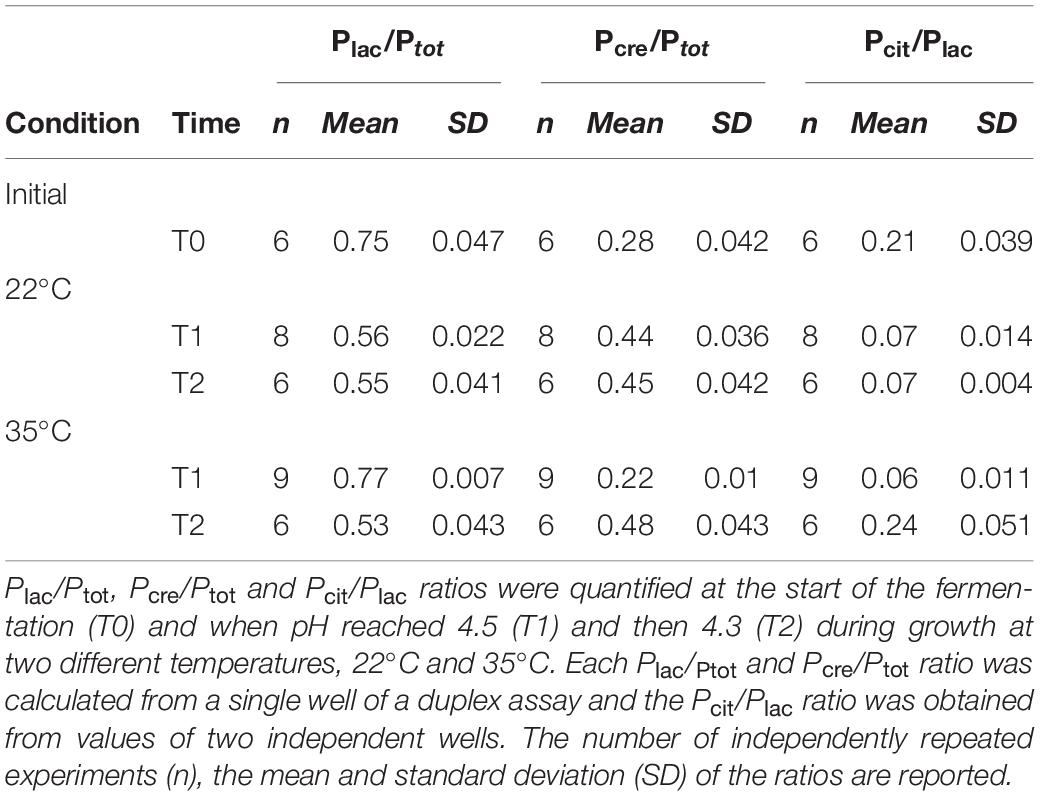
Table 5. Descriptive statistics for the quantified populations of the lactis and cremoris species and the biovar diacetylactis during the milk fermentation at two temperatures.
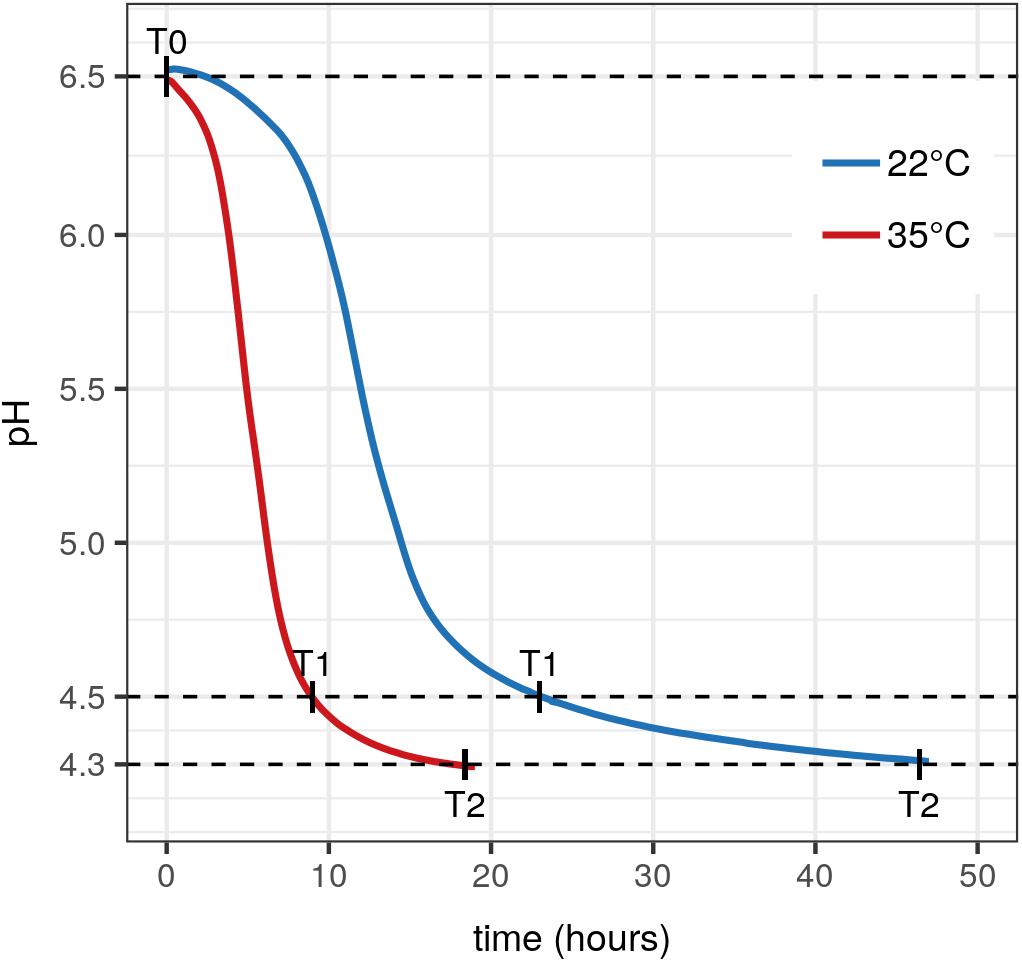
Figure 3. Acidification kinetics of MM100 starter during milk fermentation. Acidification curves of MM100 during milk fermentation at 22°C (blue curve) and 35°C (red curve). Each curve is the average of two pH kinetics from two independent cultures. T0, start of the fermentation after inoculation, T1 and T2, times when pH reached 4.5 and then 4.3.
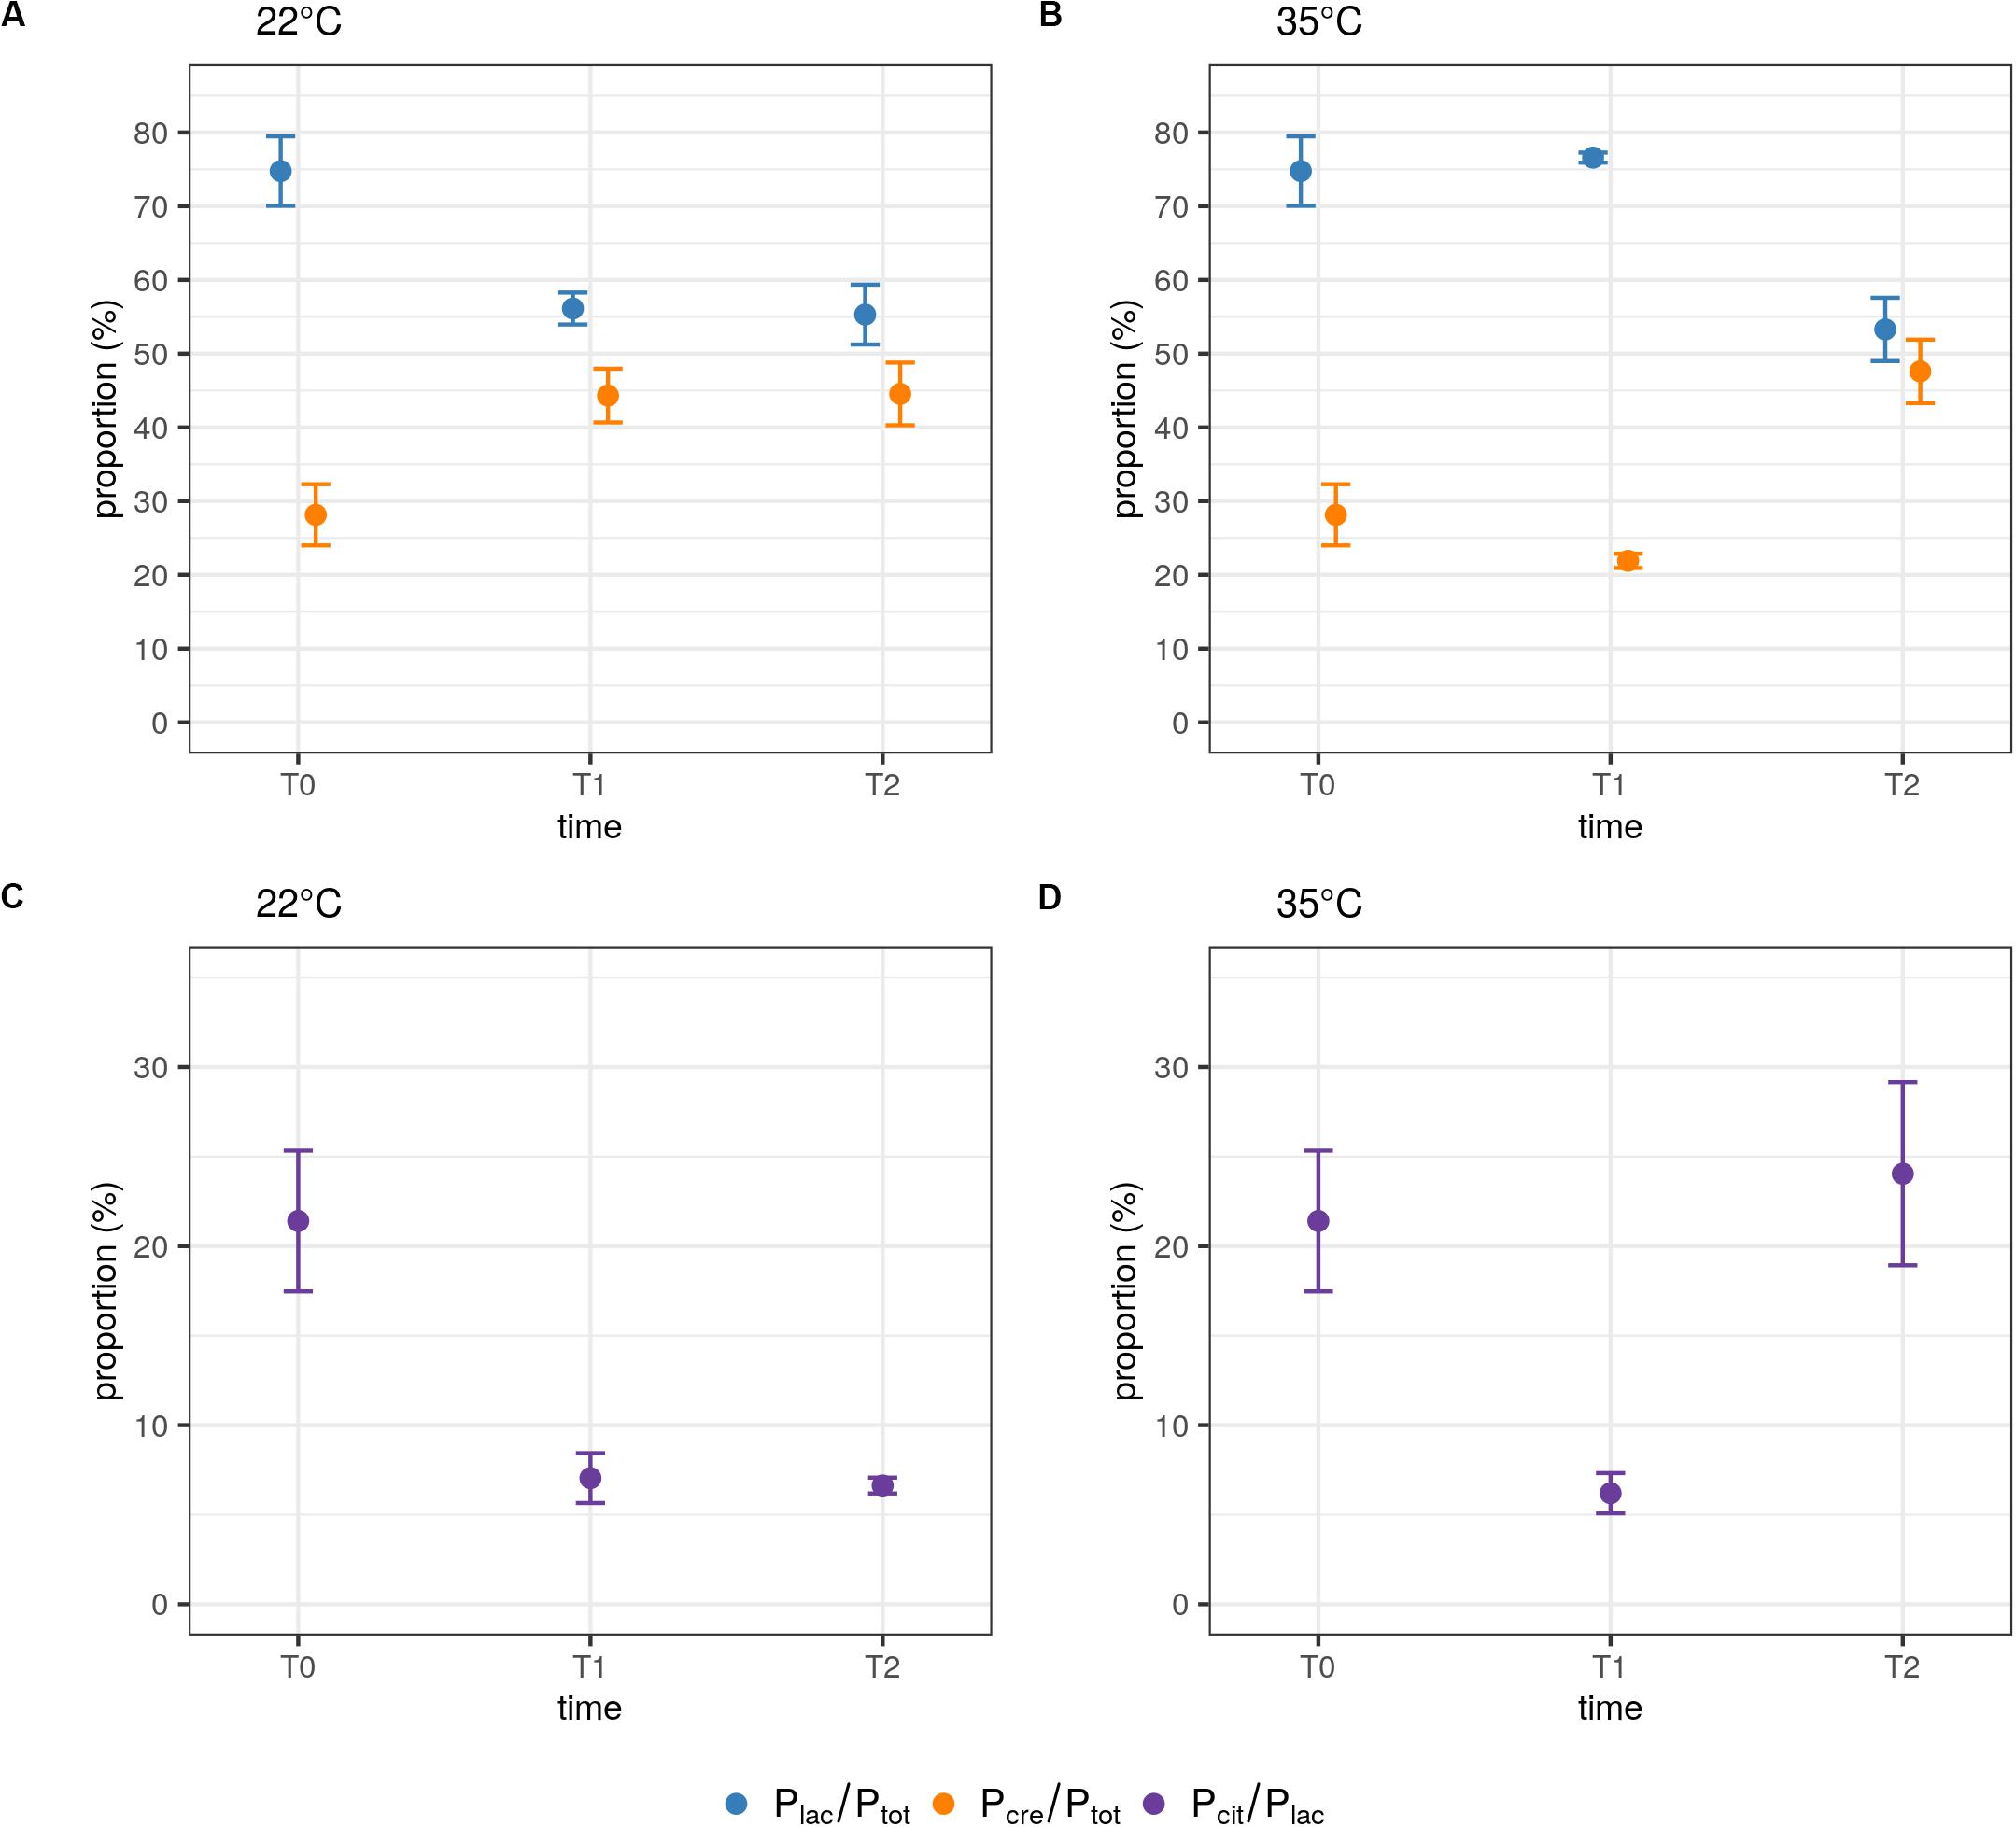
Figure 4. Influence of temperature and pH on the populations of the lactis and cremoris species and the biovar diacetylactis during the milk fermentation process. Quantified ratios Plac/Ptot and Pcre/Ptot at 22°C (A) and 35°C (B), and Pcit/Plac at 22°C (C) and 35°C (D) during growth. Each Plac/Ptot and Pcre/Ptot ratio was calculated from a duplex single well assay and Pcit/Ptot ratio was obtained from values from two independent wells. Samples were taken at the start of the fermentation (T0) and when pH reached 4.5 (T1) and then 4.3 (T2). Data points represent the mean and error bars represent the standard deviation of quantified ratios calculated from n independently repeated experiments, at T0, n = 6; at T1, n = 8 and n = 9 at 22°C and 35°C, respectively; and at T2, n = 6 at each temperature.
At 35°C, there was no statistically significant difference in the proportions of either lactis or cremoris species between T0 and T1 (p = 1 and p = 0.083, respectively). This confirms that the Plac/Ptot and Pcre/Ptot ratios are conserved under recommended conditions of use. At 22°C, the balance of the two species between T0 and T1 was significantly modified (p < 0.001) with Plac/Ptot and Pcre/Ptot ratios of 56% and 44%, respectively (Figures 4A,B and Table 5). At this temperature, the growth of cremoris species seems to be promoted whereas there was a decrease in populations of lactis species, probably leading to modified organoleptic features in the fermented product.
At 35°C, after a period of acid stress (T2), the population balance was significantly modified compared to in T1, with respectively, 53% and 48% of lactis and cremoris species (p < 0.001). In this starter, cremoris species strains were seen to be more resistant to the acid stress than lactis species strains. In contrast, at 22°C, no statistically significant effect of pH on the population balance was found, the proportions under acid stress conditions remained approximately the same with Plac/Ptot = 55% and Pcre/Ptot = 45% (p = 1). A two-way ANOVA on Plac/Ptot and Pcre/Ptot ratios revealed a significant interaction effect between pH and temperature [F(1,25) = 105.14, p < 0.001 and F(1,25) = 100.54, p < 0.001, respectively]. At T1, a significant difference between the ratios was found between 22°C and 35°C (p < 0.001, for both ratios); however, at T2, the temperature had no significant effect on Plac/Ptot and Pcre/Ptot ratios (p = 0.633 and p = 0.413, respectively; Figures 4A,B).
The aromatic signature is due to the biovar diacetylactis strains, which represented 21% of the lactis species strains and hence 15% of the total population. At T1, the percentage of these strains dropped significantly to 7% and 6% of the lactis species population at 22°C and 35°C, respectively (p = 0.006, Figures 4C,D). In contrast, under acid stress conditions (T2), the percentage of biovar diacetylactis strains depended on temperature. At 35°C, this proportion increased to 24% (p = 0.012) suggesting a greater capacity for diacetyl production at this step of the process, while at 22°C, pH had no significant effect on Pcit/Plac ratio (p = 1), and the percentage remained at 7% (Figures 4C,D).
Discussion
L. lactis and L. cremoris are widely used in starters for fermented dairy foods. As the two species have distinct genomic and phenotypic features, their respective proportions must be finely tuned throughout the design of the starters. Interactions between the two species probably occur during dairy fermentation, and the technological process used could change the balance between populations, thereby affecting the properties of the final product (Mills et al., 2010; Kelleher et al., 2017). Moreover, among lactis species, the biovar diacetylactis determines the specific aroma through the production of diacetyl. It is thus of primary importance to monitor each population’s dynamics. Different species- and biovar-specific PCRs have been proposed (Beimfohr et al., 1997; Corroler et al., 1999). qPCR assays using the tuf gene as target have been developed to quantify L. lactis group in cheese samples (Achilleos and Berthier, 2013). However, this method cannot selectively distinguish between lactis and cremoris species and the biovar. PCR-RFLP of the glutamate decarboxylase gene (gadB) has been proposed to distinguish the two species (Nomura et al., 2002), but this does not allow quantification and requires the strains to be isolated. With this aim in view, we identified three specific SNPs in the gadB gene and used them to design two species-specific probes. A third probe, lactis group-specific, in the same amplified fragment, enabled us to calculate the ratio of each species among the total population of L. lactis group in a duplex reaction. Both sets of primers and probes were tested on a panel of L. lactis and L. cremoris strains as well as on the species usually found in milk and dairy products. The target DNA was easily differentiated from the non-target DNA. As the populations were quantified, LoQ and LoD were defined for all the probes by testing several dilutions of a fermented milk sample. Depending on the probe, LoD values ranged from 3.6 × 10³ to 1.8 × 10⁴ copies/ml and LoQ values were 10 times higher. Considering the milk matrix, our results agree with the dynamic ranges of target determination encountered in dairy matrices like cheese using quantitative PCR (Zago et al., 2009).
Biovar diacetylactis is usually used by dairy manufacturers due to its capacity to produce diacetyl and acetoin, two aroma compounds associated with creamy and buttery flavors. The citP gene is highly valued as a molecular marker of this biovar. But the plasmid encoding CitP is sometimes missing while the chromosomal cluster citDEFXG is highly conserved among the strains that produce diacetyl (Passerini et al., 2013; Torres Manno et al., 2018). For that reason, the citD chromosomal gene encoding the citrate lyase was chosen as target to highlight the diacetylactis biovar. As few sequences are currently available in the databases, it will be necessary to update primers and probe with data accumulated in the coming years.
The specific objective of this study was to demonstrate that the gadB and citD targets described above can be used in digital droplet PCR assays to determine the proportions of the two species and the biovar in a starter or a dairy product. In contrast to qPCR, no standard curve with an external DNA calibrator is required and ddPCR shows little susceptibility to the inhibitors usually present in food matrices like dairy products (Morisset et al., 2013). With this approach, we analyzed species variations in a mesophilic starter called MM100 entirely composed of Lactococcus strains. First, we confirmed the microbial composition of the starter with 75% and 28% of lactis and cremoris species, respectively. Biovar diacetylactis was present at a ratio of 15% of the whole starter, a conventional ratio for such starters (Carr et al., 2002). Next, we analyzed variations in these ratios during the fermentation process as a function of the temperature and the pH. At the temperature specified by the supplier (35°C), pH 4.5 was reached after only 9 h and the proportions of the two species did not change substantially. Usually at this temperature, growth of strains of the cremoris species with a Cremoris phenotype (the “true Cremoris”) is not promoted (Cavanagh et al., 2015b). Since this species is maintained, we hypothesize that these strains have a Lactis phenotype. As reported in the literature, the large metabolic capabilities of the lactis species, particularly in carbohydrate metabolism, may promote faster growth rate than the cremoris species (Kelleher et al., 2017). However, as lactose is the main carbohydrate in milk, this dairy environment is very well adapted to the cremoris species strains which have the necessary ability to break down this sugar (Wels et al., 2019). Moreover, several studies have shown that strains of the lactis species initially produce acid slowly (Herreros et al., 2003; Fusieger et al., 2020) and that, conversely, strains of the cremoris species usually produce better acidification than lactis species, both at the beginning and at the end of the fermentation (Nomura et al., 2006; Fernández et al., 2011). Hence, we hypothesize that strains of the cremoris species significantly reduce the pH during fermentation.
At 22°C, the ratios were modified, with respectively, 56% and 44% of lactis and cremoris species. cremoris species growth seems promoted at this temperature, counter to lactis species whose proportion decreased. This change probably has an impact on the characteristics of the final product, resulting in different organoleptic characteristics from those obtained at 35°C. Indeed, starters with a majority of strains of the cremoris species can cause less bitterness in some dairy products like Cheddar cheese (Lee et al., 1996) compared to dairy products containing more lactis strains. This could be explained by different proteolytic systems in the two species. Comparative genome analysis identified an additional copy of oppACBFD operon encoding an oligopeptide transporter in most strains of the cremoris species, whereas only one operon has been described in most strains of the lactis species, and its functionality is unclear due to the presence of pseudogenes (Wels et al., 2019). Multiple genes for oligopeptides uptake should ensure more efficient degradation of peptides derived from milk.
Moreover, several strains of the cremoris species usually used in dairy starters display higher aminotransferase activity than their lactis counterparts (Kelleher et al., 2017). This is of particular importance in the fermented food industry because aminotransferases help developing flavor.
During acid stress, the proportions of the two species changed compared to their original proportions. Nevertheless, whatever the temperature, a balance was reached, and both species were present at the end of the process. This result is in agreement with the results of previous studies describing the persistence of the two species during cheese aging (Ruggirello et al., 2016). Moreover, L. lactis species is known to adapt its tolerance to acid stress conditions, especially by inducing responses during the exponential growth phase, allowing its survival under very low pH challenges (Frees et al., 2003). It is also worth noting that the proportion of biovar diacetylactis strains increases during the acid stress at 35°C. If this population is metabolically active at low pH, the citrate transport and its sequential conversion into pyruvate is probably induced (Martín et al., 2004). Excess pyruvate is rerouted toward the production of diacetyl/acetoin that adds flavor to the final product (García-Quintáns et al., 2008). This pathway confers a competitive advantage in condition of pyruvate accumulation (Zuljan et al., 2014). These aroma compounds are neutral metabolites and their synthesis contributes to pH homeostasis, which could explain the increase in the ratio of diacetylactis to lactis species at low pH. However, this increase does not occur at 22°C, suggesting that the lower temperature may adversely affect the activity of the enzymes involved in this pathway. Nevertheless, it should be borne in mind that differentiating between DNA of live and dead cells is a main issue when detecting by culture-independent based molecular methods. The majority of disrupted dead cells was discarded in the supernatant during the centrifugation preceding the DNA extraction. To ensure the detection of intact cells only, the use of ethidium monoazide (EMA) or propidium monoazide (PMA) based on membrane integrity could be a possible optimization of the test. Moreover, dairy process could induce VNC state as already described for L. lactis group (Ruggirello et al., 2018). A RNA-based analysis such as RT-ddPCR will discard metabolically inactive populations.
Conclusion
We developed a classical ddPCR assay with fluorescent probes illustrating a proof of concept for the discrimination of populations of interest in dairy ecosystems. The primary objective of our work was to target the lactis and cremoris species and the biovar diacetylactis that would be of considerable industrial interest. We demonstrated the applicability of the ddPCR to quantify these populations in starters and to monitor their variations during the fermentation step of a technological process like cheese making. This technology showed high tolerance to inhibitors arising from food matrices and one duplex assay allowed us directly to provide the ratio of each population.
Finally, this methodology could easily be adapted to identify different cellular states and specific sub-populations in complex ecosystems like raw milks or cheeses, thereby completing 16S metagenomics studies.
Data Availability Statement
All datasets presented in this study are included in the article/Supplementary Material.
Author Contributions
M-LD-M, HT, and MC-B conceived the study. M-AC conceived the ddPCR design. MAb, MAu, and M-AC performed the experiments. IG performed the statistical analysis. M-LD-M, M-AC, HT, and MC-B analyzed the data and wrote the manuscript. All authors read, corrected, and approved the final manuscript.
Conflict of Interest
FG was employed by CNIEL.
The remaining authors declare that the research was conducted in the absence of any commercial or financial relationships that could be construed as a potential conflict of interest.
Funding
The project was supported by the CNIEL (Centre National Interprofessionnel de l’Economie Laitière). M-AC has a grant from Région Occitanie and EI-Purpan. The funder was not involved in the study design, collection, analysis, interpretation of data, the writing of this article or the decision to submit it for publication.
Acknowledgments
We wish to acknowledge support from the Genome and Transcriptome platform of Genopole Toulouse Midi Pyrénées, on which ddPCR work was performed. Our special thanks to J.-J. Maoret, F. Martins, and E. Lhuillier, from GeT-Santé, for their active support in the experiments and their wise advice.
Supplementary Material
The Supplementary Material for this article can be found online at: https://www.frontiersin.org/articles/10.3389/fmicb.2020.01906/full#supplementary-material
Footnotes
- ^ http://www.ncbi.nlm.nih.gov
- ^ https://eu.idtdna.com/pages
- ^ https://blast.ncbi.nlm.nih.gov/Blast.cgi
References
Achilleos, C., and Berthier, F. (2013). Quantitative PCR for the specific quantification of Lactococcus lactis and Lactobacillus paracasei and its interest for Lactococcus lactis in cheese samples. Food Microbiol. 36, 286–295. doi: 10.1016/j.fm.2013.06.024
Beimfohr, C., Ludwig, W., and Schleifer, K.-H. (1997). Rapid genotypic differentiation of Lactococcus lactis subspecies and Biovar. Syst. Appl. Microbiol. 20, 216–221. doi: 10.1016/S0723-2020(97)80068-9
Billard, A., Laval, V., Fillinger, S., Leroux, P., Lachaise, H., Beffa, R., et al. (2012). The allele-specific probe and primer amplification assay, a new real-time PCR method for fine quantification of single-nucleotide polymorphisms in pooled DNA. Appl. Environ. Microbiol. 78, 1063–1068. doi: 10.1128/AEM.06957-11
Bolotin, A., Wincker, P., Mauger, S., Jaillon, O., Malarme, K., Weissenbach, J., et al. (2001). The complete genome sequence of the lactic acid bacterium Lactococcus lactis ssp. lactis IL1403. Genome Res. 11, 731–753. doi: 10.1101/gr.gr-1697r
Carr, F. J., Chill, D., and Maida, N. (2002). The lactic acid bacteria: a literature survey. Crit. Rev. Microbiol. 28, 281–370. doi: 10.1080/1040-840291046759
Cavanagh, D., Casey, A., Altermann, E., Cotter, P. D., Fitzgerald, G. F., and McAuliffe, O. (2015a). Evaluation of Lactococcus lactis isolates from nondairy sources with potential dairy applications reveals extensive phenotype-genotype disparity and implications for a revised species. Appl. Environ. Microbiol. 81, 3961–3972. doi: 10.1128/AEM.04092-14
Cavanagh, D., Fitzgerald, G. F., and McAuliffe, O. (2015b). From field to fermentation: the origins of Lactococcus lactis and its domestication to the dairy environment. Food Microbiol. 47, 45–61. doi: 10.1016/j.fm.2014.11.001
Corroler, D., Desmasures, N., and Gueguen, M. (1999). Correlation between polymerase chain reaction analysis of the histidine biosynthesis operon, randomly amplified polymorphic DNA analysis and phenotypic characterization of dairy Lactococcus isolates. Appl. Microbiol. Biotechnol. 51, 91–99. doi: 10.1007/s002530051368
Day, E., Dear, P. H., and McCaughan, F. (2013). Digital PCR strategies in the development and analysis of molecular biomarkers for personalized medicine. Methods 59, 101–107. doi: 10.1016/j.ymeth.2012.08.001
de Felipe, F. L., Magni, C., de Mendoza, D., and López, P. (1995). Citrate utilization gene cluster of the Lactococcus lactis biovar diacetylactis: organization and regulation of expression. Mol. Gen. Genet. MGG 246, 590–599. doi: 10.1007/BF00298965
Elizaquível, P., Sánchez, G., and Aznar, R. (2012). Quantitative detection of viable foodborne E. coli O157:H7, Listeria monocytogenes and Salmonella in fresh-cut vegetables combining propidium monoazide and real-time PCR. Food Control 25, 704–708. doi: 10.1016/j.foodcont.2011.12.003
Fernández, E., Alegría, A., Delgado, S., Martín, M. C., and Mayo, B. (2011). Comparative phenotypic and molecular genetic profiling of wild Lactococcus lactis subsp. lactis strains of the L. lactis subsp. lactis and L. lactis subsp. cremoris genotypes, isolated from starter-free cheeses made of raw milk. Appl. Environ. Microbiol. 77, 5324–5335. doi: 10.1128/AEM.02991-10
Frees, D., Vogensen, F. K., and Ingmer, H. (2003). Identification of proteins induced at low pH in Lactococcus lactis. Int. J. Food Microbiol. 87, 293–300. doi: 10.1016/S0168-1605(03)00104-1
Fusieger, A., Martins, M. C. F., de Freitas, R., Nero, L. A., and de Carvalho, A. F. (2020). Technological properties of Lactococcus lactis subsp. Lactis bv. diacetylactis obtained from dairy and non-dairy niches. Braz. J. Microbiol. Publ. Braz. Soc. Microbiol. 51, 313–321. doi: 10.1007/s42770-019-00182-3
García-Quintáns, N., Magni, C., Mendoza, D., and de López, P. (1998). The citrate transport system of Lactococcus lactis subsp. Lactis biovar diacetylactis is induced by acid stress. Appl. Environ. Microbiol. 64, 850–857.
García-Quintáns, N., Repizo, G., Martín, M., Magni, C., and López, P. (2008). Activation of the diacetyl/acetoin pathway in Lactococcus lactis subsp. Lactis bv. diacetylactis CRL264 by acidic growth. Appl. Environ. Microbiol. 74, 1988–1996. doi: 10.1128/AEM.01851-07
Gobert, G., Cotillard, A., Fourmestraux, C., Pruvost, L., Miguet, J., and Boyer, M. (2018). Droplet digital PCR improves absolute quantification of viable lactic acid bacteria in faecal samples. J. Microbiol. Methods 148, 64–73. doi: 10.1016/j.mimet.2018.03.004
Herreros, M. A., Fresno, J. M., González Prieto, M. J., and Tornadijo, M. E. (2003). Technological characterization of lactic acid bacteria isolated from Armada cheese (a Spanish goats’ milk cheese). Int. Dairy J. 13, 469–479. doi: 10.1016/S0958-6946(03)00054-2
Kelleher, P., Bottacini, F., Mahony, J., Kilcawley, K. N., and van Sinderen, D. (2017). Comparative and functional genomics of the Lactococcus lactis taxon; insights into evolution and niche adaptation. BMC Genom. 18:267. doi: 10.1186/s12864-017-3650-5
Kempler, G. M., and McKay, L. L. (1980). Improved medium for detection of citrate-fermenting Streptococcus lactis subsp. diacetylactis. Appl. Environ. Microbiol. 39, 926–927.
Kumar, S., Stecher, G., and Tamura, K. (2016). MEGA7: molecular evolutionary genetics analysis version 7.0 for bigger datasets. Mol. Biol. Evol. 33, 1870–1874. doi: 10.1093/molbev/msw054
Law, J. W.-F., Ab Mutalib, N.-S., Chan, K.-G., and Lee, L.-H. (2015). Rapid methods for the detection of foodborne bacterial pathogens: principles, applications, advantages and limitations. Front. Microbiol. 5:770. doi: 10.3389/fmicb.2014.00770
Lee, K. D., Lo, C. G., and Warthesen, J. J. (1996). Removal of bitterness from the bitter peptides extracted from cheddar cheese with peptidases from Lactococcus lactis ssp. cremoris SK111. J. Dairy Sci. 79, 1521–1528. doi: 10.3168/jds.S0022-0302(96)76512-8
Letertre, C., Perelle, S., Dilasser, F., Arar, K., and Fach, P. (2003). Evaluation of the performance of LNA and MGB probes in 5’-nuclease PCR assays. Mol. Cell. Prob. 17, 307–311.
Martín, M. G., Sender, P. D., Peirú, S., de Mendoza, D., and Magni, C. (2004). Acid-inducible transcription of the operon encoding the citrate lyase complex of Lactococcus lactis Biovar diacetylactis CRL264. J. Bacteriol. 186, 5649–5660. doi: 10.1128/JB.186.17.5649-5660.2004
Mills, S., O’sullivan, O., Hill, C., Fitzgerald, G., and Ross, R. P. (2010). The changing face of dairy starter culture research: from genomics to economics. Int. J. Dairy Technol. 63, 149–170. doi: 10.1111/j.1471-0307.2010.00563.x
Morisset, D., Štebih, D., Milavec, M., Gruden, K., and Žel, J. (2013). Quantitative analysis of food and feed samples with droplet digital PCR. PLoS One 8:e62583. doi: 10.1371/journal.pone.0062583
Mouritzen, P., Nielsen, A. T., Pfundheller, H. M., Choleva, Y., Kongsbak, L., and Møller, S. (2003). Single nucleotide polymorphism genotyping using locked nucleic acid (LNA). Expert Rev. Mol. Diagn. 3, 27–38. doi: 10.1586/14737159.3.1.27
Nomura, M., Kimoto, H., Someya, Y., and Suzuki, I. (1999). Novel characteristic for distinguishing Lactococcus lactis subsp. Lactis from subsp. cremoris. Int. J. Syst. Evol. Microbiol. 49, 163–166. doi: 10.1099/00207713-49-1-163
Nomura, M., Kobayashi, M., Narita, T., Kimoto-Nira, H., and Okamoto, T. (2006). Phenotypic and molecular characterization of Lactococcus lactis from milk and plants. J. Appl. Microbiol. 101, 396–405. doi: 10.1111/j.1365-2672.2006.02949.x
Nomura, M., Kobayashi, M., Ohmomo, S., and Okamoto, T. (2000). Inactivation of the glutamate decarboxylase gene in Lactococcus lactis subsp. cremoris. Appl. Environ. Microbiol. 66, 2235–2237. doi: 10.1128/AEM.66.5.2235-2237.2000
Nomura, M., Kobayashi, M., and Okamoto, T. (2002). Rapid PCR-based method which can determine both phenotype and genotype of Lactococcus lactis subspecies. Appl. Environ. Microbiol. 68, 2209–2213. doi: 10.1128/AEM.68.5.2209-2213.2002
Obis, D., Guillot, A., and Mistou, M. Y. (2001). Tolerance to high osmolality of Lactococcus lactis subsp. lactis and cremoris is related to the activity of a betaine transport system. FEMS Microbiol. Lett. 202, 39–44. doi: 10.1111/j.1574-6968.2001.tb10777.x
Parente, E., and Cogan, T. M. (2004). “Starter cultures: general aspects,” in Cheese: Chemistry, Physics and Microbiology General Aspects, eds P. F. Fox, P. L. H. McSweeney, T. M. Cogan, and T. P. Guinee (Cambridge, MA: Academic Press), 123–147. doi: 10.1016/S1874-558X(04)80065-4
Passerini, D., Beltramo, C., Coddeville, M., Quentin, Y., Ritzenthaler, P., and Daveran-Mingot, M.-L. (2010). Genes but not genomes reveal bacterial domestication of Lactococcus lactis. PLoS One 5:e15306. doi: 10.1371/journal.pone.0015306
Passerini, D., Laroute, V., Coddeville, M., Le Bourgeois, P., Loubière, P., Ritzenthaler, P., et al. (2013). New insights into Lactococcus lactis diacetyl- and acetoin-producing strains isolated from diverse origins. Int. J. Food Microbiol. 160, 329–336. doi: 10.1016/j.ijfoodmicro.2012.10.023
Postollec, F., Falentin, H., Pavan, S., Combrisson, J., and Sohier, D. (2011). Recent advances in quantitative PCR (qPCR) applications in food microbiology. Food Microbiol. 28, 848–861. doi: 10.1016/j.fm.2011.02.008
R Development Core Team (2005). R: A Language and Environment for Statistical Computing. Vienna, Austria: R foundation for statistical computing. Available online at: https://www.R-project.org/
Ren, J., Deng, T., Huang, W., Chen, Y., and Ge, Y. (2017). A digital PCR method for identifying and quantifying adulteration of meat species in raw and processed food. PLoS One 12:e0173567. doi: 10.1371/journal.pone.0173567
Ruggirello, M., Cocolin, L., and Dolci, P. (2016). Fate of Lactococcus lactis starter cultures during late ripening in cheese models. Food Microbiol. 59, 112–118. doi: 10.1016/j.fm.2016.05.001
Ruggirello, M., Giordano, M., Bertolino, M., Ferrocino, I., Cocolin, L., and Dolci, P. (2018). Study of Lactococcus lactis during advanced ripening stages of model cheeses characterized by GC-MS. Food Microbiol. 74, 132–142. doi: 10.1016/j.fm.2018.03.012
Schleifer, K. H., Kraus, J., Dvorak, C., Kilpper-Bälz, R., Collins, M. D., and Fischer, W. (1985). Transfer of Streptococcus lactis and related Streptococci to the genus Lactococcus gen. nov. Syst. Appl. Microbiol. 6, 183–195. doi: 10.1016/S0723-2020(85)80052-7
Smit, G., Smit, B. A., and Engels, W. J. M. (2005). Flavour formation by lactic acid bacteria and biochemical flavour profiling of cheese products. FEMS Microbiol. Rev. 29, 591–610. doi: 10.1016/j.femsre.2005.04.002
Smith, C. J., and Osborn, A. M. (2009). Advantages and limitations of quantitative PCR (Q-PCR)-based approaches in microbial ecology. FEMS Microbiol. Ecol. 67, 6–20. doi: 10.1111/j.1574-6941.2008.00629.x
Spinnler, H. E., and Corrieu, G. (1989). Automatic method to quantify starter activity based on pH measurement. J. Dairy Res. 56, 755–764. doi: 10.1017/S0022029900029332
Strayer, A. L., Jeyaprakash, A., Minsavage, G. V., Timilsina, S., Vallad, G. E., Jones, J. B., et al. (2016). A multiplex real-time PCR assay differentiates four Xanthomonas species associated with bacterial spot of tomato. Plant Dis. 100, 1660–1668. doi: 10.1094/PDIS-09-15-1085-RE
Tessonnière, H., Vidal, S., Barnavon, L., Alexandre, H., and Remize, F. (2009). Design and performance testing of a real-time PCR assay for sensitive and reliable direct quantification of Brettanomyces in wine. Int. J. Food Microbiol. 129, 237–243. doi: 10.1016/j.ijfoodmicro.2008.11.027
Torres Manno, M., Zuljan, F., Alarcón, S., Esteban, L., Blancato, V., Espariz, M., et al. (2018). Genetic and phenotypic features defining industrial relevant Lactococcus lactis, L. cremoris and L. lactis biovar. diacetylactis strains. J. Biotechnol. 282, 25–31. doi: 10.1016/j.jbiotec.2018.06.345
Wang, M., Yang, J., Gai, Z., Huo, S., Zhu, J., Li, J., et al. (2018). Comparison between digital PCR and real-time PCR in detection of Salmonella typhimurium in milk. Int. J. Food Microbiol. 266, 251–256. doi: 10.1016/j.ijfoodmicro.2017.12.011
Wels, M., Siezen, R., van Hijum, S., Kelly, W. J., and Bachmann, H. (2019). Comparative genome analysis of Lactococcus lactis indicates niche adaptation and resolves genotype/phenotype disparity. Front. Microbiol. 10:4. doi: 10.3389/fmicb.2019.00004
Zago, M., Bonvini, B., Carminati, D., and Giraffa, G. (2009). Detection and quantification of Enterococcus gilvus in cheese by real-time PCR. Syst. Appl. Microbiol. 32, 514–521. doi: 10.1016/j.syapm.2009.07.001
Zuljan, F., Espariz, M., Blancato, V. S., Esteban, L., Alarcón, S., and Magni, C. (2016). Draft genome sequence of Lactococcus lactis subsp. Lactis bv. diacetylactis CRL264, a citrate-fermenting strain. Genome Announc. 4:15. doi: 10.1128/genomeA.01575-15
Keywords: L. lactis, L. cremoris, biovar diacetylactis, starters, ddPCR
Citation: Caillaud M-A, Abeilhou M, Gonzalez I, Audonnet M, Gaucheron F, Cocaign-Bousquet M, Tormo H and Daveran-Mingot M-L (2020) Precise Populations’ Description in Dairy Ecosystems Using Digital Droplet PCR: The Case of L. lactis Group in Starters. Front. Microbiol. 11:1906. doi: 10.3389/fmicb.2020.01906
Received: 05 June 2020; Accepted: 21 July 2020;
Published: 06 August 2020.
Edited by:
Paloma López, Margarita Salas Center for Biological Research (CSIC), SpainReviewed by:
Christian Magni, CONICET Instituto de Biología Molecular y Celular de Rosario (IBR), ArgentinaAtte Von Wright, University of Eastern Finland, Finland
Copyright © 2020 Caillaud, Abeilhou, Gonzalez, Audonnet, Gaucheron, Cocaign-Bousquet, Tormo and Daveran-Mingot. This is an open-access article distributed under the terms of the Creative Commons Attribution License (CC BY). The use, distribution or reproduction in other forums is permitted, provided the original author(s) and the copyright owner(s) are credited and that the original publication in this journal is cited, in accordance with accepted academic practice. No use, distribution or reproduction is permitted which does not comply with these terms.
*Correspondence: Muriel Cocaign-Bousquet, Y29jYWlnbkBpbnNhLXRvdWxvdXNlLmZy