
94% of researchers rate our articles as excellent or good
Learn more about the work of our research integrity team to safeguard the quality of each article we publish.
Find out more
ORIGINAL RESEARCH article
Front. Microbiol. , 28 April 2020
Sec. Evolutionary and Genomic Microbiology
Volume 11 - 2020 | https://doi.org/10.3389/fmicb.2020.00785
 Yunyoung Kwak1,2,3*
The improvement of biopesticides for use in the agriculture industry requires an understanding of the biological- and ecological principles underlying their behavior in natural environments. The nuclear genomes of members of the genus Trichoderma, which are representative fungal biocontrol agents, have been actively studied in relation to the unique characteristics of these species as effective producers of CAZymes/secondary metabolites and biopesticides, but their mitochondrial genomes have received much less attention. In this study, the mitochondrial genome of Trichoderma atroviride (Hypocreales, Sordariomycetes), which targets wood-decaying fungal pathogens and has the ability to degrade chemical fungicides, was assembled de novo. A 32,758 bp circular DNA molecule was revealed with specific features, such as a few more protein CDS and trn genes, two homing endonucleases (LAGLIDADG-/GIY-YIG-type), and even a putative overlapping tRNA gene, on a closer phylogenetic relationship with T. gamsii among hypocrealean fungi. Particularly, introns were observed with several footprints likely to be evolutionarily associated with the intron dynamics of the Trichoderma mitochondrial genomes. This study is the first to report the complete de novo mitochondrial genome of T. atroviride, while comparative analyses of Trichoderma mitochondrial genomes were also conducted from the perspective of mitochondrial evolution for the first time.
Mitochondria, double membrane-bound organelles widely considered to have originated from an early alpha-proteobacterium endosymbiont, have various roles for the cell viability in eukaryotic organisms. As well as their primary function as a source of energy production [i.e., adenosine triphosphate (ATP) production] via oxidative phosphorylation (Saraste, 1999), mitochondria are known to be involved in ion homeostasis, intermediary metabolism and cell apoptosis (Burger et al., 2003). Mitochondria harbor their own genetic materials, and mitochondrial DNAs have generally been reported to occur in the form of circular-mapping molecules typically consisting of a single chromosome (i.e., mitochondrial genome or mitogenome) (Burger et al., 2003). The mitochondrial genome is mainly composed of two major gene sets, coding for (1) key components involved in energy production and (2) mitochondrial translation (e.g., transfer RNA), but its genomic structures (e.g., gene content and gene density) varies significantly between eukaryotic lineages (Unseld et al., 1997; Salinas-Giege et al., 2015).
Fungal mitochondrial genomes usually contain 14 conserved core-genes that encode functional proteins involved in oxidative phosphorylation and electron transport, two genes for small and large subunits of ribosomal RNA (rRNAs), and a varying number of genes for transfer RNAs (tRNAs) (Gray et al., 1999; Saraste, 1999). However, the overall size of the mitochondrial genome differs within fungal families, even for closely related species. Approximately 661 fungal mitochondrial genomes are currently available in the GenBank database on NCBI (organelle genome database as of, February 2020: 511 genomes from Ascomycetes species, 118 from Basidiomycetes species, and 32 from other fungi). Except for a mitochondrial genome of the edible mushroom Morchella importuna that reported newly in the size of 272 kb (GenBank accession no. MK527108) (Liu et al., 2020), the largest fungal mitochondrial genome was reported in the phytopathogenic fungus Rhizoctonia solani AG3, being ≈235 kb in size with harboring 127 coding sequences (CDS) (GenBank accession no. NC_021436) (Losada et al., 2014), but the mitochondrial genome of R. solani AG1 from the same species is only 162 kb in size, with 59 CDS (GenBank accession no. HF546977) (Wibberg et al., 2013). Beyond gene content, other genomic features were characterized in highly variable across fungal mitochondrial genomes, such as gene order, intergenic regions, tRNAs distribution, mobile elements, and intron numbers and size (Aguileta et al., 2014).
Mitochondrial genomes, typically uniparentally inherited (Birky, 1995), are considered as ideal tools for research into eukaryotic evolution due to their (1) relatively small sizes, (2) high copy numbers, (3) irreversible gene loss and limited recombination among mitochondrial genomes, and (4) high mutation rates leading to accelerated evolution independently of nuclear genomes (Burger et al., 2003). However, these unique characteristics contribute differently to the divergent evolutions of the mitochondrial genomes within major eukaryotic taxa. For instance, length heteroplasmy (i.e., the coexistence of different sized mitochondrial genomes) is much more common in animals than in plants and fungi, whereas plant mitochondrial genomes display extensive more variations in genome size and more frequency of recombination than those of animals (Barr et al., 2005). Although fungal mitochondrial genomes have been less studied than those of animals or plants, it seems that they have more complex features of evolutionary patterns. Fungi are phylogenetically positioned close to animals, but fungal mitochondrial genomes show signals of recombination, similar to those of plants (Basse, 2010; Aguileta et al., 2014; Wu and Hao, 2019). Interestingly, however, the introns of fungal mitochondrial genomes have mostly been classified as group I introns, whereas plants generally possess group II introns in their mitochondrial genomes (Lang et al., 2007).
Hypocrealean fungi (Hypocreales, Ascomycota) are both ecologically and economically important. Because of their diverse range of lifestyles as plant-pathogens, plant-saprobes, plant-endophytes, mycoparasites, or pathogens of insects and nematodes (Bushley et al., 2013), hypocrealean fungi act as significant regulators of insects and phytopathogenic fungi in natural environments, and are used as attractive alternatives to chemical pesticides in agriculture (i.e., biocontrol agents) (Rossman et al., 1999). In particular, species of the genus Trichoderma (teleomorph Hypocrea), which are frequently isolated from free soil, soil litters, dead wood, and the rhizosphere, have been widely used as representative fungal biocontrol agents due to their specific biological abilities, such as (1) growing on the mature sporocarps of phytopathogenic fungi as mycoparasites, (2) utilizing dead fungal biomass as saprotrophs, and (3) inducing plant defense responses by various secondary metabolites, thus increasing plant immunity and the production of cell-wall degrading enzymes protecting plants against phytopathogens (Druzhinina et al., 2011, 2012; Mukherjee et al., 2013).
The improvement of biopesticides for use in the agriculture industry requires an understanding of the biological- and ecological principles underlying their behavior in natural environments. The rapid advance in sequencing technologies has led to an increase in the genome sequencing and analysis of Trichoderma species, with the resulting chromosomal genetic information actively analyzed in terms of the molecular regulation- and evolutionary mechanisms of the genus (Martinez et al., 2008; Kubicek et al., 2011, 2019; Mukherjee et al., 2013; Druzhinina et al., 2018). However, to date, only four Trichoderma mitochondrial genome sequences are available in the GenBank database on NCBI, i.e., those of T. reesei QM9414 (GenBank accession no. AF447590), T. asperellum B05 (GenBank accession no. NC_037075), T. hamatum (GenBank accession no. MF287973), and T. gamsii KUC1747 (GenBank accession no. KU687109). Except for a brief description of the mitochondrial genome of T. reesei QM9414 in a study of mitochondrial activity with glucose metabolites (Chambergo et al., 2002), the characterization and comprehensive analysis of these Trichoderma mitochondrial genomes have not yet been conducted.
The fungal strain T. atroviride ATCC 26799 (=IFO/NBRC 30543; formerly known as T. harzianum (Ban et al., 2010); Hypocreales, Sordariomycetes, Ascomycota) is a biocontrol agent that is used to target wood-decaying fungal pathogens and that can degrade chemical fungicides containing chlorinated phenol compounds (Cserjesi, 1967; Highley and Ricard, 1988). Based on previous studies that have reported more rapid mitochondrial evolution under harsh natural conditions (Baker et al., 2017) and mitochondrial activities in response to fungicide effect (Mosbach et al., 2017), the mitochondrial genomic information of the fungus T. atroviride ATCC 26799 (=IFO/NBRC 30543) can be useful resources to understand its particular features as both a mycoparasite and a degrader of chemical compounds in situ. In addition, the knowledge of this fungal mitochondrial genome will allow expanding our understanding of fungal mitochondrial genomes and its dynamic evolutions in hypocrealean fungi.
The Trichoderma atroviride (formerly known as T. harzianum; Ban et al., 2010) strain was obtained from the American Type Culture Collection {ATCC, Manassas, VA, United States; accession number ATCC 26799 [=IFO 30543, Institute for Fermentation (IFO, Osaka, Japan)], [=NBRC 30543 NITE Biological Resource Center (NBRC, Chiba, Japan)] (Cserjesi, 1967). The strain ATCC 26799 has presented under the previous name T. harzianum in the ATCC collection till now. However, in this study, this fungus was designated as T. atroviride ATCC 26799 than T. harzianum ATCC 26799 based on a recent report about Trichoderma re-identification under the NBRC collection (Ban et al., 2010).
The fungal strain was cultured on DifcoTM potato dextrose medium (Difco Laboratories Inc., Detroit, MI, United States) at 25°C for 5 days. Total genomic DNA was extracted from the mycelia using a Plant/Fungi DNA Isolation Kit (Sigma-Aldrich Co Ltd., St. Louis, MO, United States) according to the manufacturer’s instructions and followed by further purification steps using Phenol-Chloroform (v:v, 1:1; Sigma-Aldrich Co Ltd., St. Louis, MO, United States) (Sambrook and Russell, 2006). The quality and quantity of the extracted DNA were assessed using DNA agarose gel electrophoresis (Sambrook, 2001) and Qubit assay using a QubitTM 3.0 Fluorometer (Thermo Fisher Scientific Inc., Waltham, MA, United States), respectively.
The extracted genomic DNA of T. atroviride ATCC 26799 was used to construct a 20-kb insert SMRTbell® DNA library on a BluePippinTM size-selection system (Pacific Biosciences, Menlo Park, CA, United States). It was then sequenced on a Single Molecule Real-Time (SMRT) sequencing platform using a PacBio RS-II DNA sequencer with P6 polymerase-C4 sequencing chemistry (Pacific Biosciences, Menlo Park, CA, United States) (Eid et al., 2009) at the Génome Québec Innovation Centre, McGill University (Canada).
A total of 1,214,216,973 raw read bases were generated with 450,876 reads from the long-read SMRT sequencing on three SMRT cells. After removing low-quality reads, the remaining raw reads (those with a quality higher than 0.85) were used for de novo mitochondrial genome assembly using the Hierarchical Genome-Assembly Process (HGAP) (Chin et al., 2013) in the SMRTTM pipeline (Pacific Biosciences, Menlo Park, CA, United States). The accuracy and circularity of the de novo mitochondrial genome assembly were then verified using the P-mapping (BLASR) module (Chaisson and Tesler, 2012) in the SMRTTM pipeline (Pacific Biosciences, Menlo Park, CA, United States) and Gepard (Krumsiek et al., 2007) to generate dotplots, respectively.
The T. atroviride ATCC 26799 mitochondrial genome was annotated on webservers for Mitos1 (Bernt et al., 2013) and Mfannot2 (Valach et al., 2014), under the Genetic Code 4 (the Mold, Protozoan, and Coelenterate Mitochondrial Code). These initial annotations were then modified by the NCBI Open Reading Frame (ORF) Finder (Coordinators, 2018) and BLAST searches of the NCBI non-redundant (nr) database with default parameters (O’Leary et al., 2016). Transfer RNA genes (tRNAs) were annotated by combining the results from the RNAweasel webserver3 (Lang et al., 2007) and tRNAScan-SE (v.2.0) (Chan and Lowe, 2019), under the Genetic Code 4. Finally, annotations relating to gene boundaries (particularly at exon-intron junctions) were curated manually to avoid frame-shift errors in the open reading frames (ORFs). In addition, the intergenic region between the genes in the complete de novo mitochondrial genome was estimated manually. All annotations for the gene components of the T. atroviride ATCC 26799 mitochondrial genome were illustrated in circular plots using Circos (Krzywinski et al., 2009).
The base composition and codon usage of the T. atroviride ATCC 26799 mitochondrial genome were analyzed using MEGA (v.10.0) (Kumar et al., 2018) and the EMBOSS package (Rice et al., 2000). The secondary structure of tRNAs was predicted using tRNAScan-SE (v.2.0) (Chan and Lowe, 2019), and the asymmetric bias of nucleotide composition was assessed according to the following formulas (Perna and Kocher, 1995): AT-skew = (A−T)/(A+T) and GC-skew = (G−C)/(G+C).
The non-synonymous substitution rate (Ka), synonymous substitution rate (Ks), and Ka/Ks ratio for 13 core protein-coding genes (atp6, atp8, cob, cox1, cox2, cox3, nad1, nad2, nad3, nad4, nad4L, nad5, and nad6; the atp9 gene was excluded because it was absent from the mitochondrial genome of T. gamsii KUC1747) in the Trichoderma mitochondrial genomes were calculated on the pairwise alignments of the target genes between Trichoderm species using DnaSP (v.6.12.03) (Rozas et al., 2017), and the obtained values were plotted using ggplot2 (Wickham, 2016) in R (v.3.4.0) (R Core Team, 2017).
To identify repetitive elements in the complete de novo mitochondrial genome, interspersed repeats were analyzed using BLAST (Boratyn et al., 2013) searches of the complete mitochondrial genome against itself (self-comparisons: E-values < 10–10), and tandem repeats were investigated using Tandem Repeats Finder (v.4.0.9) (Benson, 1999) with the default parameters. Lastly, comparative analyses of the gene orders [rns and the 14 core genes (atp6, atp8, atp9, cob, cox1, cox2, cox3, nad1, nad2, nad3, nad4, nad4L, nad5, and nad6)] and the genomic synteny among the Trichoderma mitochondrial genomes were carried out in Mauve (v.2.4.0) (Darling et al., 2010) and the results were plotted using Circos (Krzywinski et al., 2009).
To place the T. atroviride ATCC 26799 mitochondrial genome in a phylogenetic tree, complete mitochondrial genomes of 38 Hypocreales species (Sordariomycetes, Ascomycota) were downloaded from the GenBank database on NCBI4 (Sayers et al., 2019). In addition, one Sordariales genome (strain Neurospora crassa OR74A; Sordariomycetes, Ascomycota) was downloaded to be used as an outgroup. In the obtained nucleotide datasets, the gene encoding ATP synthase F0 subunit 9 (atp9) was absent from the mitochondrial genome of T. gamsii KUC1747 (GenBank accession no. KU687109). Therefore, except for atp9, all of the sequences from the 13 core genes (atp6, atp8, cob, cox1, cox2, cox3, nad1, nad2, nad3, nad4, nad4L, nad5, and nad6) were used for phylogenetic analysis. The nucleotide sequences of the 13 core genes were individually aligned using MAFFT (v.7.429) with an automatic algorithm (parameter: mafft – auto) (Katoh and Standley, 2013), and multiple sequence alignments were concatenated in SequenceMatrix (v.1.8) (Vaidya et al., 2011).
The best-fit evolutionary model for the concatenated sequences was determined using Jmodeltest (v.2.1.10) with the Akaike Information Criterion (AIC) and Bayesian Information Criterion (BIC) (Darriba et al., 2012), the GTR+Gamma+I substitution model was selected as the best fit from all of the different criteria. Based on the established model parameters, phylogenetic relationships were reconstructed using maximum likelihood (ML) (Cavalli-Sforza and Edwards, 1967) and Bayesian inference (BI) (Rannala and Yang, 1996; Nascimento et al., 2017). ML analysis was conducted in RAxML (v.8.2) with 1,000 bootstrap replicates (Stamatakis, 2014), and the bootstrap (BS) values were displayed on the nodes of the constructed phylogenetic tree. BI analysis was carried out in MrBayes (v.3.2.6) (Ronquist et al., 2012), which was run simultaneously with the Markov Chains Monte Carlo (MCMC) algorithm (three heated chains and one cold chain, with a heating coefficient of 0.1) for 2 × 10⁶ generations, and trees were sampled every 400 generations. The first 25% of the sampled trees (by 5 × 10⁵ generations) were discarded as burn-in, and the remaining trees were used to construct the consensus tree with values of Bayesian Posterior Probabilities (BPP). Lastly, the stationarity of BI analysis was considered by calculating the average standard deviation for split frequencies (<0.01).
Intron loci of mitochondrial genome were investigated on the RNAweasel webserver3 (Lang et al., 2007) under the Genetic Code 4, and intronic open reading frames were identified using the NCBI Open Reading Frame (ORF) Finder (Coordinators, 2018) and BLAST searches of the NCBI non-redundant (nr) database with default parameters (O’Leary et al., 2016).
The evolution of mitochondrial introns was assessed on the Bayesian consensus tree of Trichoderma mitochondrial genomes as follow: The nucleotide sequences from exons of 13 core genes (atp6, atp8, cob, cox1, cox2, cox3, nad1, nad2, nad3, nad4, nad4L, nad5, and nad6; the atp9 gene was excluded because it was absent from the mitochondrial genome of T. gamsii KUC1747) were individually aligned using MAFFT (v.7.429) with an automatic algorithm (parameter: mafft – auto) (Katoh and Standley, 2013), and multiple sequence alignments were concatenated in SequenceMatrix (v.1.8) (Vaidya et al., 2011). To these concatenated sequences, the best-fit evolutionary model was determined using Jmodeltest (v.2.1.10) (Darriba et al., 2012), and BI analysis was carried out in MrBayes (v.3.2.6) (Ronquist et al., 2012) with the same conditions for the Hypocreales phylogeny under the best fit for GTR+Gamma substitution model. The presence/absence patterns of intron loci were mapped on the obtained BI phylogeny according to the state of presence (scored as 1) or absence (scored as 0), and the gain/loss events of introns were traced using the parsimony method in Mesquite (v.3.6) (Maddison and Maddison, 2018). In the reconstructed ancestral states, the presence of a given intron character (cob-i1, cox1-i, and cox3-i) was colored as black on the nodes, and the mitochondrial genome of Hirsutella thompsonii ARSEF 9457 (Hypocreales, Ophiocordycipitaceae) was used as an outgroup.
Using the next-generation sequencing (NGS) of the genomic DNA from Trichoderma atroviride (formerly known as T. harzianum; Ban et al., 2010) ATCC 26799, the mitochondrial genome was assembled de novo with a high depth of coverage (314.81x; GenBank accession no. MN125601). The complete de novo mitochondrial genome was found to be a closed-circular DNA molecule with a length of 32,758 bp, consisting of 14 core protein-coding genes, four additional open reading frames (orf genes) encoding hypothetical proteins, 27 transfer RNA genes (tRNAs), two ribosomal RNA genes (rRNAs), one gene encoding the ribosomal protein S3, two genes harboring conserved domains for the homing endonuclease (HE) protein, and non-coding regions. All genes were located on the heavy strand (H-strand) and transcribed in a clockwise direction, except for one gene encoding the GIY-YIG-type HE protein located on the light strand (L-strand) and transcribed in an anticlockwise direction (Figure 1).
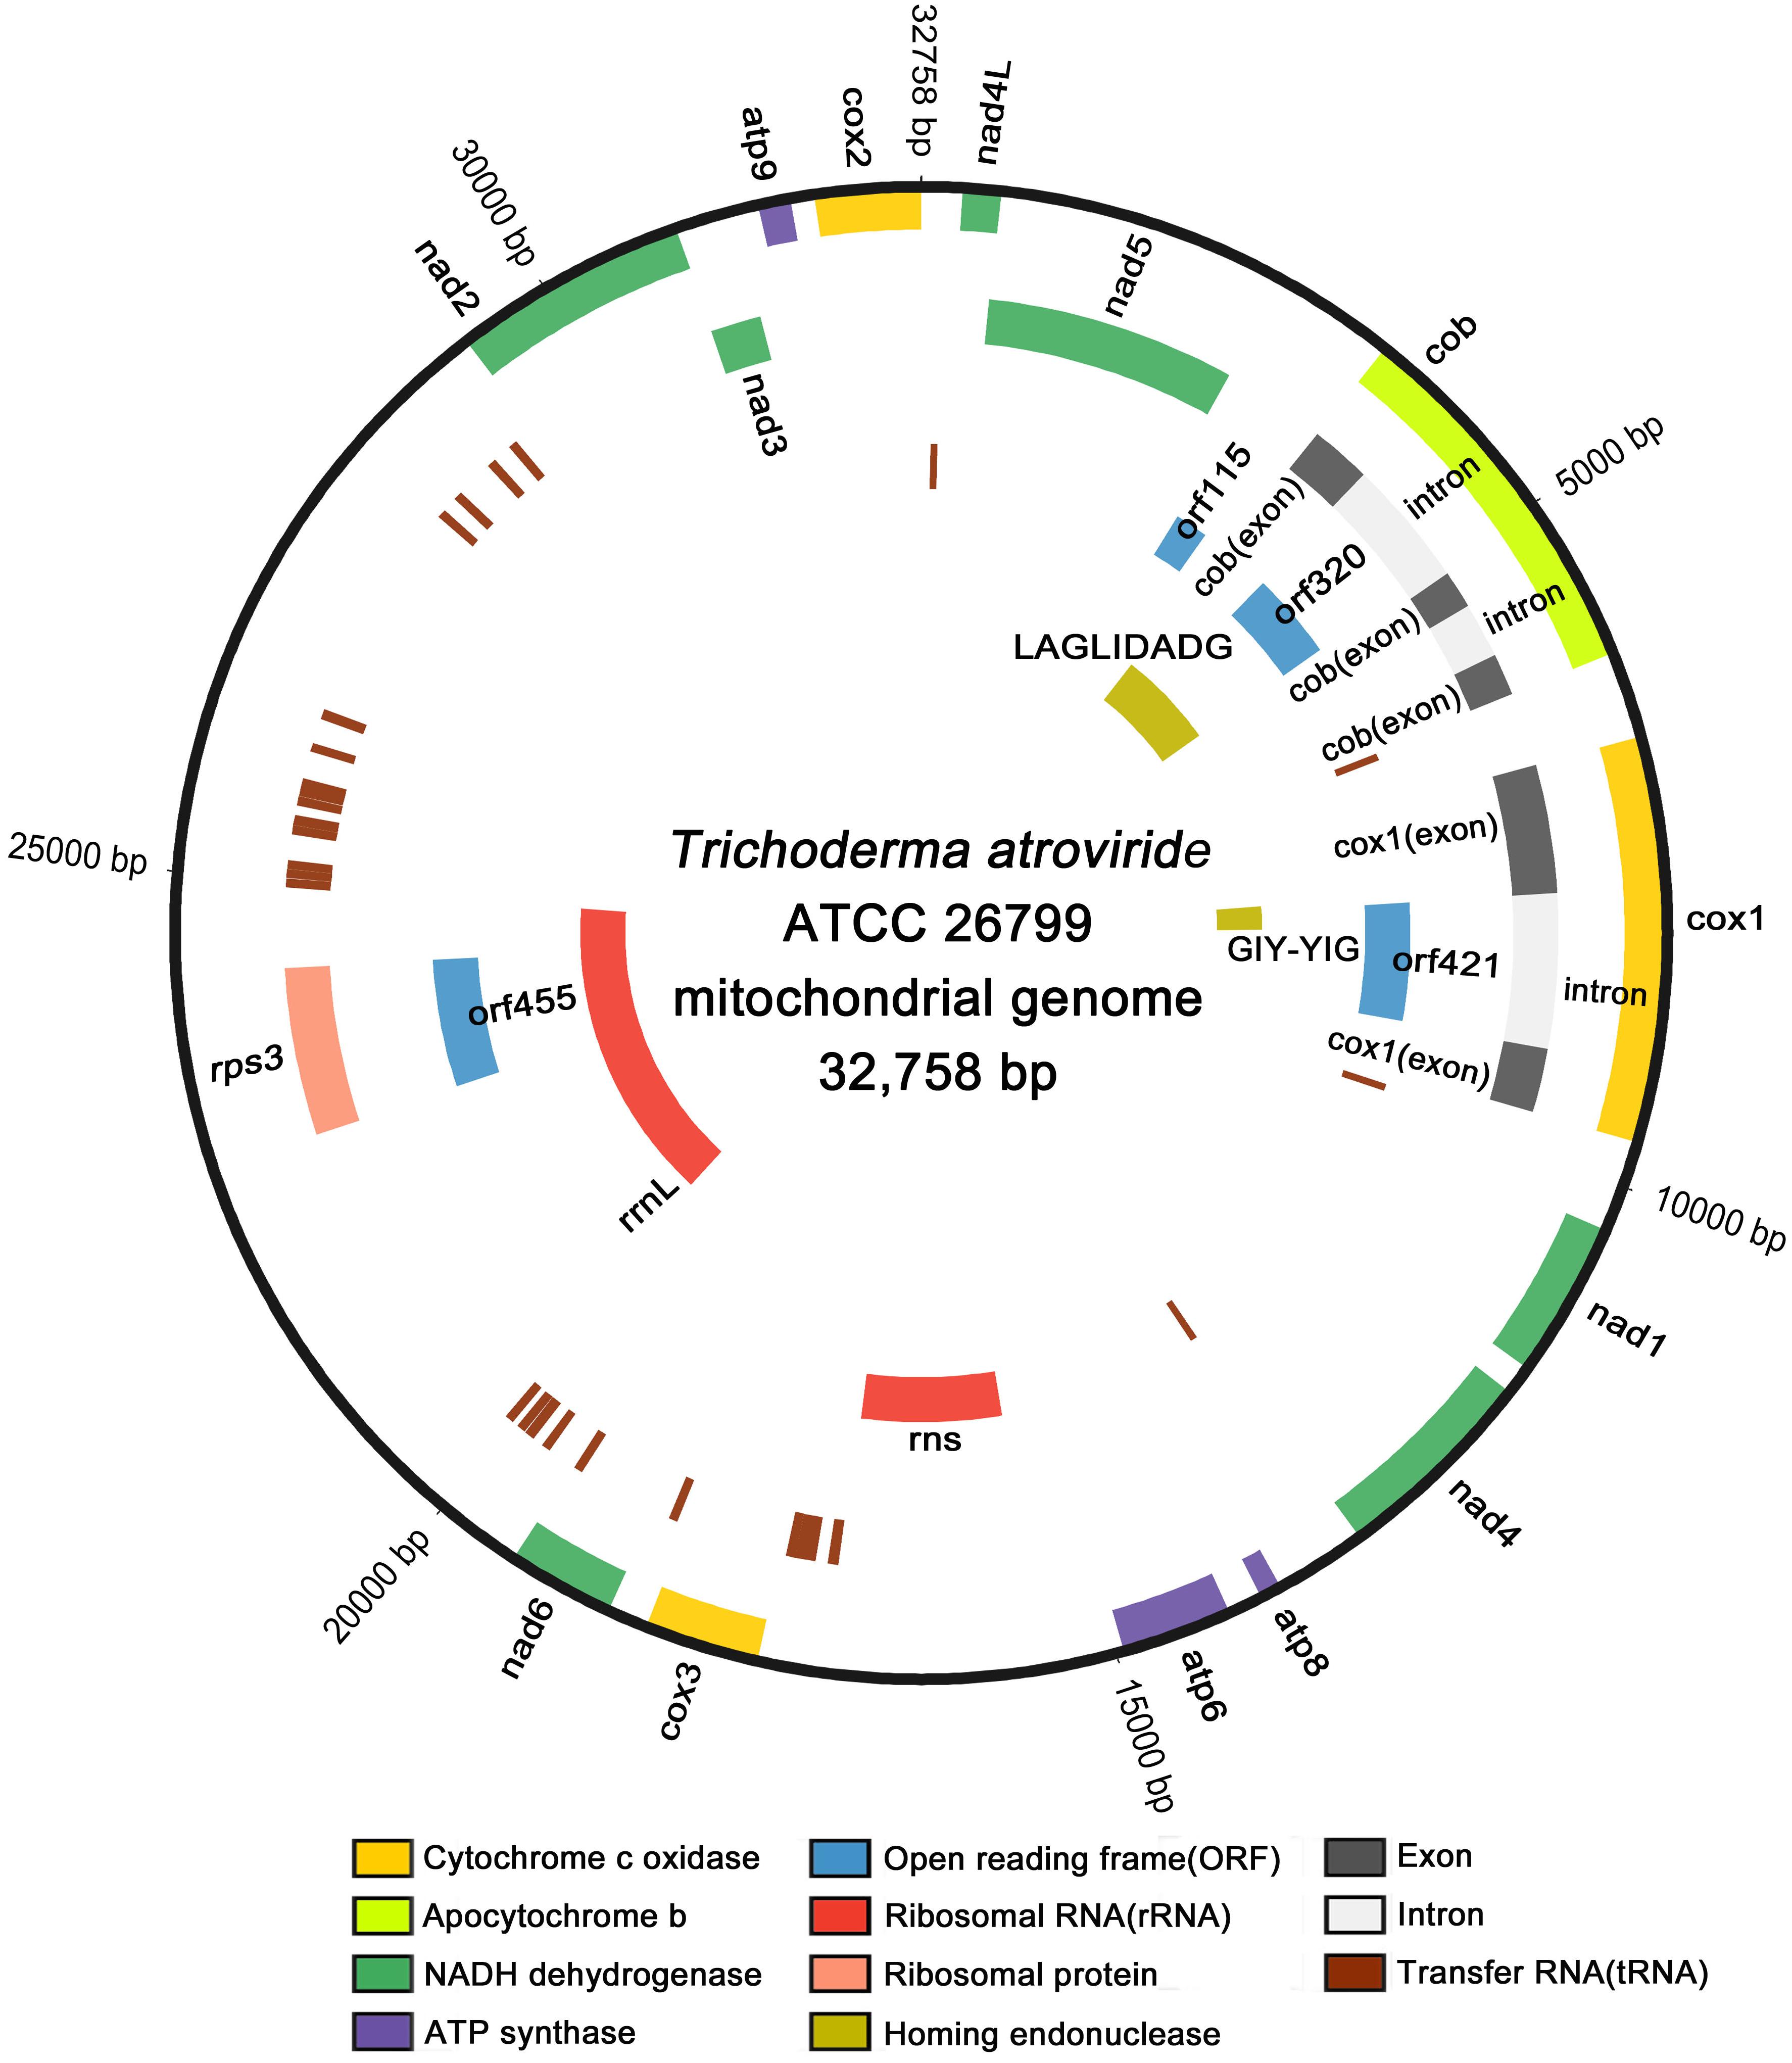
Figure 1. Circular map of the complete mitochondrial genome of T. atroviride ATCC 26799. All genes are located on the heavy strand (H-strand) and transcribed in the clockwise direction, except for one gene encoding the GIY-YIG-type homing endonuclease that located on the light strand (L-strand) and transcribed in the anticlockwise direction. Gene components were indicated with different color blocks, and the circular map was plotted using Circos.
The overall nucleotide compositions of the complete mitochondrial genome was A (36.1%), T (35.7%), G (15.4%), and C (12.8%), meaning the proportion of AT content (71.8%) was ≈2.54 times higher than that of GC content (28.2%). The asymmetric bias of nucleotide composition was estimated based on the skewness, with the obtained values all positive (0.006 for AT-skew and 0.091 for GC-skew), meaning that adenine (A) and guanine (G) occurred more frequently than did thymine (T) and cytosine (C) in the H-strand. The non-coding regions ranged in size from 4 to 1,842 bp and accounted for ≈24.93% of the entire length of the mitochondrial genome (Table 1).
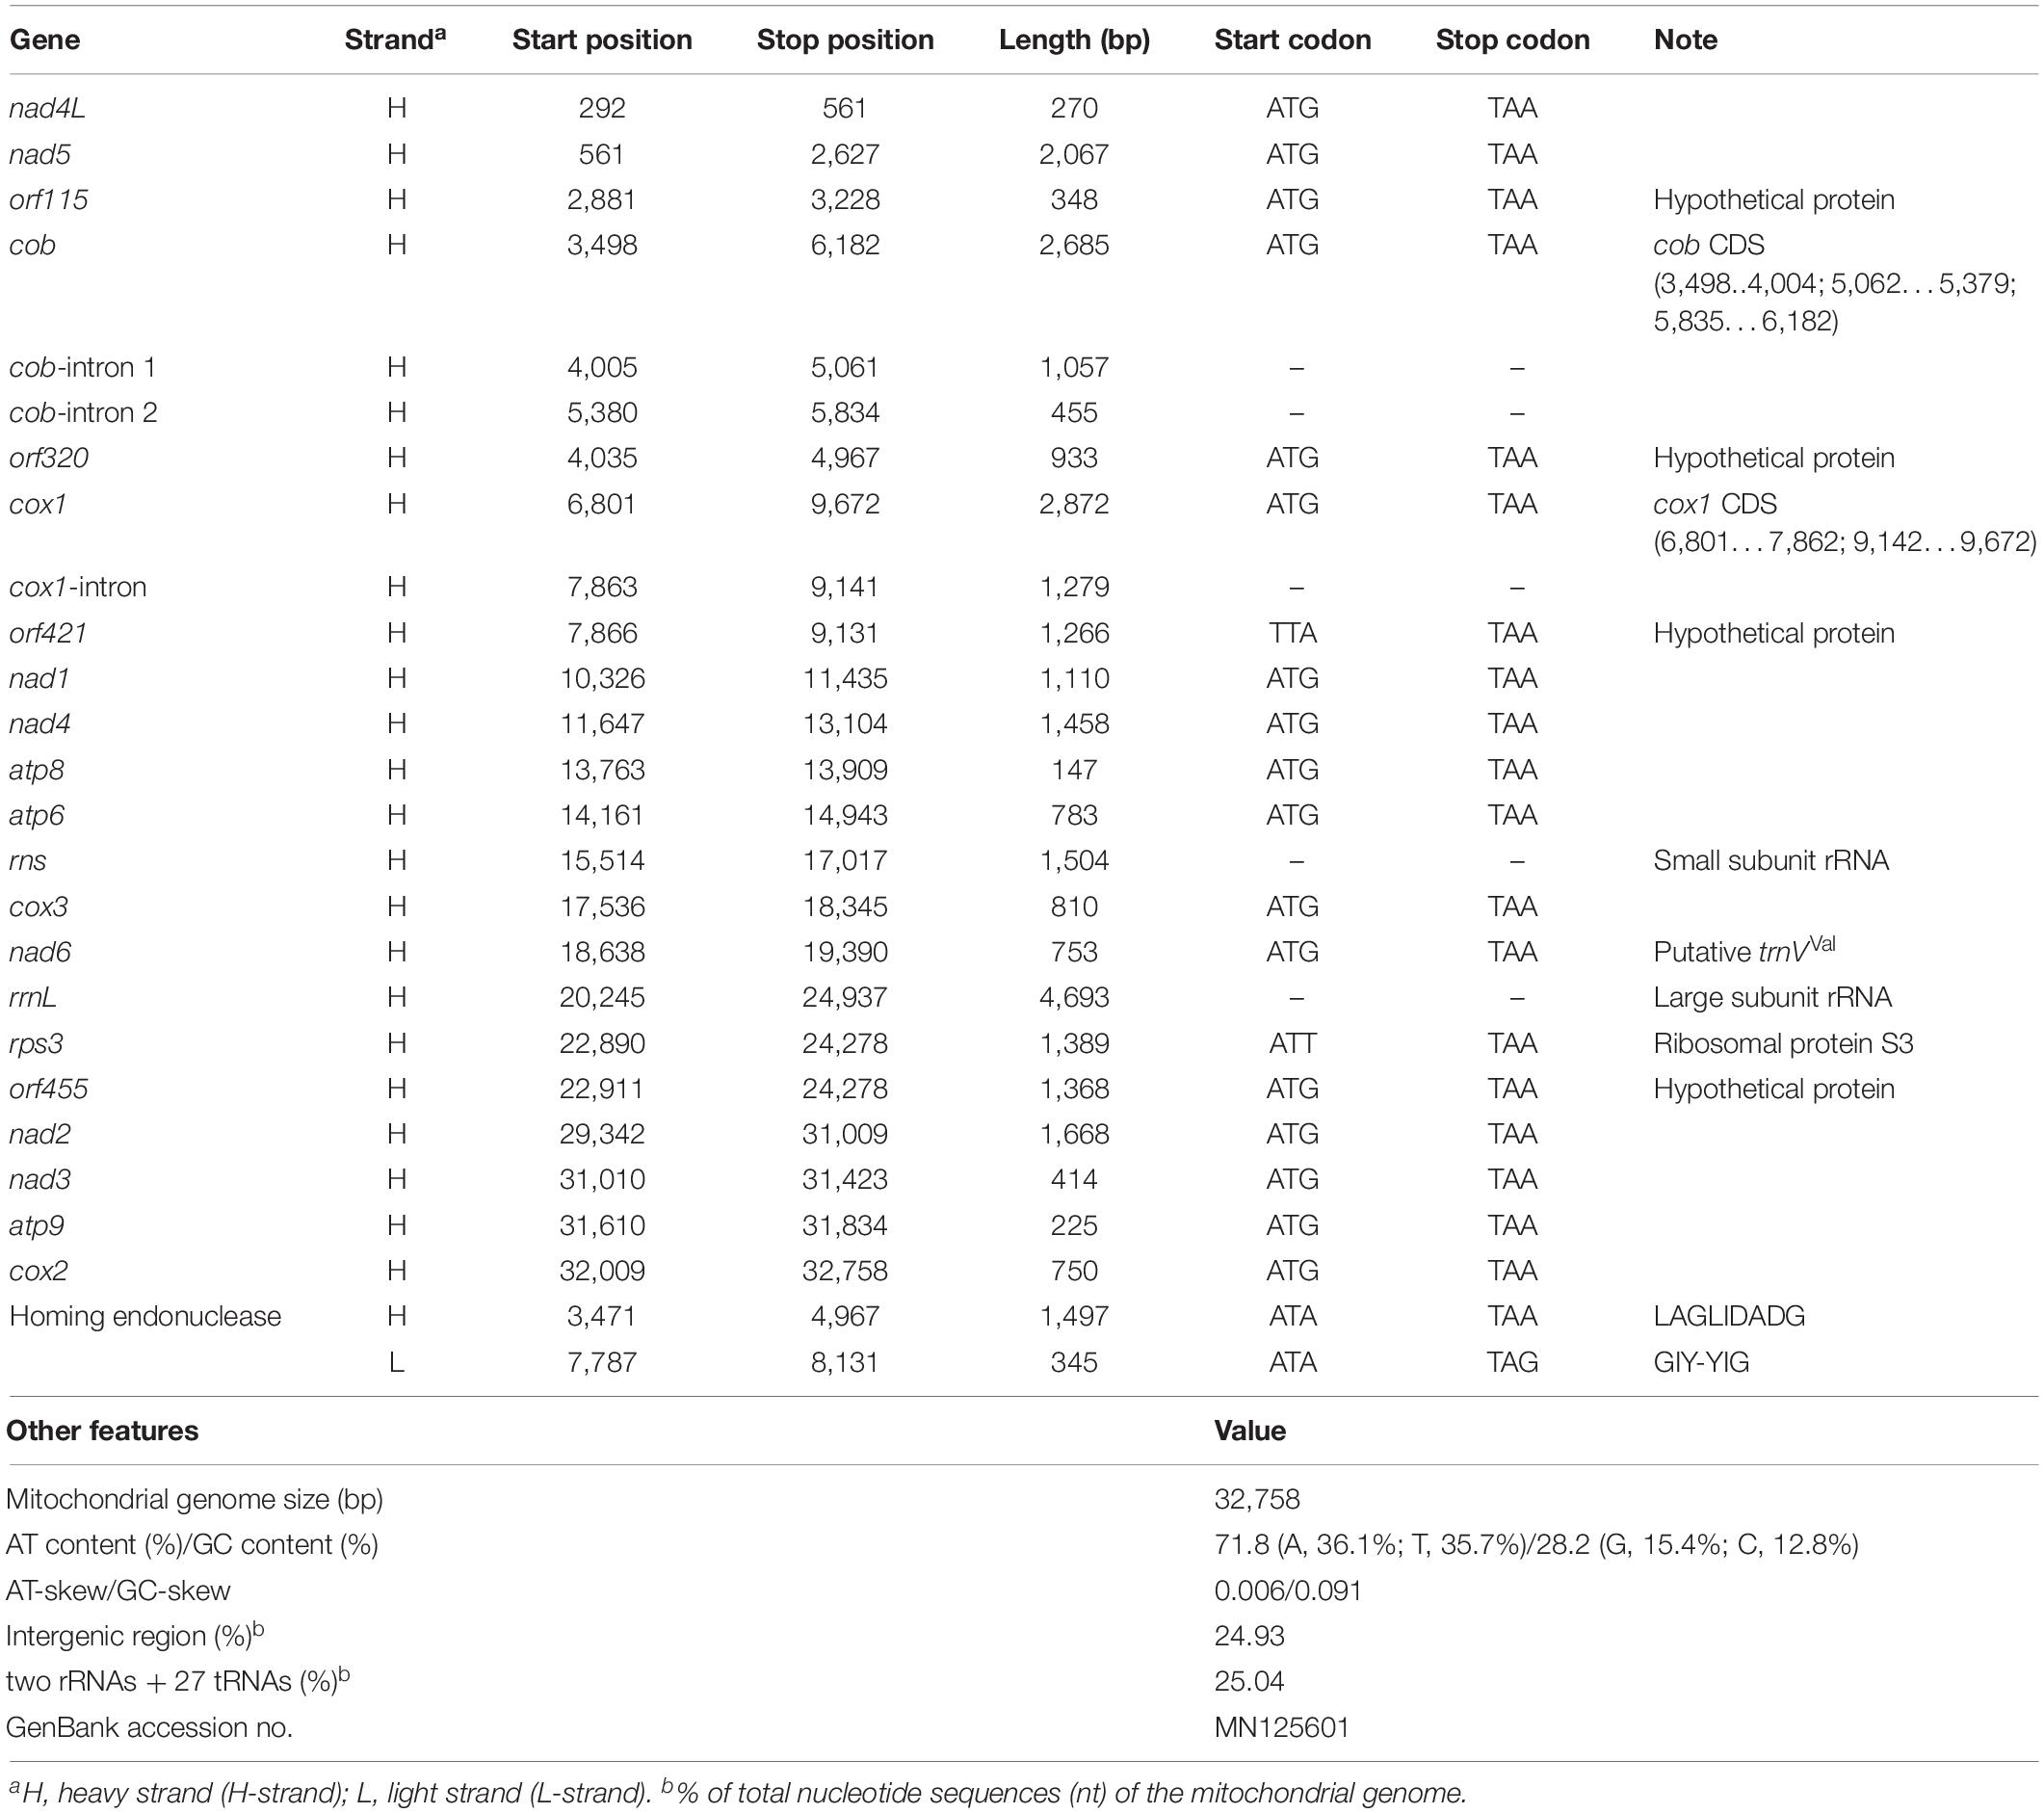
Table 1. Genomic organization of the T. atroviride ATCC 26799 mitochondrial genome.
All 14 conserved core protein-coding genes were 16,012 bp in size and composed of three ATP synthases (atp6, atp8, and atp9), one apocytochrome b (cob), three cytochrome c oxidases (cox1, cox2, and cox3), and seven NADH dehydrogenases (nad1, nad2, nad3, nad4, nad4L, nad5, and nad6). Of these genes, cox1 was the longest (2,872 bp) and the shortest was atp8 (147 bp). Four open reading frames without predicted functions (orf115, orf320, orf421, and orf455) were also found. All core genes and ORFs were initiated with a standard start codon of ATG and terminated with the TAA stop codon, except for orf421, which had a TTA initiation codon. There was an overlap of one nucleotide base between the TAA stop codon of nad4L and the ATG start codon of nad5 (-1 bp, corresponding to the codon A). Of the identified orf genes, orf115 was determined to be a free-standing ORF, whereas orf320 and orf421 were located entirely within the introns of cob and cox1, respectively. The orf455 gene was also found to be completely within the coding region of the rps3 gene for ribosomal protein S3 (Table 1).
The total length of the tRNA genes (trn genes) was 2,007 bp, accounting for ≈6.13% of the entire size of the mitochondrial genome. The average length of the tRNA genes ranged from 70 bp (trnFPhe) to 87 bp (trnSSer), and all of the 27 tRNAs were predicted to be free-standing on the H-strand (Supplementary Table S1). Most of the tRNA genes were predicted to have a typical cloverleaf secondary structure, but some trn genes (trnYTyr, trnSSer, and trnLLeu) were found to display an extra variable arm (V-arm) (Supplementary Figure S1). Multiple copies of several of the trn genes were found with different anticodons. There were three copies of trnRArg for arginine (one copy with trnRArg [ACG] and two copies with trnRArg[TCT]), two copies of trnFPhe for phenylalanine (trnFPhe [AAA] and trnFPhe[GAA]), two copies of trnSSer for serine (trnSSer[GCT] and trnSSer[TGA]) and two copies of trnLLeu for leucine (trnLLeu[TAA] and trnLLeu[TAG]). Four copies of the trnMMet gene coding for methionine were found with the same anticodon (trnMMet[CAT]) (Supplementary Table S1).
Two rRNA genes, the rns gene for small subunit ribosomal RNA and the rrnL gene for large subunit ribosomal RNA, were located on the H-strand with lengths of 1,504 bp and 4,693 bp, respectively. The rns gene was located between atp6 and cox3, but the rrnL gene was detected in a position ranging over both orf455 and rps3. Both orf455 and rps3 were positioned as internal ORFs, fully within the coding region of the rrnL gene (Figure 1 and Table 1). All of the 27 tRNA genes and the two rRNA genes accounted for 25.04% of the total length of the mitochondrial genome (Table 1).
In the complete mitochondrial genome of T. atroviride ATCC 26799, leucine (L) was the most frequent amino acid (with a relative frequency of 12.1%) and was encoded by six codons: TTA (46.2%), CTA (16.5%), CTT (14.9%), TTG (10.8%), CTG (6.3%), and CTC (5.4%). Then, isoleucine (I, 11.0%), tyrosine (Y, 7.1%), and serine (S, 6.9%) were the next most frequently occurring amino acids, while methionine (M) was the least common (1.7%) (Supplementary Table S2).
Through a self-comparison of the mitochondrial genome in BLAST searches, three interspersed repeat sequences were identified with lengths ranging from 39 to 56 bp. The largest repeats were found ca. 565 bp away from each other, harboring 95% similarity, and the intergenic region between these two repeat sequences contained five trn genes (trnMMet, trnLLeu, trnAAla, trnFPhe, and trnKLys). The shortest repeats were located in the region between the 3′ end region of the atp6 gene and rns gene, harboring 100% similarity. These short repeat sequences were 357 bp apart from each other, but no gene was found between these two short repeats. Furthermore, four types of tandem repeats were detected with sizes ranging from 14 to 21 bp, and these repeats were presented in two- or three copies on the mitochondrial genome. The repeat sequences, which were mostly duplicated and 20 bp or 21 bp in size, were observed either in the coding region of the nad4L gene or in the intergenic region between nad5 and orf115. However, all of the tandem repeats, of which there were three copies of sizes 14 bp or 15 bp, were found within the orf455 gene surrounded by two genes, rps3 and rrnL (Supplementary Table S3).
The taxonomic location of the T. atroviride ATCC 26799 mitochondrial genome was investigated based on the molecular phylogeny of Hypocreales. The publicly available mitochondrial genomes of Hypocreales species were retrieved from the GenBank database on NCBI, mitochondrial genomes harboring core genes in multiple copies were excluded to remove the potential effects of intra-genomic heterogeneity (Waterhouse et al., 2011; Hellmuth et al., 2015), 38 Hypocreales species were used in the phylogenetic analysis (Supplementary Table S4). One Sordariales strain (Neurospora crassa OR74A), belonging to the class Sordariomycetes, which also contains Hypocreales, was used as an outgroup.
The molecular phylogenies were well supported with high confidences, and all 38 Hypocreales species were divided into seven major clades (Bionectriaceae, Clavicipitaceae, Cordycipitaceae, Hypocreaceae, Hypocreales incertae sedis, Nectriaceae, and Ophiocordycipitaceae). To the relatedness between the clades, the Hypocreaceae family, which includes the Trichoderma genus, was found to be a sister clade of Ophiocordycipitaceae/Clavicipitaceae and clustered as {[[(Hypocreaceae) + (Ophiocordycipitaceae + Clavicipitaceae)] + (Cordycipitaceae + Bionectriaceae + Hypocreales incertae sedis)] + Nectriaceae} on the ML- and BI tree. Among hypocrealean fungi, a sister relationship between T. atroviride ATCC 26799 and T. gamsii KUC1747 was observed identically in both tree topologies (BS = 100, BPP = 1.00) (Figure 2 and Supplementary Figure S2).
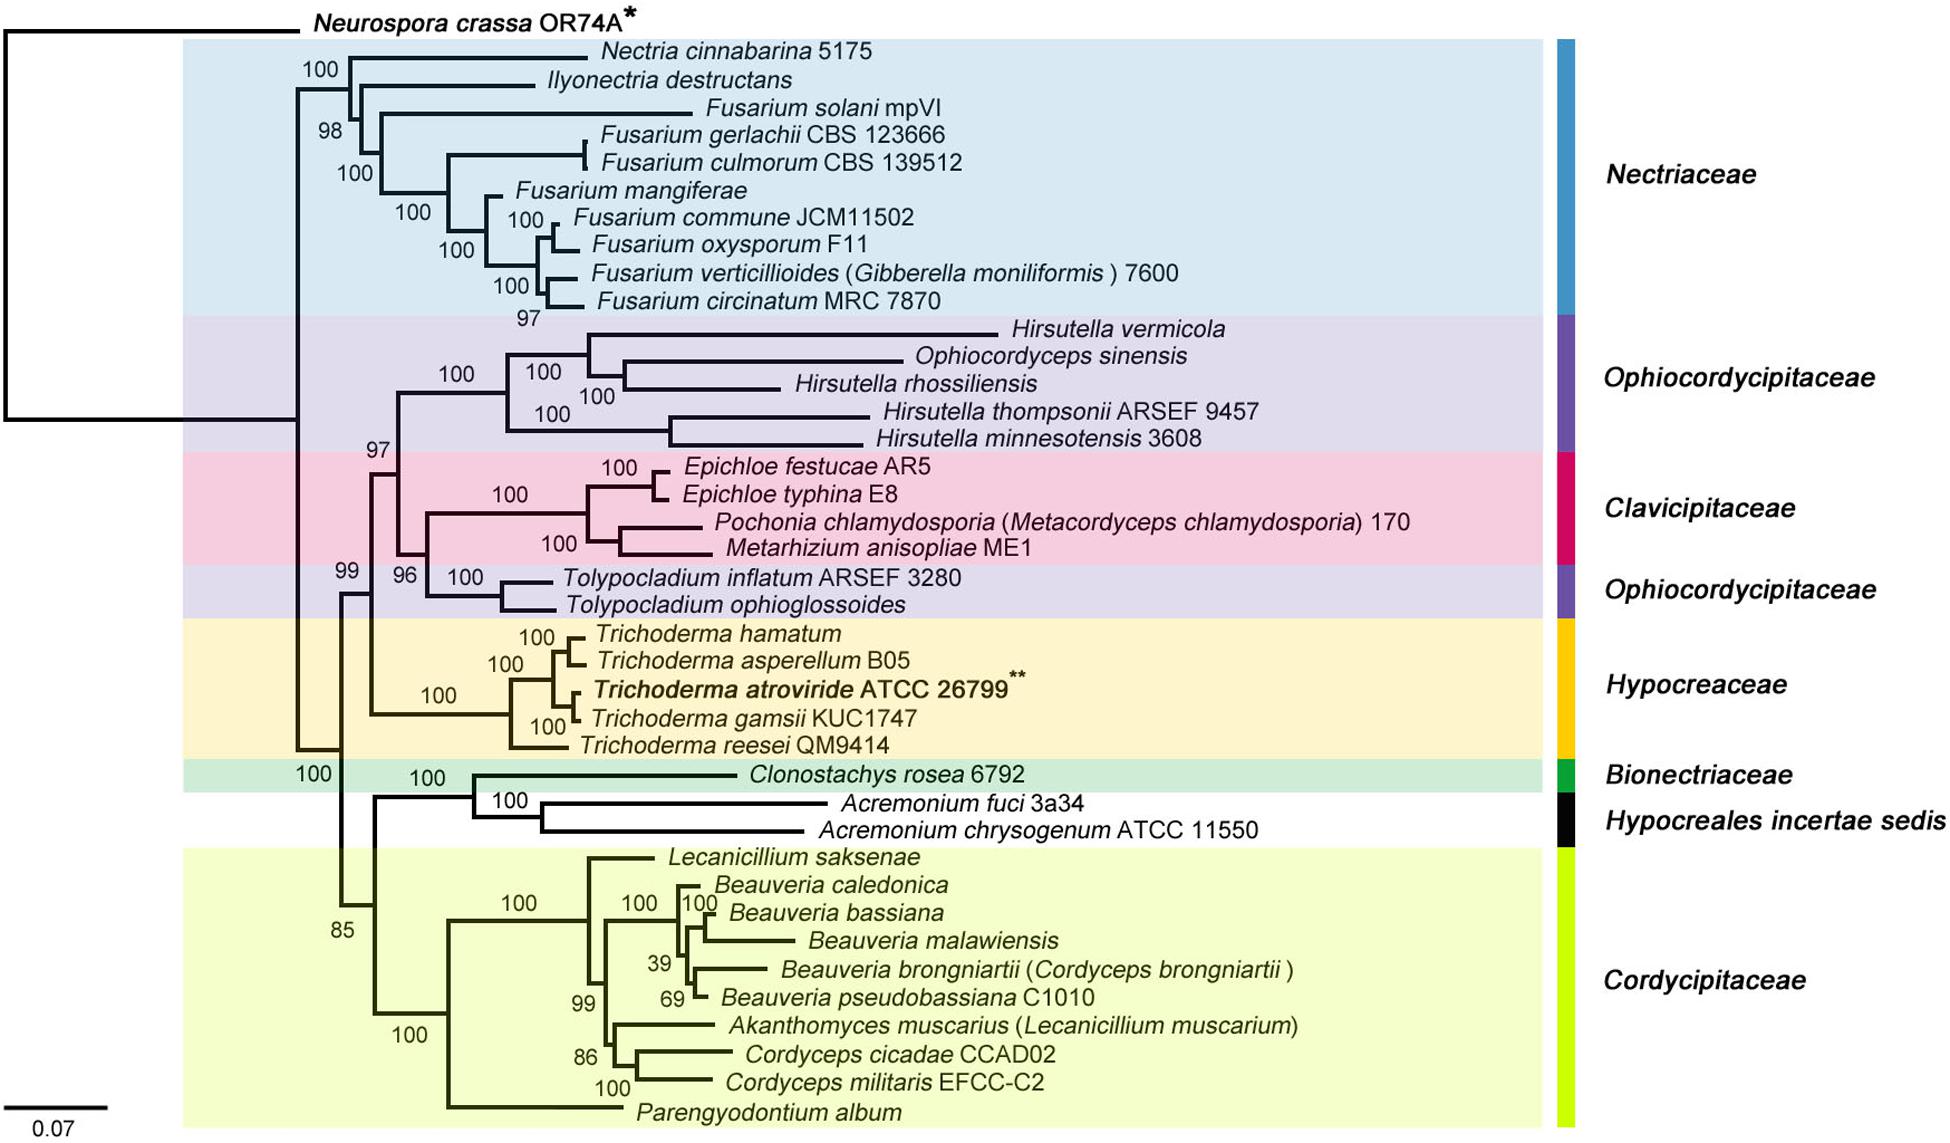
Figure 2. Phylogenetic tree of the Hypocreales species (Sordariomycetes) mitochondrial genomes based on ML (maximum likelihood) analysis. The tree was generated using concatenated sequences of 13 core genes (atp6, atp8, cob, cox1, cox2, cox3, nad1, nad2, nad3, nad4, nad4L, nad5, and nad6), and the mitochondrial genome of Neurospora crassa OR74A (Sordariales) was used as an outgroup. All Sordariomycetes species that used for the phylogenetic tree were described in Supplementary Table S4, and ML bootstrap (BS) values were marked on the nodes.
The complete mitochondrial genome of T. atroviride ATCC 26799 was compared with mitochondrial genomes from other Trichoderma species, such as T. reesei QM9414 (GenBank accession no. AF447590), T. asperellum B05 (GenBank accession no. NC_037075), T. hamatum (GenBank accession no. MF287973), and T. gamsii KUC1747 (GenBank accession no. KU687109) (Table 2). Synteny analysis revealed that the Trichoderma mitochondrial genomes could be divided into five representative regions and relatively positioned in various sizes across the mitochondrial genomes (Supplementary Figure S3). All of the core genes and rns gene were observed in a highly conservative gene orders for each synthenic blocks, and the mitochondrial genome of T. atroviride ATCC 26799 also exhibited this conservative gene arrangements (Figure 3).
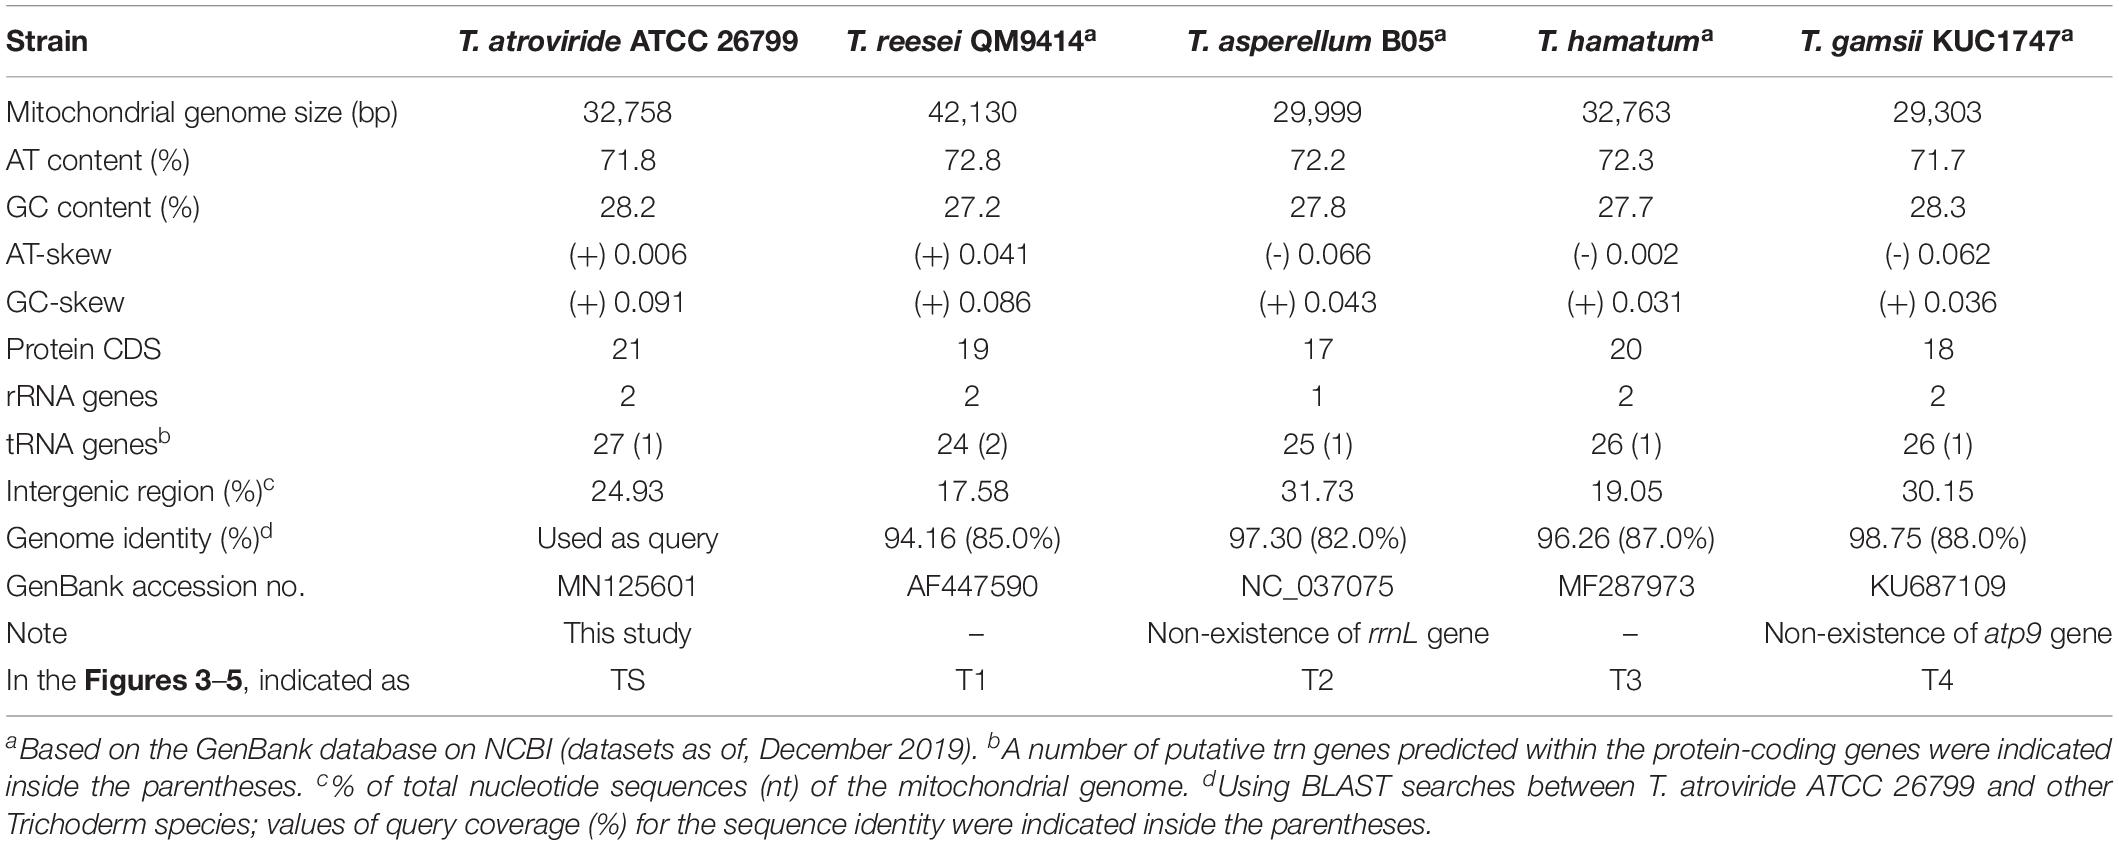
Table 2. Features of Trichoderma mitochondrial genomes that used for comparative analyses.
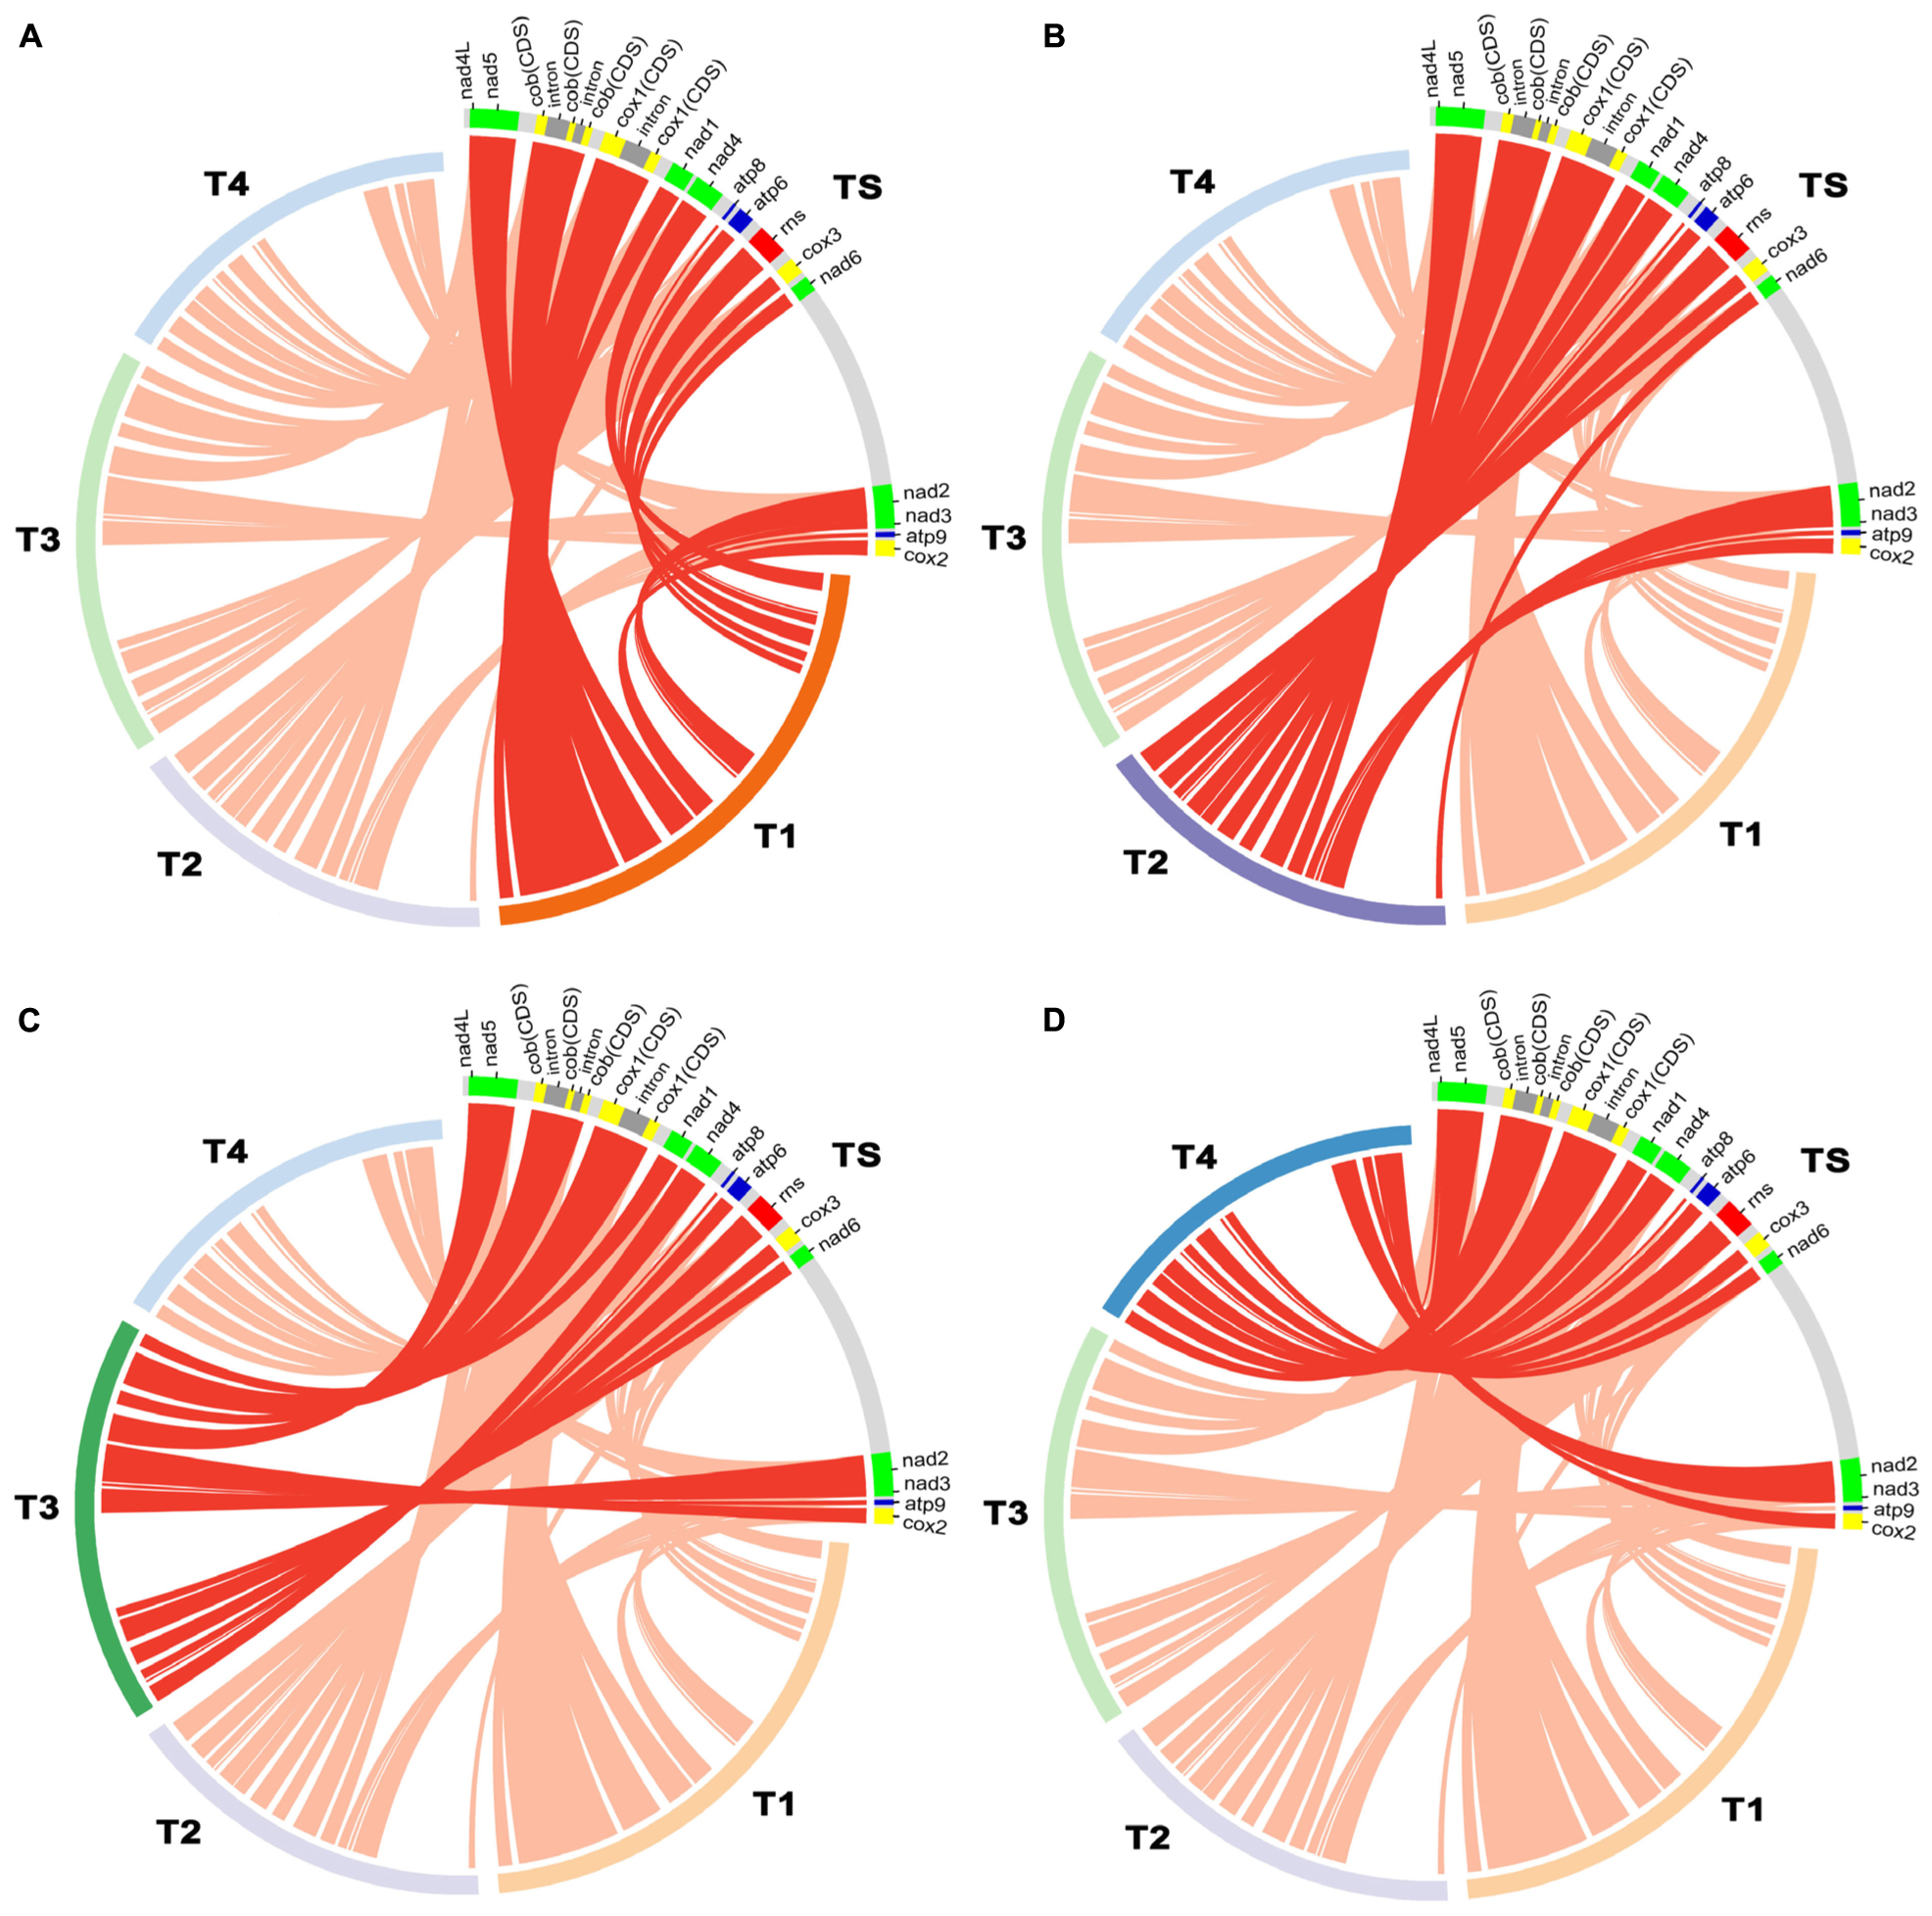
Figure 3. Comparative analysis of mitochondrial gene orders among Trichoderma species. Details of gene components (14 core genes and rns gene) used for the comparative analysis were described in Supplementary Table S5, and plots were generated using Circos. (A) compared between T. atroviride ATCC 26799 (TS) and T. reesei QM9414 (T1). (B) compared between T. atroviride ATCC 26799 (TS) and T. asperellum B05 (T2). (C) compared between T. atroviride ATCC 26799 (TS) and T. hamatum (T3). (D) compared between T. atroviride ATCC 26799 (TS) and T. gamsii KUC1747 (T4).
There was a higher variability among Trichoderma species in terms of intergenic regions, nucleotide composition bias, number of protein CDS, and the total size of the mitochondrial genome. As shown in Table 2, the intergenic region ranged from 17.58% (T. reesei QM9414) to 31.73% (T. asperellum B05), with the mitochondrial genome of T. atroviride ATCC 26799 falling in the middle of this range. The proportion of nucleotide bases (AT- and GC) was similar, but the skewness value showed variability. The mitochondrial genomes of T. asperellum B05, T. hamatum, and T. gamsii KUC1747, showed negative values of AT-skew, reflecting more frequency of thymine (T) than adenine (A), while the value of AT-skew was positive for T. atroviride ATCC 26799. The gene sets for NADH dehydrogenases were of a similar size across the Trichoderma mitochondrial genomes, but the lengths of the genes coding for apocytochrome b (cob) and cytochrome c oxidases (cox1, cox2, and cox3) varied in size due to the presence of introns (Supplementary Table S5). The mitochondrial genome of T. atroviride ATCC 26799 carried more protein CDS and trn genes than those of other Trichoderma mitochondrial genomes. As a result of these variations, the overall size of the Trichoderma mitochondrial genomes ranged widely from 29,303 bp (T. gamsii KUC1747) to 42,130 bp (T. reesei QM9414), with the mitochondrial genome of T. atroviride ATCC 26799 falling in the middle of this range. Compared to the other Trichoderma mitochondrial genomes, T. atroviride ATCC 26799 showed mean sequence identity of 96.61% over 85.5% query coverage (Table 2).
On the comparisons with other Trichoderma species, the Ka/Ks ratio of 13 core genes (atp6, atp8, cob, cox1, cox2, cox3, nad1, nad2, nad3, nad4, nad4L, nad5, and nad6; the atp9 gene was excluded because it was absent from the mitochondrial genome of T. gamsii KUC1747) were assessed in the mitochondrial genome of T. atroviride ATCC 26799. The highest ratio (0.774) was found for the nad4L gene, nevertheless, all of the Ka/Ks ratios were lower than one (<1), indicating that the core genes of the T. atroviride ATCC 26799 mitochondrial genome evolve under purifying selection (Figure 4 and Supplementary Table S6).
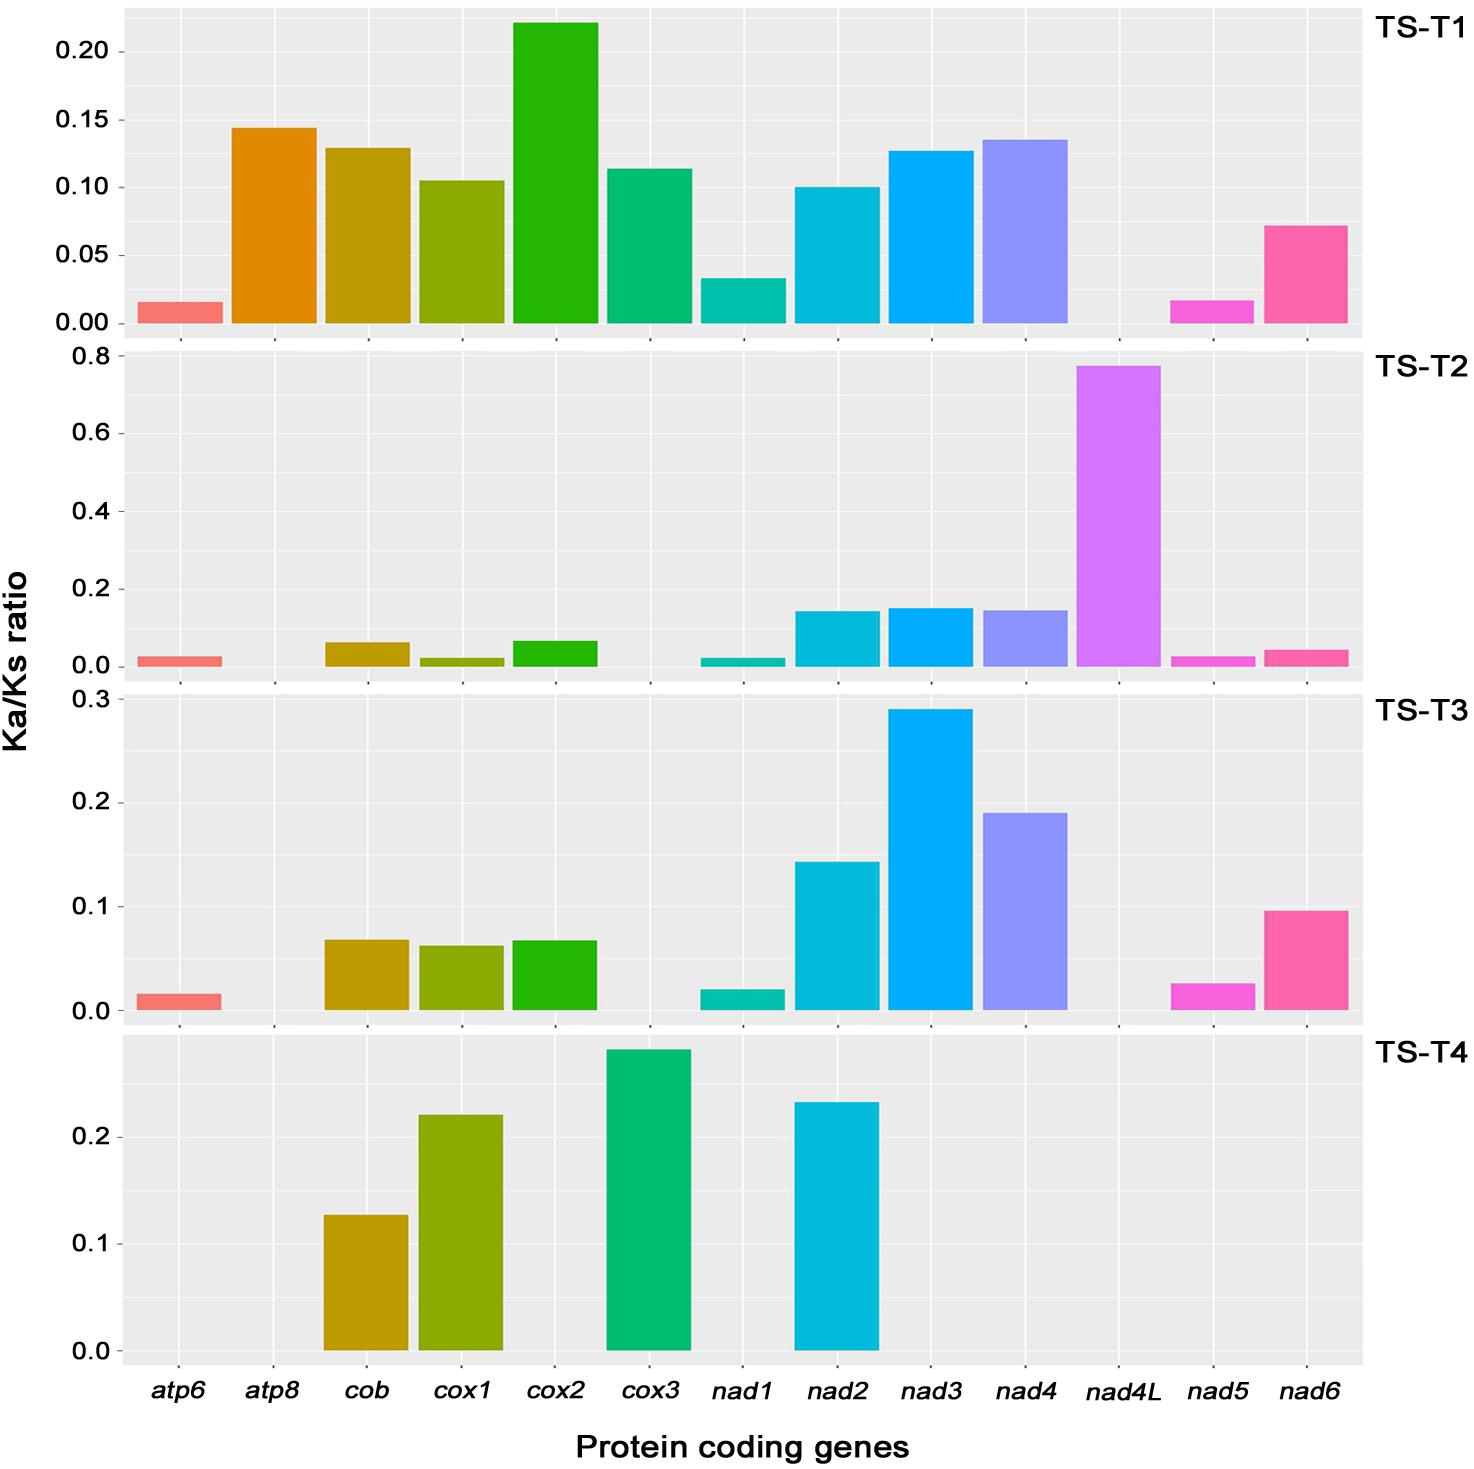
Figure 4. Analysis of Ka/Ks ratios for 13 core genes of the T. atroviride ATCC 26799 mitochondrial genome. Obtained values for Ka/Ks ratios were described in Supplementary Table S6. Ka, nonsynonymous substitution rate; Ks, synonymous substitution rate; TS-T1, pairwise alignment between T. atroviride ATCC 26799 (TS) and T. reesei QM9414 (T1); TS-T2, pairwise alignment between T. atroviride ATCC 26799 (TS) and T. asperellum B05 (T2); TS-T3, pairwise alignment between T. atroviride ATCC 26799 (TS) and T. hamatum (T3); TS-T4, pairwise alignment between T. atroviride ATCC 26799 (TS) and T. gamsii KUC1747 (T4).
In the fungal mitochondrial genomes, introns, capable of self-splicing, are widely known as one of factors leading structural variability of mitochondrial genomes (e.g., variation in gene content, the complexity of gene arrangements, and changes in genome size) (Hurst and Werren, 2001; Haugen et al., 2005; Lang et al., 2007). Introns can be classified into two categories, group I and group II depending on the intron sequences, the conserved secondary-/tertiary structures of intron RNA, and the splicing mechanisms (Lang et al., 2007). On the mitochondrial genome of T. atroviride ATCC 26799, four introns, all belonging to the group I, were predicted. Of these introns, three (all classified in the subtype of IB) were observed in the exon-intron structures of protein-coding genes for apocytochrome b (cob) and cytochrome c oxidases (cox1), and the remaining one (classified in the subtype of IA) was found in the rrnL gene. These introns were also predicted to harbor an internal ORF within the region of intron themselves. The rps3 gene of the T. atroviride ATCC 26799 mitochondrial genome was predicted to be an internal ORF of rrnL-i (intron that was fully embedded within the rrnL gene), which is consistent with previous reports describing the intron-encoded rps3 gene in fungal mitochondrial genomes (Lang et al., 2007; Sethuraman et al., 2009; Wai et al., 2019). The 1,497 bp ORF harboring the LAGLIDADG motif for the HE protein (79.31% identity with that of Fusarium graminearum (GenBank accession no. YP_001249321) under a 63% query coverage; E-value = 7e-161) was located in the cob gene, overlapping the coding region and cob-i1 (first intron in the exon-intron structure of the cob gene). A 345 bp ORF sharing a homology with the GIY-YIG motif of the HE protein (65.42% identity with that of F. acuminatum (GenBank accession no. CDL73454) under a 93% query coverage; E-value = 5e-34) was also observed on the L-strand, as an internal ORF of cox1-i (intron positioned in the cox1 gene). These two HE proteins were initiated with the ATA codon. Like the other protein-coding genes, the LAGLIDADG-type HE protein was terminated with a TAA codon, but the GIY-YIG-type HE protein had a TAG stop codon. Lastly, of the four introns, cob-i2 (second intron in the exon-intron structure of the cob gene) did not have an internal ORF (Tables 1, 3 and Figure 5A).
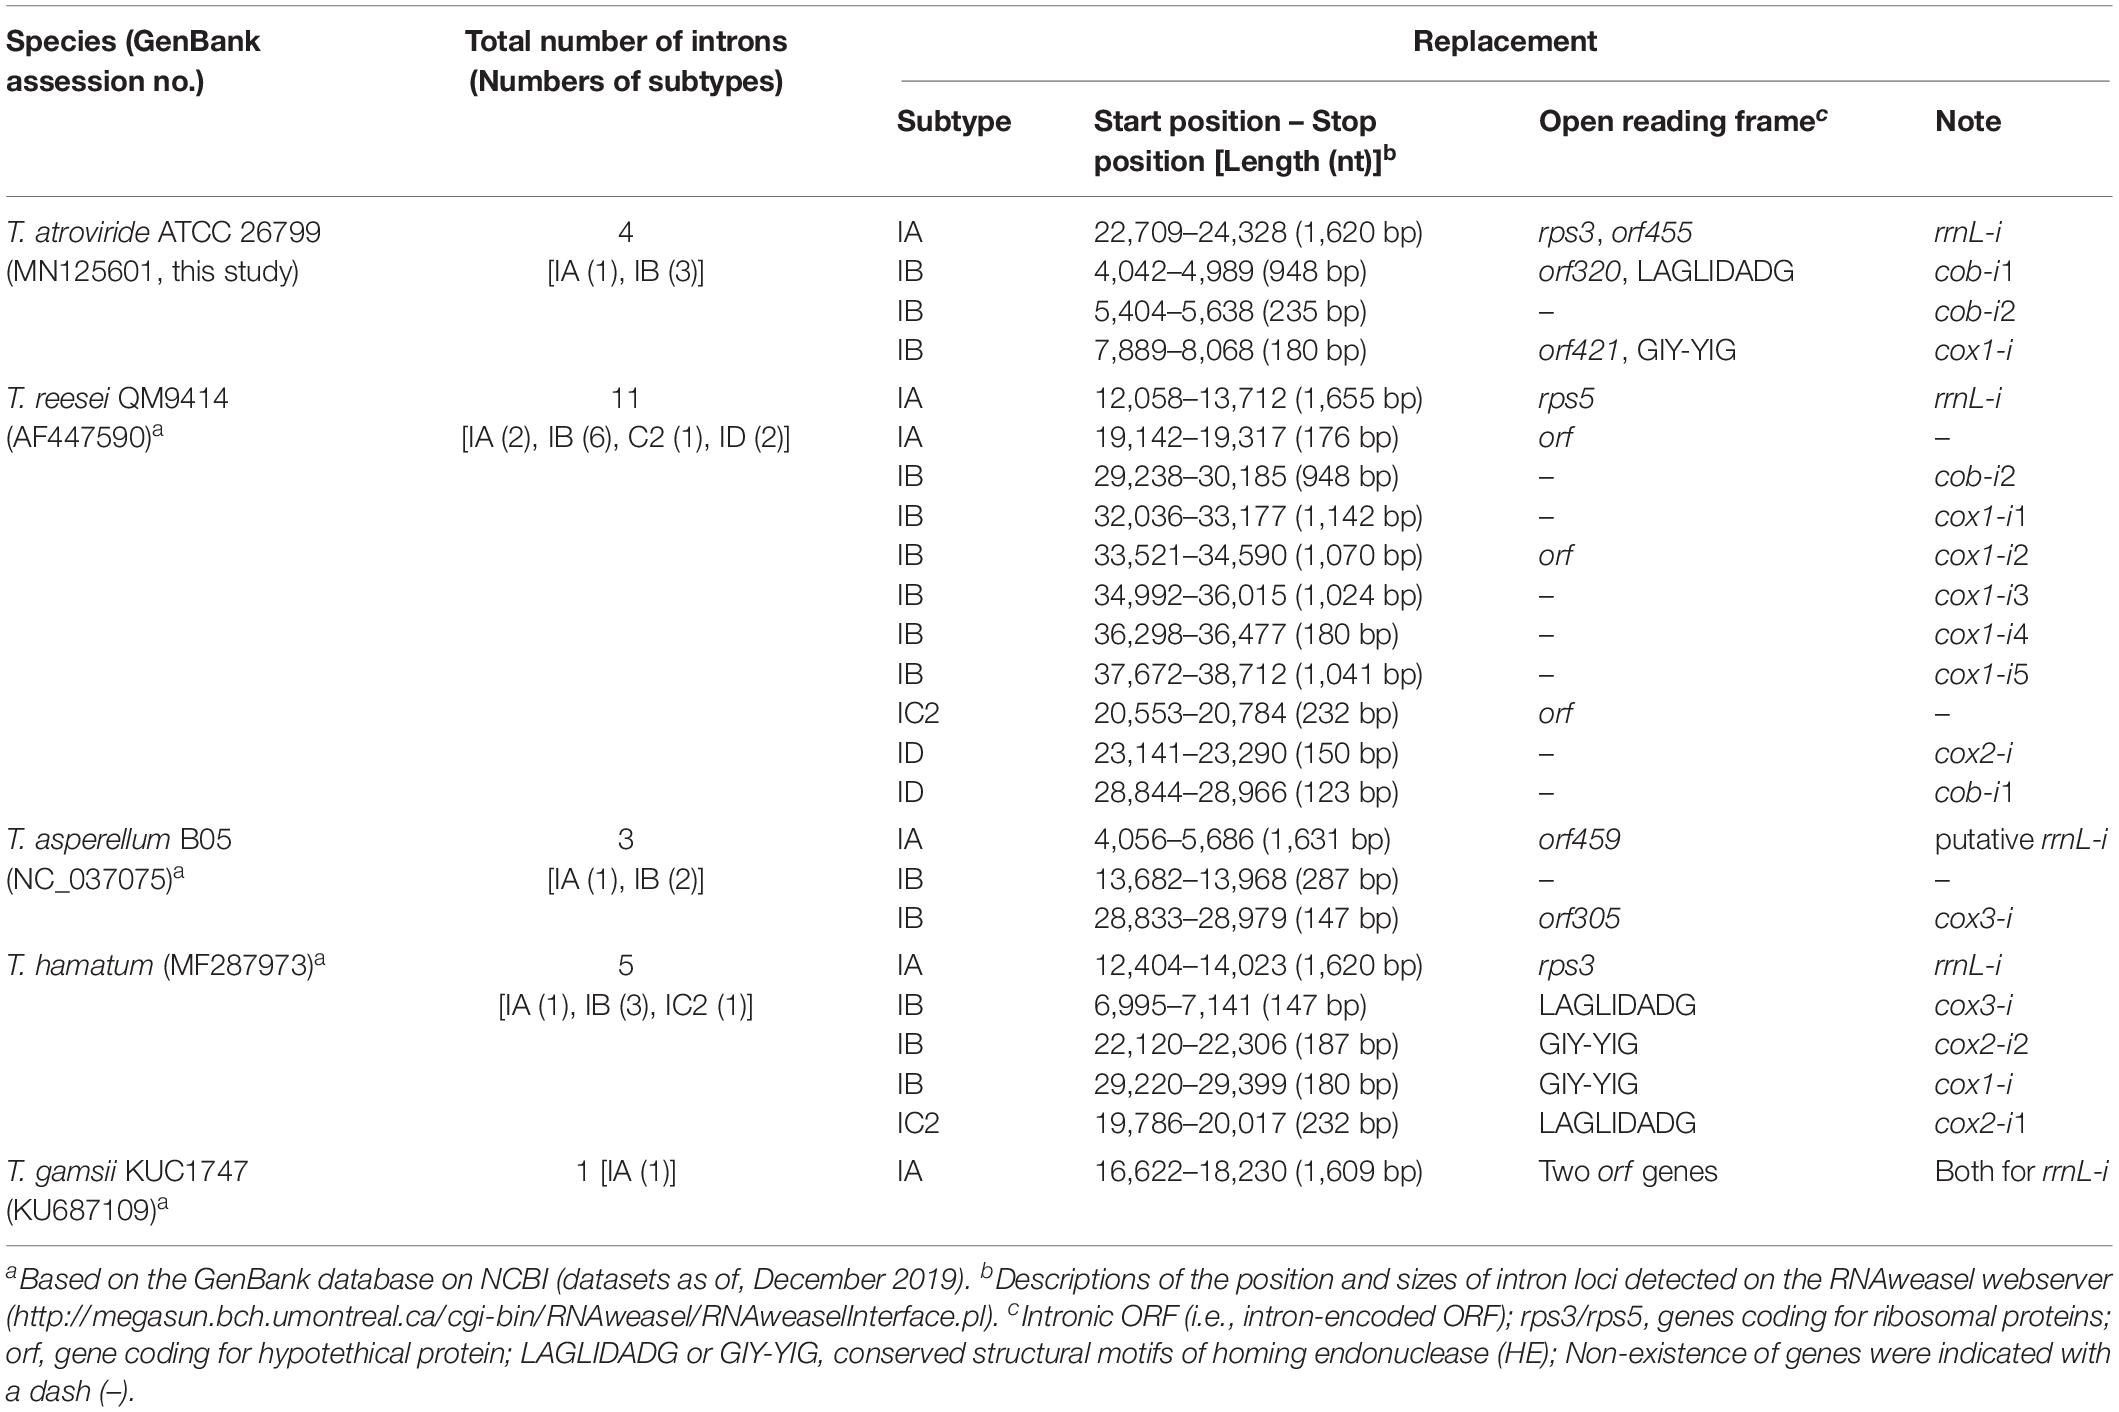
Table 3. Detected group I intron loci on the mitochondrial genomes of Trichoderma species.
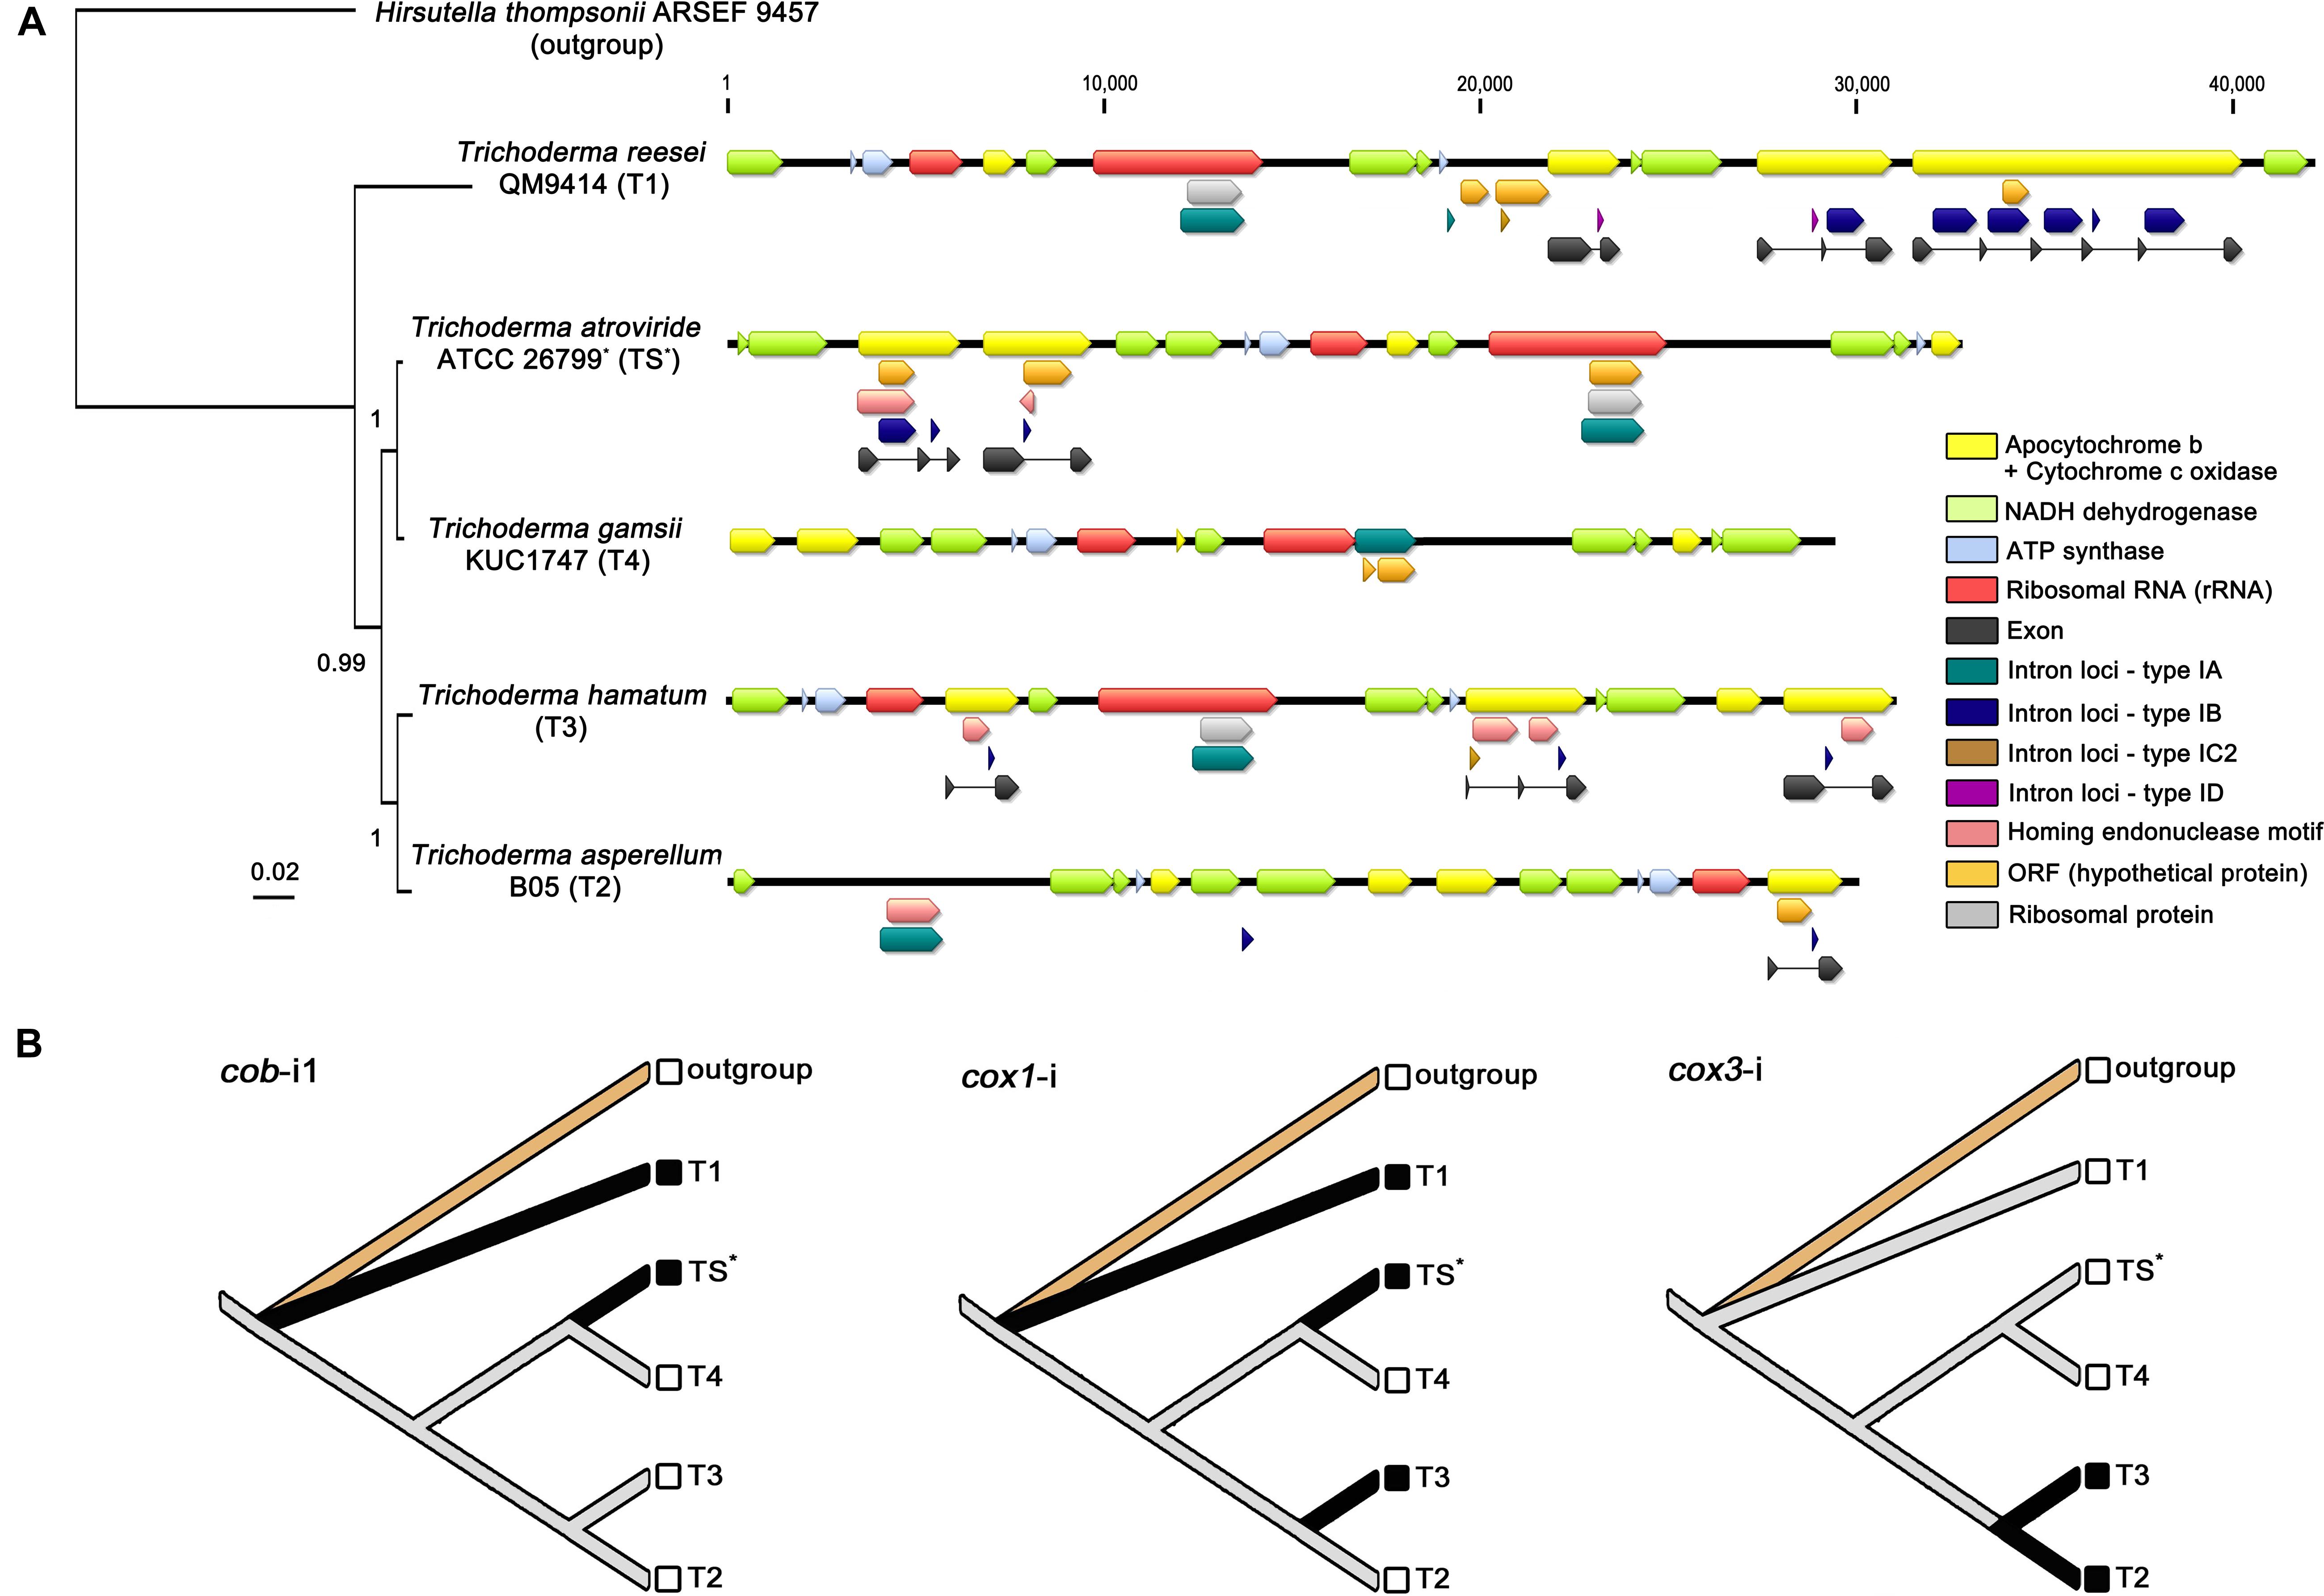
Figure 5. Comparative analysis of Trichoderma mitochondrial introns. (A) All detected intron loci (described in Table 3) were displayed on the mitochondrial genomes with a BI based topology constructed using concatenated exon nucleotide sequences of 13 core genes (atp6, atp8, cob, cox1, cox2, cox3, nad1, nad2, nad3, nad4, nad4L, nad5, and nad6). All gene components were indicated with different color blocks. (B) Inference of gain/loss events of Trichoderma mitochondrial introns. Reconstructed ancestral states for introns were presented with species names designated as, outgroup for Hirsutella thompsonii ARSEF 9457 (Ophiocordycipitaceae), TS for T. atroviride ATCC 26799 (with an asterisk), T1 for T. reesei QM9414, T2 for T. asperellum B05, T3 for T. hamatum, and T4 for T. gamsii KUC1747. Solid black lines indicate the presence of a given intron character in corresponding species.
A total number of 24 intron loci was detected in all five Trichoderma mitochondrial genomes, 11 of which were found in the T. reesei QM9414, whereas only one of the intron locus was presented in the T. gamsii KUC1747 (Table 3). Most of intron sites were detected in the exon-intron structures of protein-coding genes for apocytochrome b (cob) and cytochrome c oxidases (cox1, cox2, and cox3), but not in the core genes for ATP synthases (atp6, atp8, and atp9) and NADH dehydrogenases (nad1, nad2, nad3, nad4, nad4L, nad5, and nad6). A group IA-type intron (i.e., an intron classified as the subtype IA) was observed within the region of the rrnL gene in every Trichoderma species except T. asperellum B05 (in this study, the possibility of the rrnL gene being present in the T. asperellum B05 mitochondrial genome was excluded because this gene has not been reported in the mitochondrial genome of this species). This broad existence of rrnL-i may indicate that it was present in the ancestor of the genus Trichoderma but, at the same time, the various intronic ORFs detected within the rrnL-i (e.g., rps3, rps5, and orf genes without predicted functions) suggest there has been a divergence in rrnL-i among the Trichoderma species. Interestingly, unlike the other Trichoderma species, the mitochondrial genome of T. atroviride ATCC 26799 was found to have multiple intronic ORFs in the intron region, with the group IA-type rrnL-i harboring two intronic ORFs (rps3 and orf455), the group IB-type cob-i1 with both orf320 and ORF for the LAGLIDADG-type HE protein, and the group IB-type cox1-i harboring orf421 and ORF for the GIY-YIG-type HE protein. In the mitochondrial genome of T. atroviride ATCC 26799, both cox2 and cox 3 were identified as intronless genes (Table 3 and Figure 5A).
To estimate the evolution of mitochondrial introns, a phylogenetic tree using the concatenated exon nucleotide sequences of 13 core genes (atp6, atp8, cob, cox1, cox2, cox3, nad1, nad2, nad3, nad4, nad4L, nad5, and nad6; the atp9 gene was excluded because it was absent from the mitochondrial genome of T. gamsii KUC1747) was constructed with the outgroup Hirsutella thompsonii ARSEF 9457 (Hypocreales, Ophiocordycipitaceae). In the obtained exon phylogeny, a clustering of all five Trichoderma species was supported with high confidences (BPP ≥ 0.99, with an average standard deviation for split frequencies of <0.01) (Figure 5A), this BI based topology followed the same pattern as those shown in the phylogeny of Hypocreales using concatenated full nucleotide sequences (including all of the exon-intron structures) of the 13 core genes (Supplementary Figure S2). This result suggests that the observed introns of mitochondrial core genes may share a common evolutionary history with the core protein-coding genes in these five Trichoderma species.
Several gain/loss events for the introns were also traced using a reconstruction of the ancestral states of the introns. For instance, cob-i1 (i.e., meaning as a homologous intron of the cob-i1 in T. atroviride ATCC 26799) seems to have been gained twice and lost at least once, whereas cox1-i (i.e., meaning as an orthologous intron of the cox1-i in T. atroviride ATCC 26799) is thought to have been gained at least three times and lost once in Trichoderma species. Interestingly, cox3-i (i.e., meaning as an orthologous intron of the cox3-i in T. hamatum) seems to have experienced only with the gain event once (Figure 5B).
The four Trichoderma species that split from a common ancestor node of T. reesei QM9414 were shown to have fewer introns than T. reesei QM9414. These introns were also observed to be short, and some did not have an intronic ORF in the region of the intron (Figure 5A). These changes in the introns may be an indication of the ongoing degeneration of these introns in Trichoderma species. Finally, as shown in the sequence similarity for LAGLIDADG-/GIY-YIG-type HE proteins between T. atroviride ATCC 26799 and Fusarium species (Hypocreales, Nectriaceae), the rps3 gene of the T. atroviride ATCC 26799 mitochondrial genome had a high sequence identity of 96.61% with that of T. hamatum (under a 94% query coverage; E-value = 0.0). These results also support the horizontal transfer of introns between the inter- and intraspecific diversity of fungi.
The mitochondrial ribosomal protein S3, which contributes to the assembly of the mitochondrial small ribosomal subunit and commonly assumed to be one of ancient genes related to the evolution of mitochondrial genomes in eukaryotes (Korovesi et al., 2018), has been known as the only ribosomal protein encoded by fungal mitochondrial genomes (Bullerwell et al., 2000). The rps3 gene that codes for ribosomal protein S3 is usually reported to be a free-standing gene or an internal ORF of group I intron positioned within the rrnL gene coding for large subunit ribosomal RNA (Sethuraman et al., 2009; Chan and Lowe, 2019; Wai et al., 2019). In the mitochondrial genome of T. atroviride ATCC 26799, the rps3 gene was predicted to be 1,389 bp (21 bp larger than orf455) with an ATT initiation codon and was observed in the rrnL-i. When compared with average lengths of ribosomal protein S3 in Hypocreales species, which has previously been reported to be 376–514 amino acids long (Korovesi et al., 2018), this protein was found to fall in the middle of this range in the mitochondrial genome of T. atroviride ATCC 26799, with a length of 463 amino acids (Figure 1 and Table 1).
In the mitochondrial genome of T. atroviride ATCC 26799, some trn genes (trnYTyr, trnSSer, and trnLLeu) were found to display an extra variable arm (V-arm) (Supplementary Figure S1). The V-arm in the tRNA secondary structure is known to be specific to tRNALeu, tRNASer, and bacterial-/eukaryotic organellar tRNATyr (Fujishima and Kanai, 2014; Hamashima et al., 2016). All of the trn genes predicted to harbor a V-arm structure on the T. atroviride ATCC 26799 mitochondrial genome were consistent with these previous reports. Interestingly, a putative trnVVal gene, which overlapped completely with the 3′ end region of the nad6 gene, was predicted in the mitochondrial genome. As with T. atroviride ATCC 26799, a trn gene fully integrated into the protein-coding genes has also been observed in other Trichoderma species. The trnVVal gene, which entirely overlapped with the 3′ end region of the nad6 gene, was identically found in the mitochondrial genomes of T. reesei QM9414, T. asperellum B05, T. hamatum, and T. gamsii KUC1747. In addition, the mitochondrial genome of T. reesei QM9414 was found to harbor one, the tRNAMet gene completely integrated within the 5′ end coding region of the nad2 gene (Supplementary Table S7). In terms of tRNA genes that fully and/or partially overlap with protein-coding genes in the mitochondrial genomes, several studies of metazoan-/nematode mitochondrial genomes have suggested that it allows 1) avoiding the loss of tRNA genes when small genome size is selected, and/or 2) for keeping gene functions by the co-evolution of the two overlapping genes in compacted mitochondrial genomes (Fujishima and Kanai, 2014; Hamashima et al., 2016). Although expression mechanisms of tRNAs, that overlapped in functional mRNAs of protein-coding genes, have not yet been fully understood (Doublet et al., 2015), nevertheless, all these putative trn genes predicted in the protein-coding genes (trnVVal and tRNAMet) seem to strongly support a complex correlation between tRNAs distributions and dynamic evolutions of mitochondrial genomes in Trichoderma.
A number of previous studies on the phylogenetic relationships of Sordariomycetes mitochondrial genomes have already shown that the phylogenetic replacements of Hypocreaceae varies in terms of clustering with related species. For example, in the study of the mitochondrial genome of the nematophagous fungus Pochonia chlamydosporia (Hypocreales, Sordariomycetes), Hypocreaceae was grouped as [(Hypocreaceae + Nectriaceae: BS = 92) + Clavicipitaceae: BS = 93] in ML analysis (Lin et al., 2015) while, in a study of the mitochondrial genome of the medicinal fungus Ophiocordyceps sinensis (Hypocreales, Sordariomycetes), a ML based tree was constructed with [(Hypocreaceae + Clavicipitaceae: BS = 77) + Cordycipitaceae: BS = 68] (Li et al., 2015). Similarly, in a study of the mitochondrial genome for Hypomyces aurantius (Hypocreales, Sordariomycetes), Hypocreaceae was clustered as [(Hypocreaceae + Clavicipitaceae: BS = 40) + Cordycipitaceae: BS = 52] in ML analysis (Deng et al., 2016). Meanwhile, as clustered in the Cordycipitaceae clade on the ML- and BI tree (Figure 2 and Supplementary Figure S2), a study of the mitochondrial genome for the endophytic fungus Pestalotiopsis fici (Xylariales, Sordariomycetes) showed a ML based phylogenetic tree in which some of the internal nodes could not be fully supported (BS = 59–72), though they were well supported in a BI tree (BPP = 1.00) (Zhang et al., 2017). Although differences in the analysis conditions (e.g., variations in the concatenated sequences and differences between the tree algorithms) need to be considered when comparing these previous studies, it is clear that informative datasets of the mitochondrial genomes from closely related family species are still necessary to improve the resolution of the Hypocreales phylogeny. From this perspective, the phylogenetic results obtained for the T. atroviride ATCC 26799 mitochondrial genome in the present study can be used to clarify the evolutionary relationships of the Hypocreaceae mitochondrial genomes with related Hypocreales species in Sordariomycetes.
To trace the gain/loss events for the introns, the ancestral states of these introns were reconstructed using the homologous introns of the Trichoderma mitochondrial genomes (Figure 5B). When the introns were compared in BLAST searches (E-values < 10–10), cob-i1 in T. atroviride ATCC 26799 was similar to cob-i2 in T. reesei QM9414 (88.73% identity under a 99% query coverage; E-value = 0.0), furthermore, cox3-i (intron positioned in the cox3 gene) in T. asperellum B05 was similar to that of T. hamatum (97.12% identity under a 99% query coverage; E-value = 0.0). Although the cox1 gene in T. reesei QM9414 was disrupted by five introns (all belonging to the same subtype IB), interestingly, only one cox1-i4 (fourth intron positioned in the cox1 gene) exhibited a sequence similarity with cox1-i in T. atroviride ATCC 26799 (93.67% identity under a 96% query coverage; E-value = 0.0). None of the cox2-i introns (intron positioned in the cox2 gene) had any similarities between them. The unique features of the introns, such as multiple intron sites in the same gene locus (e.g., five cox1-i in T. reesei QM9414) and/or the co-existences of different types of introns within a single coding gene (e.g., cob gene in T. reesei QM9414 harboring both subtype-IB and ID; cox2 gene in T. hamatum harboring both subtype-IB and IC2), should be studied further to supprot the evolutionary history of Trichoderma mitochondrial introns fully reflecting intron dynamics. Nevertheless, the greatest significance of the results for the introns obtained in this study is that this represents the first comparative analysis of Trichoderma mitochondrial introns from an evolutionary perspective.
Recently, a time-scaled phylogenetic analysis was conducted to prove the genomic evolution of Trichoderma species using 638 core orthologous proteins from Hypocreales nuclear genomes. It showed that Trichoderma had diversified into three phylogenetically distant subclades ≈67 Mya. On the generated Bayesian chronogram, T. harzianum and T. reesei were clustered separately as different subclades, whereas T. asperellum, T. hamatum, T. gamsii and T. atroviride were clustered together in the same clade (Kubicek et al., 2019). This chronogram is not congruent completely with the Trichoderma phylogeny generated using the mitochondrial genomes. Unlike the position of T. asperellum as a basal group within the subclade of chronogram, a sister relationship between T. asperellum and T. hamatum was predicted in the present study (Figures 2, 5 and Supplementary Figure S2). This conflict seems to be associated with mitochondria evolutions, which has occurred independently of the nuclear genomes.
Since the genome sequence of T. reesei QM6a (GenBank accession no. AAIL00000000) was first reported (Martinez et al., 2008), researches involving the whole-genome sequencing of Trichoderma species have been increased to understand the biological mechanisms and evolutionary relationships of Trichoderma species. However, these studies have focused on the nuclear genomes (Kubicek et al., 2011, 2019; Mukherjee et al., 2013; Druzhinina et al., 2018). Among T. harzianum species, a 2.6 kb circular plasmid referred to as pThr1 containing only one CDS (designated as a putative reverse transcriptase) has been reported for the T. harzianum strain T95 (Antal et al., 2002). However, when compared with all five Trichoderma complete mitochondrial genomes (using BLAST searches: E-values < 10–10), there was no similarity between the plasmid sequences of pThr1 and these Trichoderma complete mitochondrial genomes, thus, the plasmid pThr1 may have been generated from other putative extraplasmids.
To date, very little information has been available on the whole sequences of Trichoderma mitochondrial genomes, in addition, there has been no attempt to characterize and comparatively analyze these Trichoderma mitochondrial genomes. In the present study, the complete mitochondrial genome of T. atroviride ATCC 26799 was assembled de novo, and its genomic features were characterized for the first time. Besides, it is the first report of comparative analysis of genomic features of Trichoderma mitochondrial genomes and also of tracing the footprints of specific genetic features that are likely to be associated with the evolution of the mitochondrial genomes of Trichoderma species. The results obtained in this study are useful for fully understanding T. atroviride as both a mycoparasite and a degrader of chemical compounds. Furthermore, they also contribute to elucidating the evolutionary processes underlying the Trichoderma mitochondrial genomes, thus offering further insight into the development of more effective fungal biocontrol agents.
The complete de novo mitochondrial genome sequence of T. atroviride ATCC 26799 [=IFO/NBRC 30543; formerly known as T. harzianum (Ban et al., 2010)] has been deposited in GenBank under the accession number MN125601.
YK performed all studies related with this research (designs of the project, performances of experiments, data analysis, and preparation of the manuscript).
This study was supported by NRF (National Research Foundation of Korea) Basic Science Research Program funded by the Government of the Republic of Korea (Ministry of Education) (NRF-2018R1D1A1B07043042).
The authors declare that the research was conducted in the absence of any commercial or financial relationships that could be construed as a potential conflict of interest.
I wish to thank Prof. Won-Chan Kim (Kyungpook National University, Republic of Korea) and Dr. Yiseul Kim (Keimyung University Medical Center, Republic of Korea) for their great help in analytical instruments, and Dr. Tatiana Giraud for her valuable advice on this paper.
The Supplementary Material for this article can be found online at: https://www.frontiersin.org/articles/10.3389/fmicb.2020.00785/full#supplementary-material
Aguileta, G., de Vienne, D. M., Ross, O. N., Hood, M. E., Giraud, T., Petit, E., et al. (2014). High variability of mitochondrial gene order among fungi. Genome. Biol. Evol. 6, 451–465. doi: 10.1093/gbe/evu028
Antal, Z., Manczinger, L., Kredics, L., Kevei, F., and Nagy, E. (2002). Complete DNA sequence and analysis of a mitochondrial plasmid in the mycoparasitic Trichoderma harzianum strain T95. Plasmid 47, 148–152. doi: 10.1006/plas.2001.1559
Baker, R. J., Dickins, B., Wickliffe, J. K., Khan, F. A. A., Gaschak, S., Makova, K. D., et al. (2017). Elevated mitochondrial genome variation after 50 generations of radiation exposure in a wild rodent. Evol. Appl. 10, 784–791. doi: 10.1111/eva.12475
Ban, S., Yamaguchi, K., Okane, I., Nakagiri, A., Tabuchi, Y., Genra, M., et al. (2010). Re-identification of Hypocrea/Trichoderma strains preserved at the NBRC collection. Microbiol. Cult. Coll. 26, 119–124.
Barr, C. M., Neiman, M., and Taylor, D. R. (2005). Inheritance and recombination of mitochondrial genomes in plants, fungi and animals. New Phytol. 168, 39–50. doi: 10.1111/j.1469-8137.2005.01492.x
Basse, C. W. (2010). Mitochondrial inheritance in fungi. Curr. Opin. Microbiol. 13, 712–719. doi: 10.1016/j.mib.2010.09.003
Benson, G. (1999). Tandem repeats finder: a program to analyze DNA sequences. Nucleic Acids Res. 27, 573–580. doi: 10.1093/nar/27.2.573
Bernt, M., Donath, A., Jühling, F., Externbrink, F., Florentz, C., Fritzsch, G., et al. (2013). MITOS: improved de novo metazoan mitochondrial genome annotation. Mol. Phylogenet. Evol. 69, 313–319. doi: 10.1016/j.ympev.2012.08.023
Birky, C. W. (1995). Uniparental inheritance of mitochondrial and chloroplast genes: mechanisms and evolution. Proc. Natl. Acad. Sci. U.S.A. 92, 11331–11338. doi: 10.1073/pnas.92.25.11331
Boratyn, G. M., Camacho, C., Cooper, P. S., Coulouris, G., Fong, A., Ma, N., et al. (2013). BLAST: a more efficient report with usability improvements. Nucleic Acids Res. 41, W29–W33. doi: 10.1093/nar/gkt282
Bullerwell, C. E., Burger, G., and Lang, B. F. (2000). A novel motif for identifying Rps3 homologs in fungal mitochondrial genomes. Trends Biochem. Sci. 25, 363–365. doi: 10.1016/s0968-0004(00)01612-1
Burger, G., Gray, M. W., and Lang, B. F. (2003). Mitochondrial genomes: anything goes. Trends Genet. 19, 709–716. doi: 10.1016/j.tig.2003.10.012
Bushley, K. E., Raja, R., Jaiswal, P., Cumbie, J. S., Nonogaki, M., Boyd, A. E., et al. (2013). The genome of Tolypocladium inflatum: evolution, organization, and expression of the cyclosporin biosynthetic gene cluster. PLoS Genet. 9:e1003496. doi: 10.1371/journal.pgen.1003496
Cavalli-Sforza, L. L., and Edwards, A. W. (1967). Phylogenetic analysis. Models and estimation procedures. Am. J. Hum. Genet. 19, 233–257. PMCID: PMC1706274
Chaisson, M. J., and Tesler, G. (2012). Mapping single molecule sequencing reads using basic local alignment with successive refinement (BLASR): application and theory. BMC Bioinformatics 13:238. doi: 10.1186/1471-2105-13-238
Chambergo, F. S., Bonaccorsi, E. D., Ferreira, A. J., Ramos, A. S., Ferreira Junior, J. R., Abrahao-Neto, J., et al. (2002). Elucidation of the metabolic fate of glucose in the filamentous fungus Trichoderma reesei using expressed sequence tag (EST) analysis and cDNA microarrays. J. Biol. Chem. 277, 13983–13988. doi: 10.1074/jbc.M107651200
Chan, P. P., and Lowe, T. M. (2019). tRNAscan-SE: searching for tRNA genes in genomic sequences. Methods Mol. Biol. 1962, 1–14. doi: 10.1007/978-1-4939-9173-0_1
Chin, C.-S., Alexander, D. H., Marks, P., Klammer, A. A., Drake, J., Heiner, C., et al. (2013). Nonhybrid, finished microbial genome assemblies from long-read SMRT sequencing data. Nat. Methods 10, 563–569. doi: 10.1038/nmeth.2474
Coordinators, N. R. (2018). Database resources of the national Center for biotechnology information. Nucleic Acids Res. 46, D8–D13. doi: 10.1093/nar/gkv1290
Cserjesi, A. J. (1967). The adaptation of fungi to pentachlorophenol and its biodegradation. Can. J. Microbiol. 13, 1243–1249. doi: 10.1139/m67-169
Darling, A. E., Mau, B., and Perna, N. T. (2010). progressiveMauve: multiple genome alignment with gene gain, loss and rearrangement. PLoS ONE 5:e11147. doi: 10.1371/journal.pone.0011147
Darriba, D., Taboada, G. L., Doallo, R., and Posada, D. (2012). jModelTest 2: more models, new heuristics and parallel computing. Nat. Methods. 9:772. doi: 10.1038/nmeth.2109
Deng, Y., Zhang, Q., Ming, R., Lin, L., Lin, X., Lin, Y., et al. (2016). Analysis of the mitochondrial genome in Hypomyces aurantius reveals a novel twintron complex in fungi. Int. J. Mol. Sci. 17, E1049. doi: 10.3390/ijms17071049
Doublet, V., Ubrig, E., Alioua, A., Bouchon, D., Marcadé, I., and Maréchal-Drouard, L. (2015). Large gene overlaps and tRNA processing in the compact mitochondrial genome of the crustacean Armadillidium vulgare. RNA Biol. 12, 1159–1168. doi: 10.1080/15476286.2015.1090078
Druzhinina, I. S., Chenthamara, K., Zhang, J., Atanasova, L., Yang, D., Miao, Y., et al. (2018). Massive lateral transfer of genes encoding plant cell wall-degrading enzymes to the mycoparasitic fungus Trichoderma from its plant-associated hosts. PLoS Genet. 14:e1007322. doi: 10.1371/journal.pgen.1007322
Druzhinina, I. S., Seidl-Seiboth, V., Herrera-Estrella, A., Horwitz, B. A., Kenerley, C. M., Monte, E., et al. (2011). Trichoderma: the genomics of opportunistic success. Nat. Rev. Microbiol. 9, 749–759. doi: 10.1038/nrmicro2637
Druzhinina, I. S., Shelest, E., and Kubicek, C. P. (2012). Novel traits of Trichoderma predicted through the analysis of its secretome. FEMS Microbiol. Lett. 337, 1–9. doi: 10.1111/j.1574-6968.2012.02665.x
Eid, J., Fehr, A., Gray, J., Luong, K., Lyle, J., Otto, G., et al. (2009). Real-time DNA sequencing from single polymerase molecules. Science 323, 133–138. doi: 10.1126/science.1162986
Fujishima, K., and Kanai, A. (2014). tRNA gene diversity in the three domains of life. Front. Genet. 5:142. doi: 10.3389/fgene.2014.00142
Gray, M. W., Burger, G., and Lang, B. F. (1999). Mitochondrial evolution. Science 283, 1476–1481. doi: 10.1126/science.283.5407.1476
Hamashima, K., Tomita, M., and Kanai, A. (2016). Expansion of noncanonical V-arm-containing tRNAs in eukaryotes. Mol. Biol. Evol. 33, 530–540. doi: 10.1093/molbev/msv253
Haugen, P., Simon, D. M., and Bhattacharya, D. (2005). The natural history of group I introns. Trends Genet. 21, 111–119. doi: 10.1016/j.tig.2004.12.007
Hellmuth, M., Wieseke, N., Lechner, M., Lenhof, H.-P., Middendorf, M., and Stadler, P. F. (2015). Phylogenomics with paralogs. Proc. Natl. Acad. Sci. U.S.A. 112, 2058–2063. doi: 10.1073/pnas.1412770112
Highley, T. L., and Ricard, J. (1988). Antagonism of Trichoderma spp. and Gliocladium virens against wood decay fungi. Mater. Org. 23, 157–169.
Hurst, G. D. D., and Werren, J. H. (2001). The role of selfish genetic elements in eukaryotic evolution. Nat. Rev. Genet. 2, 597–606. doi: 10.1038/35084545
Katoh, K., and Standley, D. M. (2013). MAFFT multiple sequence alignment software version 7: improvements in performance and usability. Mol. Biol. Evol. 30, 772–780. doi: 10.1093/molbev/mst010
Korovesi, A. G., Ntertilis, M., and Kouvelis, V. N. (2018). Mt-rps3 is an ancient gene which provides insight into the evolution of fungal mitochondrial genomes. Mol. Phylogenet. Evol. 127, 74–86. doi: 10.1016/j.ympev.2018.04.037
Krumsiek, J., Arnold, R., and Rattei, T. (2007). Gepard: a rapid and sensitive tool for creating dotplots on genome scale. Bioinformatics 23, 1026–1028. doi: 10.1093/bioinformatics/btm039
Krzywinski, M. I., Schein, J. E., Birol, I., Connors, J., Gascoyne, R., Horsman, D., et al. (2009). Circos: an information aesthetic for comparative genomics. Genome Res. 19, 1639–1645. doi: 10.1101/gr.092759.109
Kubicek, C. P., Herrera-Estrella, A., Seidl-Seiboth, V., Martinez, D. A., Druzhinina, I. S., Thon, M., et al. (2011). Comparative genome sequence analysis underscores mycoparasitism as the ancestral life style of Trichoderma. Genome Biol. 12:R40. doi: 10.1186/gb-2011-12-4-r40
Kubicek, C. P., Steindorff, A. S., Chenthamara, K., Manganiello, G., Henrissat, B., Zhang, J., et al. (2019). Evolution and comparative genomics of the most common Trichoderma species. BMC Genomics 20:485. doi: 10.1186/s12864-019-5680-7
Kumar, S., Stecher, G., Li, M., Knyaz, C., and Tamura, K. (2018). MEGA X: molecular evolutionary genetics analysis across computing platforms. Mol. Biol. Evol. 35, 1547–1549. doi: 10.1093/molbev/msy096
Lang, B. F., Laforest, M. J., and Burger, G. (2007). Mitochondrial introns: a critical view. Trends Genet. 23, 119–125. doi: 10.1016/j.tig.2007.01.006
Li, Y., Hu, X.-D., Yang, R.-H., Hsiang, T., Wang, K., Liang, D.-Q., et al. (2015). Complete mitochondrial genome of the medicinal fungus Ophiocordyceps sinensis. Sci. Rep. 5, 13892–13892. doi: 10.1038/srep13892
Lin, R., Liu, C., Shen, B., Bai, M., Ling, J., Chen, G., et al. (2015). Analysis of the complete mitochondrial genome of Pochonia chlamydosporia suggests a close relationship to the invertebrate-pathogenic fungi in Hypocreales. BMC Microbiol. 15:5. doi: 10.1186/s12866-015-0341-8
Liu, W., Cai, Y., Zhang, Q., Chen, L., Shu, F., Ma, X., et al. (2020). The mitochondrial genome of Morchella importuna (272.2 kb) is the largest among fungi and contains numerous introns, mitochondrial non-conserved open reading frames and repetitive sequences. Int. J. Biol. Macromol. 143, 373–381. doi: 10.1016/j.ijbiomac.2019.12.056
Losada, L., Pakala, S. B., Fedorova, N. D., Joardar, V., Shabalina, S. A., Hostetler, J., et al. (2014). Mobile elements and mitochondrial genome expansion in the soil fungus and potato pathogen Rhizoctonia solani AG-3. FEMS Microbiol. Lett. 352, 165–173. doi: 10.1111/1574-6968.12387
Maddison, W. P., and Maddison, D. R. (2018). Mesquite: A Modular System for Evolutionary Analysis. Version 3.6. Available at: http://www.mesquiteproject.org.
Martinez, D., Berka, R. M., Henrissat, B., Saloheimo, M., Arvas, M., Baker, S. E., et al. (2008). Genome sequencing and analysis of the biomass-degrading fungus Trichoderma reesei (syn. Hypocrea jecorina). Nat. Biotechnol. 26, 553–560. doi: 10.1038/nbt1403
Mosbach, A., Edel, D., Farmer, A. D., Widdison, S., Barchietto, T., Dietrich, R. A., et al. (2017). Anilinopyrimidine resistance in Botrytis cinerea is linked to mitochondrial function. Front. Microbiol. 8:2361. doi: 10.3389/fmicb.2017.02361
Mukherjee, P. K., Horwitz, B. A., Herrera-Estrella, A., Schmoll, M., and Kenerley, C. M. (2013). Trichoderma research in the genome era. Annu. Rev. Phytopathol. 51, 105–129. doi: 10.1146/annurev-phyto-082712-102353
Nascimento, F. F., Reis, M. D., and Yang, Z. (2017). A biologist’s guide to bayesian phylogenetic analysis. Nat. Ecol. Evol. 1, 1446–1454. doi: 10.1038/s41559-017-0280-x
O’Leary, N. A., Wright, M. W., Brister, J. R., Ciufo, S., Haddad, D., McVeigh, R., et al. (2016). Reference sequence (RefSeq) database at NCBI: current status, taxonomic expansion, and functional annotation. Nucleic Acids Res. 44, D733–D745. doi: 10.1093/nar/gkv1189
Perna, N. T., and Kocher, T. D. (1995). Patterns of nucleotide composition at fourfold degenerate sites of animal mitochondrial genomes. J. Mol. Evol. 41, 353–358. doi: 10.1007/BF00186547
R Core Team, (2017). R: A Language and Environment for Statistical Computing. Vienna: R Foundation for Statistical Computing.
Rannala, B., and Yang, Z. (1996). Probability distribution of molecular evolutionary trees: a new method of phylogenetic inference. J. Mol. Evol. 43, 304–311. doi: 10.1007/BF02338839
Rice, P., Longden, I., and Bleasby, A. (2000). EMBOSS: the european molecular biology open software suite. Trends Genet. 16, 276–277. doi: 10.1016/s0168-9525(00)02024-2
Ronquist, F., Teslenko, M., van der Mark, P., Ayres, D. L., Darling, A., Hohna, S., et al. (2012). MrBayes 3.2: efficient Bayesian phylogenetic inference and model choice across a large model space. Syst. Biol. 61, 539–542. doi: 10.1093/sysbio/sys029
Rossman, A. Y., Samuels, G. J., Rogerson, C. T., and Lowen, R. (1999). Genera of Bionectriaceae, Hypocreaceae and Nectriaceae (Hypocreales, Ascomycetes). Baarn: Centraalbureau voor Schimmelcultures (CBS).
Rozas, J., Ferrer-Mata, A., Sanchez-DelBarrio, J. C., Guirao-Rico, S., Librado, P., Ramos-Onsins, S. E., et al. (2017). DnaSP 6: DNA sequence polymorphism analysis of large data sets. Mol. Biol. Evol. 34, 3299–3302. doi: 10.1093/molbev/msx248
Salinas-Giege, T., Giege, R., and Giege, P. (2015). tRNA biology in mitochondria. Int. J. Mol. Sci. 16, 4518–4559. doi: 10.3390/ijms16034518
Sambrook, J. (2001). Molecular Cloning : A Laboratory Manual, 3rd Edn. New York, NY: Cold Spring Harbor Laboratory Press.
Sambrook, J., and Russell, D. W. (2006). Purification of nucleic acids by extraction with Phenol:Chloroform. CSH Protoc. db.rot4455. doi: 10.1101/pdb.prot4455
Saraste, M. (1999). Oxidative phosphorylation at the fin de siecle. Science 283, 1488–1493. doi: 10.1126/science.283.5407.1488
Sayers, E. W., Cavanaugh, M., Clark, K., Ostell, J., Pruitt, K. D., and Karsch-Mizrachi, I. (2019). GenBank. Nucleic Acids Res. 47, D94–D99. doi: 10.1093/nar/gky989
Sethuraman, J., Majer, A., Iranpour, M., and Hausner, G. (2009). Molecular evolution of the mtDNA encoded rps3 gene among filamentous ascomycetes fungi with an emphasis on the Ophiostomatoid fungi. J. Mol. Evol. 69, 372–385. doi: 10.1007/s00239-009-9291-9
Stamatakis, A. (2014). RAxML version 8: a tool for phylogenetic analysis and post-analysis of large phylogenies. Bioinformatics 30, 1312–1313. doi: 10.1093/bioinformatics/btu033
Unseld, M., Marienfeld, J. R., Brandt, P., and Brennicke, A. (1997). The mitochondrial genome of Arabidopsis thaliana contains 57 genes in 366,924 nucleotides. Nat. Genet. 15, 57–61. doi: 10.1038/ng0197-57
Vaidya, G., Lohman, D. J., and Meier, R. (2011). SequenceMatrix: concatenation software for the fast assembly of multi-gene datasets with character set and codon information. Cladistics 27, 171–180. doi: 10.1111/j.1096-0031.2010.00329.x
Valach, M., Burger, G., Gray, M. W., and Lang, B. F. (2014). Widespread occurrence of organelle genome-encoded 5S rRNAs including permuted molecules. Nucleic Acids Res. 42, 13764–13777. doi: 10.1093/nar/gku1266
Wai, A., Shen, C., Carta, A., Dansen, A., Crous, P. W., and Hausner, G. (2019). Intron-encoded ribosomal proteins and N-acetyltransferases within the mitochondrial genomes of fungi: here today, gone tomorrow? Mitochondrial DNA A DNA Mapp Seq Anal. 30, 573–584. doi: 10.1080/24701394.2019.1580272
Waterhouse, R. M., Zdobnov, E. M., and Kriventseva, E. V. (2011). Correlating traits of gene retention, sequence divergence, duplicability and essentiality in vertebrates, arthropods, and fungi. Genome Biol. Evol. 3, 75–86. doi: 10.1093/gbe/evq083
Wibberg, D., Jelonek, L., Rupp, O., Hennig, M., Eikmeyer, F., Goesmann, A., et al. (2013). Establishment and interpretation of the genome sequence of the phytopathogenic fungus Rhizoctonia solani AG1-IB isolate 7/3/14. J. Biotechnol. 167, 142–155. doi: 10.1016/j.jbiotec.2012.12.010
Wu, B., and Hao, W. (2019). Mitochondrial-encoded endonucleases drive recombination of protein-coding genes in yeast. Environ. Microbiol. 21, 4233–4240. doi: 10.1111/1462-2920.14783
Keywords: mitochondrial genome, Trichoderma, hypocreales, genomic features, intron, comparative genomics, evolutionary genomics
Citation: Kwak Y (2020) Complete Mitochondrial Genome of the Fungal Biocontrol Agent Trichoderma atroviride: Genomic Features, Comparative Analysis and Insight Into the Mitochondrial Evolution in Trichoderma. Front. Microbiol. 11:785. doi: 10.3389/fmicb.2020.00785
Received: 01 January 2020; Accepted: 01 April 2020;
Published: 28 April 2020.
Edited by:
John R. Battista, Louisiana State University, United StatesReviewed by:
Christian P. Kubicek, Vienna University of Technology, AustriaCopyright © 2020 Kwak. This is an open-access article distributed under the terms of the Creative Commons Attribution License (CC BY). The use, distribution or reproduction in other forums is permitted, provided the original author(s) and the copyright owner(s) are credited and that the original publication in this journal is cited, in accordance with accepted academic practice. No use, distribution or reproduction is permitted which does not comply with these terms.
*Correspondence: Yunyoung Kwak, eXVuQGtudS5hYy5rcg==
Disclaimer: All claims expressed in this article are solely those of the authors and do not necessarily represent those of their affiliated organizations, or those of the publisher, the editors and the reviewers. Any product that may be evaluated in this article or claim that may be made by its manufacturer is not guaranteed or endorsed by the publisher.
Research integrity at Frontiers
Learn more about the work of our research integrity team to safeguard the quality of each article we publish.