 Guiliang Tan
 Min Hu
 Xueyan Li
 Ziqiang Pan
 Mei Li
 Lin Li
 Maoxun Yang
- 1School of Material Science and Food Engineering, Zhongshan Institute, University of Electronic Science and Technology of China, Zhongshan, China
- 2Guangdong Key Laboratory of Integrated Agro-Environmental Pollution Control and Management, Guangdong Institute of Eco-Environmental Science and Technology, Guangdong Academy of Sciences, Guangzhou, China
- 3National-Regional Joint Engineering Research Center for Soil Pollution Control and Remediation in South China, Guangzhou, China
- 4Zhuhai Da Hengqin Science and Technology Development Co., Ltd., Zhuhai, China
Sufu is a traditional fermented soybean food produced in China. However, the microbial compositions and metabolites of different types of sufu have not been studied in detail. Accordingly, in this study, we evaluated the differences in bacterial communities and metabolites between commercial red sufu (RS) and white sufu (WS). Principal coordinate analysis and the unweighted pair group method with arithmetic means analysis of 16S rRNA genes revealed that the bacterial community structures of RS and WS differed dramatically. At the phylum level, the relative abundances of Firmicutes and Proteobacteria were significantly different between RS and WS (P < 0.01). Moreover, the abundances of Lactococcus and Tetragenococcus genera were significantly different between RS and WS (P < 0.01). Among metabolites, most free amino acids, few of volatile flavor compounds, and some organic acids showed significant differences between RS and WS (P < 0.05). Additionally, correlations between microbiota and metabolites were determined. Aggregated boosted tree analysis showed that formic acid had the highest relative influence (20.27%) on bacterial community diversity (Chao 1), following by arginine (5.38%), propanol (4.57%), oxalic acid (4.46%), and hexanol (4.43%). Moreover, Streptococcaceae and Moraxellaceae had the highest relative influence on the concentration of formic acid (12.84% and 8.75%, respectively). The profiles obtained in this study improve our understanding of the relationships between bacterial flora and metabolites in different types of sufu. These findings may help us interpret the roles of bacterial communities in the flavor and characteristics of sufu.
Introduction
Sufu (also called “oriental cheese”) is a traditional fermented soybean food in China that shares similar shapes, textures, and fermentation mechanisms with cheese (Xie et al., 2018). Sufu is normally consumed as a flavor enhancer and appetizer owing to its characteristic flavor, pleasant taste, and nutrition value in China and other Asia countries (Han et al., 2001b), with an estimated annual production of over 300,000 tons in China (Xia et al., 2014). Based on the strain used as a starter, sufu can be classified into three different types, i.e., mold-fermented sufu (inoculated with Actinomucor, Mucor, or Rhizopus), bacteria-fermented sufu (inoculated with Bacillus or Micrococcus), and naturally inoculated sufu (no artificial addition of microorganisms; Feng et al., 2013; Xie et al., 2018). However, based on differences in color and flavor, sufu is mainly categorized as red sufu (RS) or white sufu (WS) in the product market (Han et al., 2004a; Xie et al., 2018). RS contains red colorant (angkak), whereas WS is free of colorant (Ho et al., 1989; Han et al., 2001b). Interestingly, these two types of sufu contain different contents of metabolites, such as free amino acids (FAAs), organic acids, and volatile flavor compounds (VFCs; Han et al., 2001b, 2004b; Xie et al., 2018, 2019), and show differences in lactic acid bacteria (LAB) compositions (Han et al., 2001a). For example, the levels of FAAs were reported to be higher in WS than in RS. Sufu is produced under open or semi-open conditions via the actions of various microbes, including starter and indigenous microorganisms, which play important roles in flavor generation (Han et al., 2001b; Feng et al., 2013; Huang et al., 2018; Xie et al., 2018). Generally, four steps are involved in sufu manufacture: Firstly, soybeans are washed and soaked in water, and then ground into a slurry. The slurry is diluted, pressed and filtrated to obtain soymilk. Then, the filtrated soymilk is coagulated by the addition of salts and pressed to produce tofu. After that, tofu is inoculated with mould cultures (such as Actinmucor elegans) to prepare pehtze. Subsequently, salting of pehtze with a saturated salt solution, and finally, ripening of sufu by added of a dressing mixture. The dressing mixture of RS mainly consists of salt, angkak (red kojic rice), alcoholic beverage, sugar, and flour or (soybean) paste and some spices. The WS has similar ingredients as RS in the dressing mixture but without angkak (Supplementary Figure S1). Exploration of the relationships between microbial communities and metabolites is crucial for improvement of the quality of sufu (Huang et al., 2018; Xie et al., 2018).
Recently, high-throughput sequencing has been introduced to investigate the diversities and compositions of microbiota; these studies have expanded our knowledge of the bacterial community structure in sufu (Huang et al., 2018; Xie et al., 2018; Liang et al., 2019; Wan et al., 2019; Xu et al., 2020). Bacteria belonging to the genera of Lactococcus, Tetragenococcus, Streptococcus, Enterobacter, Acinetobacter, and Brevibacterium are the predominant microorganisms in sufu; however, their abundances are mostly correlated with chemical characteristics, such as salinity, ethanol content, and angkak composition (Hwan and Chou, 1999; Han et al., 2001a). Moreover, metabolomic approaches, such as gas chromatography (GC), mass spectrometry (MS), high-performance liquid chromatography (HPLC), and proton nuclear magnetic resonance have been applied to determine the metabolite profiles of sufu (Moy and Chou, 2010; Huang et al., 2018; Xie et al., 2018; Fan et al., 2019). However, few systematic studies have evaluated differences in microbial compositions and metabolites between RS and WS, which are the most commonly consumed types of sufu in China.
Accordingly, in this study, we aimed to investigate the diversity and composition of bacterial communities, profiles of metabolites (e.g., amino acids, organic acids, and VFCs), and correlations between bacteria and metabolites in RS and WS. The results will contribute to the improvement of our understanding of the roles of bacteria in the production of flavor substances in different types of sufu and thus facilitate the isolation and screening of indigenous strains for the production of high-quality sufu.
Materials and Methods
Sample Collection
Commercial sufu samples were randomly purchased from different cities in China in November and December 2018 (Supplementary Table S1). All cube samples were collected in 50-mL Corning CentriStar Centrifuge Tubes (Corning CentriStar, NY, United States), immediately transported on ice to the laboratory, and stored at −20°C until DNA extraction and chemical analysis.
Determination of Chemical Characteristics
For pH analysis, 10 g sufu was mixed with 100 mL distilled water, heated to a boil, cooled, and then centrifuged (9000 × g, 10 min). The pH of the supernatant was measured directly with a PB-10 pH meter (Sartorius, Gottingen, Germany). The NaCl content of the samples was determined using the A.O.A.C. Official Method (937.09). The total acidity (TA) and amino acid nitrogen (AAN) contents were analyzed by the titration method using an automatic potentiometric titrator (905-Titrando; Metrohm, Switzerland), as described previously, with some modifications (Chen et al., 2018). Briefly, the supernatants of samples were automatically titrated with 0.01 M NaOH until the final pH of the solution was 8.2, and the amount of titrant was used to determine the acidity of sufu. Then, excess formaldehyde was added to samples for fixing amino acids. The samples were titrated with 0.05 M NaOH until the final pH of the solution was 9.2, and the amount of titrant was used to determine the AAN content of sufu.
Organic acids were analyzed by HPLC, as previously described (Moy and Chou, 2010), with minor modifications. Briefly, an organic acid analysis column (Atlanti T3; 10.0 × 250 mm, 5 μm; Waters Corp., Milford, MA, United States) was used. The chromatographic conditions were as follows: mobile phase, potassium phosphate solution (pH 2.5); flow rate, 1.0 mL/min; detection wavelength, 210 nm; temperature, 30°C; injection volume, 20 μL. Various mixtures of standard solutions containing oxalic acid, tartaric acid, formic acid, pyruvic acid, malic acid, ascorbic acid, lactic acid, acetic acid, citric acid, succinic acid, and propanoic acid (Sigma-Aldrich, St. Louis, MO, United States) were run on the HPLC (model 1200; Agilent Ltd., United States).
Free amino acids in sufu were detected using ultra- HPLC-tandem MS (UPLC-MS/MS; model 1290/6460; Agilent Ltd.). The samples were extracted with distilled water (pH 3.0), and the extracted solutions were purified using hexane. The FAAs were then separated on an ACQUITY UPLC BEH HILIC (2.1 × 100 mm, 1.7 μm; Waters Corp.) using ammonium formate-acetonitrile/ammonium formate-H2O (pH 3.0) as the mobile phase and detected by MS/MS under multiple reaction monitoring modes. The MS measurement was conducted using positive (ESI+) and negative (ESI–) electrospray ionization with an external standard.
VFCs were analyzed as described previously (Xie et al., 2018), with minor modifications. Briefly, sufu samples (3 g) were mixed with 0.5 g NaCl, followed by equilibration with a thermostatic water bath at 55°C for 15 min. Then, the VFCs were extracted with an SPME fiber (PDMS/DVB/CARB; Supelco Co., Bellefonte, PA, United States) at 55°C for 30 min. The oven temperature gradient of GC-MS started at 33°C (2 min), increased at 5°C/min to 70°C, then increased at 10°C/min to 250°C. The settings were as follows: injector temperature of 250°C and run time of 58 min. An Agilent 6890N GC coupled with an Agilent 5975 Mass Selective Detector (Agilent Ltd.) was used for GC-MS analysis. The compounds were identified by comparison with the mass spectral data from the NIST 14 mass spectral database. All analyses described above were carried out in triplicate.
Enumeration of Bacteria
Sufu (25 g) and 225 mL sterilized 0.85% NaCl solution were placed in a sterilized homogenous bag and homogenized using a stomacher for 2 min, yielding a 10–1 dilution. Then, the homogenized sample solution was serially diluted (10-fold) in sterilized 0.85% NaCl solution. The diluted samples were spread on Plate Count Agar (PCA; Beijing Land Bridge Technology Co., Ltd., China) for enumeration of bacteria. The PCA plates were incubated at 37°C in an incubator for 2 day. The numbers of bacteria were calculated as colony-forming units (CFU) per gram sufu.
Community DNA Extraction and 16S rRNA Gene Amplicon Sequencing
The total genomic DNA from sufu samples (0.5 g) was extracted using a Powersoil DNA Isolation Kit (Qiagen, Hilden, Germany) according to the manufacturer’s instructions. The yield and quality of DNA were analyzed electrophoretically on 1% agarose gels. The DNA samples were stored at -70°C until analysis. Triplicate samples of extracted DNA from the same sample were combined for downstream analysis. The V4-V5 region of 16S rRNA gene was amplified using specific primers (515F, 5′-GTGCCAGCMGCCGCGGTAA-3′; 926R, 5′-CCGTCAATTCMTTTRAGT-3′; Baker et al., 2003) with a 12-base barcode in the 5′-end of the reverse primer used for sample multiplexing. Polymerase chain reaction (PCR) was performed in a total reaction volume of 50 μL containing 0.5 μL of each primer, 1 μL template DNA, 23 μL dd-H2O, and 25 μL of 2 × ExTaq PCR Master Mix (Takara Biotechnology, Dalian, China). PCR conditions were as follows: 10 min denaturation at 95°C; 28 cycles of 94°C for 30 s, 55°C for 30 s, and 72°C for 30 s; and a final extension at 72°C for 10 min. Three replicate PCR products per sample were pooled and purified using a QIAquick PCR purification kit (Qiagen). The amplicons were subjected to 2% agarose gel electrophoresis, and quantity was assessed using a Qubit 3.0 Fluorometer (ThermoFisher Scientific, United States). The purified amplicons were mixed at equimolar amounts before being sequenced on an Illumina Hiseq2500 platform using 250 bp pair-end reads at Beijing Novogene, Beijing, China1.
Bioinformatics Analysis of 16S rRNA Gene Amplicon Sequences
Using the default settings in QIIME2 (Caporaso et al., 2010), sequences shorter than 200 bp and low-quality reads (average base quality <25) were removed. In addition, sequences containing more than six ambiguous nucleotides (“N”) were removed. The sequences were then assigned to each sample based on their 12-bp barcode. Sequences from all samples were clustered into operational taxonomic units (OTUs) at 97% sequence similarity using UCLUST v6.1 (Edgar et al., 2011), with an open-reference OTU picking strategy by applying the Greengenes 16S rRNA database as a reference (DeSantis et al., 2006). Representative sequences in each OTU were assigned to taxonomic groups using the RDP classifier (Cole et al., 2006) within an 80% confidence threshold. Chimeric OTUs were identified and removed using UCHIME implemented in QIIME2 (Edgar et al., 2011). A phylogenetic tree was generated from the alignment file using FastTree2 (Price et al., 2010). Finally, to estimate alpha diversity, a random subsampling method for each sequence library was used for microbial community diversity index calculations to control for the effects of library size. Alpha diversity indices (Chao1, Goods coverage, phylogenic diversity [PD], Shannon, and Simpson) were calculated for all samples with 1,000 repetitions using a size of 55,230 sequences per sample. For beta diversity analysis, all samples were also subsampled to 55,230 sequences per sample to remove sample-size effects. Principal coordinate analysis (PCoA) plots and unweighted pair group method with arithmetic means analysis (UPGMA) hierarchical clustering were performed using Bray–Curtis distances in the QIIME2 software package.
Richness, Abundance, and Identity of Taxa Shared Between RS and WS
Core taxa across samples were obtained from the taxa-abundance matrix (OTU table) at the genus taxonomic level, generated by QIIME software. Dominant and rare OTUs in sequence libraries and in core taxa were defined at a threshold of 1% relative abundance (Gobet et al., 2010). Core taxa in sufu were visualized using the Pheatmap package in R (Kolde and Kolde, 2015). For phylogenetic analysis of the core taxa at higher taxonomic resolution than the genus level, representative sequences belonging to the OTUs of each core taxa (genus level) were extracted using QIIME and taxonomically classified after re-alignment with web-based SINA v1.2.11 (Quast et al., 2012). The top 10 closest relatives (minimum 95% pairwise similarity) for each sequence (OTU) were selected, aligned in web-based SINA v1.2.11, combined with the core taxa sequences, and imported into ARB (Ludwig et al., 2004). The average sequence divergence in core taxa assigned to a functional group and in each genus-level core taxon was calculated based on distance matrices in ARB.
Statistical Analysis
Statistical analyses were conducted using SPSS 18.0 Software (SPSS Inc., Chicago, IL, United States). Statistical significance was estimated with two-way analysis of variance followed by the least significant difference test to determine the significance of differences between groups. For physicochemical characteristics, Student’s t-tests were applied to investigate the significance of differences in SPSS 18.0 Software (SPSS Inc., Chicago, IL, United States). Differences were considered to be significant when the P value was less than 0.05. Linear discriminant analysis (LDA) of effect size (LEfSe) was applied to determine the most discriminant taxa among two types of sufu samples (Segata et al., 2011), with a value for the statistical test equal to 0.05 and a logarithmic LDA score threshold of 4.0. In order to accurately predict and explain the relationships between bacterial data and chemical variables in sufu, aggregated boosted tree (ABT) analysis (with 5000 trees used for the boosting, 10-fold crossvalidation, and three-way interactions) was performed to quantitatively evaluate the relative influence of individual chemical factors on the bacterial community diversities using R package “gbm” (De’ath, 2007). The correlations between bacterial composition and physicochemical parameters, including metabolites and environmental factors, were analyzed using a heatmap.
Sequence Accession
The bacterial 16S rRNA gene sequencing data are publicly available in the NCBI Short Read Archive under Bioproject accession number PRJNA601615.
Results and Discussion
Physicochemical Differences Between RS and WS
All sufu samples exhibited a pH range from 5.18 to 6.89 and salt concentration range from 6.92% to 13.31% (Table 1 and Supplementary Table S1). RS and WS samples contained AAN concentrations of 0.59% ± 0.18% and 1.00% ± 0.27%, respectively (Table 1). The bacterial abundances of the 16 sufu samples were enumerated by counting viable cells on PCA. The mean bacterial colony counts were approximately 2.4 × 10⁶ CFU/g for RS and 1.8 × 10⁶ CFU/g for WS (Table 1 and Supplementary Table S1), similar to a previous report (Han et al., 2001a). Differences were significant only for the content of AAN between RS and WS (Table 1).
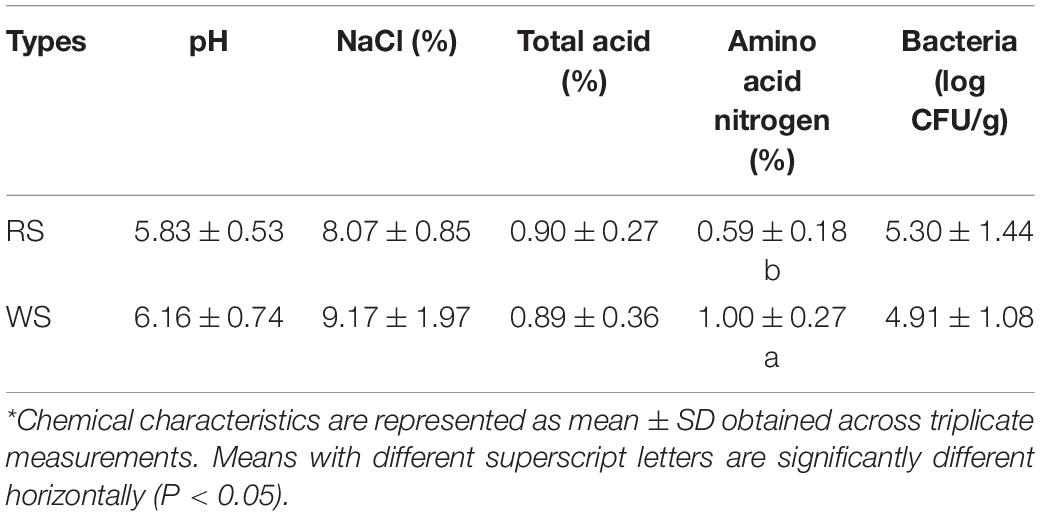
Table 1. Chemical characteristics of sufu samples*.
Next, we evaluated differences in metabolites, including organic acids, FAAs, and VFCs, using chromatography and MS. Lactic acid was the most abundant organic acid, accounting for approximately 1.969 ± 0.300 g/kg in RS and 2.790 ± 0.612 g/kg in WS, followed by acetic acid (average contents of 0.715 ± 0.102 g/kg in RS and 0.855 ± 0.090 g/kg in WS) and citric acid (0.805 ± 0.050 g/kg in RS and 0.679 ± 0.153 g/kg in WS; Supplementary Figure S2). Succinic acid and propionic acid were not detectable in all sufu samples. Lactic acid, acetic acid, and citric acid have previously been reported as the predominated organic acids in sufu (Moy and Chou, 2010). However, there were no significant differences in these high-abundance organic acids between RS and WS in our study. In contrast, less abundant organic acids (e.g., pyruvic acid and malic acid, with contents less than 0.200 g/kg) showed significant differences (P < 0.05) between RS and WS. Moreover, in FAA profiles, leucine (average contents of 5.19 ± 0.62 g/kg in RS and 6.79 ± 1.13 g/kg in WS), alanine (2.53 ± 0.67 g/kg in RS and 6.80 ± 1.08 g/kg in WS), glutamic acid (4.50 ± 1.00 g/kg in RS and 4.14 ± 1.12 g/kg in WS), and lysine (3.30 ± 1.04 g/kg in RS and 3.62 ± 0.51 g/kg in WS) were the predominant amino acid species in RS and WS. The levels of phenylalanine, isoleucine, tyrosine, methionine, valine, threonine, alanine, serine, and histidine differed significantly (P < 0.05) between the two types of sufu (Figure 1A). The total amount of FAAs in WS (average 32.43 ± 3.28 g/kg) was higher than that in RS (average 25.48 ± 2.59 g/kg), consistent with a previous study in which FAA levels were found to be higher in WS (89.5 g/kg dry matter) than in RS (64.4 g/kg dry matter; Han et al., 2004b).
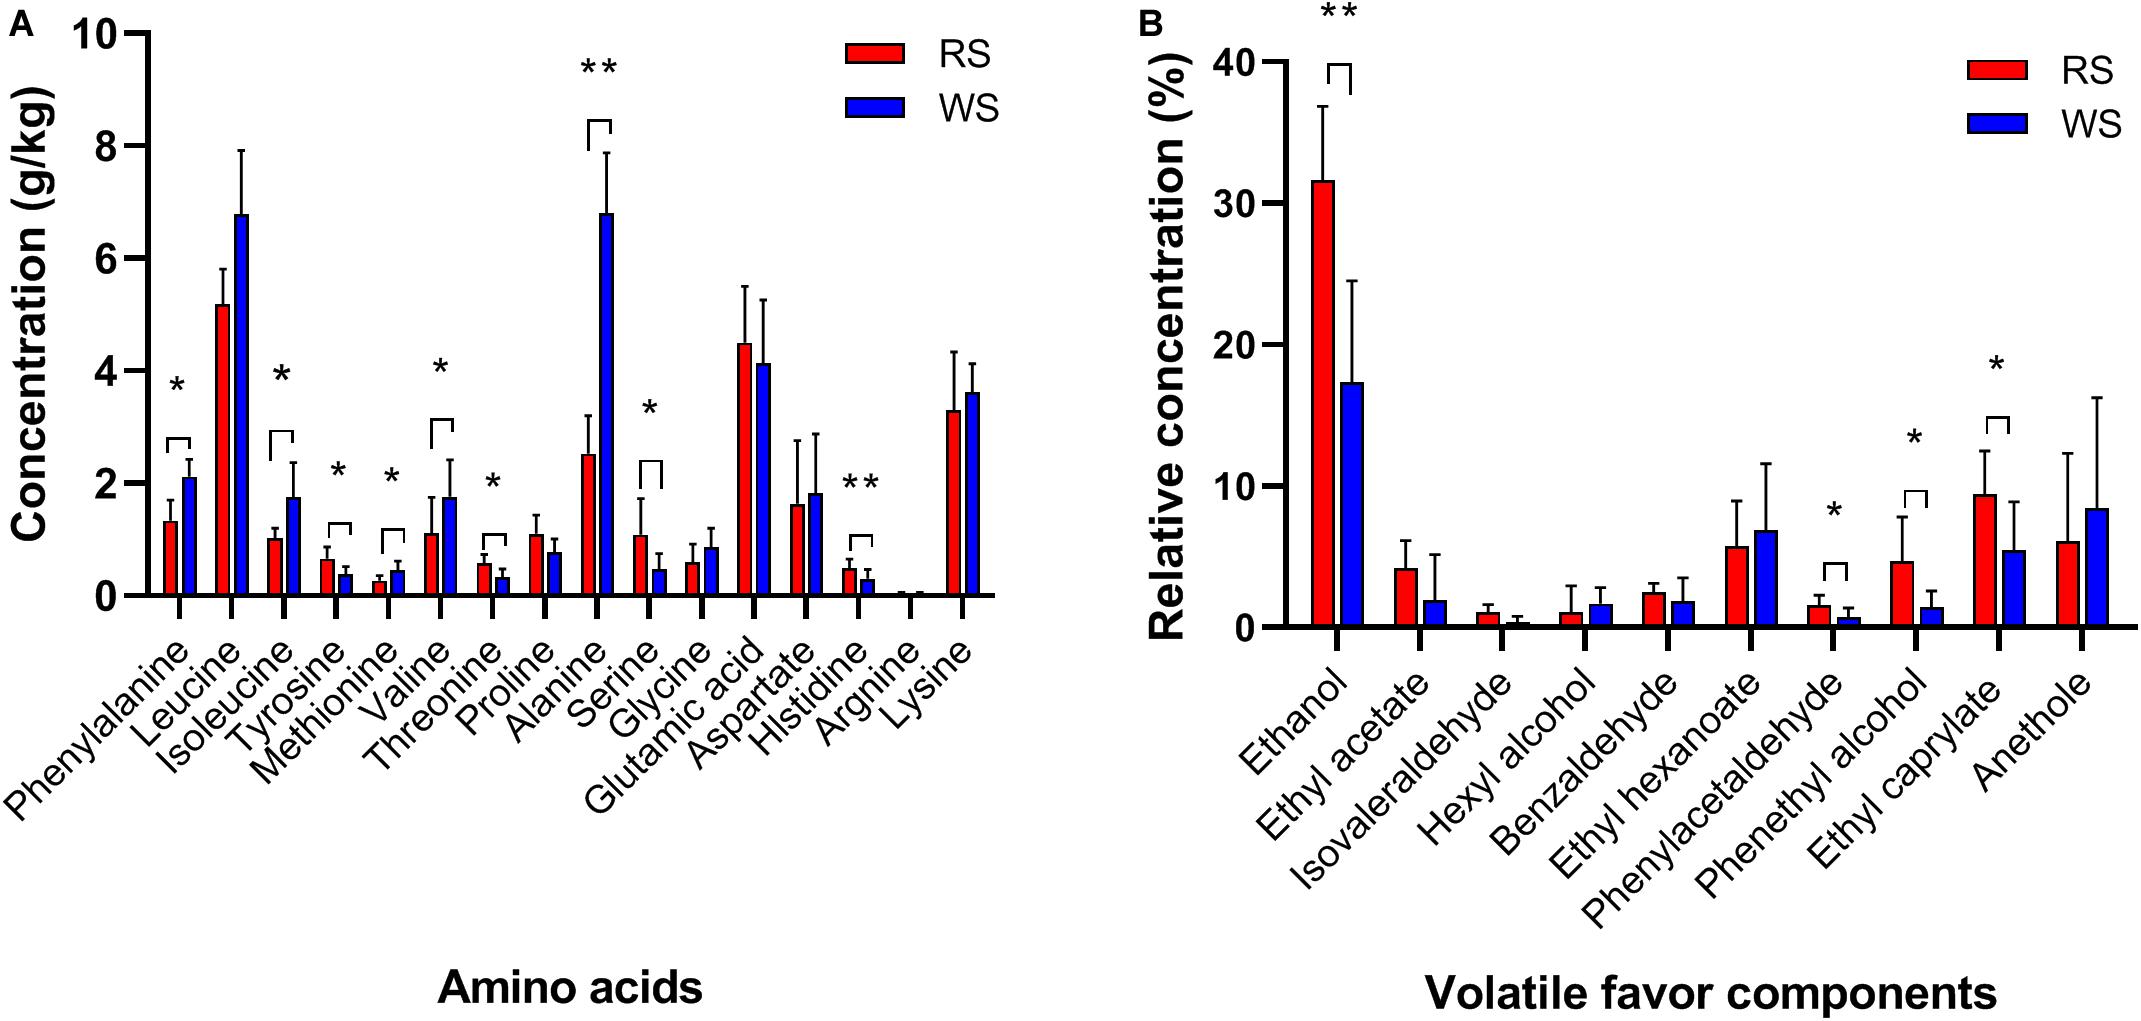
Figure 1. Profiles of amino acids (A) and volatile flavor compounds (B) in sufu samples. Averages ± SEMs of samples in each group are expressed in each column. The significance cutoff for the corrected P values determined using the Benjamini-Hochberg FDR procedure was set at 0.05. * P < 0.05, ** P < 0.01 for the indicated comparisons.
In total, 147 VFCs were identified in RS and WS; these VFCs included 44 esters, 25 alcohols, 13 aldehydes, 14 ketones, two acids, seven phenols, and 42 other unclassified compounds (Supplementary Table S2). The dominant VFCs (with relative concentrations higher than 1%) were ethanol, ethyl acetic acid, isovaleraldehyde, hexyl alcohol, ethyl hexanoate, phenylacetaldehyde, phenylethyl alcohol, ethyl caprylate, and anethole (Figure 1B); ethanol, phenylacetaldehyde, phenethyl alcohol, and ethyl caprylate showed significant differences between RS and WS (P < 0.05; Figure 1B). The sufu were the commercial products collected from markets, that absent of the constitute and concentration of dressing mixture added in the ripening stage of fermentation. The ingredients of dressing mixture vary with social customs, climate, locations and so on. The most common dressing mixture used consists of angkak, alcoholic beverage, salt, sugar, flour (bean paste), and spices (Han et al., 2001b). To supply a special flavor for sufu, kinds of dressing mixtures can be added into the production of sufu, which may impact the VFCs concentration in sufu. However, the influence of dressing mixture on VFCs should be further examined, and also the effect on the microbial community structure should be explored in detail in the future. The highest proportion of ethanol (average 24.49% ± 3.71%) may have resulted from the addition of a dressing mixture during the ripening stage of sufu because this dressing mixture contained large amounts of alcoholic beverage and exhibited high microbial metabolism (Hwan and Chou, 1999; Han et al., 2003). The ethanol in sufu can be originated from the dressing mixture or generated by the ethanol-producing microorganisms. Because sufu samples were purchased from markets, the information of the added dressing mixture was missing in this study. Our results showed that ethanol was the most abundant VFCs in sufu, and its concentration was significantly different between red and WS (Figure 1B). The similarity of the production process of red and WS is convinced, and WS has similar ingredients as RS in the dressing mixture but without angkak (Han et al., 2001b). The sufu is a typical mould-fermented sufu in China. It is manufactured by first cultivating a fungus such as Actinomucor, Mucor, or Rhizopus on the surface of tofu cubes to prepare the pehtze. In a study of characterizing dynamic changes of the fungal and bacterial communities during the production of RS, Cryptococcus and Actinomucor were the most abundant genera at salt-pehtze stage. But after pouring dressing mixture, Monascus and Aspergillus became the main genera during the ripening fermentation stage (Xu et al., 2020). Although Pichia (ethanol-producing yeast) was also the main genera (∼5%) in the stage of ripening (Xu et al., 2020), the main chemical compounds such as ethanol, ethylene glycol, glucose, isopropanol, and mannitol were stable during the ripening fermentation stage (Liu et al., 2018). Therefore, the majority of ethanol in sufu should not be generated by yeast. Based on these results, we speculate the significant difference of ethanol concentration between red and WS came from the of the dressing mixture. In addition to ethanol, ester compounds (e.g., ethyl acetic acid, ethyl hexanoate, and ethyl caprylate) were also predominant in sufu, similar to the results of previous studies (Chung et al., 2005; Xie et al., 2018; Liang et al., 2019). These compounds are characterized by fruit-like and floral aromas, which are formed mainly by the esterification of alcohols and organic acids (Erten et al., 2007), and by the contribution of microbial activity during the fermentation and storage period (Wang et al., 2015b).
Differences in Bacterial Communities Between RS and WS
To determine differences among bacterial communities of the two types of sufu, we analyzed the sequences of bacterial 16S rRNA gene amplicons using high-throughput sequencing technology. After quality control, denoising, and chimera removal, a dataset consisting of 1,540,511 filtered high-quality 16S rRNA gene sequences was generated, and an average of 96,282 sequences was obtained for each individual sample (range: 55,230–145,310; Supplementary Table S3). All sequences were clustered into OTUs at 97% sequence similarity. The number of OTUs per sample ranged from 74 to 188 (Supplementary Table S3). Bacterial 16S rRNA gene sequence numbers were normalized to 55,230 reads before describing the alpha diversity and composition characteristics. Goods’ coverage values, indicating estimates of sampling completeness, were 0.9999095–1.0000000 at a 97% similarity level, suggesting that the sequencing reads obtained in each sample were sufficient to analyze bacterial diversity. The microbial alpha diversity, as measured by Chao1, Shannon, and Simpson indexes, was estimated using the QIIME2 platform. Briefly, the Chao1 indexes were 131.37 ± 39.08 and 152.18 ± 28.33 for RS and WS samples, respectively; the observed OTUs were 130.63 ± 38.41 and 151.50 ± 27.6 for RS and WS samples, respectively; and the PD indices were 6.45 ± 1.09 and 7.31 ± 1.31 for RS and WS samples, respectively. Shannon and Simpson diversity indices were significantly higher in WS than in RS (P = 0.046 and 0.016, respectively; Supplementary Table S3). However, the number of observed OTUs and the values of Chao1, ACE, and PD indexes did not differ significantly between RS and WS samples (Supplementary Table S3).
Principal coordinate analysis and UPGMA hierarchical clustering were calculated after subsampling (55,230 sequences) in order to assesses differences in microbial community structures between RS and WS samples. PCoA and UPGMA revealed that RS samples grouped together in one cluster, whereas WS samples grouped in another cluster, indicating that the bacterial communities were significantly different between RS and WS (Figure 2). These findings could be related to the addition of red colorant (angkak) during the process of RS fermentation (Ho et al., 1989; Han et al., 2001a). Angkak contains antibacterial substances (such as citrinin and angkalactone; Blanc et al., 1995; Jùzlová et al., 1996), which may strongly shape the bacterial community structure, particularly for LAB (Han et al., 2001a). Indeed, previous reports have shown that citrinin from angkak inhibits the growth of Streptococcus, Bacillus, and Pseudomonas (Wong and Bau, 1977). Compared with WS, RS contained much higher amounts of alcohol, esters, and acids (Figure 1B), which may also influence the bacterial communities in sufu.
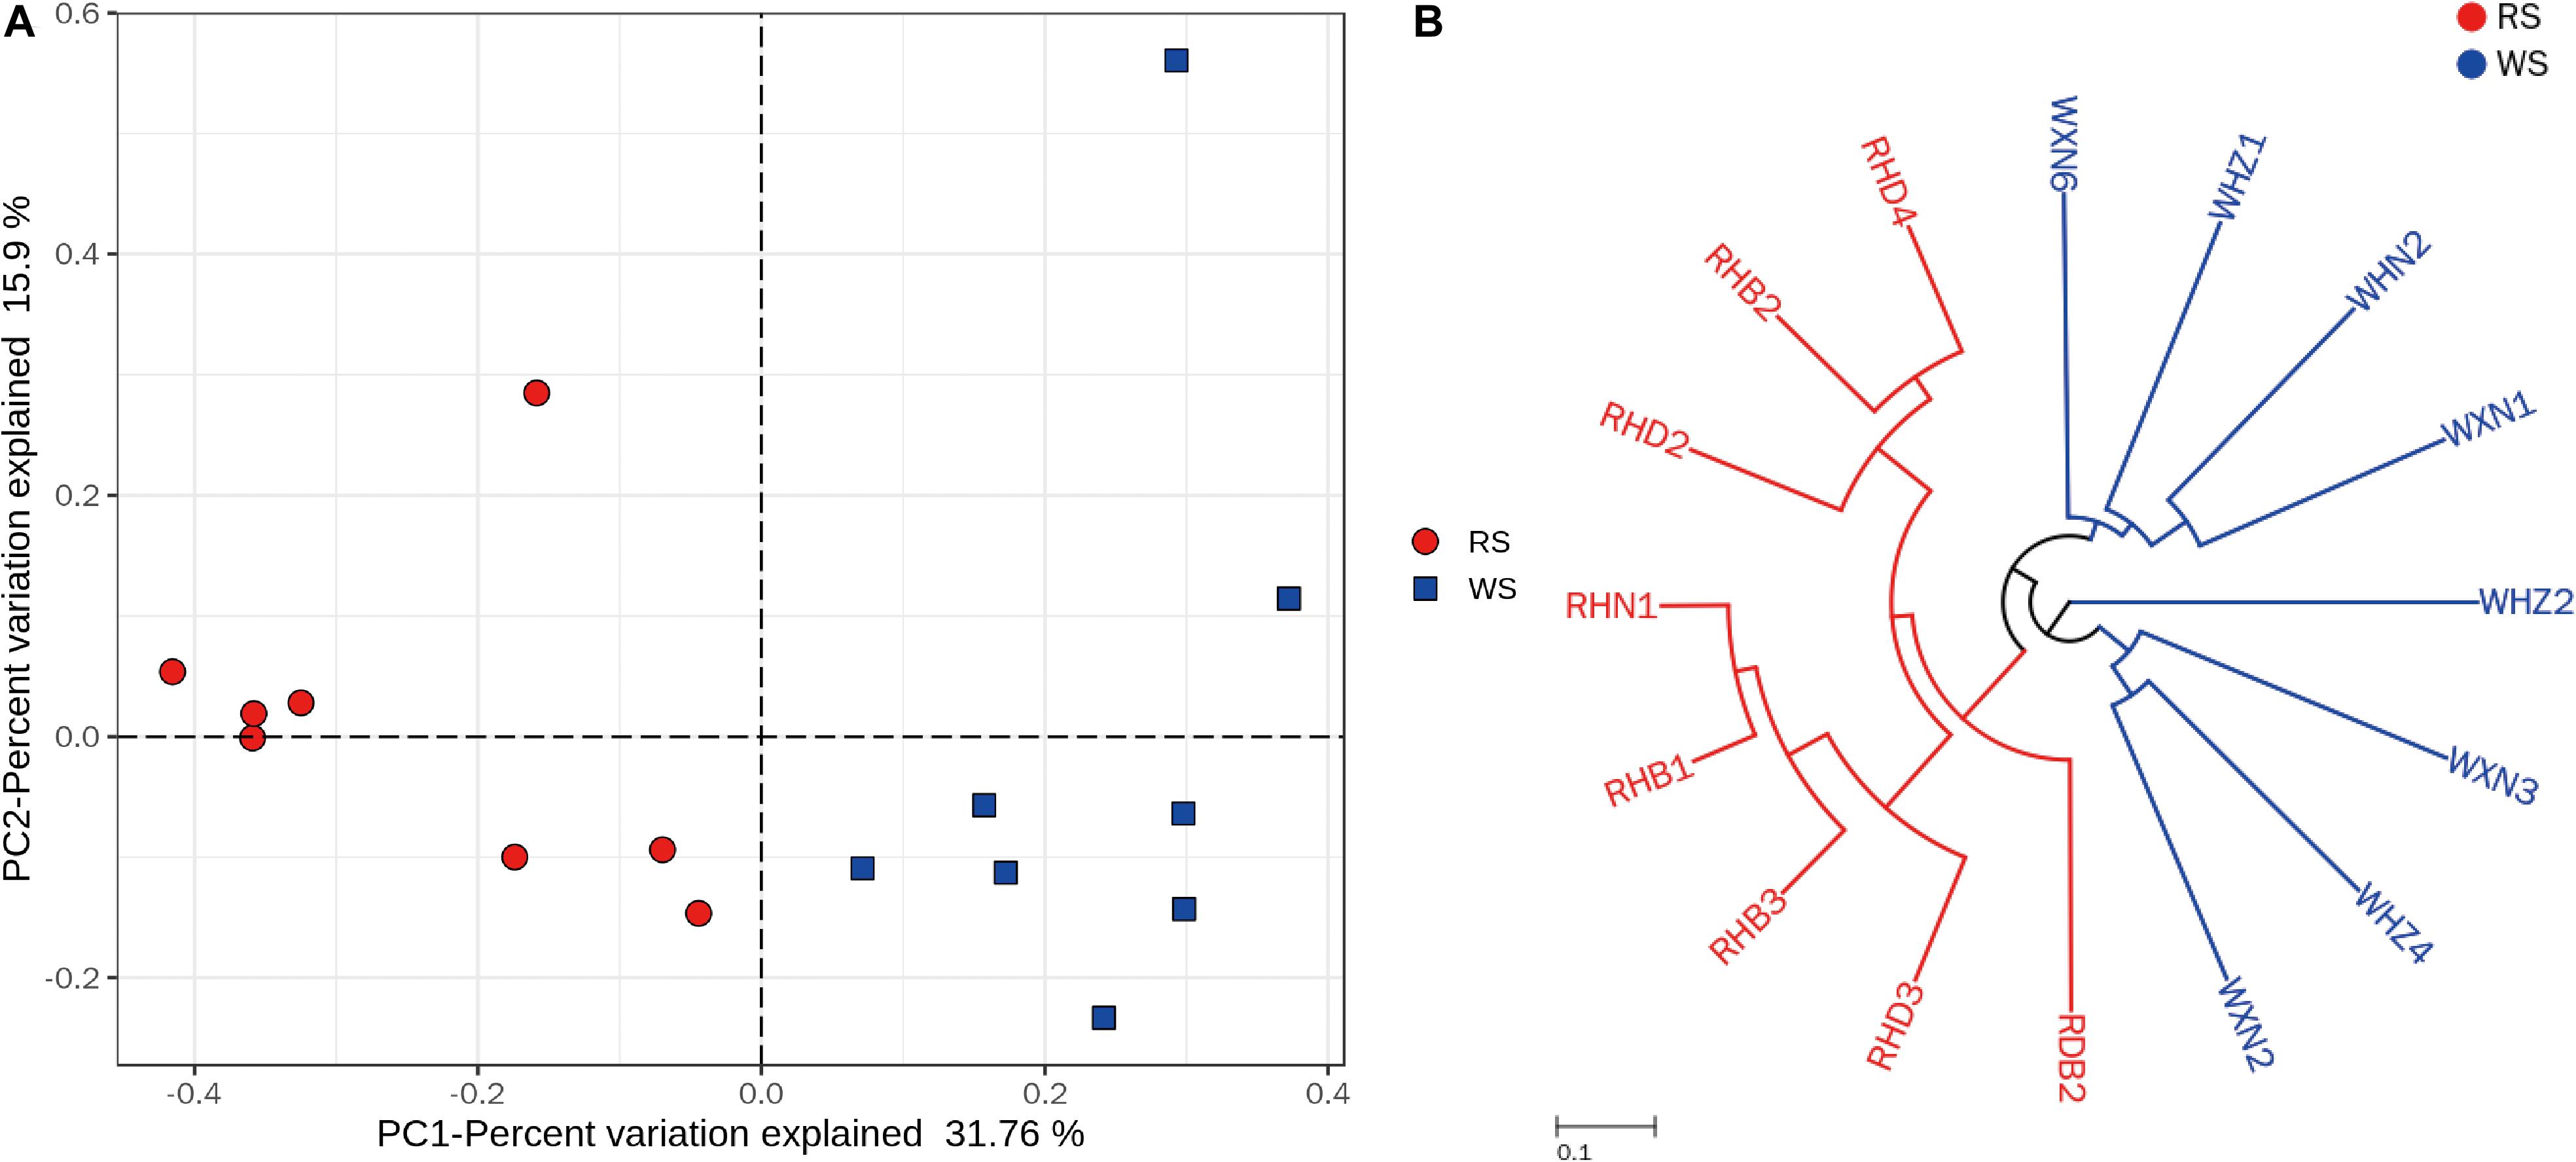
Figure 2. Clustering of the bacterial communities in sufu samples. (A) PCoA of bacterial communities in red (RS) and white (WS) sufu samples, based on Bray–Curtis distances. The percent variation of the plotted principal component is indicated on the axes. (B) UMPGA hierarchical cluster analysis dendrograms based on OTUs of the 16 commercial sufu samples. All 16S rRNA samples were subsampled to 55,230 sequences before Bray–Curtis distance calculation.
To investigate the bacterial community composition of sufu samples, bacterial 16S rRNA gene sequences were classified at both the phylum and genus levels (Figure 3 and Supplementary Figures S3, S4). At the phylum level, the relative abundances of three phyla were higher than 1%. Specifically, Firmicutes (average ± standard error of the mean [SEM]: 69.71% ± 6.51%), Proteobacteria (22.72% ± 5.89%), and Bacteroidetes (6.60% ± 5.13%) were the predominant phyla in RS samples, accounting for 99.03% of the total microbiota. In contrast, in WS samples, the abundances of Proteobacteria (42.18% ± 8.84%), Firmicutes (38.94% ± 9.81%), and Bacteroidetes (17.99% ± 9.30%) differed (Figure 3). RS and WS samples also exhibited different genus-level profiles, with Lactococcus (60.43% ± 7.53%), Acinetobacter (9.62% ± 3.11%) and Tetragenococcus (2.16% ± 0.57%) representing the most abundant genera in RS samples (Figure 3). In contrast, Acinetobacter (10.92% ± 4.24%), Lactococcus (9.31% ± 2.20%), Pseudomonas (9.04% ± 5.88%), Tetragenococcus (8.31% ± 1.78%), Lactobacillus (7.08% ± 3.49%), and Chryseobacterium (5.89% ± 3.54%) were the predominant genera in WS samples (Figure 3). Previous reports have shown that Lactococcus, Acinetobacter, Tetragenococcus, Pseudomonas, and Lactobacillus are the dominant bacteria and crucial contributors during the production of fermented foods, such as cheese, sufu, soy sauce, liquor, tea, and vinegar (Tanaka et al., 2012; Wang et al., 2016; Gu et al., 2018; Huang et al., 2018; Li et al., 2019; Liang et al., 2019; Liu and Qiao, 2019). At the phylum level, the relative abundances of Firmicutes and Proteobacteria were significantly different between these two types of sufu samples (P < 0.01; Figure 3). Moreover, Lactococcus and Tetragenococcus showed significantly different abundances between RS and WS samples (P < 0.01; Figure 3).
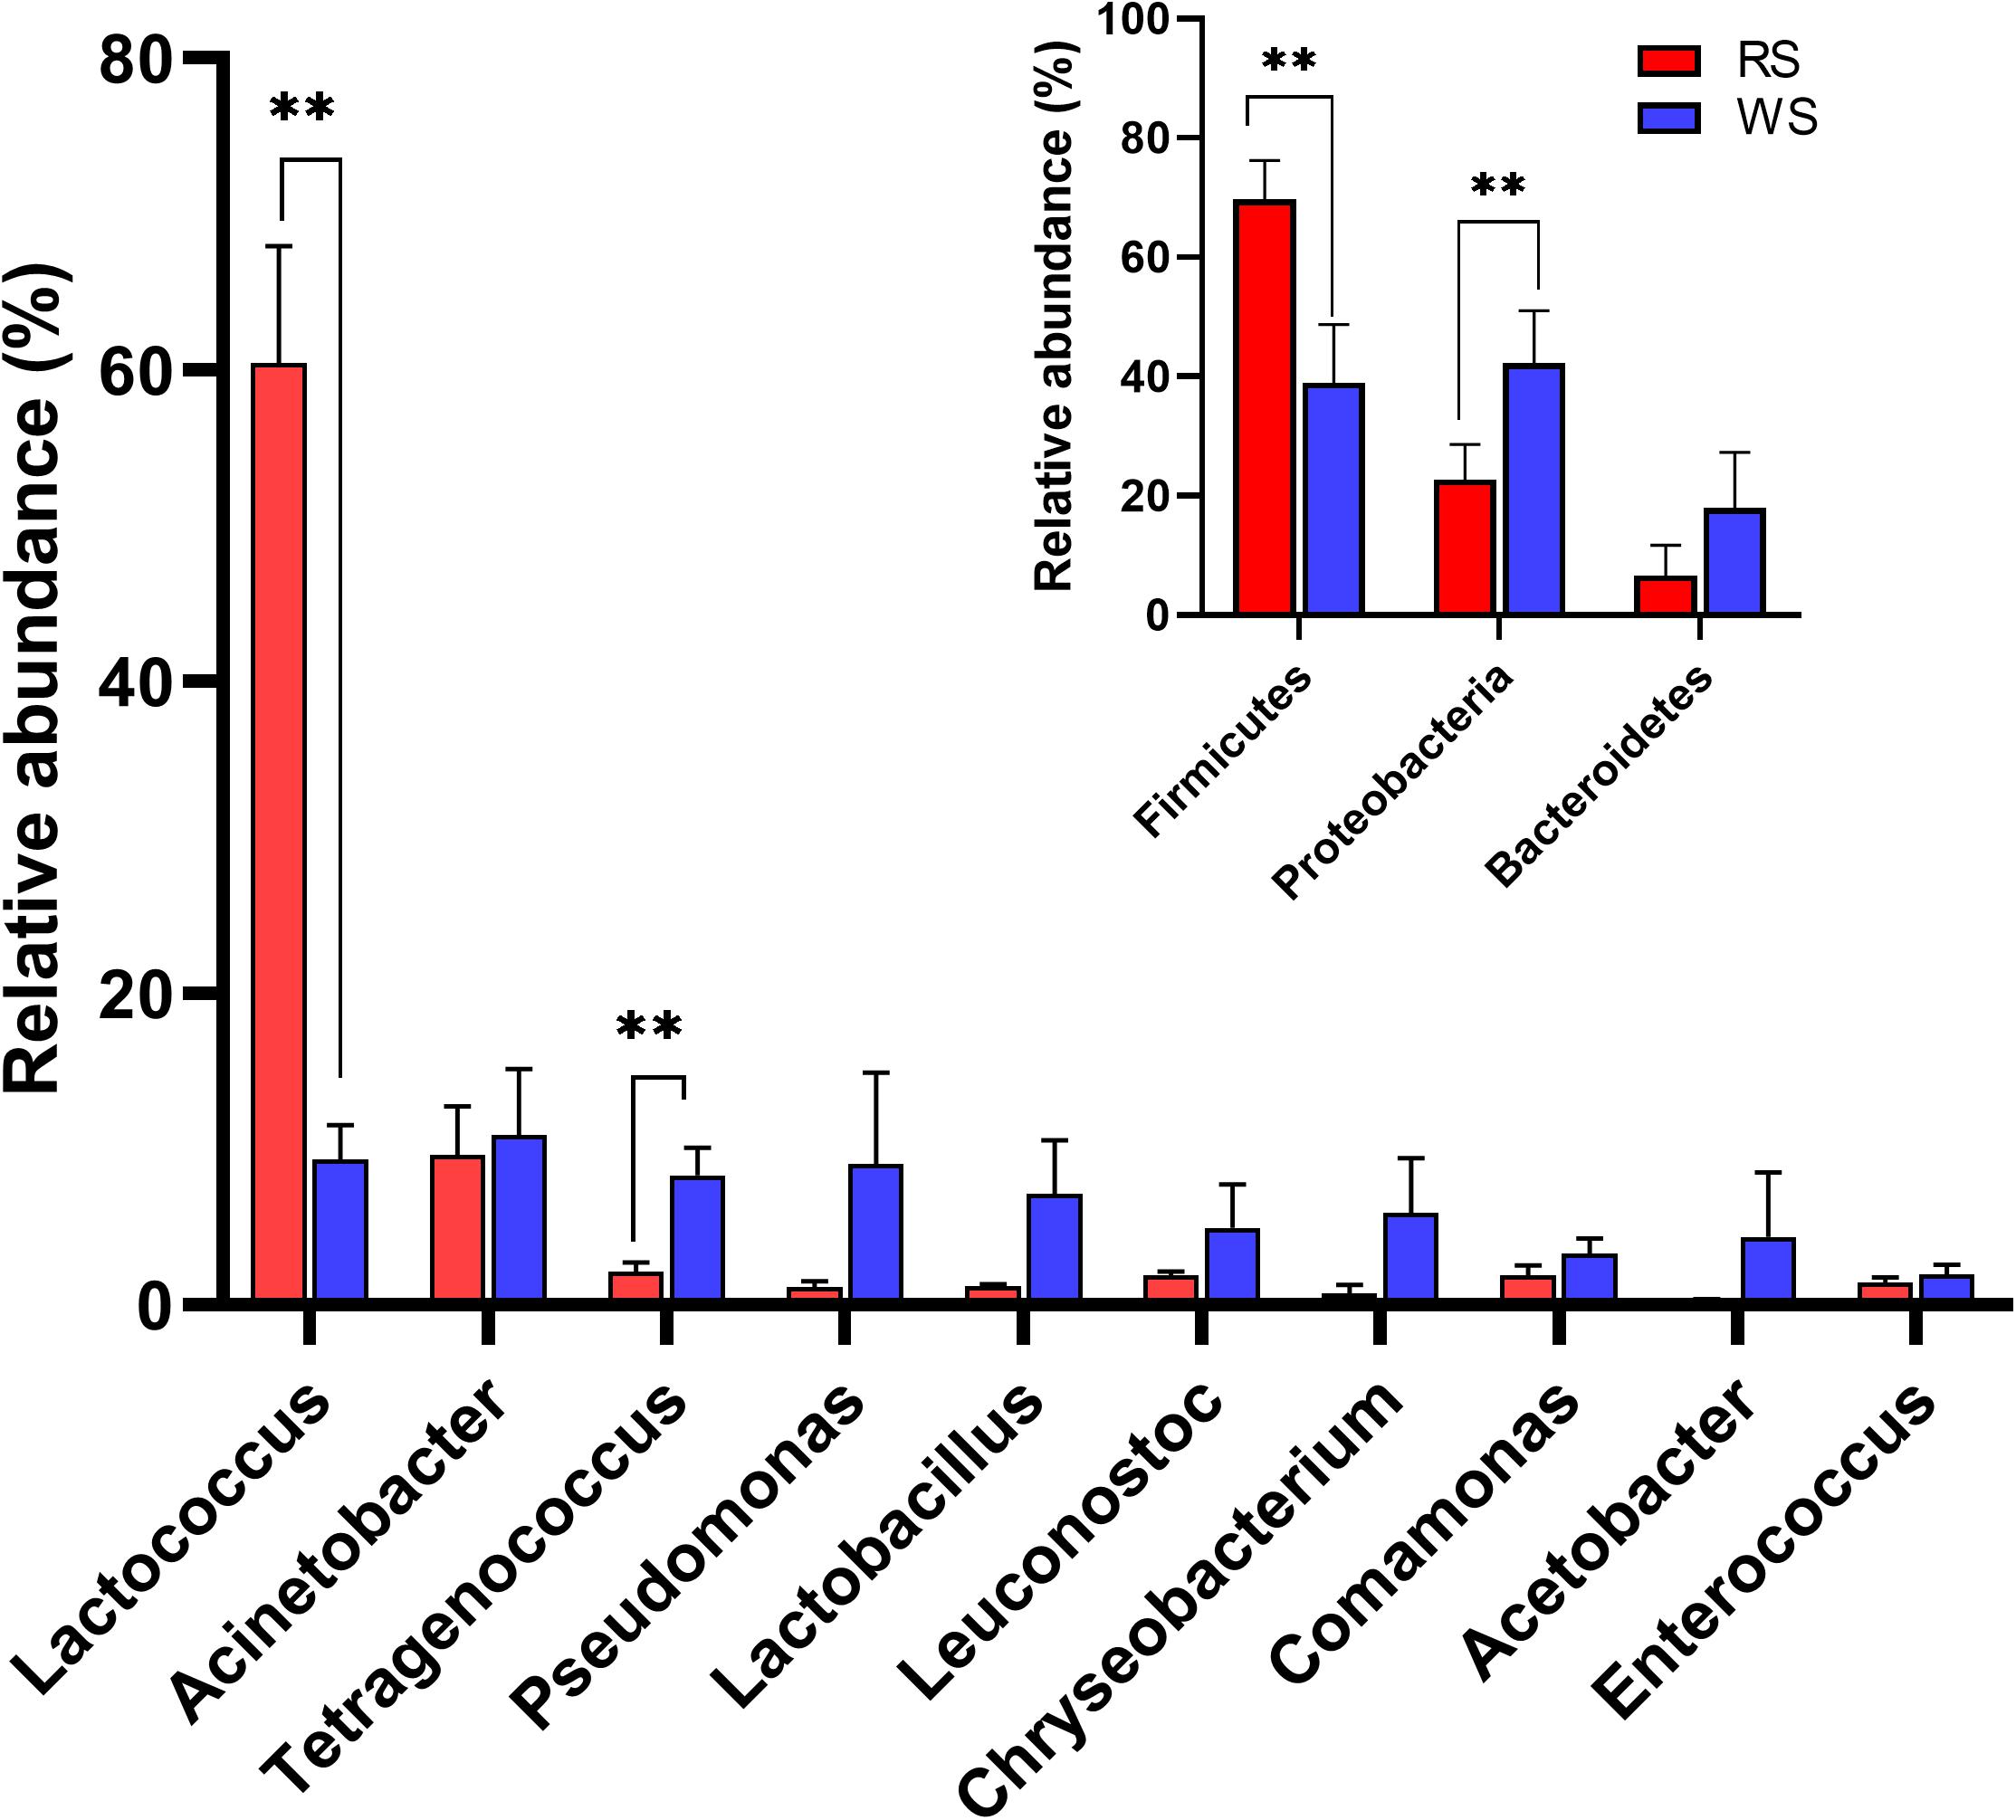
Figure 3. Taxonomic composition of bacterial communities showing differences between red sufu (RS) and white sufu (WS). The data revealed phylum (inset figure) and genus (main figure) level classifications for 16S rRNA gene sequences. 16S rRNA gene sequences longer than 250 bp were classified using the RDP naïve Bayesian rRNA Classifier at an 80% confidence threshold. Averages ± SEMs of samples in each group are expressed in each column. The significance cutoff for the corrected P value determined using the Benjamini-Hochberg FDR procedure was set at 0.01. ** P < 0.01 for the indicated comparisons.
Next, biomarker analysis using the LEfSe method was performed to determine the classified bacterial taxa with significantly different abundances between RS and WS. As shown in Supplementary Figure S5, six bacterial clades showed statistically significant differences, with an LDA score of 4.0. Specifically, Lactococcus (genus), Streptococcaceae (family), and Lactobacillales (order) were abundant in RS samples. In contrast, Enterococcaceae (family), Tetragenococcus (genus), and Bacillales (order) were common in WS samples. The significantly different abundances of Lactococcus and Tetragenococcus in RS and WS could explant the divergence of chemical characteristics between the two types of sufu. Our results also showed that Lactococcus was the dominant microorganism. Lactococcus mainly affects the conversion of amino acids to flavor compounds in cheese (Yvon et al., 1997; Kieronczyk et al., 2006). Tetragenococcus are halophilic LAB that occur mainly in fermented foods, such as doubanjiang-meju (Li et al., 2017), doenjang (Kim et al., 2009), and sufu (Xie et al., 2018; Liu and Qiao, 2019). Importantly, Tetragenococcus halophilus is essential for the production of desirable volatile compounds during soy sauce production (Devanthi et al., 2018).
Shared taxa (at the genus level) present in all sufu samples at more or less than 1% relative abundance were defined as dominant or rare core taxa, respectively (Figure 4). At the genus level, RS comprised 29 core genera in four phyla, accounting for 20.28% ± 3.30% of the total sequence abundance (Figure 4A). In the WS bacterial communities, 28 core taxa were identified, comprising 19.58% ± 2.11% of the total sequence abundance (Figure 4A). All RS dominant core taxa (representing 79.73% ± 15.01% of the shared sequence abundances) were also in the WS core, and 15 taxa constituted the dominant core of WS microbial communities (73.35% ± 24.14% of the shared sequence abundance; Figure 4B). Seven of the rare core taxa in the RS were dominant core taxa in the WS, including Bacillus, Empedobacter, Weissella, Streptococcus, Kurthia, Chryseobacteriuma, and Acetobacter. For RS and WS communities, dominant cores were dominated by Enterococcus, Tetragenococcus, Leuconostoc, Lactobacillus, Pseudomonas, Acinetobacter, and Lactococcus (Figure 4B). Notably, these bacteria were also found to be dominant in other reports of sufu and other food fermentation processes (Kang et al., 2003; Feng et al., 2013; Li et al., 2017; Gu et al., 2018; Huang et al., 2018; Xie et al., 2018).
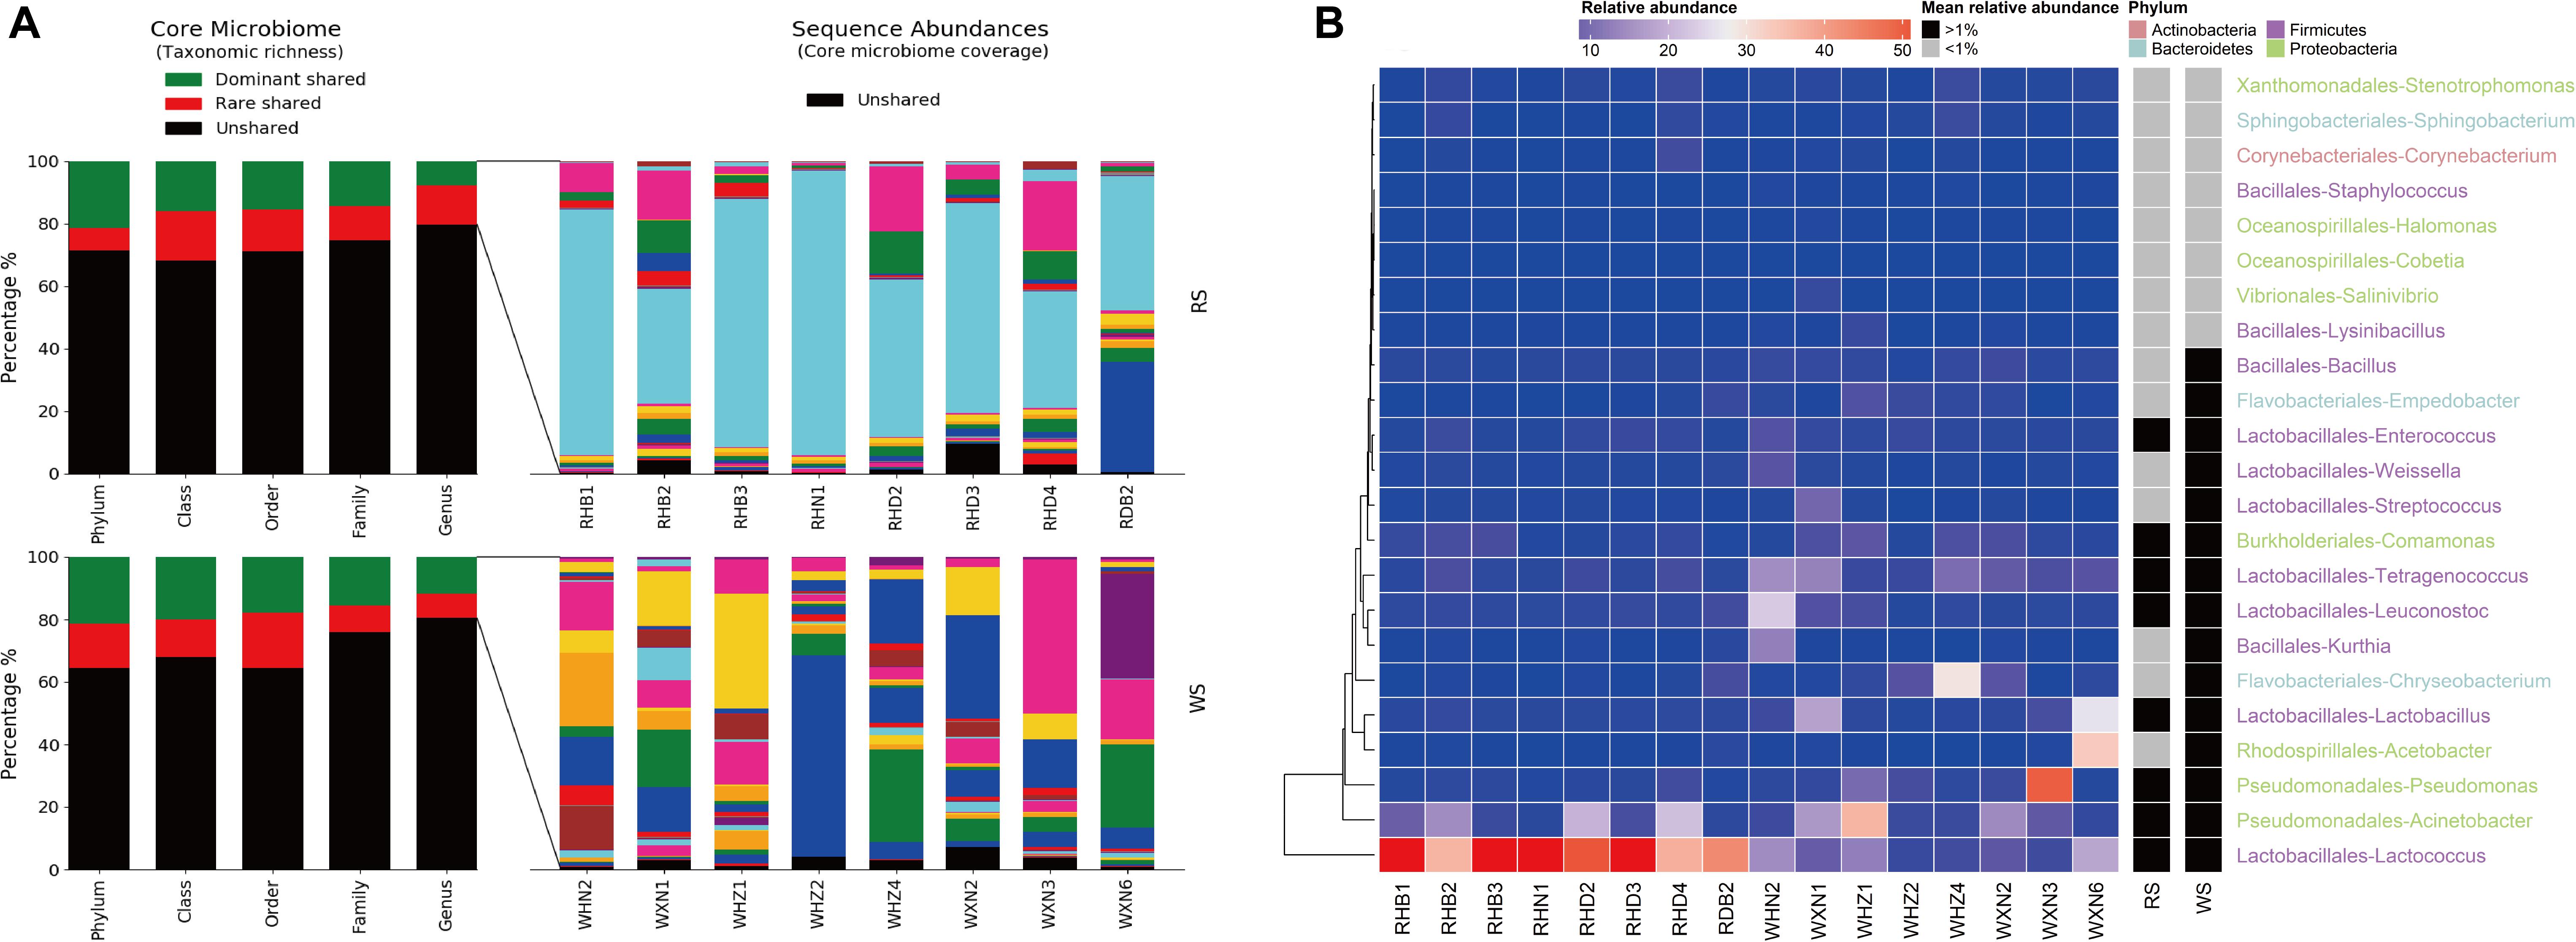
Figure 4. Richness, abundance, and identity of bacterial taxa shared between RS and WS samples. (A) Richness and sequence coverage of shared taxa in RS and WS. (B) Shared genera and their absolute abundances. Sequence abundances were log-transformed and colored from red to black to present higher-to-lower abundances. Heatmap boxes without any sequences were assigned 10– 6 (darkest green).
Correlations Between Bacterial Communities and Metabolites
Next, the relationships between species richness and metabolites were analyzed by ABT analysis (De’ath, 2007). The results showed that formic acid had the highest relative influence (20.27%) on the Chao1 index of bacterial communities, following by arginine (5.38%), propanol (4.57%), oxalic acid (4.46%), and hexanol (4.43%; Figure 5). These findings implied that formic acid may be a key factor driving the species richness in sufu. Indeed, acidity is an important factor in microbial population succession (Wang et al., 2015a), and formic acid is key factor for bacterial growth and community formation in cheese (Oh et al., 2016). In a study of mixed silage of air-dried corn stover and cabbage waste, formic acid was found to have negative effects on the OTU number of 16S rRNA genes and to increase the relative abundance of Firmicutes in silage (Ren et al., 2018). In our study, Lactobacillus was the predominant genus in WS (average ± SEM: 9.87% ± 3.49%) and RS (0.36% ± 0.13%) samples in this study (Figure 3). Moreover, formic acid can stimulate RNA synthesis in cells (Suzuki et al., 1986), which can also influence the bacterial community structure in sufu. Evaluation of the relative influence of the bacterial composition on the concentration of formic acid showed that Streptococcaceae and Moraxellaceae had the highest relative influence (12.84% and 8.75%, respectively; Supplementary Figure S6). Streptococcaceae, mainly represented by Lactococcus and Streptococcus, is highly correlated with formic acid in the fermentation of probiotic cheeses (Oh et al., 2016). Additionally, Moraxellaceae, mainly represented by Acinetobacter, is also abundant in other fermented foods (Wang et al., 2015b; Li et al., 2017; Huang et al., 2018). Previous studies have indicated that the genus Acinetobacter is well known for its capacity to secrete esterolytic enzymes (Ahmed et al., 2010), and is positively related to flavor compounds, particularly esters (Huang et al., 2018). However, relatively little is known regarding the roles of Streptococcaceae and Moraxellaceae in formic acid generation in sufu, and the effects and mechanisms of formic acid on sufu bacterial communities remain unclear.
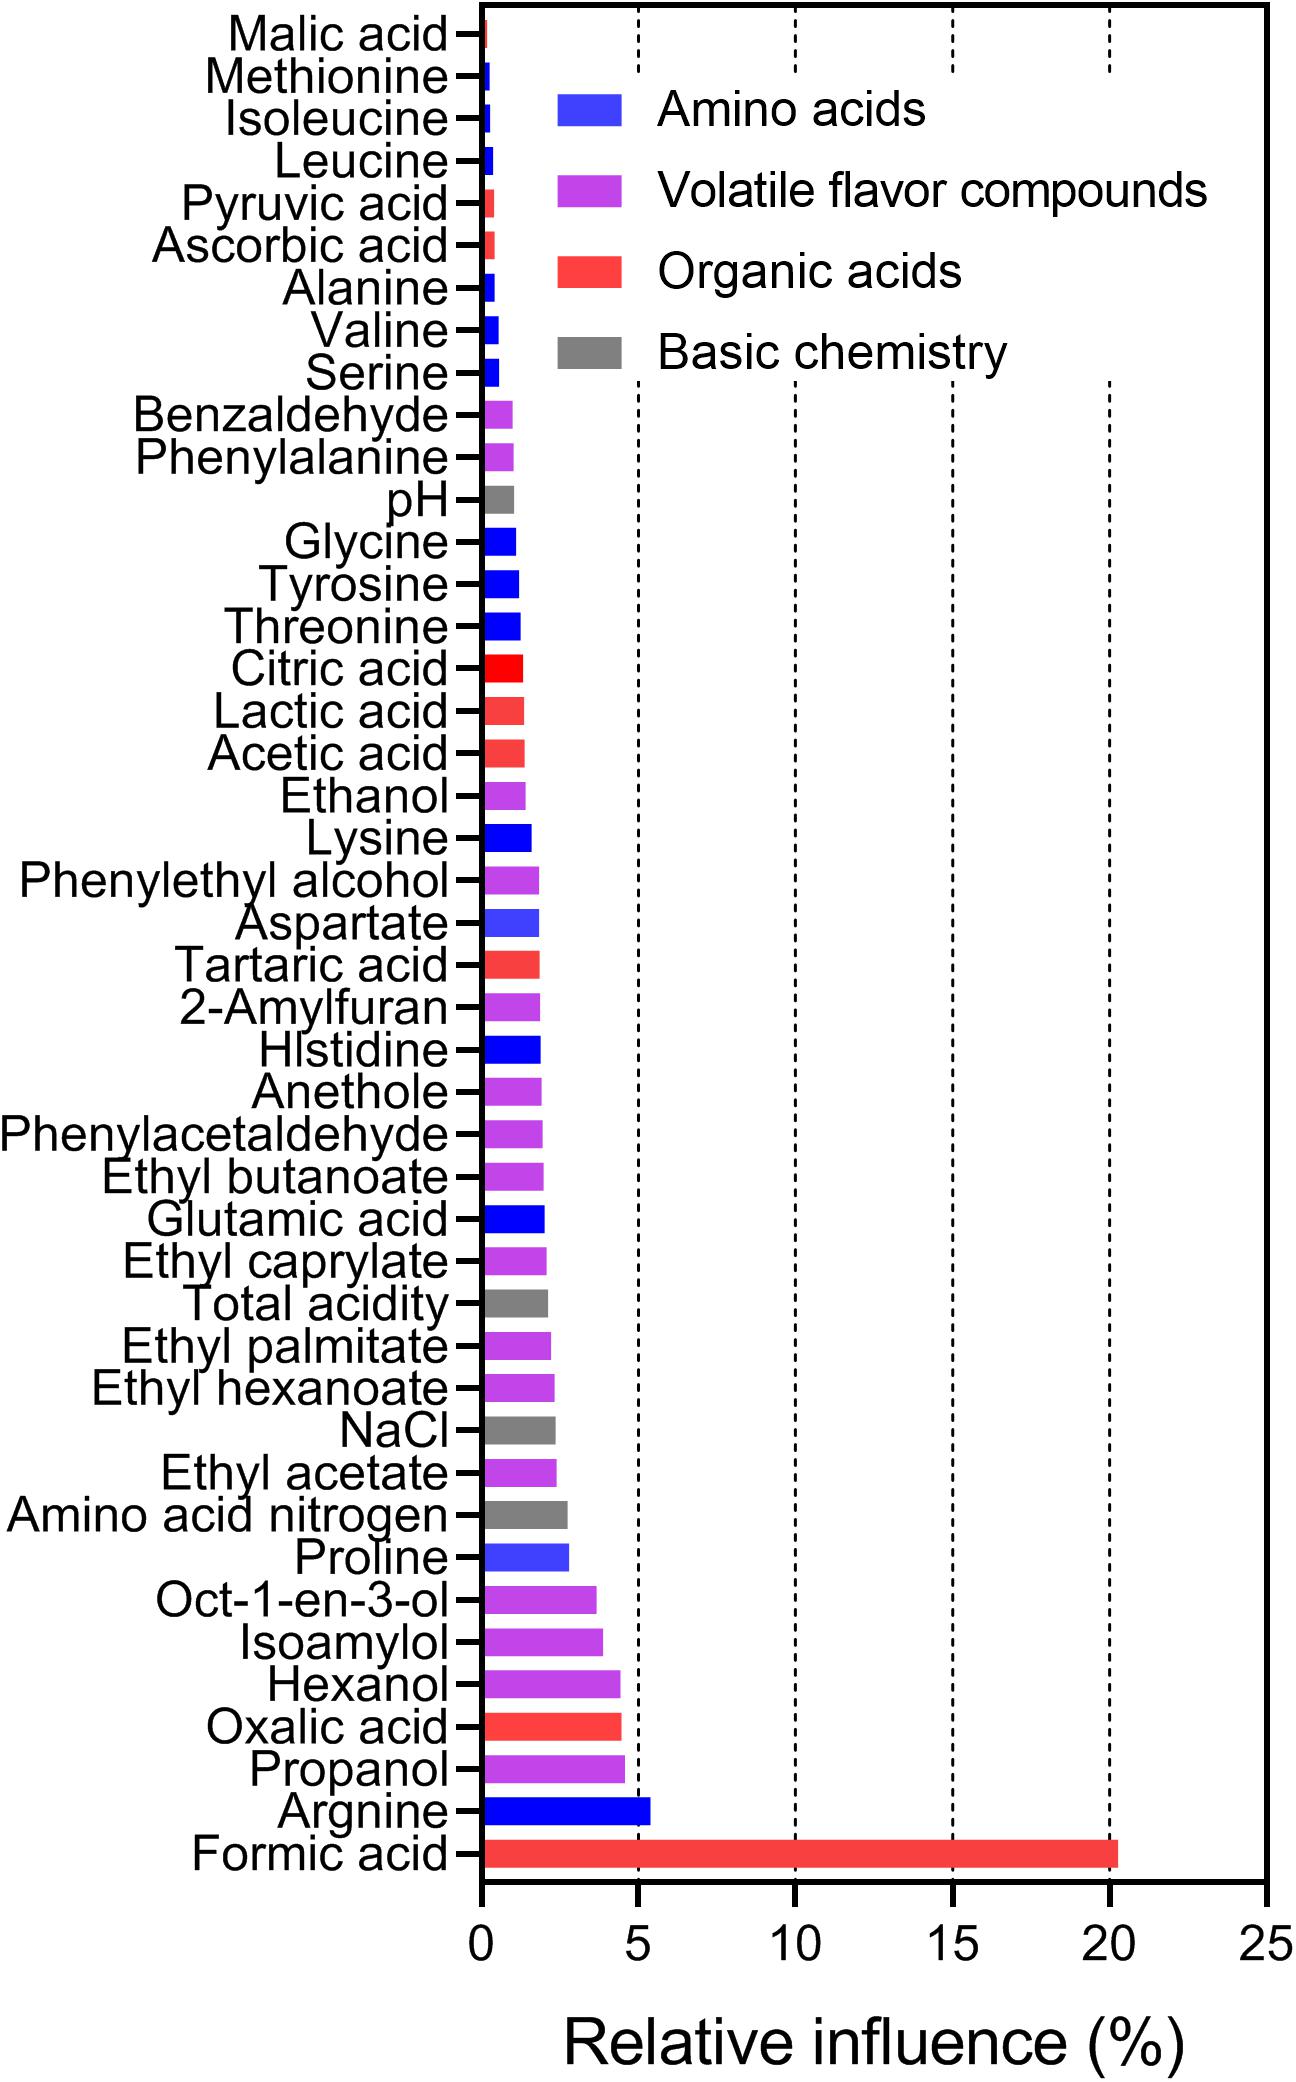
Figure 5. Relative influence (%) of chemical variables on the Chao1 index as evaluated by the ABT analysis, with 5000 trees used for the boosting, 10-fold cross-validation, and three-way interactions.
To elucidate the correlations between bacterial communities and metabolites, Pearson’s correlation coefficients of the relative abundances of bacterial genera and the contents of metabolites were calculated (Figure 6). The results showed that Lactococcus were positively correlated with VFCs (ethanol, ethyl acetate, and benzaldehyde, etc.) and organic acid (formic acid and malic acid), but negatively related to amino acid (isoleucine, alanine, valine, and glycine, etc.) (all P < 0.05). Previous studies have shown that Lactococcus is positively correlated with flavor compounds, particularly acids and esters (Huang et al., 2018; Xie et al., 2018). It was also reported that Lactococcus lactis IO-1grew well with xylose as the carbon source, and produced formic acid (Tanaka et al., 2002). Besides, the abundances of Tetragenococcus and Comamonas were significantly related to the species of amino acids (Figure 6), indicated their important roles in the production and transformation of amino acids in sufu fermentation. Tetragenococcus occurred dominantly in fermented foods, such as, doenjang, sufu and soy sauce, which is essential for the production of desirable volatile compounds (Kim et al., 2009; Devanthi et al., 2018; Xie et al., 2018). It was also demonstrated that Comamonas testosteroni can produce alanine from aspartate by aspartate-β-decarboxylase (Nakamori, 2017). Additionally, we found that Leuconostoc had a mostly positive relationship with ethanol, suggested it can tolerate elevated levels of ethanol. Besides, it has been proven that Leuconostoc mesenteroides could convert acetaldehyde to ethanol and acetate (Liu et al., 1997). However, the results obtained in this study were based on commercial sufu. Therefore, further studies should be conducted to identify important species and their interactions in flavor generation during sufu fermentation with different materials, starters, or technologies.
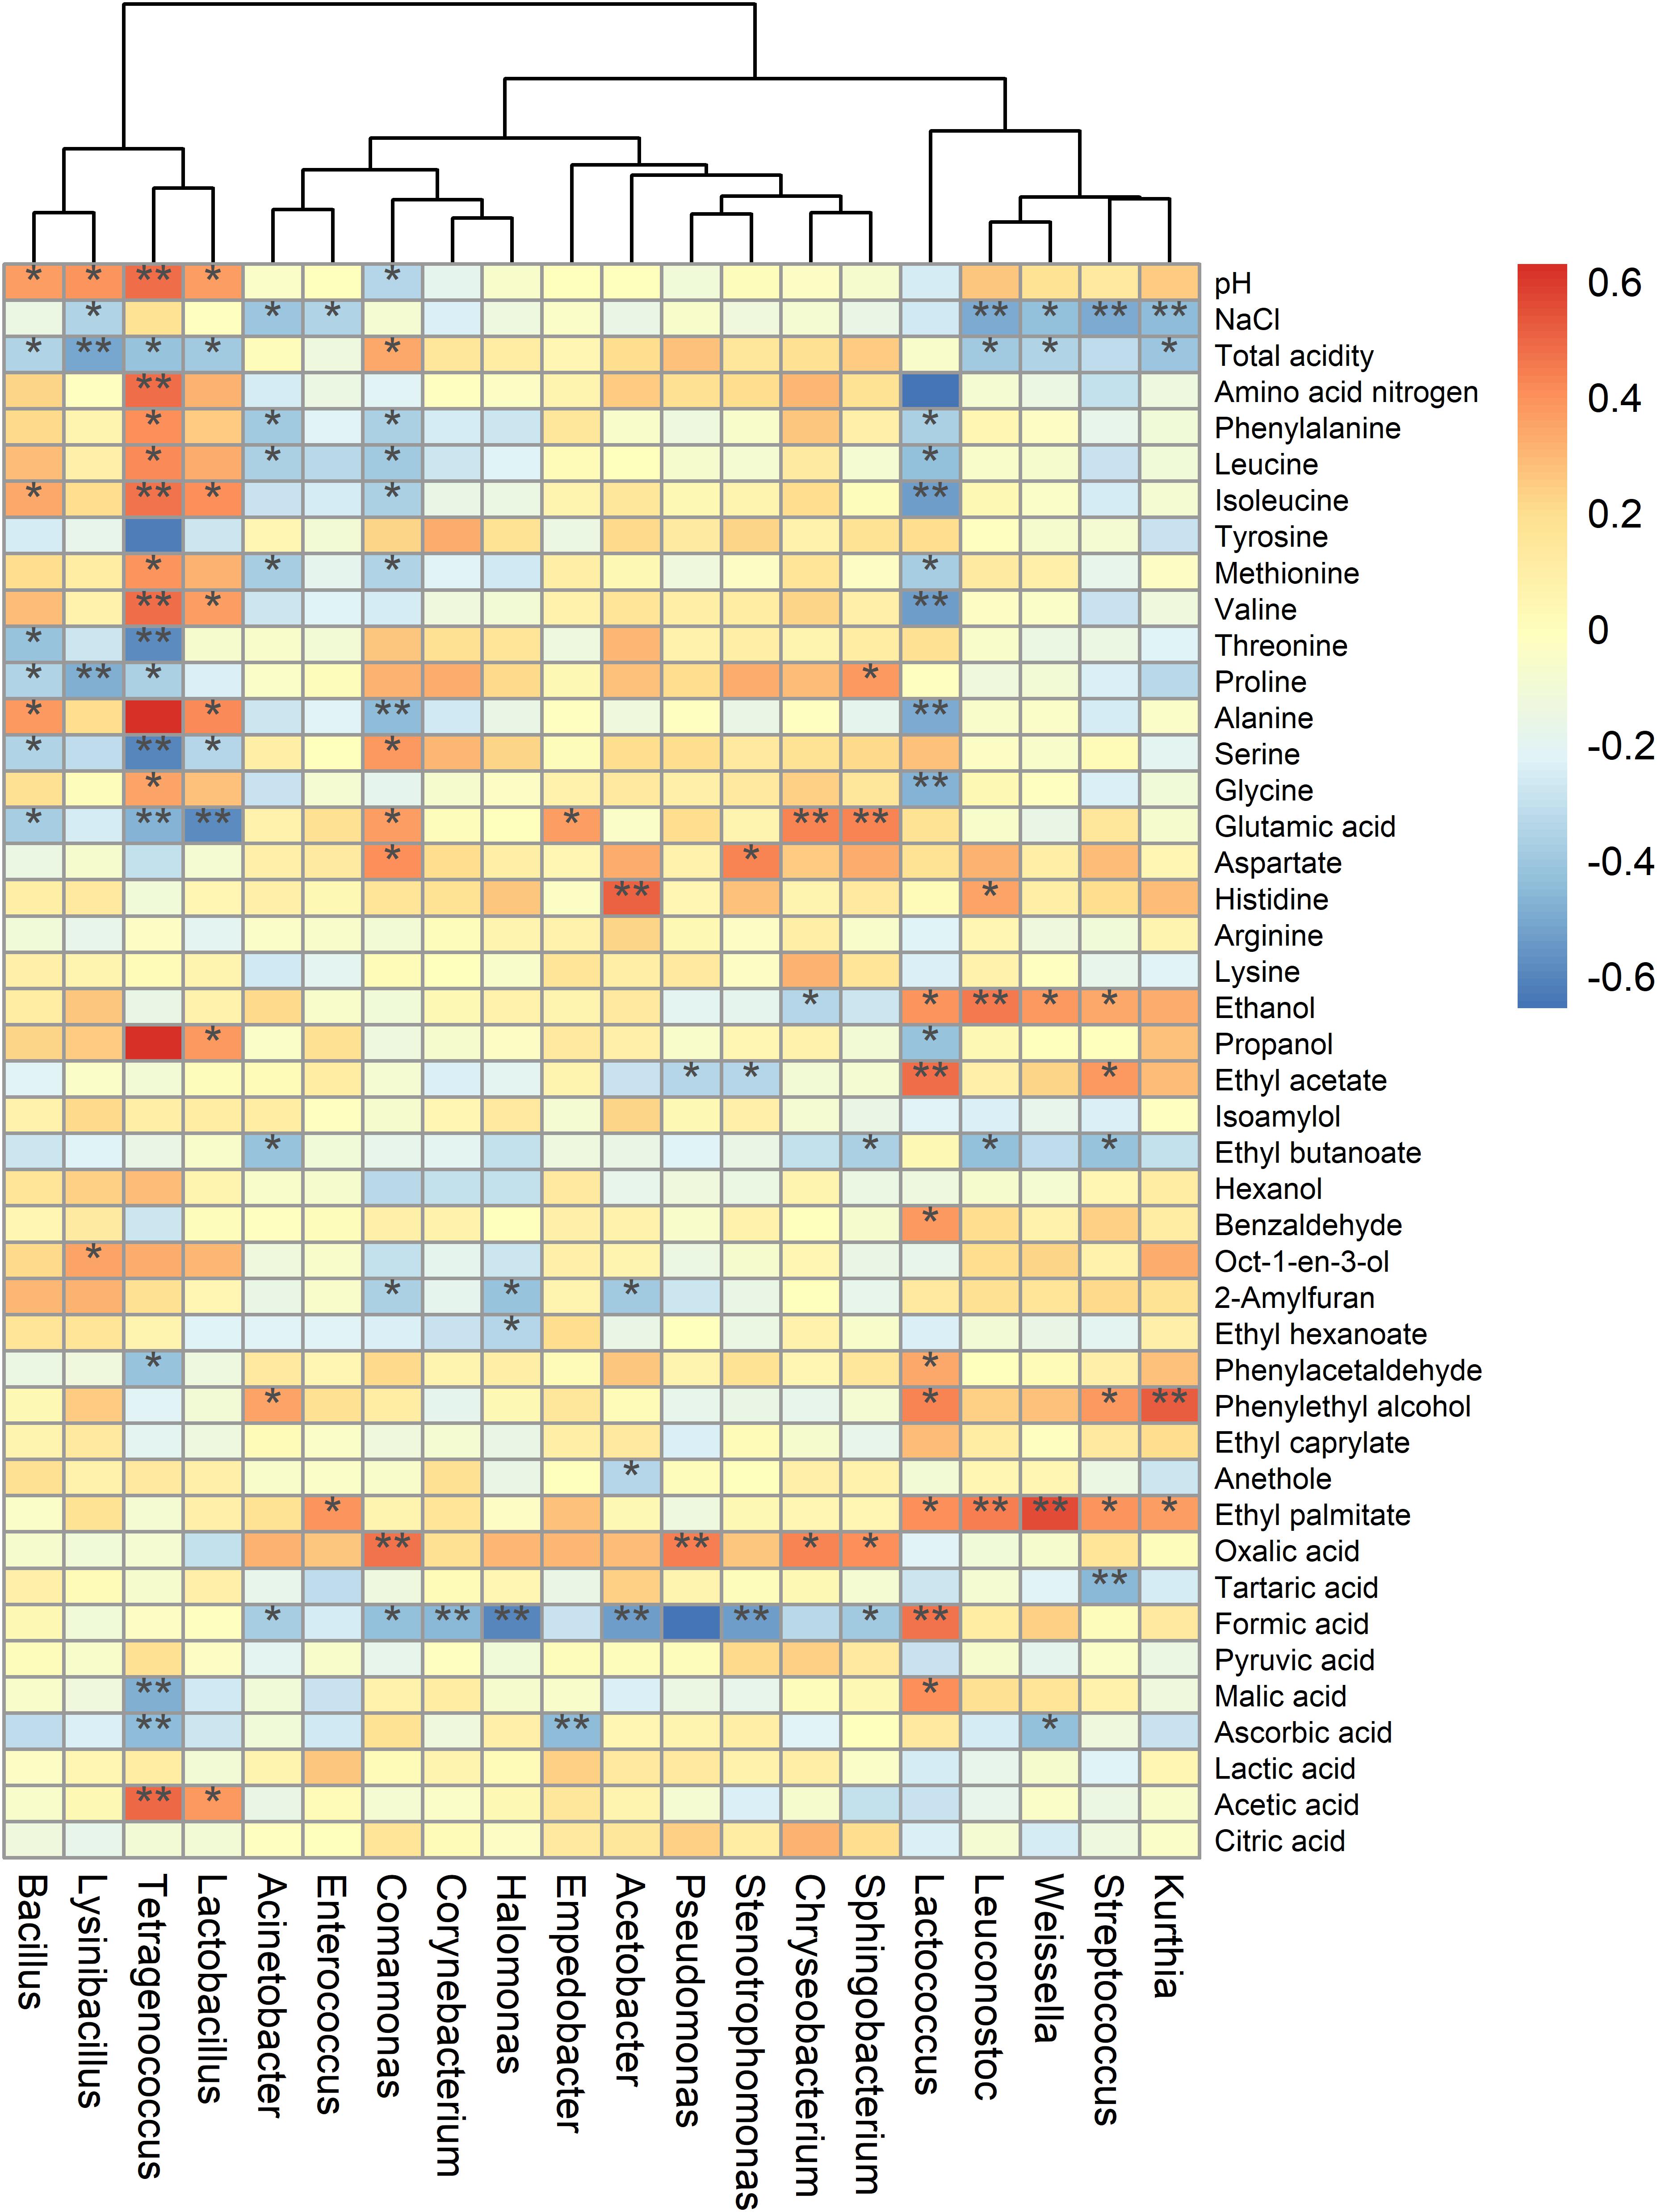
Figure 6. Heatmap of the correlations of bacterial genera with metabolites and other physicochemical parameters. Strength (Spearman’s ρ value) and significance of correlations were showed as color in shades (red, positive correlation; blue, and negative correlation). The heatmap values ranged from + 0.6 to -0.6. The values above/below zero represent positive/negative correlations between bacterial genera and the parameters analyzed. * P < 0.05, ** P < 0.01 for the indicated comparisons.
Conclusion
In this study, we examined the bacterial communities and metabolites of different types of sufu by coupling high-throughput 16S rRNA gene amplicon target sequencing and metabolomic approaches. The correlations between bacterial community and metabolites were also analyzed in sufu. To the best of our knowledge, this is the first report to comprehensively evaluate the molecular ecology and correlations between microbiota and metabolites in RS and WS. Our work provides in-depth insights into the roles of bacterial communities in the generation of metabolites in sufu. Further studies are needed to confirm our findings with regard to microbial communities, flavor components, enzymes, and their correlations using a meta-omics approach.
Data Availability Statement
All datasets generated for this study are included in the article/Supplementary Material.
Author Contributions
GT, MH, and MY conceived and designed the experiments. XL and ZP performed most of the experiments. ML, LL, and MY supervised the execution of the experiments. GT and MH wrote the manuscript. All authors read and approved the final manuscript.
Funding
This work was supported by grants from the National Science Foundation of China (Grant No. 41977138), Natural Science Foundation of Guangdong Province (Grant Nos. 2020A1515011308 and 2017A030313218), and Start-up Found of Zhongshan Institute, University of Electronic Science and Technology of China (Grant No. 419YKQN12).
Conflict of Interest
MY was employed by Zhuhai Da Hengqin Science and Technology Development Co., Ltd.
The remaining authors declare that the research was conducted in the absence of any commercial or financial relationships that could be construed as a potential conflict of interest.
Acknowledgments
The authors are grateful to Ecogene Biotech Co. Ltd. (Shenzhen, China) for support with the bioinformatic analysis.
Supplementary Material
The Supplementary Material for this article can be found online at: https://www.frontiersin.org/articles/10.3389/fmicb.2020.00758/full#supplementary-material
FIGURE S1 | The workflow diagram of sufu production.
FIGURE S2 | Profiles of organic acids in sufu samples. Averages ± standard deviations for samples in each group are expressed in each column. The significance cutoff for the corrected P value using the Benjamini-Hochberg FDR procedure was set at 0.05. *P < 0.05 for the indicated comparisons.
FIGURE S3 | Relative abundance percentages of bacterial phyla among different sufu samples. The relative abundance of each taxon was defined as the percentage of the same taxon to the corresponding total sequences for each sample. Some classes with abundances of less than 1% were summarized as “other.”
FIGURE S4 | Relative abundance percentages of bacterial genera among different sufu samples. The relative abundance of each taxon was defined as the percentage of the same taxon to the corresponding total sequences for each sample. Some classes with abundances of less than 1% were summarized as “other.”
FIGURE S5 | The microbial communities of red (RS) and white (WS) sufu samples were analyzed using the LDA effect size algorithm to determine the optimal characteristic taxa and rank them according to the effect size. LDA scores identified the size of differentiation; the score threshold was 4.0.
FIGURE S6 | Relative influence of the bacterial composition on formic acid.
TABLE S1 | Characteristics of the physicochemical parameters of sufu.
TABLE S2 | Characteristics of volatile favor compounds (VFCs) in RS and WS.
TABLE S3 | Statistical analysis of bacterial 16S rRNA sequencing data for the sufu samples.
Footnotes
References
Ahmed, E. H., Raghavendra, T., and Madamwar, D. (2010). An alkaline lipase from organic solvent tolerant Acinetobacter sp. EH28: application for ethyl caprylate synthesis. Bioresour. Technol. 101, 3628–3634. doi: 10.1016/j.biortech.2009.12.107
Baker, G. C., Smith, J. J., and Cowan, D. A. (2003). Review and re-analysis of domain-specific 16S primers. J. Microbiol. Methods 55, 541–555. doi: 10.1016/j.mimet.2003.08.009
Blanc, P. J., Loret, M. O., and Goma, G. (1995). Production of citrinin by various species of Monascus. Biotechnol. Lett. 17, 291–294. doi: 10.1007/bf01190639
Caporaso, J. G., Kuczynski, J., Stombaugh, J., Bittinger, K., Bushman, F. D., Costello, E. K., et al. (2010). QIIME allows analysis of high-throughput community sequencing data. Nat. Methods 7, 335–336. doi: 10.1038/nmeth.f.303
Chen, S., Chen, L., Chen, L., Ren, X. L., Ge, H. J., Li, B. L., et al. (2018). Potential probiotic characterization of Lactobacillus reuteri from traditional Chinese highland barley wine and application for room-temperature-storage drinkable yogurt. J. Dairy Sci. 101, 5780–5788. doi: 10.3168/jds.2017-14139
Chung, H. Y., Fung, P. K., and Kim, J. S. (2005). Aroma impact components in commercial plain sufu. J. Agric. Food Chem. 53, 1684–1691. doi: 10.1021/jf048617d
Cole, J. R., Chai, B., Farris, R. J., Wang, Q., Kulam-Syed-Mohideen, A. S., Mcgarrell, D. M., et al. (2006). The ribosomal database project (RDP-II): introducing myRDP space and quality controlled public data. Nucleic Acids Res. 35, D169–D172. doi: 10.1093/nar/gkl889
DeSantis, T. Z., Hugenholtz, P., Larsen, N., Rojas, M., Brodie, E. L., Keller, K., et al. (2006). Greengenes, a chimera-checked 16S rRNA gene database and workbench compatible with ARB. Appl. Environ. Microbiol. 72, 5069–5072. doi: 10.1128/aem.03006-05
Devanthi, P. V. P., Linforth, R., Onyeaka, H., and Gkatzionis, K. (2018). Effects of co-inoculation and sequential inoculation of Tetragenococcus halophilus and Zygosaccharomyces rouxii on soy sauce fermentation. Food Chem. 240, 1–8. doi: 10.1016/j.foodchem.2017.07.094
Edgar, R. C., Haas, B. J., Clemente, J. C., Quince, C., and Knight, R. (2011). UCHIME improves sensitivity and speed of chimera detection. Bioinformatics 27, 2194–2200. doi: 10.1093/bioinformatics/btr381
Erten, H., Tanguler, H., and Cakiroz, H. (2007). The effect of pitching rate on fermentation and flavour compounds in high gravity brewing. J. I. Bewing 113, 75–79. doi: 10.1002/j.2050-0416.2007.tb00259.x
Fan, X. J., Liu, G. F., Qiao, Y. L., Zhang, Y. J., Leng, C., Chen, H. Y., et al. (2019). Characterization of volatile compounds by SPME-GC-MS during the ripening of Kedong sufu, a typical chinese traditional bacteria-fermented soybean product. J. Food Sci. 84, 2441–2448. doi: 10.1111/1750-3841.14760
Feng, Z., Gao, W., Ren, D., Chen, X., and Li, J. J. (2013). Evaluation of bacterial flora during the ripening of Kedong sufu, a typical Chinese traditional bacteria-fermented soybean product. J. Sci. Food Agric. 93, 1471–1478. doi: 10.1002/jsfa.5918
Gobet, A., Quince, C., and Ramette, A. (2010). Multivariate cutoff level analysis (MultiCoLA) of large community data sets. Nucleic Acids Res. 38:e155. doi: 10.1093/nar/gkq545
Gu, J. S., Liu, T. J., Sadiq, F. A., Yang, H. Y., Yuan, L., Zhang, G. H., et al. (2018). Biogenic amines content and assessment of bacterial and fungal diversity in stinky tofu – A traditional fermented soy curd. LWT 88, 26–34. doi: 10.1016/j.lwt.2017.08.085
Han, B. Z., Beumer, R. R., Rombouts, F. M., and Robert Nout, M. J. (2001a). Microbiological safety and quality of commercial sufu – a Chinese fermented soybean food. Food Control 12, 541–547. doi: 10.1016/S0956-7135(01)00064-0
Han, B. Z., Rombouts, F. M., and Nout, M. J. R. (2001b). A Chinese fermented soybean food. Int. J. Food Microbiol. 65, 1–10. doi: 10.1016/S0168-1605(00)00523-7
Han, B. Z., Cao, C. F., Rombouts, F. M., and Nout, M. J. R. (2004a). Microbial changes during the production of sufu—-a Chinese fermented soybean food. Food Control 15, 265–270. doi: 10.1016/S0956-7135(03)00066-5
Han, B. Z., Rombouts, F. M., and Nout, M. J. R. (2004b). Amino acid profiles of sufu, a Chinese fermented soybean food. J. Food Compos. Anal. 17, 689–698. doi: 10.1016/j.jfca.2003.09.012
Han, B. Z., Wang, J. H., Rombouts, F. M., and Nout, M. R. (2003). Effect of NaCl on textural changes and protein and lipid degradation during the ripening stage of sufu, a Chinese fermented soybean food. J. Sci. Food Agric. 83, 899–904. doi: 10.1002/jsfa.1425
Ho, C. T., Zhang, Y. G., Shi, H., and Tang, J. (1989). Flavor chemistry of Chinese foods. Food Rev. Int. 5, 253–287. doi: 10.1080/87559128909540855
Huang, X. N., Yu, S. Z., Han, B. Z., and Chen, J. Y. (2018). Bacterial community succession and metabolite changes during sufu fermentation. LWT 97, 537–545. doi: 10.1016/j.lwt.2018.07.041
Hwan, C. H., and Chou, C. C. (1999). Volatile components of the Chinese fermented soya bean curd as affected by the addition of ethanol in ageing solution. J. Sci. Food Agric. 79, 243–248. doi: 10.1002/(sici)1097-0010(199902)79:2<243::aid-jsfa179<3.0.co;2-i
Jùzlová, P., Martínková, L., and Køen, V. (1996). Secondary metabolites of the fungus Monascus: a review. J. Ind. Microbiol. 16, 163–170. doi: 10.1007/bf01569999
Kang, J. H., Lee, J. H., Min, S., and Min, D. B. (2003). Changes of volatile compounds, lactic acid bacteria, pH, and headspace gases in kimchi, a traditional korean fermented vegetable product. J. Food Sci. 68, 849–854. doi: 10.1111/j.1365-2621.2003.tb08254.x
Kieronczyk, A., Cachon, R., Feron, G., and Yvon, M. (2006). Addition of oxidizing or reducing agents to the reaction medium influences amino acid conversion to aroma compounds by Lactococcus lactis. J. Appl. Microbiol. 101, 1114–1122. doi: 10.1111/j.1365-2672.2006.02999.x
Kim, T. W., Lee, J. H., Kim, S. E., Park, M. H., Chang, H. C., and Kim, H. Y. (2009). Analysis of microbial communities in doenjang, a Korean fermented soybean paste, using nested PCR-denaturing gradient gel electrophoresis. Int. J. Food Microbiol. 131, 265–271. doi: 10.1016/j.ijfoodmicro.2009.03.001
Li, Q., Li, Y. D., Luo, Y., Zhang, Y. Y., Chen, Y., Lin, H. Y., et al. (2019). Shifts in diversity and function of the bacterial community during the manufacture of Fu brick tea. Food Microbiol. 80, 70–76. doi: 10.1016/j.fm.2019.01.001
Li, Z. H., Rui, J. P., Li, X. Z., Li, J. B., Dong, L., Huang, Q. L., et al. (2017). Bacterial community succession and metabolite changes during doubanjiang-meju fermentation, a Chinese traditional fermented broad bean (Vicia faba L.) paste. Food Chem. 218, 534–542. doi: 10.1016/j.foodchem.2016.09.104
Liang, J. J., Li, D. W., Shi, R. Q., Wang, J., Guo, S. X., Ma, Y. L., et al. (2019). Effects of microbial community succession on volatile profiles and biogenic amine during sufu fermentation. LWT 114:108379. doi: 10.1016/j.lwt.2019.108379
Liu, J., Han, B., Deng, S., Sun, S., and Chen, J. (2018). Changes in proteases and chemical compounds in the exterior and interior of sufu, a Chinese fermented soybean food, during manufacture. LWT 87, 210–216. doi: 10.1016/j.lwt.2017.08.047
Liu, S. N., and Qiao, J. J. (2019). Bacterial diversity of Anshun sufu, a traditional fermented tofu in Guizhou province of China. Tianjin Daxue Xuebao 25, 497–503. doi: 10.1007/s12209-019-00198-8
Liu, S. Q., Asmundson, R. V., Holland, R., and Crow, V. L. (1997). Acetaldehyde metabolism by Leuconostoc mesenteroides subsp. cremoris under stress conditions. Int. Dairy J. 7, 175–183. doi: 10.1016/S0958-6946(96)00055-6
Ludwig, W., Strunk, O., Westram, R., Richter, L., Meier, H., and Yadhukumar et al. (2004). ARB: a software environment for sequence data. Nucleic Acids Res. 32, 1363–1371. doi: 10.1093/nar/gkh293
Moy, Y. S., and Chou, C. C. (2010). Changes in the contents of sugars and organic acids during the ripening and storage of sufu, a traditional oriental fermented product of soybean cubes. J. Agric. Food Chem. 58, 12790–12793. doi: 10.1021/jf1033653
Nakamori, S. (2017). “Early history of the breeding of amino acid-producing strains,” in Amino Acid Fermentation, eds A. Yokota and M. Ikeda (Tokyo: Springer Japan), 35–53.
Oh, N. S., Joung, J. Y., Lee, J. Y., Kim, S. H., and Kim, Y. (2016). Characterization of the microbial diversity and chemical composition of Gouda cheese made by potential probiotic strains as an adjunct starter culture. J. Agric. Food Chem. 64, 7357–7366. doi: 10.1021/acs.jafc.6b02689
Price, M. N., Dehal, P. S., and Arkin, A. P. (2010). FastTree 2 – Approximately maximum-likelihood trees for large alignments. PLoS One 5:e9490. doi: 10.1371/journal.pone.0009490
Quast, C., Pruesse, E., Yilmaz, P., Gerken, J., Schweer, T., Yarza, P., et al. (2012). The SILVA ribosomal RNA gene database project: improved data processing and web-based tools. Nucleic Acids Res. 41, D590–D596. doi: 10.1093/nar/gks1219
Ren, H. W., Wang, C., Fan, W. G., Zhang, B. Y., Li, Z. Z., and Li, D. (2018). Effects of formic or acetic acid on the storage quality of mixed air-dried corn stover and cabbage waste, and microbial community analysis. Food Technol. Biotechnol. 56, 71–82. doi: 10.17113/ftb.56.01.18.5455
Segata, N., Izard, J., Waldron, L., Gevers, D., Miropolsky, L., Garrett, W. S., et al. (2011). Metagenomic biomarker discovery and explanation. Genome Biol. 12:R60. doi: 10.1186/gb-2011-12-6-r60
Suzuki, I., Kato, S., Kitada, T., Yano, N., and Morichi, T. (1986). Growth of Lactobacillus bulgaricus in milk. 1. cell elongation and the role of formic acid in boiled milk. J. Dairy Sci. 69, 311–320. doi: 10.3168/jds.S0022-0302(86)80407-6
Tanaka, K., Komiyama, A., Sonomoto, K., Ishizaki, A., Hall, S., and Stanbury, P. (2002). Two different pathways for D-xylose metabolism and the effect of xylose concentration on the yield coefficient of L-lactate in mixed-acid fermentation by the lactic acid bacterium Lactococcus lactis IO-1. Appl. Microbiol. Biot. 60, 160–167. doi: 10.1007/s00253-002-1078-5
Tanaka, Y., Watanabe, J., and Mogi, Y. (2012). Monitoring of the microbial communities involved in the soy sauce manufacturing process by PCR-denaturing gradient gel electrophoresis. Food Microbiol. 31, 100–106. doi: 10.1016/j.fm.2012.02.005
Wan, H. F., Liu, T., Su, C. W., Ji, X., Wang, L. P., Zhao, Y., et al. (2019). Evaluation of bacterial and fungal communities during the fermentation of Baixi sufu, a traditional spicy fermented bean curd. J. Sci. Food Agric. 100, 1448–1457. doi: 10.1002/jsfa.10151
Wang, Z. M., Lu, Z. M., Yu, Y. J., Li, G. Q., Shi, J. S., and Xu, Z. H. (2015a). Batch-to-batch uniformity of bacterial community succession and flavor formation in the fermentation of Zhenjiang aromatic vinegar. Food Microbiol. 50, 64–69. doi: 10.1016/j.fm.2015.03.012
Wang, X., Xie, K. L., Zhuang, H. N., Ye, R., Fang, Z. X., and Feng, T. (2015b). Volatile flavor compounds, total polyphenolic contents and antioxidant activities of a China gingko wine. Food Chem. 182, 41–46. doi: 10.1016/j.foodchem.2015.02.120
Wang, Z. M., Lu, Z. M., Shi, J. S., and Xu, Z. H. (2016). Exploring flavour-producing core microbiota in multispecies solid-state fermentation of traditional Chinese vinegar. Sci. Rep. 6:26818. doi: 10.1038/srep26818
Wong, H. C., and Bau, Y. S. (1977). Pigmentation and antibacterial activity of fast neutron- and X-ray-induced strains of Monascus purpureus. Plant Physiol. 60, 578–581. doi: 10.1104/pp.60.4.578
Xia, X. J., Li, G. N., Zheng, J., Ran, C. X., and Kan, J. Q. (2014). Biochemical, textural and microstructural changes in whole-soya bean cotyledon sufu during fermentation. Int. J. Food Sci. Tech. 49, 1834–1841. doi: 10.1111/ijfs.12492
Xie, C., Zeng, H., Wang, C., Xu, Z., and Qin, L. (2018). Volatile flavour components, microbiota and their correlations in different sufu, a Chinese fermented soybean food. J. Appl. Microbiol. 125, 1761–1773. doi: 10.1111/jam.14078
Xie, C. Z., Zeng, H. Y., Li, J. W., and Qin, L. K. (2019). Comprehensive explorations of nutritional, functional and potential tasty components of various types of Sufu, a Chinese fermented soybean appetizer. Food Sci. Tech. 39, 105–114. doi: 10.1590/fst.37917
Xu, D. D., Wang, P., Zhang, X., Zhang, J., Sun, Y., Gao, L. H., et al. (2020). High-throughput sequencing approach to characterize dynamic changes of the fungal and bacterial communities during the production of sufu, a traditional Chinese fermented soybean food. Food Microbiol. 86:103340. doi: 10.1016/j.fm.2019.103340
Keywords: red sufu, white sufu, bacterial community analysis, metabolite, high-throughput 16S rRNA gene sequencing
Citation: Tan G, Hu M, Li X, Pan Z, Li M, Li L and Yang M (2020) High-Throughput Sequencing and Metabolomics Reveal Differences in Bacterial Diversity and Metabolites Between Red and White Sufu. Front. Microbiol. 11:758. doi: 10.3389/fmicb.2020.00758
Received: 06 February 2020; Accepted: 30 March 2020;
Published: 22 April 2020.
Edited by:
Haifeng Zhao, South China University of Technology, ChinaReviewed by:
Chongde Wu, Sichuan University, ChinaZhihong Sun, Inner Mongolia Agricultural University, China
Fang Fang, Jiangnan University, China
Copyright © 2020 Tan, Hu, Li, Pan, Li, Li and Yang. This is an open-access article distributed under the terms of the Creative Commons Attribution License (CC BY). The use, distribution or reproduction in other forums is permitted, provided the original author(s) and the copyright owner(s) are credited and that the original publication in this journal is cited, in accordance with accepted academic practice. No use, distribution or reproduction is permitted which does not comply with these terms.
*Correspondence: Min Hu, aHVtaW5Ac29pbC5nZC5jbg==; Maoxun Yang, eWFuZ21hb3h1bjE5ODBAMTYzLmNvbQ==