 Rebecca R. Sweany*
 Kenneth E. Damann Jr.
- Department of Plant Pathology and Crop Physiology, Louisiana State University Agricultural Center, Baton Rouge, LA, United States
Aspergillus flavus is an ascomycete fungus that infects and contaminates corn, peanuts, cottonseed, and treenuts with acutely toxic and carcinogenic aflatoxins. The ecological function of aflatoxin production is not well understood; though not phytotoxic, aflatoxin may be involved in resisting oxidative stress responses from infection or drought stress in plants. Observation of aflatoxin stimulation in 48-well plates in response to increasing inoculated wells sparked an investigation to determine if A. flavus volatiles influence aflatoxin production in neighboring colonies. Experiments controlling several culture conditions demonstrated a stimulation of aflatoxin production with increased well occupancy independent of pH buffer, moisture, or isolate. However, even with all wells inoculated, aflatoxin production was less in interior wells. Only one isolate stimulated aflatoxin production in a large Petri-dish format containing eight small Petri dishes with shared headspace. Other isolates consistently inhibited aflatoxin production when all eight Petri dishes were inoculated with A. flavus. No contact between cultures and only shared headspace implied the fungus produced inhibitory and stimulatory gases. Adding activated charcoal between wells and dishes prevented inhibition but not stimulation indicating stimulatory and inhibitory gases are different and/or gas is inhibitory at high concentration and stimulatory at lower concentrations. Characterizing stimulatory and inhibitory effects of gases in A. flavus headspace as well as the apparently opposing results in the two systems deserves further investigation. Determining how gases contribute to quorum sensing and communication could facilitate managing or using the gases in modified atmospheres during grain storage to minimize aflatoxin contamination.
Introduction
Aspergillus flavus is an ascomycete fungus that impacts agriculture, public and environmental health due to production of acutely toxic, carcinogenic aflatoxins in oil seed crops (Diener et al., 1987; Wicklow, 1991; Horn, 2003). Aflatoxins are toxic to humans and most animals including mammals, fish, and insects (Diener et al., 1987; Wicklow, 1991; Horn, 2003). Peanuts and corn are especially prone to aflatoxin contamination in tropical and sub-tropical climates (Diener et al., 1987; Wicklow, 1991; Horn, 2003). Aflatoxin production is favored in developing seeds infected with A. flavus when crops experience heat and drought stress (Diener et al., 1987; Wicklow, 1991; Horn, 2003).
The ecological function of aflatoxin production in both the soil and phytobiome is not fully understood. Several exogenous factors influence aflatoxin production including: light, pH, water activity, reactive oxygen species (ROS), nitrogen, inorganic, and organic salts etc. (Joffe and Lisker, 1969; Brakhage, 2013; Roze et al., 2013; Woloshuk and Shim, 2013). It is suggested aflatoxin synthesis provides catalase and ROS consumption activity which increases tolerance to oxidative stress from plants during the infection process and under drought conditions (Fountain et al., 2015; Roze et al., 2015). Strains of A. flavus without aflatoxin production capabilities (atoxigenic) are also tolerant of H2O2 oxidative stress and are commonly isolated from plants, demonstrating aflatoxin is not necessary for infection (Diener et al., 1987; Wicklow, 1991; Horn, 2003; Abbas et al., 2005; Giorni et al., 2007; Atehnkeng et al., 2008; Sweany et al., 2011; Fountain et al., 2015) and A. flavus may have other mechanisms to limit oxidative stress during plant tissue invasion.
Aflatoxin is toxic to insects and may be important for competition against insects in both the soil and plant ecosystems (Zeng et al., 2006; Rohlfs and Obmann, 2009; Drott et al., 2017). Aflatoxin is toxic to Drosophila spp. (Rohlfs and Obmann, 2009; Drott et al., 2017), though some species are less sensitive to aflatoxin (Rohlfs and Obmann, 2009). Greater aflatoxin production in the presence of drosophila larvae and additional growth of both toxigenic and atoxigenic A. flavus due to greater larval mortality from supplemental aflatoxin suggest aflatoxin production gives a competitive advantage to the fungus in the enotomopathogenicity vs. fugivory interaction (Drott et al., 2017). In contrast, aflatoxin has limited effects on potential insect vectors that typically occupy similar plant niches as A. flavus (Zeng et al., 2006; Drott et al., 2017). Maize weevils are not killed by aflatoxin (Drott et al., 2017). Both toxigenic and atoxigenic A. flavus kill corn earworm larvae within a day (Poole and Damann, unpublished data). High concentrations of aflatoxin kill corn earworm larvae (Zeng et al., 2006), but in the presence of several plant compounds larvae produce cytochrome P450 monooxygenases that detoxify aflatoxin (Zeng et al., 2007; Niu et al., 2008). The ecological relationships between insects, aflatoxin production, fungal fitness, entomopathogenicity, and plant are complex with evidence of both toxicity to insects and evolving mechanisms to limit toxicity.
Aflatoxin is speculated to be important for survival in soil microbial communities. Aflatoxin is toxic to some common soil gram+ bacteria including Bacillus, Streptomyces, and Nocardia spp., but has limited toxicity to several fungi and other gram+ and gram− bacteria (Burmeister and Hesseltine, 1966; Arai et al., 1967). Volatiles produced by Aspergillus nidulans both stimulate and reduce aflatoxin production in Aspergillus parasiticus (Roze et al., 2007). Volatiles emitted from the soil-borne plant pathogenic bacterium Ralstonia solanacearum induce chlamydospore production and increase aflatoxin production (Spraker et al., 2014). Intensive research investigated the ability of atoxigenic A. flavus strains to competitively exclude toxigenic strains from crops and reduce aflatoxin contamination (Cotty, 1990; Brown et al., 1991; Dorner et al., 1992). Several lines of evidence indicate that there is inhibition of aflatoxin production, but the chemical/biochemical interaction is still not understood (Wicklow, et al. 2003; Mehl and Cotty, 2010; Abbas et al., 2011; Huang et al., 2011). Altering the concentration of conidia in culture modulates aflatoxin production in a density dependent manner similar to quorum sensing in bacteria (Clevström et al., 1983; Brown et al., 2009; Affeldt et al., 2012). At lower concentrations 103 conidia/ml medium, A. flavus produces sclerotia, aflatoxin, and limited conidia, in contrast at higher concentrations 107 conidia/ml medium, A. flavus shifts from sclerotial to dense conidial production and lower aflatoxin production (Brown et al., 2009; Affeldt et al., 2012). Deletion of oxylipin-generating dioxygenase genes, especially ppoC, restores sclerotial production at high inoculum densities and maintains aflatoxin production implicating oxylipins in the quorum sensing developmental shift (Brown et al., 2009; Affeldt et al., 2012). Cessation of aflatoxin production at higher conidial concentrations, suggests that aflatoxin is more important to survival of A. flavus at a low population. At low population sizes, there is more competition from surrounding microbes but as the population increases and A. flavus successfully colonizes the soil habitat there is less need to produce toxin presumably to compete with other organisms. Alternatively when fewer conidia are present, fewer colonies occupy the same space which results in better hyphal development and colony establishment potentially leading to secondary metabolism and sclerotization.
Initial experiments to determine if there is density-dependent stimulation of aflatoxin production from gases produced by the fungus within 24-well plates found no statistical differences in aflatoxin production if A. flavus grew in 6, 12, 18 or 24 wells, though there was a small increase that coincided with an increase in the number of wells with A. flavus. However if either 12, 24, 36 or 48 wells were inoculated with a single strain of A. flavus in 48-well plates, no aflatoxin was produced when A. flavus grew in only 12-wells, but ∼1000, 1500, and 2500 ppb aflatoxin B1 was produced if 24, 36 or 48 wells were inoculated, respectively. Therefore, a series of experiments was conducted to determine if there is a density-dependent stimulation of aflatoxin production in A. flavus. Evidence is presented that volatile chemicals produced during growth of A. flavus both stimulate and inhibit aflatoxin production in a location and density-dependent manner. Understanding the volatile interactions between A. flavus has the potential to improve grain storage either by removing stimulatory compounds or modifying the atmosphere with inhibitory gases.
Materials and Methods
Fungal Isolates
Several different experiments employed A. flavus isolates 53, Tox4 and Af70s. All isolates produce both aflatoxin B1 and B2, but do not produce any G toxins. Isolate 53 was isolated from corn in Louisiana in 2003 and produces large sclerotia >400 μm (Huang et al., 2011). Tox4 (syn. 07-C-1-1-1) was isolated from corn in 2007, rarely produces large sclerotia and belongs to the same vegetative compatibility group as isolate 53 (Sweany et al., 2011). Af70s was isolated from a cotton field soil in Arizona and produces small sclerotia <400 μm (Cotty, 1989). Tox4 and 53 are both Mat1-2 and Af70s is Mat1-1. All isolates were stored in 50:50 glycerol: water vol/vol at −20°C at Louisiana State University. Af70s was acquired from the USDA-SRRC fungal collection in New Orleans and 53 and Tox4 are deposited in the collection. For each experiment, a fresh batch of conidia grew on 5% V8 agar (pH 5.2) for 5 days and harvested in 2 mL of water by dislodging them with a glass rod.
Media
Liquid glucose salts (L) medium contained: 3.5 g (NH4)2SO4, 750 mg KH2PO4, 350 mg MgSO4⋅7H2O, 75 mg CaCl2⋅2H2O, 10 mg ZnSO4⋅7H2O, 5 mg MnCl2⋅4H2O, 2 mg NH4Mo7O24⋅4H2O, 2 mg Na2B4O7⋅10H2O and 2 mg FeSO4⋅7H2O and 50 g D-glucose per liter (Wicklow et al., 2003). The salts solution and glucose were autoclaved separately. Citrate buffer (0.053 M citric acid and 0.027 M sodium citrate) was added to medium (L-buffered) to buffer at pH4, maximize aflatoxin production, minimize degradation and prevent extreme acidification of medium to less than 2 (Doyle and Marth, 1978a, b; Cotty, 1988). Agar (2% wt/vol) was added to either non-buffered (S) or buffered (S-buffered) glucose salts medium.
Examination of A. flavus Well Occupancy Effects on Aflatoxin Production
A series of experiments investigated stimulation and inhibition of aflatoxin production by gases produced from increasing the number of A. flavus cultures in 48-well plates (a closed system). To rule out possibilities other than gaseous production by A. flavus, culture conditions were manipulated within 48-well plates.
(A) Initial experimental design (Figure 1). To determine if the number of cultures within a closed system alters aflatoxin production of an individual strain, within four Costar flat bottom 48-well plates (3548 Corning, New York, NY, United States) either 12, 24, 36 or 48 wells were filled with 500 μl 1 × 10⁵ A. flavus 53 conidia/ml L-buffered glucose-salts medium; the other wells remained empty. 48-well plates consisted of 8 columns with six wells. All wells within either columns 1 and 5; 1, 4, 5, and 8; 1, 2, 4, 5, 6, and 8 or all 8 columns were filled with inoculated medium. Fungal colonies within wells were considered independent samples because the fungus and medium did not have contact with other wells and therefore should be independent resulting in either 12, 24, 36 or 48 replicated samples per plate. Individual wells (11.3 mm diameter) were attached to neighboring wells but separated by well walls with 1 mm thickness. The 48-well plates were wrapped in Parafilm, placed in individual boxes atop two wet paper towels and incubated for 4 days in the dark at 25°C. The fungus produced hyphal mats that primarily grew 0–3 mm on and below the medium-air interface. Aflatoxin was extracted from individual wells by mixing 240 μl of remaining medium below the hyphal mat with 240 μl acetonitrile. Aflatoxin B1 was quantified with HPLC as described below. To determine if the differences in aflatoxin production were due to gases produced by the fungus or culture conditions, several questions were investigated as follows:
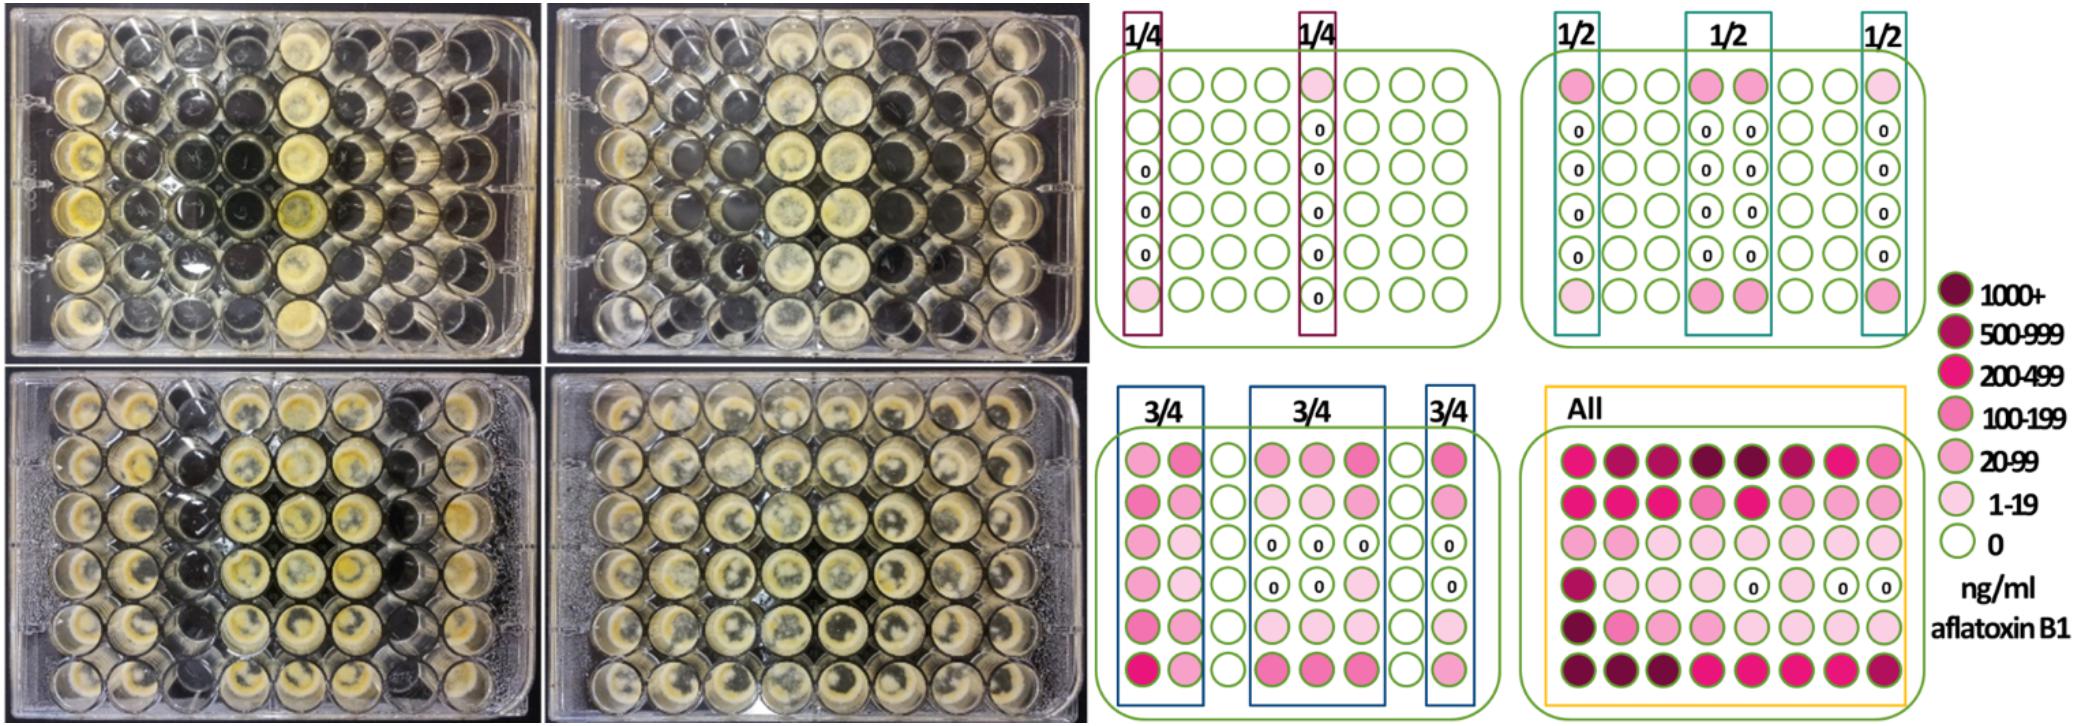
Figure 1. Number of inoculated wells and well-location changed aflatoxin production by Aspergillus flavus. 48-well plates were inoculated with a single isolate 53 of A. flavus in the four arrays depicted. Centrally located wells produced more conidia and growth appeared less dense when all wells were inoculated. Aflatoxin production was less in the interior wells and greatest when all wells were inoculated with A. flavus.
(B) Does the lack of fungus and/or medium in empty wells cause the changes in aflatoxin production, i.e., do volatiles released from additional medium or fungal growth change aflatoxin production? Since there were empty wells in the initial experimental design, all non-inoculated wells were filled with L-buffered medium. As in the first experiment, either 12, 24, 36 or 48 wells were filled with 500 μl 1 × 10⁵ A. flavus 53 conidia/ml L-buffered medium, but now the remaining wells were filled with L-buffered medium. Plates were incubated for 4 days and aflatoxin extracted as described above. Aflatoxin B1 was quantified by HPLC as described below.
(C and D) Does solidified medium minimize the differences between wells? Agar was added to the medium to minimize 20–40 μl moisture loss in exterior wells and determine if differences in aflatoxin production were in response to more fungal growth within a closed system or moisture loss. All wells were filled with 500 μl of either S-buffered or non-buffered S-medium. As described above, either 12, 24, 36 or 48 wells were center-point inoculated with 1.25 × 10⁷ A. flavus 53 conidia/ml in 1 μl. Plates were incubated for 4 days as above. To extract aflatoxin, medium and spores from each well were placed in a screwtop 3.7 ml glass vial filled with chloroform and incubated overnight in a fume hood. The chloroform was filtered through Whatman filter paper and evaporated overnight. The aflatoxin was resuspended in 0.5 ml of 80:20 vol/vol methanol: water and then mixed with 0.5 ml acetonitrile. Aflatoxin B1 was quantified by HPLC as described below.
(E and D) Are the differences in aflatoxin production maintained without citrate pH buffer? Since citric acid is an important component of metabolism (Buchanan et al., 1985), 53 was grown in both S and L non-buffered medium. As described in (A), A. flavus suspended in liquid glucose salts medium was grown in 12, 24, 36 or 48 wells of 4–48 well plates without medium in non-inoculated wells. Additionally, all wells of 5th 48-well plate were filled with L-medium but only 12 wells contained conidia. The design for non-buffered S-medium was described in (C and D). Plates were incubated for 4 days and aflatoxin extracted as described above. Aflatoxin B1 was quantified by HPLC as described below.
(F) Does reducing airflow with Parafilm remove differences between wells? To reduce exchange or release of chemicals from individual wells, all wells of a 48-well plate where filled with 500 μl 1 × 10⁵ A. flavus 53 conidia/ml L-buffered medium. Four layers of Parafilm was placed flush atop the wells, the lid placed on top, wrapped in Parafilm, incubated for 4 days and aflatoxin extracted as described above. Aflatoxin B1 was quantified by HPLC as described below.
(G) Does adsorbing gases to activated charcoal remove differences between wells? Activated charcoal was pipetted in the spaces between the wells filled with buffered L-medium. As in the second experiment, either 12, 24, 36 or 48 wells were filled with 500 μl 1 × 10⁵ A. flavus 53 conidia/ml L-buffered medium; the remaining wells were filled with L-buffered medium. Plates were incubated for 4 days and aflatoxin extracted as described above. Aflatoxin B1 was quantified by HPLC as described below.
(H and I) Does changing the isolate change the influence of the number of cultures on aflatoxin production? To determine if alteration in aflatoxin production due to changing the number of wells with A. flavus was isolate specific; a second isolate, Af70s was used. Either 12, 24, 36 or 48 wells were filled with 500 μl 1 × 10⁵ A. flavus Af70s conidia/ml L-buffered medium; wells without conidia were either empty (H) or filled with L-buffed medium (I). Plates were incubated for 4 days and aflatoxin extracted as described above. Aflatoxin B1 was quantified by HPLC as described below.
Rationale for Staggered Experiments
The above experiments were conducted serially due to incubator and sample processing constraints. The incubator could easily accommodate four plates in individual boxes and up to eight plates. Four plates consisted of 120 samples. Aflatoxin B1 slowly degraded in the samples. To avoid confounding effect of aflatoxin degradation, only single variables were manipulated at a given time and compared to the first experiment A. The HPLC machine became irrepairable, therefore experiments in 48-well plates were not repeated and changing to a different pH buffer was not possible. Experiment A was repeated and the results were similar.
Examination of A. flavus Petri-Dish Occupancy on Aflatoxin Production
Though the chances of chemical diffusion between the wells is low, independent interior wells within 48-well have 4-(2 mm deep by 3 mm long) junction points. A method employed to investigate the influence of volatile production by A. nidulans on A. parasiticus was modified (Roze et al., 2007) to determine if gases produced by A. flavus grown in separate Petri-dishes with shared headspace affect aflatoxin production. Eight open 35 mm wide small Petri-dishes (Falcon 351058, Corning, New York, NY, United States) were nestled within a larger 150 mm diameter Petri-dish separated by ∼2 mm. All small Petri-dishes were filled with 4 ml of non-buffered S-medium. Either 1, 4 or 8 plates were center point inoculated with 1 μl of 1 × 10⁸ conidia/ml of a single A. flavus isolate and the large dish was wrapped in two layers of Parafilm. Each inoculated dish was considered an independent sample and the experiment was replicated three times resulting in either 3, 12 or 24 replicated samples per condition. The dishes were incubated for 5 days at 25°C in the dark. Initially only isolate 53 was used. Aflatoxin was extracted from each plate by combining solid medium and spores in a 20 ml scintillation vial with chloroform and incubated overnight in a fume hood. The chloroform was filtered through Whatman filter paper and evaporated overnight. The aflatoxin was resuspended in 0.5 ml of 80:20 vol/vol methanol: water and then mixed with 0.5 ml acetonitrile. Aflatoxin B1 was quantified by HPLC as described below.
Three grams of activated charcoal was added to the bottom of the large Petri dishes to adsorb volatile gases produced by A. flavus. Three different isolates (53, Tox 4 and Af70s) were independently center-point pipetted onto either 1, 4 or 8 plates with and without activated charcoal added to the base of the large dish and all treatments were replicated three times. Dishes were incubated for 5 days and aflatoxin extracted as described above. Aflatoxin B1 was quantified by HPLC as described below.
Aflatoxin B1 Quantification
All extracts were filtered through 1.5 ml polypropylene columns with 20 μm polyethylene frits, packed with 200 mg basic aluminum oxide (58Å, 60-mesh powder, 11503-A1, Alfa Aesar, Tewksbury, MA, United States) into an auto-sampler vial (Sobolev and Dorner, 2002). The aflatoxin was quantified with reversed-phase high performance liquid chromatography using a Summit HPLC System (Dionex Corporation, Sunnyvale, CA, United States) with a P580 pump, ASI-100 automated sample injector, RF2000 fluorescence detector, and Chromeleon software version 6.20 (Joshua, 1993). A post-column derivatization step was conducted by exposing the extract to a UV light in a PHRED cell (Aura Industries Inc., New York, NY, United States) (Joshua, 1993). The mobile phase was 22.5 parts HPLC grade methanol: 22.5 parts HPLC grade acetonitrile: 55 parts distilled water mixture at 1 ml/min. The stationary phase was a Syncronis C18, 3 × 150 mm long column (Thermo Fisher Scientific Inc., Waltham, MA, United States). Aflatoxin B1 was detected at 11.8 min and quantified by Chromeleon software using to pure 1, 10, 100, and 1000 ng aflatoxin B1/ml standards.
Data Analysis
Aflatoxin B1 means and standard error were calculated using Excel (Microsoft Corp., Redmond, WA, United States). Statistical analysis was conducted using SAS version 9.4 (SAS Institute, Cary, NC, United States). In the 48-well plates, individual wells were considered the sampling unit; n = 1020 across all individual experiments (including the different isolates). To partition the variance and account for heterogeneity within single 48-well plates, wells belonging to rows A and F (outter-most), B and E (intermediate) or C and D (inner-most) were treated as reps (4 reps/row location for 12 inoculated wells, 8 reps for 24, 12 reps for 36 and 16 reps for 48 inoculated wells within individual 48-well plates). Linear models approximated MANOVAs using proc Mixed. For the 48-well plate experiments, three full models were evaluated. The first model assessed the fixed categorical effects: media (L and S-medium and L and S- buffered medium), isolate (53 and Af70s), well location (rows A and F, B and E, and C and D), and number of inoculated wells (12, 24, 36 or 48) on log (aflatoxin concentration +1). A second full model assessed the fixed categorical effects activated charcoal, number of inoculated wells and location on log (aflatoxin concentration +1). The final full model tested the fixed categorical effects of Parafilm and location on aflatoxin concentration. Interactions between fixed effects were statistically significant if the p-value of F-test for type III fixed effects was less than 0.05. Due to significant interaction terms of full models, separate MANOVAs were calculated for each of the 48-well plate experiments described above (A–I) with fixed effects of well location and number of inoculated wells on log (aflatoxin +1). For the Petri-dish design two models were conducted. Individual Petri dishes were considered the sampling unit and each experiment was replicated three times. An initial model for isolate 53 accessed the fixed effects of location and number of inoculated dishes (1, 4 or 8) on aflatoxin concentration (n = 39). A second full model assessed the fixed effects of number of inoculated plates, strains (Tox4, 53 and Af70s) and activated charcoal on aflatoxin (n = 234). Due to significant interaction terms, separate MANOVAs by isolate were calculated. Post hoc comparison of means were calculated using Tukey-Kramer adjusted means and considered different if the p-value was 0.05 or less. Where appropriate, aflatoxin values were adjusted to log (toxin +1) to meet the assumption of normality.
Results
Neighbors and Well-Location Alter Aflatoxin Production
Aspergillus flavus colony morphologies and aflatoxin production differed both when the number of neighboring wells within 48-well plates filled with isolate 53 conidia (in liquid buffered glucose salts medium i.e., L-buffered medium) and well-location changed (Figure 1). Mycelial and conidial production appeared less dense when A. flavus grew in all 48 wells especially in comparison to growth of A. flavus in 12 wells. This contrasted with a stimulation of aflatoxin production (Table 1, A). Increasing the number of wells with A. flavus stimulated aflatoxin production by as much as 900 ppb produced if A. flavus grew in all 48 vs. 12-wells. Regardless if grown in 12 to 48 wells, A. flavus in centrally located wells produced more conidia. In contrast to gain of conidial production, aflatoxin production was inhibited in the interior wells.
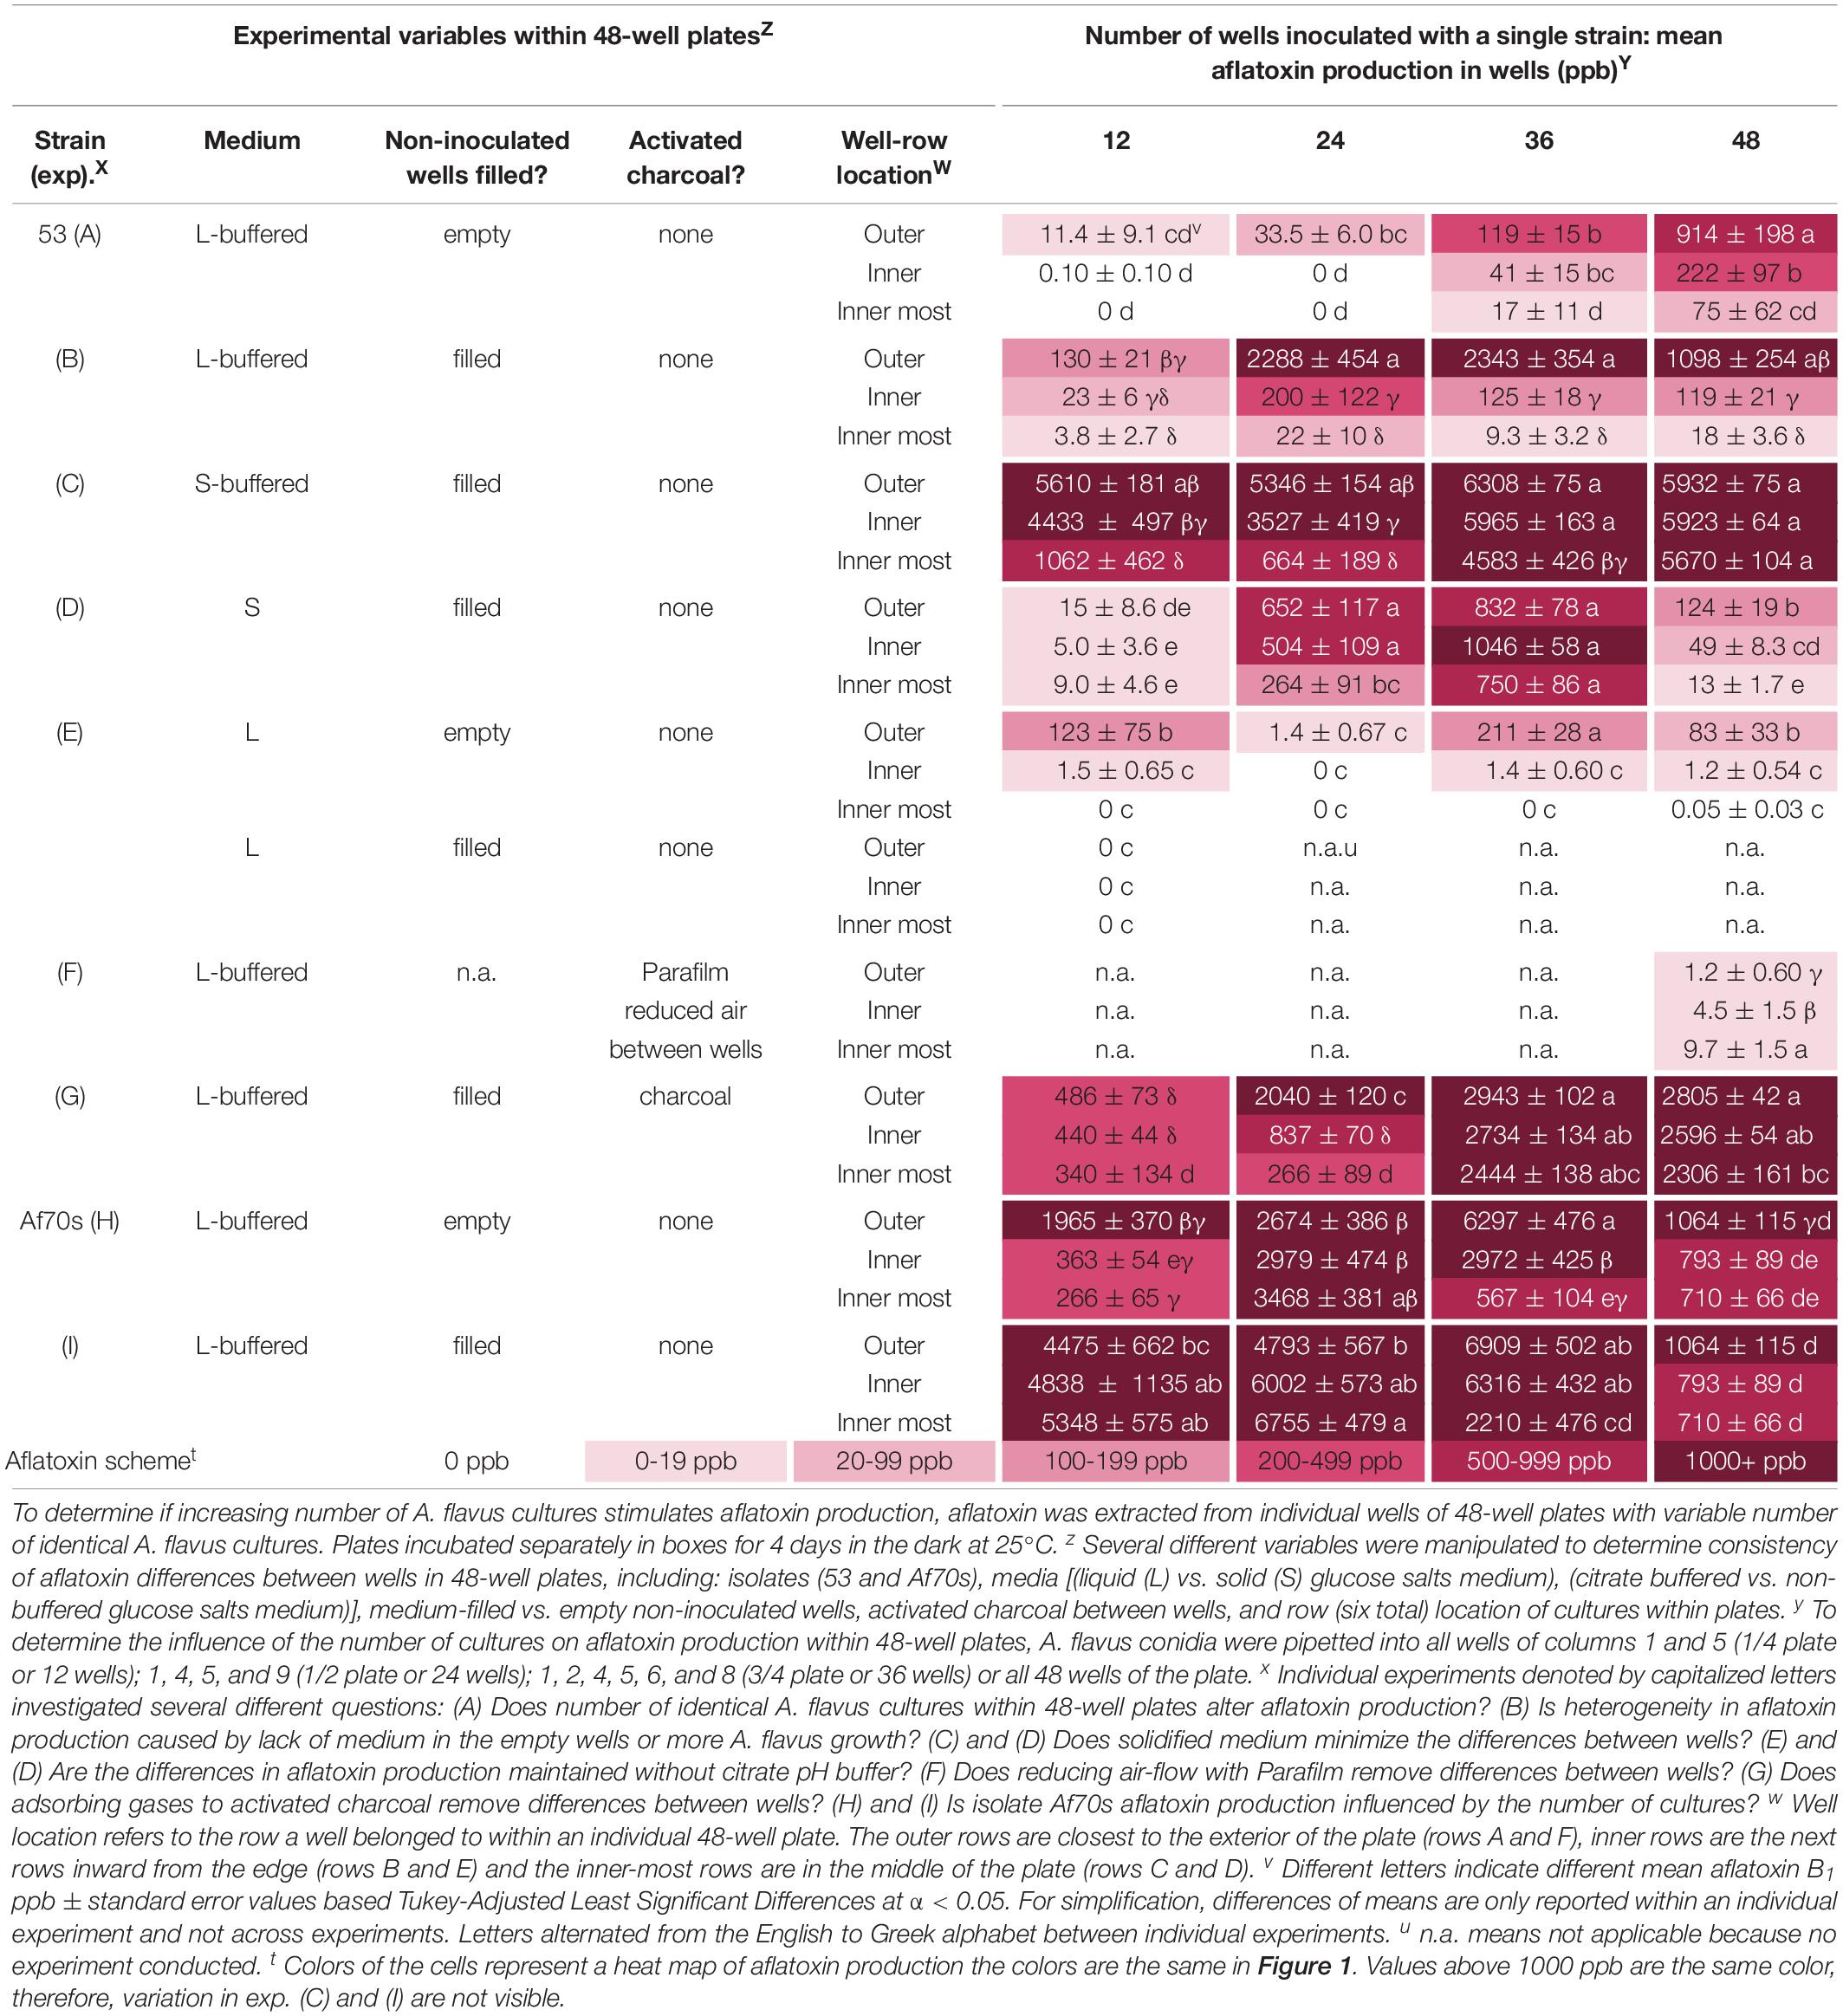
Table 1. Variable aflatoxin production within and between single isolates grown in individual wells of 48-well plates.
Filling Empty Wells Does Not Alter Location and Neighbor Effect
Overall, filling the non-inoculated wells with medium resulted in higher levels of aflatoxin production, which was most pronounced in the outer wells (Table 1, B). Regardless, inoculating more wells with A. flavus still stimulated aflatoxin production by at least 2000 ppb if more than 12 wells were inoculated, suggesting volatiles from both the identical fungal cultures and buffered liquid medium stimulated aflatoxin production. The addition of medium did not change the location effect; aflatoxin production was inhibited substantially within the interior wells, suggesting volatiles from the fungus (not additional medium) also inhibited aflatoxin production within the center of the plates.
Solid Medium Can Minimize Location and Neighbor Effect
Overall, A. flavus produced more aflatoxin on solidified medium. Growth on S-buffered medium minimized the location effect when all wells were inoculated, but not when 12 or 24 were inoculated (Table 1, C & D). The location effect was still pronounced on non-buffered S-medium, with the exception of 36 inoculated wells. Increasing the number of inoculated wells on both S-media stimulated aflatoxin production. On S-buffered medium, more inoculated wells resulted in a minimal increase in aflatoxin production, though in the innermost wells there was still a trend for increasing aflatoxin production. On non-buffered S-medium, there was an overall increase of 865 ppb as the number of inoculated wells increased from 12 to 36, followed by a decrease when all 48 wells were inoculated. Controlling for moisture loss with agar did not completely remove interior inhibition and stimulation by neighbors which suggests fungal volatiles also contribute to these effects.
Buffering pH Enhances the Response to Neighbors but Not Location
Removing the citrate pH buffers decreased the sensitivity to neighboring colonies only in L-medium and did not change the location effect. The pH decreased from 4 to 2 in the non-buffered L-medium, which coincided with less aflatoxin, sparse mycelia and conidial production compared to buffered L-medium. There was an inconsistent aflatoxin response to the number of wells inoculated with A. flavus in liquid medium (Table 1, E). Regardless, the highest aflatoxin production within an individual well (473 ppb) occurred when all 48 wells were inoculated. On S-medium (Table 1, D), removing pH buffers did not alter the stimulatory effect of neighboring cultures. Aflatoxin production was smallest in the interior of plates on both non-buffered media.
Minimizing Gas Exchange Limits Differences and Aflatoxin Production
Aflatoxin levels were essentially zero in all the wells when 4-layers of Parafilm were placed across the tops of the wells to reduce air exchange (Table 1, F). This was a stark contrast to 900 ppb aflatoxin production in the exterior rows with no Parafilm. In addition to minimal aflatoxin production, the location effect was lost, and when Parafilm was used there was slightly more aflatoxin production in the interior wells. Limiting gas exchange between wells removed both the stimulation caused by more inoculated wells and the inhibition in the interior of the plate.
Activated Charcoal Removes Inhibitory Gas(es)
Addition of activated charcoal between the wells of 48-well plates to adsorb volatile compounds resulted in an overall increase in aflatoxin production (Table 1, G). Regardless of stimulation by volatile adsorption, aflatoxin was further stimulated if A. flavus grew in more than 24 wells. With the exception of 24 inoculated wells, there was no longer a significant loss of aflatoxin production in the interior wells of the 48-well plates. The inhibition of aflatoxin production in the interior of the plate was 30% (12 wells), 90% (24 wells), 17% (36 wells), and 18% (48 wells) when activated charcoal was placed in between the wells, whereas if no activated charcoal was added the inhibition in the interior was 97, 99, 99, and 98% indicating the activated charcoal removed an inhibitory volatile compound.
Neighbors and Location Also Affect Af70s
A second isolate Af70s increased aflatoxin production as the number of inoculated wells increased from 12 to 36 wells by 2–4000 ppb (Table 1, H & I) regardless of whether the non-inoculated wells were empty or filled with buffered L-medium. Inoculation of all wells resulted in a reduction in aflatoxin production. Af70s produced more aflatoxin than isolate 53. The location effect changed for Af70s. Aflatoxin production increased in the interior of the plate when 12 or 24 wells were inoculated, but decreased in the interior of the plate when 36 and 48 wells were inoculated. More inoculated wells stimulated aflatoxin production regardless of isolate, but the location effect was different between strains.
Location Effect Is Design Dependent
Neighboring wells are actually attached; there was a chance chemicals can permeate and pass between the polystyrene wells, though not likely due to 2 mm thick plastic at the junction points. A second experimental design did not allow the culture containers (small Petri dishes) to touch physically (Figure 2). In the previous design, cultures were separated by 2 mm and each culture completely filled the 11.3 mm diameter wells. The second design, 35 mm Petri dishes were separated by only 1–2 mm and colony diameters were approximately 20 mm after 5 days growth. Aflatoxin production increased as the number of dishes with isolate 53 increased from 1 to 4 by 200 ppb, followed by a decrease when eight dishes were inoculated, indicating the stimulatory and inhibitory effects were likely a response to gases emitted from the fungus (Figure 2). Unlike within the 48-well plates, Petri dish location did not significantly alter aflatoxin production, although there were fewer locations to analyze (p = 0.592).
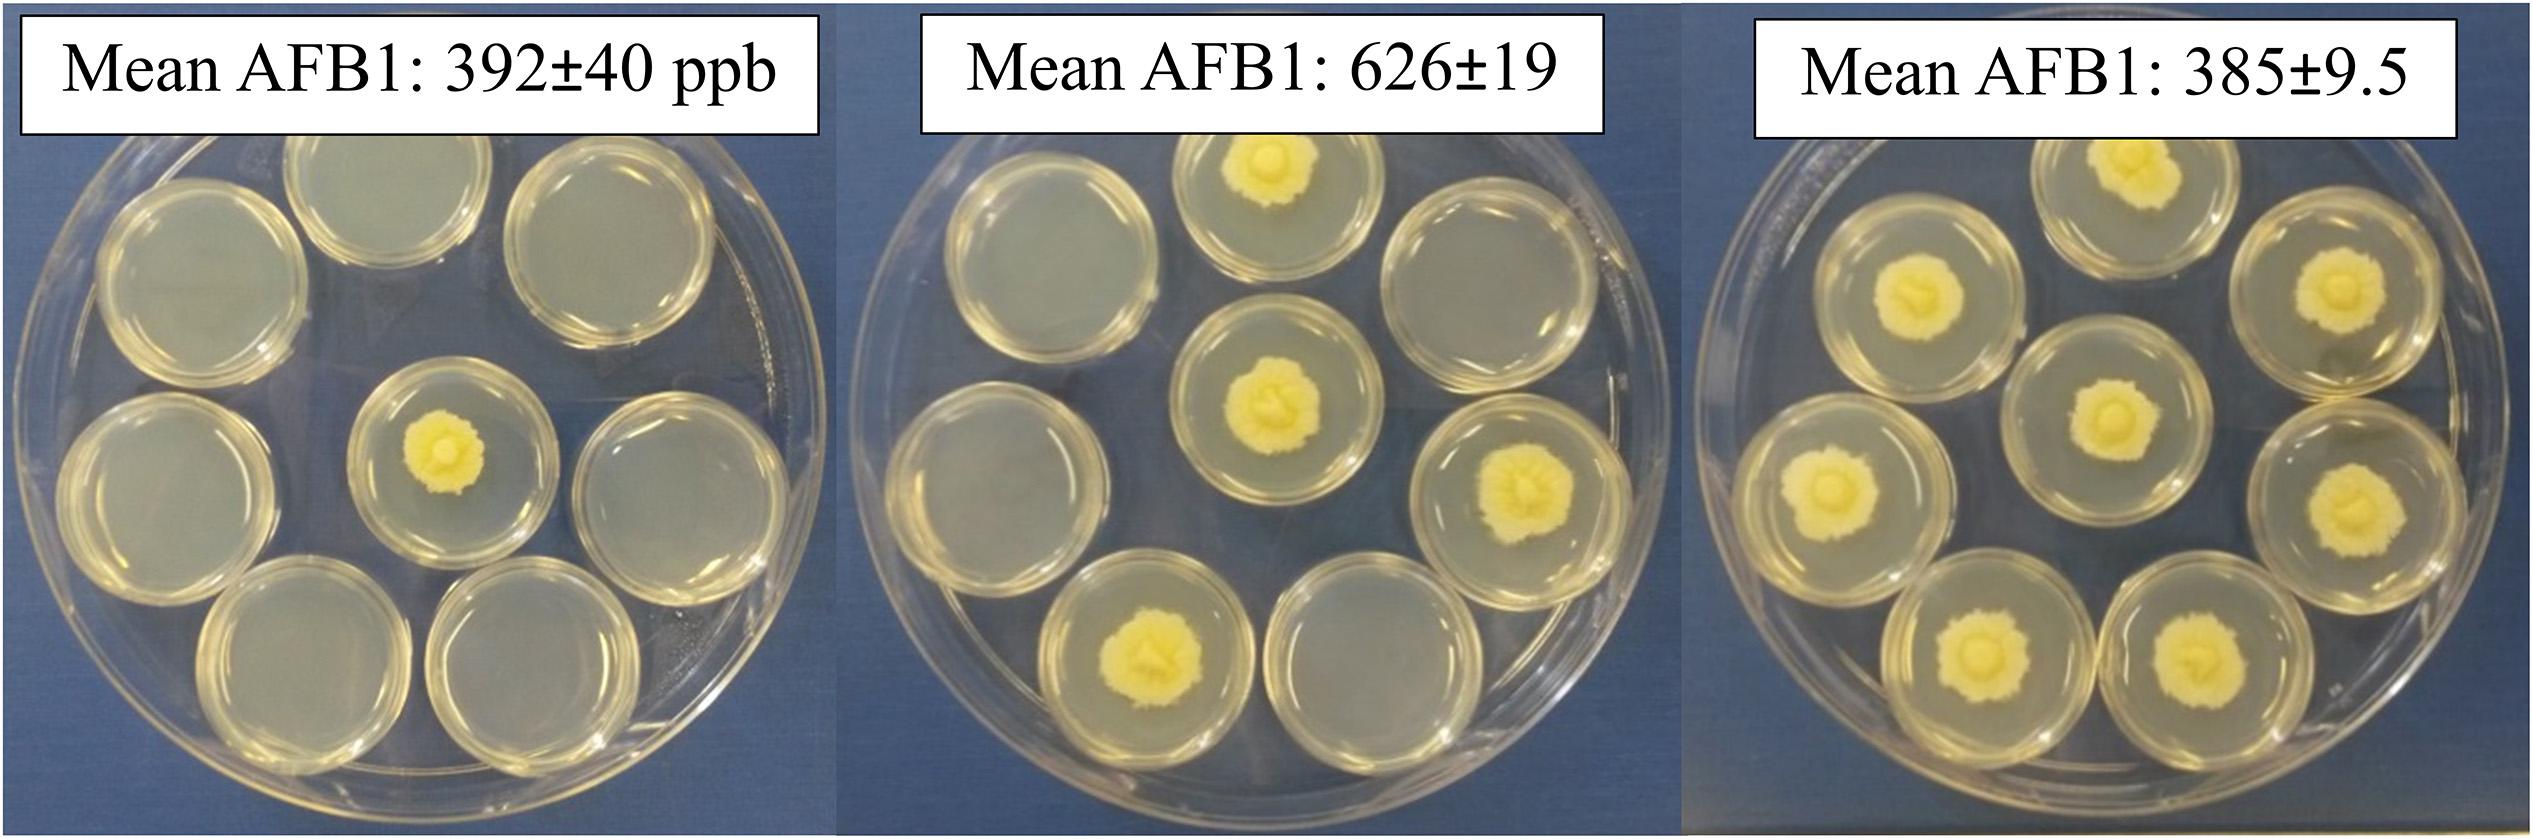
Figure 2. Changing the number of inoculated open Petri-dishes within a closed dish alters aflatoxin production. Either 1, 4 or 8 small Petri-dishes were center-point inoculated and enclosed in a larger dish. All produced similar colonies with dense hyphal growth and minimal conidia; occasionally aerial hyphae could be observed for those with eight inoculated dishes.
Adding activated charcoal to the larger Petri-dish significantly increased aflatoxin production by at least 1000 ppb (Table 2). Unlike the previous experiment, there was only a marginal increase (75 ppb) in aflatoxin when four compared to one dish inoculated with isolate 53 and no activated charcoal used, but aflatoxin production still significantly decreased when all eight dishes were inoculated. Aflatoxin production if eight dishes were inoculated was restored to same amount as if one or four dishes were inoculated when activated charcoal was added to the large Petri-dish, suggesting an inhibitory volatile compound produced by the fungus was adsorbed by the activated charcoal.
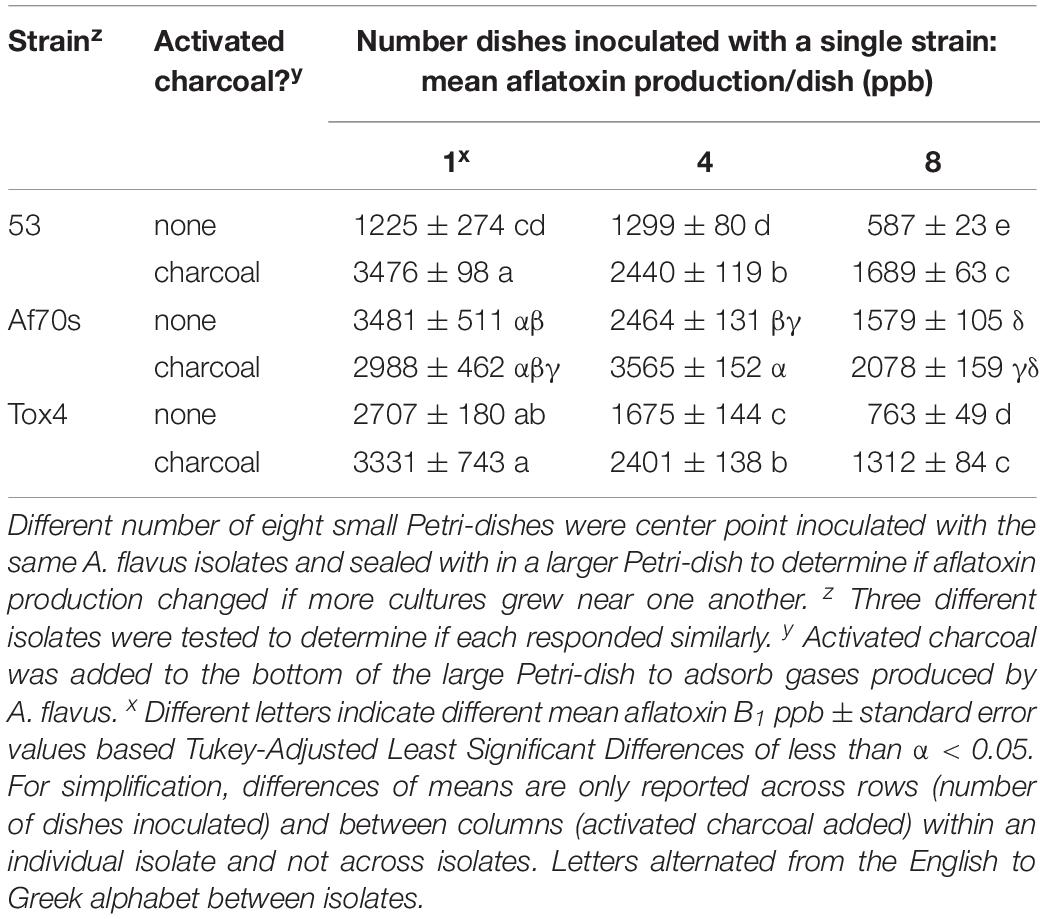
Table 2. Variable aflatoxin production in 8-Petri-dish system.
Aflatoxin production decreased for Tox4 and Af70s as more dishes were inoculated with the fungus (Table 2). Both Tox4 and Af70s produced more aflatoxin than 53 with Af70s producing the most aflatoxin. For isolates Af70s and Tox4, adding activated charcoal resulted in an increase in aflatoxin and restored the aflatoxin production to the same amount as if three or four fewer plates were inoculated. Unlike 53 and Tox4, Af70s produced less, though not statistically significant, aflatoxin when activated charcoal was applied to the large dish with only one inoculated dish.
Common Themes
Across all the experiments in 48-well plates, inoculating more wells with A. flavus isolate 53 increased aflatoxin production consistently. The increase was independent of pH buffering, solidified vs. liquid medium and adsorption of volatile compounds by activated charcoal. Only preventing air movement between the wells with Parafilm lowered aflatoxin production. Inoculating more wells also stimulated aflatoxin production for isolate Af70s, but inoculating all 48 wells decreased aflatoxin production. The stimulation was isolate independent, in spite of the final inhibition. In the Petri-dishes, isolate 53 also stimulated aflatoxin production as the number of inoculated dishes increased, but inoculating all eight dishes inhibited aflatoxin production. Isolates Tox4 and Af70s only inhibited aflatoxin if more dishes were inoculated. For each strain, the addition of activated charcoal resulted in an increase in aflatoxin comparable to having three or four fewer inoculated Petri-dishes, suggesting the adsorption of an inhibitory volatile organic compound produced by the fungi.
The location of a well within 48-well plates changed the amount of aflatoxin production. Growth in the center of 48-well plates consistently reduced aflatoxin production independent of pH-buffer for strain 53. Addition of activated charcoal minimized differences between interior and exterior wells, suggesting the adsorption of inhibitory volatile compounds. Addition of agar to buffered medium (not filling empty wells with liquid buffered medium) also minimized the location effect, suggesting an interaction between matric potential and buffering capacity on inhibition. Location of isolate Af70s in the 48-well plates had a different effect on aflatoxin production. Inoculating a few wells increased aflatoxin production in the inner wells, but inoculating more wells decreased aflatoxin production in the inner wells. Location of the dishes within a larger Petri-dish did not affect aflatoxin production and this was consistent between strains.
Discussion
Neighboring colonies (or cultures) of identical A. flavus isolates grown within a closed system altered the aflatoxin production of one another in the absence of physical contact. Different responses occurred, either inhibition and or stimulation of aflatoxin production, which were attributable to growth of other A. flavus cultures, not culture conditions. By controlling different variables, results suggested different volatile organic compounds or inorganic gases likely contributed to the inhibition and stimulation of aflatoxin production. Understanding how these volatile interactions influence aflatoxin regulation, competition by A. flavus and aflatoxin accumulation both pre and post-harvest deserves further attention.
In general, the number of independent cultures of a single A. flavus isolate grown within a closed system altered the aflatoxin production within physically separated wells or petri-dishes. This was an interaction between genetically identical A. flavus changing aflatoxin production with only a shared headspace and without direct physical interaction or sharing the same medium suggesting heterogeneity in the gaseous environment from fungal growth altered aflatoxin production. Conidial concentration within either liquid or solid cultures regulates aflatoxin production in single A. parasiticus and A. flavus isolates, usually aflatoxin production decreases with increased concentration (Clevström et al., 1983; Brown et al., 2009; Affeldt et al., 2012). The decrease in aflatoxin production is associated with a developmental shift away from sclerotial production [sclerotia can serve as stromata for sexual ascospore production (Horn et al., 2009; Horn et al., 2016)] to increased asexual conidial production (Brown et al., 2009; Affeldt et al., 2012). This is similar to the inhibition observed by increasing the number of identical A. flavus cultures growing on small Petri-dishes with a shared headspace or the increase in culture density experienced in the center of 48-well plates, though there was only observed changes in conidial or sclerotial production within 48-well plates. In contrast, herein is reported a novel increase in aflatoxin production and decrease in conidia in response to increasing number of identical A. flavus cultures from 12 to 48 within 48-well plates with only shared headspace (i.e., more conidia in same space). Atoxigenic A. flavus can inhibit aflatoxin production if grown in the same medium (including corn) but only when there is direct contact with toxigenic isolates (Wicklow et al., 2003; Mehl and Cotty, 2010; Abbas et al., 2011; Huang et al., 2011). Neighboring Petri-dish cultures of both A. nidulans and R. solanacearum that share headspace with A. parasiticus and A. flavus affect aflatoxin production (Roze et al., 2007; Spraker et al., 2014). In closely related A. parasiticus, an increase in the number of Petri-dishes inoculated with A. nidulans inhibits aflatoxin production and conidiation of A. parasiticus within a closed larger Petri-dish (Roze et al., 2007). The inhibition is attributed to A. nidulans, but there is also a decrease in the number of dishes inoculated with A. parasiticus, perhaps some of the inhibition in toxin production could have been due to a lack of stimulation from neighbors of the same species (Roze et al., 2007). R. solanacearum grown in separate petri-dishes increases aflatoxin production in A. flavus (Spraker et al., 2014). Aflatoxin production is regulated by chemicals produced in media and released as gases from other members of the same isolate, other isolates of the same species, other Aspergilli and bacteria.
Culture-system design and to a lesser extent isolate altered the aflatoxin production response to A. flavus growing in close proximity to one another. On Petri-dishes mostly one phenomenon was observed, an inhibition of aflatoxin production as the number of cultures increased. In contrast, two contradictory phenomena were observed in 48-well plates. Increasing the number of cultures stimulated aflatoxin production, whereas cultures in the center of the plate inhibited aflatoxin production. The difference between wells in the center of 48-well plates vs. outer rows is similar to an edge effect, suggesting a gradient of volatile chemicals can alter the aflatoxin production potential of a colony. It would have been expected if volatiles from neighboring cultures stimulate aflatoxin production, both a stimulation from increasing the number of inoculated wells and in the center of plates (where extensively there is an increase in well density and build up of chemicals). Potentially those gases that are stimulatory become inhibitory at higher concentrations or there are both stimulatory and inhibitory gases produced and stoichiometrically more inhibitory gas molecules are produced or the fungus is more sensitive to the inhibitory gases. There were also two other seemingly contradictory phenomena, when non-inoculated wells were filled with liquid medium or agar was added to medium to control moisture loss, only solidified buffered medium minimized the location effect and number of culture effect. Potentially, adding agar not only controlled moisture loss, but also changed the matric potential of the medium and affected the ability of gases to be adsorbed into the medium and therefore minimized the effect of volatile gases on fungal growth. The different responses of 53, Af70s and Tox4 to neighbors is not surprising, since aflatoxin production, biocontrol capacity and volatile production varies among isolates (Cotty, 1989; Zeringue et al., 1993; Mehl and Cotty, 2010; Abbas et al., 2011; Huang et al., 2011; De Lucca et al., 2012). It deserves further review to determine if mixing isolates within 48-well plates or Petri-dishes alters aflatoxin production especially to determine if atoxigenic isolates’ volatiles can inhibit or stimulate aflatoxin production. Altering culture system design can alter aflatoxin production; A. flavus produces much less aflatoxin on bottom of stacks of dishes filled with peanuts (Xue et al., 2003). Spreading dishes on trays and adding spacers between trays and rotating trays during incubation ameliorates the location effect (Xue et al., 2003). All together these results suggest when screening for anti-fungal and anti-aflatoxin potential of compounds and fungi or genetic resistance it is essential to tailor culture systems that maximize phenotypic homogeneity among A. flavus cultures and minimizes the interaction caused by changes in the gaseous environment from fungal growth.
Since activated charcoal adsorbs both inorganic and organic gases, and adding activated charcoal resulted in greater aflatoxin production, it is likely A. flavus produced inhibitory volatile organic or inorganic compounds (Smíšek and Černý, 1967). The addition of activated charcoal to the bottom of Petri-dishes resulted in higher aflatoxin production and removed the inhibition from adding more cultures within the larger Petri-dishes. Activated charcoal also minimized the reduction of aflatoxin in the center of the 48-well plates. This suggests the same volatile chemicals could be responsible for the aflatoxin reduction in the 48-well plates and Petri-dishes. If the volatile chemicals are organic they may be related to the oxylipins or psi factors produced by A. flavus and A. parasiticus that have been reported to be responsible for quorum sensing and reduction of aflatoxin with increased inoculum concentrations (Brown et al., 2009; Affeldt et al., 2012). It is unknown if psi factors are volatile chemicals, but they are in the same biosynthetic pathway as methyl jasmonate, which may suggest volatility (Affeldt et al., 2012). In the interior rows of the 48-well plates, there was typically more conidial production and those conidia were greener than the outer rows, which is consistent with the psi-factor quorum sensing phenotype changes (Brown et al., 2009; Affeldt et al., 2012). Other possible organic volatiles have been demonstrated to lower aflatoxin production in A. flavus and A. parasiticus include: ethylene (from A. nidulans and A. parasiticus), trans-2-hexanol (from soybean), and at high concentrations 2-buten-1-ol (from A. nidulans) (Roze et al., 2004, 2007; De Lucca et al., 2011). Inorganic CO2, H2O, and O2 gases involved in respiration would likely be adsorbed to activated charcoal. High levels of CO2 (20%+) have been demonstrated to dramatically lower aflatoxin production, but lower levels at 3% can be a stimulatory (Davis and Diener, 1968; Sanders et al., 1968; Roze et al., 2004). In addition, reduction in O2 below atmospheric levels can reduce aflatoxin production but the magnitude is not as great as the increase in CO2 (Davis and Diener, 1968; Clevström et al., 1983; Ellis et al., 1993). The effect of H2O, either as buildup of free moisture or moisture loss should have been controlled by filling non-inoculated wells or using solidified medium, respectively. There was more aflatoxin production on solidified medium, but there was still inhibition in the interior of 48-well plates and if more Petri-dishes were inoculated. Additionally there was limited change in aflatoxin production in the interior of 48-well plates if non-inoculated wells empty or filled with liquid medium. Consistent inhibition during experiments to control H2O suggest volatilized H2O was not solely responsible for the aflatoxin production inhibition. In both the 48-well plates and Petri-dishes, addition of activated charcoal did not fully restore the aflatoxin production to the highest aflatoxin level, this suggests either the adsorption of the activated charcoal was not sufficient to collect all of the inhibitory organic compound(s), or other gases are involved in the reduction in aflatoxin production.
Stimulation of aflatoxin production by increasing the number of cultures within the 48-well plates could not be attributed to any of the environmental variables manipulated. Stimulation was not eliminated by controlling pH, controlling moisture loss (by switching from liquid to solid medium or filling un-inoculated wells with liquid medium) or adsorbing volatile chemicals. Only covering with Parafilm, which presumably blocked exchange of gases between wells, prevented a stimulation of aflatoxin production. Although Parafilm could just as easily have trapped the volatile inhibitory substance. It is unlikely the stimulation was caused by changes in gases involved in respiration or large volatile organic compounds because activated charcoal readily adsorbs O2, CO2, and H2O and complex organic gases (Smíšek and Černý, 1967). Water is a gaseous product of respiration that could lead to stimulation in aflatoxin production, though this is inconsistent (Davis and Diener, 1968; Sanders et al., 1968; Ellis et al., 1993; Schmidt-Heydt et al., 2009). Changing to solid medium, filling the non-inoculated wells with liquid media, and activated charcoal should control moisture levels which all increased aflatoxin production. Regardless increasing the number of inoculated wells still resulted in an incremental increase of aflatoxin, making water unlikely the sole candidate for aflatoxin stimulation by greater culture density. As mentioned previously, extreme increases in CO2 and decreases in O2 both reduce aflatoxin production, so these would not directly cause the observed increases in aflatoxin production (Davis and Diener, 1968; Sanders et al., 1968; Clevström et al., 1983). Carbon dioxide at 3% compared to 0.1 and 0.7% resulted in a stimulation in aflatoxin, making it impossible to rule out CO2 accumulation as a candidate to stimulate aflatoxin production (Roze et al., 2004). Additionally, it is possible, as more cultures are growing within a 48-well plate, the atmospheric conditions become hypoxic and the fungus switched from aerobic respiration to anaerobic respiration and produced alcohols. Ethanol and other alcohols, including 2-ethyl-1-hexanol (produced by A. nidulans) and at low levels 2-buten-1-ol (produced by A. nidulans) have been demonstrated to stimulate aflatoxin synthesis (Reddy et al., 1979; Keller et al., 1994; Roze et al., 2007). Alcohol dehydrogenase 1 is up-regulated on conducive medium concurrent with the start of aflatoxin synthesis and throughout aflatoxin synthesis (Woloshuk and Payne, 1994). In several studies investigating volatile head space of A. parasiticus and A. flavus growing on conducive medium and corn, ethanol and other alcohols were produced (Roze et al., 2004, 2007, 2010; De Lucca et al., 2012; Spraker et al., 2014). Conceivably, 3% CO2 stimulates aflatoxin production because of a switch to anaerobic fermentation and ethanol caused the stimulation (Roze et al., 2004). It is likely activated charcoal did not absorb alcohols, because they are not efficiently bound by activated charcoal (Smíšek and Černý, 1967), which may explain why there was still an increase in aflatoxin production when activated charcoal was added. One explanation for lack of a substantial increase in aflatoxin production in the non-buffered L-medium is due to medium acidification (pH 1–2 after 4 days of growth). Dissolved CO2 from respiration should acidify medium by H+ disassociation from bicarbonate and other acids produced during fungal growth acidify medium (Cotty, 1988; Keller et al., 1997). Under highly acidic conditions, the hydroxyl group of alcohols can be protonated and then substituted with chlorine ions in the medium producing alkyl halides, thus functionally compromising the alcohol (Bruice, 1998).
We propose a model illustrated in Figure 3, where increasing well density both stimulates and inhibits aflatoxin production. The stimulation is likely a response to volatilized CO2 and H2O from respiration and alcohols during fermentation, whereas the inhibition is likely a response to greater concentrations of CO2 within the plate interior and volatilized oxylipins. Ecologically, inhibition of aflatoxin production at low well occupancy confounds the hypothesis that aflatoxin production is an important competitive advantage in soil environments. The lack of aflatoxin production at low “population” levels was only observed when A. flavus was grown in a smaller culture container (11 mm vs. 35 mm diameter), which would be closer to the expected colony size in soil. Additionally, in 24-well plates there was only a marginal increase of aflatoxin production as the number of inoculated wells increased (data not shown). A possible explanation for differential aflatoxin stimulation is energy conservation. If aflatoxin synthesis is energetically expensive, an effective conservation strategy would be to produce aflatoxin only after detection of other microorganisms. This strategy would be more important for smaller colonies, as would be expected in nature, where energy resources are more limited. Inhibition of aflatoxin production when the A. flavus population level becomes high, supports the hypothesis that aflatoxin is synthesized to aid in competition against other microbes and is not important if the population is well established. The inhibitory compound may be specific organic compounds related to oxylipins rather than products of respiration. Determining the volatility of oxylipins that regulate the transition from sclerotial and aflatoxin production to no toxin and conidial production deserves further review. If indeed stimulation is less specific and a response to products of respiration such as CO2, it stands to reason aflatoxin synthesis is switched on not only in response to other Aspergilli, but also other microbes and insects that are in competition for resources and potentially fungivorous.
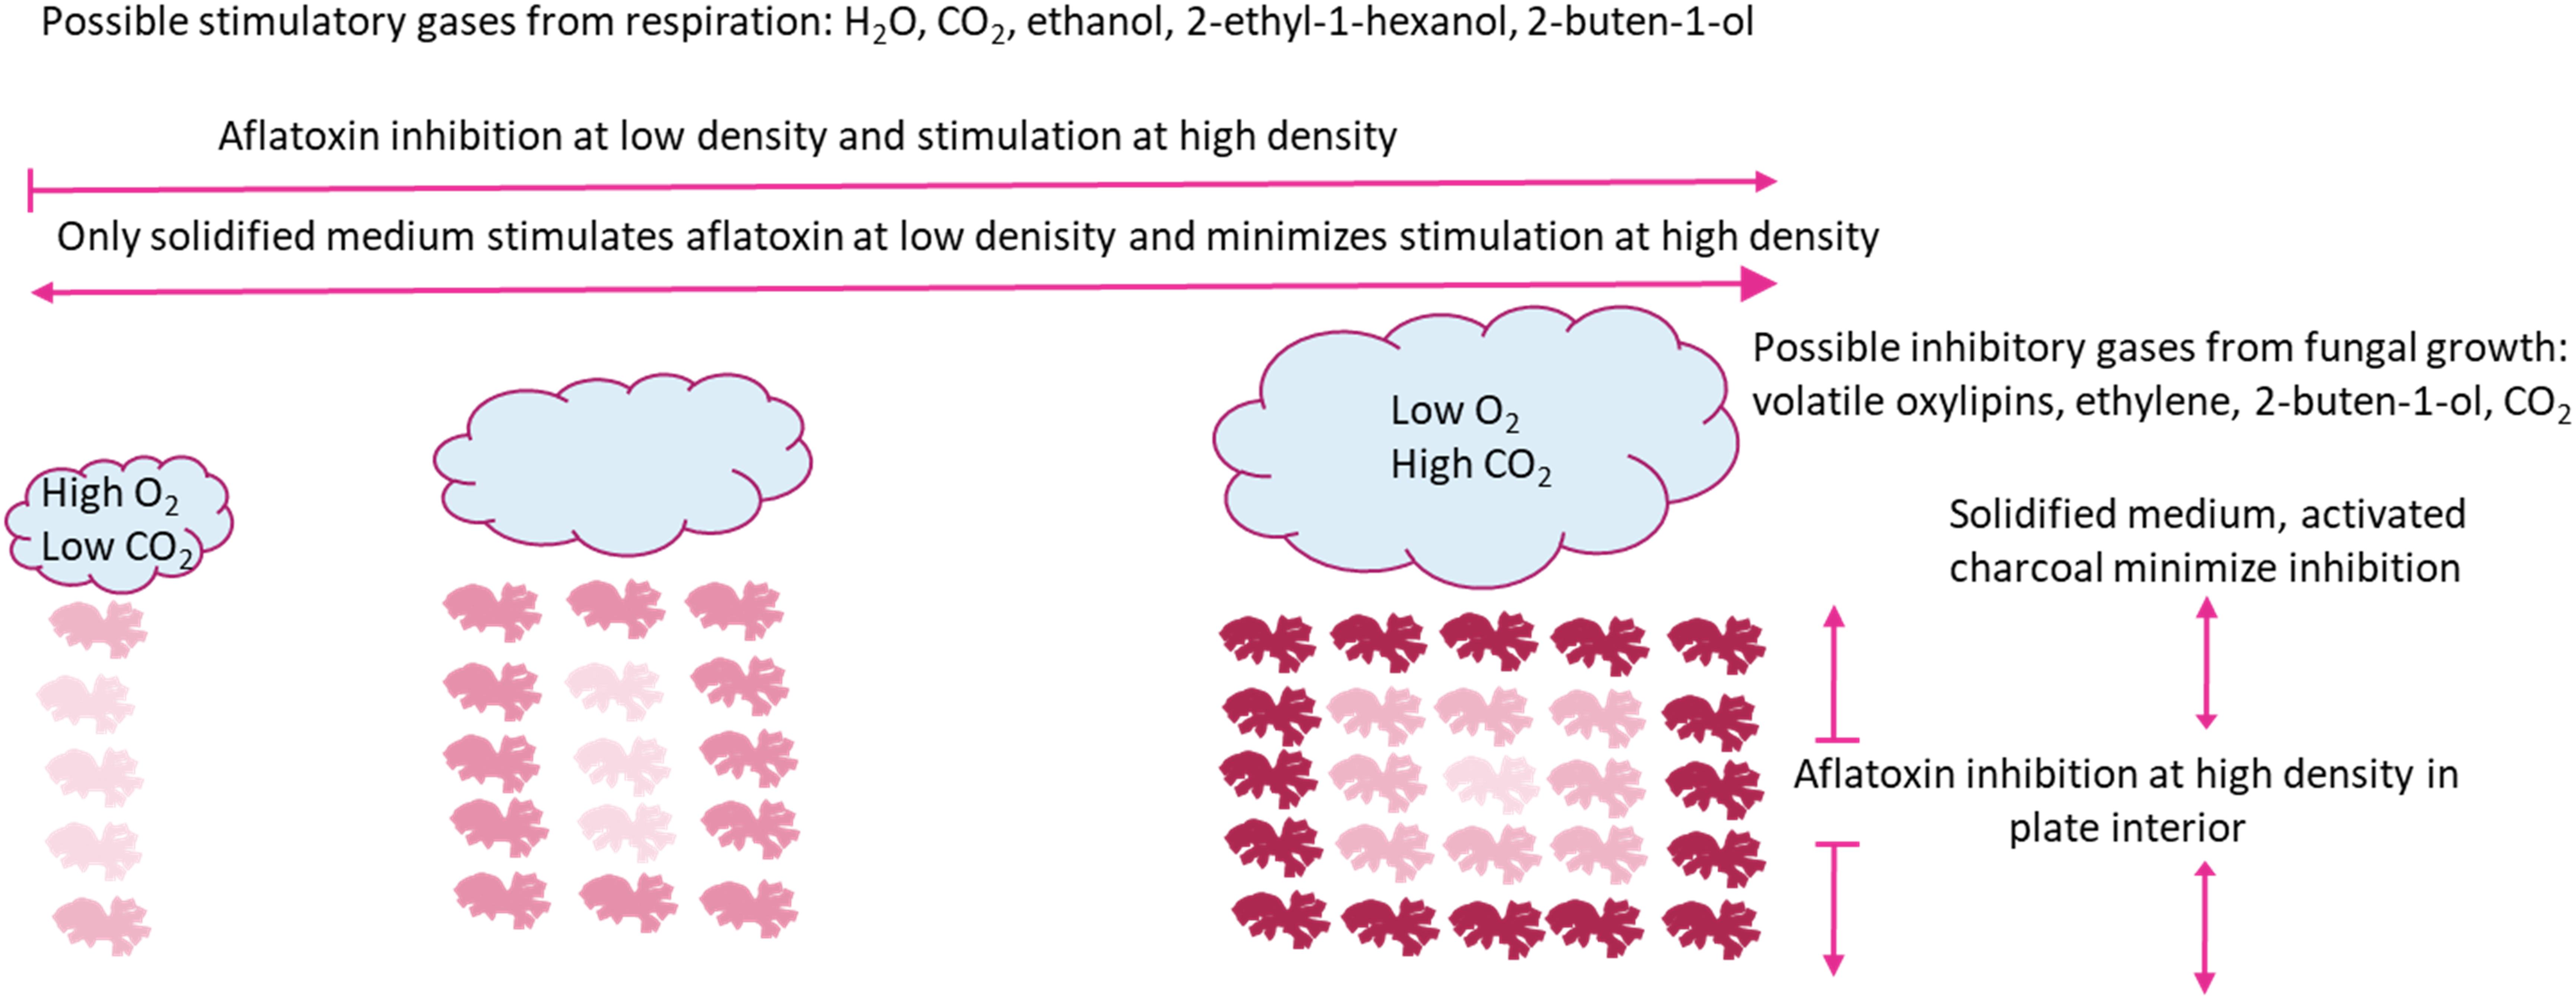
Figure 3. Model for aflatoxin inhibition and stimulation caused by changing density of identical Aspergillus flavus cultures with/in a closed system. Individual fungal mycelial cultures are represented by line drawings. Relative aflatoxin production is represented by red shade, darker red indicate greater aflatoxin production. Clouds represent gas production during fungal growth. Arrows represent aflatoxin production, blunt ends represent blocked aflatoxin production and pointed ends represent production.
The influence of volatiles produced by A. flavus on aflatoxin production warrant further attention. At this point there is evidence volatiles produced by A. flavus changed aflatoxin production, but no definitive information about the type of chemical cues produced by the fungus based on previous research. In the future, it will be important to test more volatiles produced by A. flavus to determine if these have inhibitory or stimulatory effects on aflatoxin production. It should be determined how mixtures of different volatiles effect aflatoxin to see if there are some chemicals that synergize to increase aflatoxin production or interfere with one another to inhibit aflatoxin production. Inhibitory and stimulatory volatiles could be utilized to monitor grain storage for conditions conducive to a potential aflatoxin outbreak or suggest gases to modify the storage atmospheres to be suppressive to aflatoxin production. It will be important to determine the impact A. flavus competition has on aflatoxin production in crops both pre and post-harvest. In spite of determining location and number of cultures affected aflatoxin production, the variability within these categories remained high, so there are more factors within an incubator leading to the variability of aflatoxin production that still needs to be understood. In the same study that found it was important to avoid excessive stacking of peanuts, location within the incubator could also affect aflatoxin production (Xue et al., 2003). Here, inoculating every well and using buffered solid medium to reduced the appearance of phenotypic variability caused by gases from neighboring colonies and is a demonstration of the need to account for and minimize the confounding effects of fungal growth when trying to understand the biology of aflatoxin production.
Data Availability Statement
The datasets generated for this study are available on request to the corresponding author.
Author Contributions
Both authors contributed to the conception and design of the study, manuscript revision, read, and approved the submitted version. RS conducted the experiments, organized the data, performed the statistical analysis, and wrote the manuscript.
Funding
This work was funded by grants from the Aflatoxin Mitigation Center of Excellence (AMCOE) Research Program run by the National Corn Growers Association.
Conflict of Interest
The authors declare that the research was conducted in the absence of any commercial or financial relationships that could be construed as a potential conflict of interest.
References
Abbas, H. K., Weaver, M. A., Horn, B. W., Carbone, I., Monacell, J. T., and Shier, W. T. (2011). Selection of Aspergillus flavus isolates for biological control of aflatoxins in corn. Toxin Rev. 30, 59–70. doi: 10.1016/j.ijfoodmicro.2012.12.021
Abbas, H. K., Weaver, M. A., Zablotowicz, R. M., Horn, B. W., and Shier, W. T. (2005). Relationships between aflatoxin production and sclerotia formation among isolates of Aspergillus section Flavi from the Mississippi Delta. Eur. J. Plant Pathol. 112, 283–287.
Affeldt, K. J., Brodhagen, M., and Keller, N. P. (2012). Aspergillus oxylipin signaling and quorum sensing pathways depend on g protein-coupled receptors. Toxins 4, 695–717. doi: 10.3390/toxins4090695
Arai, T., Ito, T., and Koyama, Y. (1967). Antimicrobial activity of aflatoxins. J. Bacteriol. 93, 59–64.
Atehnkeng, J., Ojiambo, P. S., Donner, M., Ikotun, T., Sikora, R. A., Cotty, P. J., et al. (2008). Distribution and toxigenicity of Aspergillus species isolated from maize kernels from three agro-ecological zones in Nigeria. Int. J. Food Microbiol. 122, 74–84. doi: 10.1016/j.ijfoodmicro.2007.11.062
Brakhage, A. A. (2013). Regulation of fungal secondary metabolism. Nat. Rev. Microbiol. 11, 21–32. doi: 10.1038/nrmicro2916
Brown, R. L., Cotty, P. J., and Cleveland, T. E. (1991). Reduction in aflatoxin content of maize by atoxigenic strains of Aspergillus flavus. J. Food Protect. 54, 623–626. doi: 10.4315/0362-028X-54.8.623
Brown, S. H., Scott, J. B., Bhaheetharan, J., Sharpee, W. C., Milde, L., Wilson, R. A., et al. (2009). Oxygenase coordination is required for morphological transition and the host-fungus interaction of Aspergillus flavus. Mol. Plant Microbe Interact. 22, 882–894. doi: 10.1094/MPMI-22-7-0882
Bruice, P. Y. (1998). Chapter 11 Reaction at an sp3hybridized Carbon III: Substitution and Elimination Reactions of Compounds with Leaving Groups other than Halogen Organometallic Compounds. Organic Chemistry, 2nd Edn (Upper Saddle River: Prentice-Hall Inc), 429–433.
Buchanan, R. L., Federowicz, D., and Stahl, H. G. (1985). Activities of tricarboxylic acid cycle enzymes in aflatoxigenic strain of Aspergillus parasiticus after a peptone to glucose carbon shift. Trans. Br. Mycol. Soc. 84, 267–275.
Burmeister, H. R., and Hesseltine, C. W. (1966). Survey of the sensitivity of microorganisms to aflatoxin. Appl. Microbiol. 14, 403–404.
Clevström, G., Ljunggren, H., Tegelström, S., and Tideman, K. (1983). Production of aflatoxin by an Aspergillus flavus isolate cultured under a limited oxygen supply. Appl. Environ. Microbiol. 46, 400–405.
Cotty, P. J. (1988). Aflatoxin and sclerotial production by Aspergillus flavus: influence of pH. Phytopathology 78, 1250–1253.
Cotty, P. J. (1989). Virulence and cultural characteristics of two Aspergillus flavus strains pathogenic on cotton. Phytopathology 79, 808–814.
Cotty, P. J. (1990). Effect of atoxigenic strains of Aspergillus flavus on aflatoxin contamination of developing cottonseed. Plant Dis. 74, 233–235.
Davis, N. D., and Diener, U. L. (1968). “Environmental factors affecting the production of aflatoxin,” in Proceeding of the First U.S.-Japan Conference on Toxic Micro-Organisms, Washington, D.C, 43–47.
De Lucca, A. J., Boué, S. M., Carter-Wientjes, C., and Bhatnagar, D. (2012). Volatile profiles and aflatoxin production by toxigenic and non-toxigenic isolates of Aspergillus flavus grown on sterile and non-sterile cracked corn. Ann. Agric. Environ. Med. 19, 91–98.
De Lucca, A. J., Carter-Wientjes, C. H., Boué, S., and Bhatnagar, D. (2011). Volatile trans-2-hexenal, a soybean aldehyde, inhibits Aspergillus flavus growth and aflatoxin production in corn. J. Food Sci. 76, M381–M386. doi: 10.1111/j.1750-3841.2011.02250.x
Diener, U. L., Cole, R. J., Sanders, T. H., Payne, G. A., Lee, L. S., and Klich, M. A. (1987). Epidemiology of aflatoxin formation by Aspergillus flavus. Annu. Rev. Phytopathol. 25, 249–270.
Dorner, J. W., Cole, R. J., and Blankenship, P. D. (1992). Use of a biocompetitive agent to control preharvest aflatoxin in drought stressed peanuts. J. Food Protect. 55, 888–892. doi: 10.4315/0362-028X-55.11.888
Doyle, M. P., and Marth, E. H. (1978a). Aflatoxin is degraded at different temperatures and pH values by mycelia of Aspergillus parasiticus. Eur. J. Appl. Microbiol. Biotechnol. 6, 95–100.
Doyle, M. P., and Marth, E. H. (1978b). Bisulfite degrades aflatoxin: effect of citric acid and methanol and possible mechanism of degradation. J. Food Protect. 41, 891–896. doi: 10.4315/0362-028X-41.11.891
Drott, M. T., Lazzaro, B. P., Brown, D. L., Carbone, I., and Milgroom, M. G. (2017). Balancing selection for aflatoxin in Aspergillus flavus is maintained through interference competition with, and fungivory by insects. Proc. R. Soc. B 284:20172408. doi: 10.1098/rspb.2017.2408
Ellis, W. O., Smith, J. P., Simpson, B. K., and Ramaswamy, H. (1993). Effect of inoculum level on aflatoxin production by Aspergillus flavus under modified atmosphere packaging (MAP) conditions. Food Microbiol. 10, 525–535.
Fountain, J. C., Scully, B. T., Chen, Z. Y., Gold, S. E., Glenn, A. E., Abbas, H. K., et al. (2015). Effects of hydrogen peroxide on different toxigenic and atoxigenic isolates of Aspergillus flavus. Toxins 7, 2985–2999. doi: 10.3390/toxins7082985
Giorni, P., Magan, N., Peitri, A., Bertuzzi, T., and Battilani, P. (2007). Studies on Aspergillus section flavi isolated from maize in northern Italy. Int. J. Food Microbiol. 113, 330–338.
Horn, B. W. (2003). Ecology and population biology of aflatoxigenic fungi in soil. J. Toxicol. Toxin Rev. 22, 351–379.
Horn, B. W., Gell, R. M., Singh, R., Sorensen, R. B., and Carbone, I. (2016). Sexual reproduction in Aspergillus flavus sclerotia: acquisition of novel alleles from soil populations and uniparental mitochondrial inheritance. PLoS One 11:e0146169. doi: 10.1371/journal.pone.0146169
Horn, B. W., Moore, G. G., and Carbone, I. (2009). Sexual reproduction in Aspergillus flavus. Mycologia 101, 423–429.
Huang, C., Jha, A., Sweany, R., DeRobertis, C., and Damann, K. E. Jr. (2011). Intraspecific aflatoxin inhibition in Aspergillus flavus is thigmoregulated, independent of vegetative compatibility group and is strain dependent. PLoS One 6:e23470. doi: 10.1371/journal.pone.0023470
Joffe, A. Z., and Lisker, N. (1969). Effect of light, temperature and pH value on aflatoxin production in vitro. Appl. Microbiol. 18, 517–518.
Joshua, H. (1993). Determination of aflatoxins by reversed-phase high-performance liquid chromatography with post-column in-line photochemical derivatization and fluorescence detection. J. Chromatogr. A 654, 247–254.
Keller, N. P., Butchko, R. A. E., Sarr, B., and Phillips, T. D. (1994). A visual pattern of mycotoxin production in maize kernels by Aspergillus spp. Phytopathology 84, 483–488.
Keller, N. P., Nesbitt, C., Sarr, B., Phillips, T. D., and Burow, G. B. (1997). pH regulation of sterigmatocystin and aflatoxin biosynthesis in Aspergillus spp. Phytopathology 87, 643–648.
Mehl, H. L., and Cotty, P. J. (2010). Variation in competitive ability among isolates of Aspergillus flavus from different vegetative compatibility groups during maize infection. Phytopathology 100, 150–159. doi: 10.1094/PHYTO-100-2-0150
Niu, G., Wen, Z., Rupasinghe, S. G., Zeng, R. S., Berenbaum, M. R., and Schuler, M. A. (2008). Aflatoxin B1 detoxification by CYP321A1 in Helicoverpa zea. Arch. Insect Biochem. Physiol. 69, 32–45. doi: 10.1002/arch.20256
Reddy, T. V., Viswanathan, L., and Venkitasubramanian, T. A. (1979). Factors affecting aflatoxin production by Aspergillus parasiticus in a chemically defined medium. J. Gen. Microbiol. 114, 409–413.
Rohlfs, M., and Obmann, B. (2009). Species-specific responses of dew fly larvae to mycotoxins. Mycotoxin Res. 25, 103–112. doi: 10.1007/s12550-009-0015-1
Roze, L. V., Beaudry, R. M., Arthur, A. E., Calvo, A. M., and Linz, J. E. (2007). Aspergillus volatiles regulate aflatoxin synthesis and asexual sporulation in Aspergillus parasiticus. Appl. Environ. Microbiol. 73, 7268–7276.
Roze, L. V., Calvo, A. M., Gunterus, A., Beaudry, R., Kall, M., and Linz, J. E. (2004). Ethylene modulates development and toxin biosynthesis in Aspergillus possibly via an ethylene sensor-mediated signaling pathway. J. Food Prot. 67, 438–447.
Roze, L. V., Chanda, A., Laivenieks, M., Beaudry, R. M., Artymovich, K. A., Koptina, A. V., et al. (2010). Volatile profiling reveals intracellular metabolic changed in Aspergillus parasiticus: veA regulates branched chain amino acid and ethanol metabolism. Biomed. Central Biochem. 11:33.
Roze, L. V., Hong, S. Y., and Linz, J. E. (2013). Aflatoxin biosynthesis: current frontiers. Annu. Rev. Food Sci. Technol. 4, 293–311. doi: 10.1146/annurev-food-083012-123702
Roze, L. V., Laivenieks, M., Hong, S. Y., Wee, J., Wong, S. S., Vanos, B., et al. (2015). Aflatoxin biosynthesis is a novel source of reactive oxygen species–a potential redox signal to initiate resistance to oxidative stress? Toxins 7, 1411–1430. doi: 10.3390/toxins7051411
Sanders, T. H., Davis, N. D., and Diener, U. L. (1968). Effect of carbon dioxide, temperature, and relative humidity of production of aflatoxin in peanuts. J. Am. Oil Chem. Soc. 45, 683–685.
Schmidt-Heydt, M., Abdel-Hadi, A., Magan, N., and Geisen, R. (2009). Complex regulation of the aflatoxin biosynthesis gene cluster of Aspergillus flavus in relation to various combinations of water activity and temperature. Int. J. Food Microbiol. 135, 231–237. doi: 10.1016/j.ijfoodmicro.2009.07.026
Smíšek, M., and Černý, S. (1967). Chapter 4. Theory of Adsorption on Active Carbon. Active Carbon: Manufacture, Properties and Applications, English Translation (New York, NY: American Elsevier Publishing Company, Inc.), 71–155.
Sobolev, V. S., and Dorner, J. W. (2002). Cleanup procedure for determination of aflatoxins in major agricultural commodities by liquid chromatography. J. AOAC Int. 85, 642–645.
Spraker, J. E., Jewell, K., Roze, L. V., Scherf, J., Ndagano, D., Beaudry, R., et al. (2014). A volatile relationship: profiling an inter-kingdom dialogue between two plant pathogens, Ralstonia solancearum and Aspergillus flavus. J. Chem. Ecol. 40, 502–513. doi: 10.1007/s10886-014-0432-2
Sweany, R. R., Damann, K. E. Jr., and Kaller, M. D. (2011). Comparison of soil and corn kernel Aspergillus flavus populations: evidence for niche specialization. Phytopathology 101, 952–959. doi: 10.1094/PHYTO-09-10-0243
Wicklow, D. T., Bobell, J. R., and Palmquist, D. E. (2003). Effect of intraspecific competition by Aspergillus flavus on aflatoxin formation in suspended disc culture. Mycol. Resour. 107, 617–723.
Woloshuk, C. P., and Payne, G. A. (1994). The alcohol dehydrogenase gene adh1 is induced in Aspergillus flavus grown on medium conducive to aflatoxin biosynthesis. Appl. Environ. Microbiol. 60, 670–676.
Woloshuk, C. P., and Shim, W. B. (2013). Aflatoxins, fumonisins, and trichothecenes: a convergence of knowledge. FEMS Microbiol. Rev. 37, 94–109. doi: 10.1111/1574-6976.12009
Xue, H. Q., Isleib, T. G., Payne, G. A., Wilson, R. F., Novitzky, W. P., and O’Brian, G. (2003). Comparison of aflatoxin production in normal and high-oleic backcross-derived peanut lines. Plant Dis. 87, 1360–1365. doi: 10.1094/PDIS.2003.87.11.1360
Zeng, R. S., Niu, G., Wen, Z., Schuler, M. A., and Berenbaum, M. R. (2006). Toxicity of aflatoxin B1 to Helicoverpa zea and bioactivation by cytochrome P450 monooxygenases. J. Chem. Ecol. 32, 1459–1471.
Zeng, R. S., Wen, Z., Niu, G., Schuler, M. A., and Berenbaum, M. R. (2007). Allelochemical induction of cytochrome P450 monooygenases and amelioration of xenobiotic toxicity in Helicoverpa zea. J. Chem. Ecol. 33, 449–461.
Keywords: Aspergillus flavus, volatile chemical, volatile sensing, aflatoxin, quorum sensing
Citation: Sweany RR and Damann KE Jr (2020) Influence of Neighboring Clonal-Colonies on Aflatoxin Production by Aspergillus flavus. Front. Microbiol. 10:3038. doi: 10.3389/fmicb.2019.03038
Received: 18 August 2019; Accepted: 17 December 2019;
Published: 15 January 2020.
Edited by:
Mehdi Razzaghi-Abyaneh, Pasteur Institute of Iran (PII), IranReviewed by:
N. K. Dubey, Banaras Hindu University, IndiaRanajit Bandyopadhyay, International Institute of Tropical Agriculture, Nigeria
Mark Weaver, United States Department of Agriculture (USDA), United States
Copyright © 2020 Sweany and Damann. This is an open-access article distributed under the terms of the Creative Commons Attribution License (CC BY). The use, distribution or reproduction in other forums is permitted, provided the original author(s) and the copyright owner(s) are credited and that the original publication in this journal is cited, in accordance with accepted academic practice. No use, distribution or reproduction is permitted which does not comply with these terms.
*Correspondence: Rebecca R. Sweany, cnN3ZWFuMUBnbWFpbC5jb20=