 Jiafang Fu
 Ronghuo Qin1
 Chuanqing Zhong
 Guangxiang Cao
- 1Shandong Medicinal Biotechnology Center, Shandong Academy of Medical Sciences, Jinan, China
- 2School of Municipal and Environmental Engineering, Shandong Jianzhu University, Jinan, China
Streptomyces clavuligerus F613-1 produces a clinically important β-lactamase inhibitor, clavulanic acid (CA). Although the biosynthesis pathway of CA has essentially been elucidated, the global regulatory mechanisms of CA biosynthesis remain unclear. The paired genes cagS and cagR, which are annotated, respectively, as orf22 and orf23 in S. clavuligerus ATCC 27064, encode a bacterial two-component regulatory system (TCS) and were found next to the CA biosynthetic gene cluster of S. clavuligerus F613-1. To further elucidate the regulatory mechanism of CA biosynthesis, the CagRS TCS was deleted from S. clavuligerus F613-1. Deletion of cagRS resulted in decreased production of CA, but the strain phenotype was not otherwise affected. Both transcriptome and ChIP-seq data revealed that, in addition to CA biosynthesis, the CagRS TCS mainly regulates genes involved in primary metabolism, such as glyceraldehyde 3-phosphate (G3P) metabolism and arginine biosynthesis. Notably, both G3P and arginine are precursors of CA. Electrophoretic mobility shift assays demonstrated that the response regulator CagR could bind to the intergenic regions of argG, argC, oat1, oat2, ceaS1, and claR in vitro, suggesting that CagR can directly regulate genes involved in arginine and CA biosynthesis. This study indicated that CagRS is a pleiotropic regulator that can directly affect the biosynthesis of CA and indirectly affect CA production by regulating the metabolism of arginine and G3P. Our findings provide new insights into the regulation of CA biosynthetic pathways and provide an innovative approach for future metabolic engineering efforts for CA production in S. clavuligerus.
Introduction
Clavulanic acid (CA), a broad-spectrum inhibitor of beta-lactamase, is widely used clinically in combination with penicillin and cephalosporin, as it can effectively improve the antibacterial effect of β-lactam antibiotics (Saudagar et al., 2008). The unique three-dimensional structure (3R, 5R) of CA enables it to irreversibly combine with serine hydroxyl from the active center of β-lactamase, thereby inactivating this β-lactam resistance mechanism (Liras and Rodriguez-Garcia, 2000). Streptomyces clavuligerus was first isolated and screened for the production of CA (Reading and Cole, 1977), and although S. jumonjinensis and S. katsurahamanus were also found to produce CA, S. clavuligerus is the major production strain for CA (Brown et al., 1976; Jensen and Paradkar, 1999). In addition to CA, S. clavuligerus also produces the β-lactam antibiotic cephamycin C and several compounds with a clavam structure and (3S, 5S) stereochemistry; these compounds are considered to be the main by-products of CA fermentation.
Three clusters of genes involved in CA biosynthesis have been isolated in S. clavuligerus: the CA biosynthetic gene cluster, the clavam gene cluster, and the paralog gene cluster (Figure 1C). Both the CA biosynthetic gene cluster and the clavam gene cluster are located on the chromosome of S. clavuligerus, whereas the paralog gene cluster is located on the pSCL4 plasmid (Jensen et al., 2000; Liras et al., 2008; Song et al., 2010). The CA biosynthetic gene cluster was initially isolated by hybridization with the cas2 gene, encoding clavaminate synthase, and includes the six biosynthetic enzyme-encoding genes bls2, pah2, ceaS2, cas2, car (also known as cad) and gcaS (Baggaley et al., 1997; Arulanantham et al., 2006); two genes, pbpA and pbp2, encoding penicillin-binding proteins (Ishida et al., 2006); the oat2 gene encoding ornithine acetyltransferase (Hodgson et al., 1995); two genes, oppA1 and oppA2, encoding oligopeptide permeases (Lorenzana et al., 2004; Mackenzie et al., 2010); gene claR, which encodes a LysR-type regulatory protein (Liras and Rodriguez-Garcia, 2000); and the cyp450-fd, orf12, orf13, orf14, and orf16 genes, which are required for CA biosynthesis but are of unknown function.
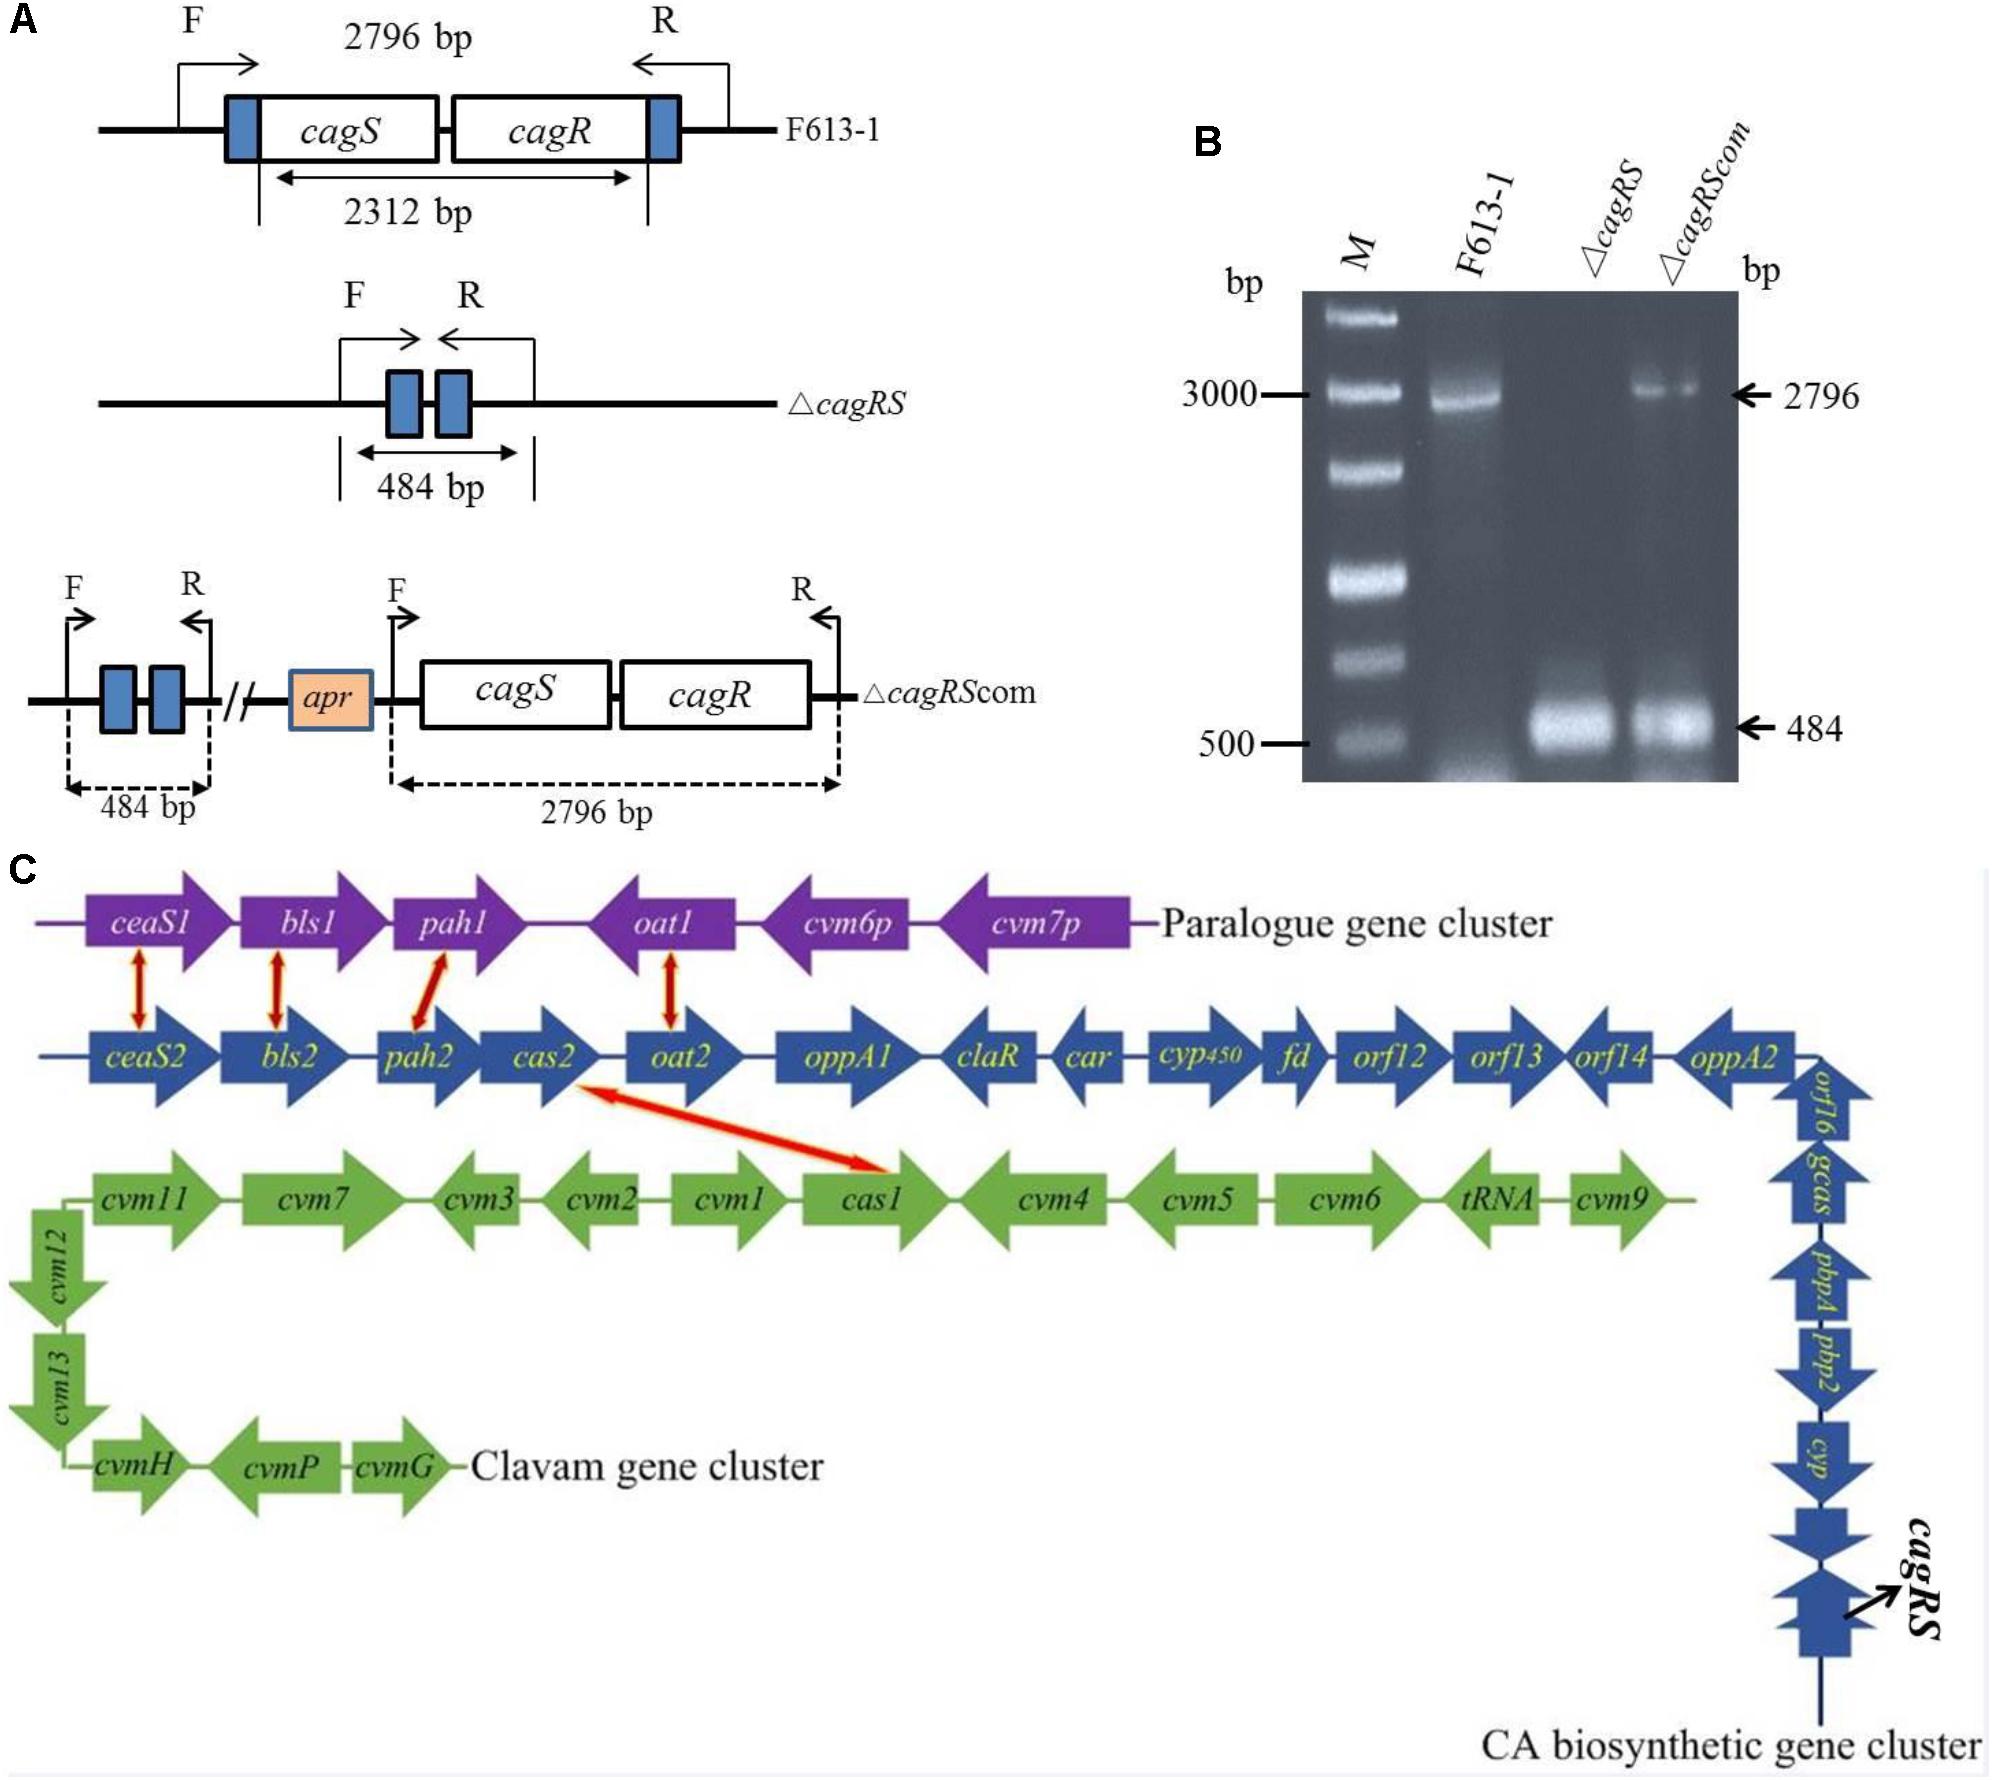
Figure 1. Verification of the cagRS deletion strain ΔcagRS. (A) Schematic diagram of the construction of the cagRS mutant and complemented strains. F and R represent forward and reverse primers, respectively. (B) PCR verification of the ΔcagRS mutant. M: DNA marker. The F/R primers are located at the flanking regions of the TCS. (C) Schematic diagram of CA biosynthesis-related gene clusters in F613-1. The red and yellow bidirectional arrows indicate homologous genes. The CA biosynthetic gene cluster (blue arrows) includes five operons: ceaS2-bls2, pah2-cas2, cyp450-fd, orf12-orf13 and gcaS-orf16-oppA2.
The clavam gene cluster was isolated using the cas1 gene in S. clavuligerus, a duplicate gene encoding a clavaminate synthase isoenzyme, as probe (Mosher et al., 1999). This gene cluster contains genes cvm1 to cvm13, cvmG, cvmH, cvmP, and cas1, although only cas1 is required for CA biosynthesis (Liras et al., 2008). Additionally, although cas1 is a homolog of cas2 of the CA biosynthetic gene cluster, the two genes are regulated by different mechanisms (Paradkar and Jensen, 1995).
The paralog gene cluster contains the genes ceaS1, bls1, pah1, oat1, cvm6p, and cvm7p (Jensen et al., 2000, 2004a), and the first four of these genes may have been duplicated from genes of the CA biosynthetic gene cluster (Tahlan et al., 2004a,b). ceaS1 is a homolog of ceaS2, with 73% similarity; bls1 is a homolog of bls2, with 60% similarity; and oat1 is a homolog of oat2, with 63% similarity. pah1 encodes a protein that functions similarly to Pah2, and the two proteins have a sequence similarity of 72%. It has been reported that deletion of pah1 resulted in significantly reduced production of CA as well as of 5S-clavam (Jensen et al., 2004b).
The CA biosynthesis is regulated by several mechanisms in S. clavuligerus, including the two pathway-specific regulatory factors ClaR and CcaR. The ClaR-encoding gene, claR, is located in the CA biosynthetic gene cluster, and studies have shown that ClaR can positively regulate CA biosynthesis (Paradkar et al., 1998; Perez-Redondo et al., 1998; Gomez-Escribano et al., 2006; Martinez-Burgo et al., 2015). The CcaR-encoding gene, ccaR, is located in the cephamycin C gene cluster, and CcaR is reported to positively regulate the expression of genes involved in the early stage of CA biosynthesis, such as ceaS2, bls2, pah2, and cas2 (Santamarta et al., 2002, 2011; Alvarez-Alvarez et al., 2014). In addition, CcaR also binds the promoter of claR (Santamarta et al., 2011; Kurt et al., 2013), indicating that ClaR and CcaR may jointly form a regulatory system to regulate the biosynthesis of CA (Kurt et al., 2013; Kwong et al., 2013).
In addition to the CA pathway-specific regulatory factors, many other factors regulate CA biosynthesis. Deletion of the γ-butyrolactone receptor protein Brp can result in increased CA production, and Brp negatively regulates the biosynthesis of CA through inhibiting ccaR (Santamarta et al., 2005). BldG is an upstream regulatory factor that can regulate CA biosynthesis by regulating ccaR expression (Bignell et al., 2005), and the sigma factor encoded by orf21 can bind to the ccaR promoter region and thereby also influence CA biosynthesis (Jnawali et al., 2011). In addition, CA biosynthesis was reported to be negatively regulated by ccaR and claR when amino acids are scarce (Gomez-Escribano et al., 2008).
Enhancement of CA production is a very important goal for the commercial pharmaceutical market. Generally, there are two main ways to increase CA production (Paradkar et al., 2001; Jnawali et al., 2010): (1) optimize the medium and conditions for CA fermentation, and (2) clarify and optimize the biosynthetic and regulatory mechanisms of CA production. The biosynthesis pathway of CA and its related by-product (clavam) has been partially elucidated (Liras et al., 2008). However, the mechanisms regulating CA biosynthesis have not been fully delineated, and there are no reports about the global regulation of CA biosynthesis. Therefore, in addition to manipulating genes encoding regulatory factors (such as claR, ccaR) and known essential biosynthetic enzymes (such as bls2, pah2, ceaS2, cas2, car, and gcaS), elucidation of the functions of other genes responsible for as yet unknown but essential roles in CA biosynthesis may suggest other ways to increase production of CA.
Two-component systems (TCSs) are normally organized as pairs on bacterial genomes, with co-transcription of the response regulator and histidine kinase genes. TCSs not only respond to changes in environmental factors, but in Streptomyces, also influence development and secondary metabolism such as antibiotic production (Mendes et al., 2007). S. clavuligerus F613-1 is an industrial CA producer strain, and we have previously reported the complete genome sequence of this strain (Cao et al., 2016). In this study, we identified TCS CagRS, which is annotated as orf22/orf23 in S. clavuligerus 27064 (Song et al., 2009) and which is close to the CA biosynthetic gene cluster in F613-1. We investigated the effects of TCS CagRS on CA production in S. clavuligerus F613-1, and our results provide insights into new approaches for improving CA yield.
Materials and Methods
Plasmids and Bacterial Strains
All strains and plasmids used in this study are listed in Supplementary Table S1. S. clavuligerus F613-1 is an industrial strain (Jin et al., 2015) and was used as the parental strain in this study. Cloning procedures were performed in Escherichia coli DH5a, protein expression was performed using E. coli BL21(DE3), and E. coli ET12567/pUZ8002 was used for intergeneric conjugative transfer of plasmid DNA into S. clavuligerus (Kieser et al., 2000).
Primers
All primers used in the construction of the ΔcagRS deletion mutant strain and complemented strain, construction of a CagR-3 × FLAG-complemented S. clavuligerus strain, confirmation of conjugants, and in EMSAs and real-time PCR analysis are listed in Supplementary Table S2.
Culture Conditions
Escherichia coli strains were grown at 37°C in LB medium or on solid LB plates supplemented with ampicillin (100 μg/mL), kanamycin (25 μg/mL), or chloramphenicol (25 μg/mL) when required.
Culturing of S. clavuligerus F613-1 and the strains derived from it was performed as described previously (Qin et al., 2017). S. clavuligerus transformants were cultured on MS plates (2.0% soybean powder, 2% glycerol, and 2.0% agar powder, pH 7.3) supplemented with nalidixic acid (25 mg/mL) and thiostrepton (15 mg/mL) to select pJTU1278-derived plasmids, and the disrupted mutants were selected with antibiotic-free MS solid media or with apramycin (15 mg/mL) to select pSET152-derived plasmids.
Streptomyces clavuligerus F613-1 and its derived strains were grown at 25°C with a relative humidity of 50-60% on BSCA plates (1.5% malt extract, 0.3% tryptone, 0.4% glucose, and 2.0% agar powder, pH 7.5) for 8 days for collection of spores. For bioassay analysis, F613-1 and derived strains were grown at 25°C with a relative humidity of 50-60% on BSCA plates for 3–9 days; on MSF plates (2.0% soybean powder, 2% mannitol, and 2.0% agar powder, pH 7.3) for 5–11 days; on MM solid media (0.05% L-asparagine, 0.05% dipotassium hydrogen phosphate, 0.02% MgSO4⋅7H2O, 0.001% FeSO4⋅7H2O, 1% dextrose monohydrate, and 2.0% agar powder, pH 7.2) for 9–15 days; or on ISP4 solid media (1% soluble starch, 0.1% dipotassium hydrogen phosphate, 0.1% MgSO4⋅7H2O, 0.1% NaCl, 0.2% ammonium sulfate, 0.2% CaCO3, 0.0001% FeSO4⋅7H2O, 0.0001% MnCl2⋅7H2O, and 2.0% agar powder, pH 7.2) for 7–13 days.
For the liquid-state fermentation, spores (2 × 10⁶) of the S. clavuligerus strains were inoculated into 100 mL SCZ seed medium [2.0% soybean powder, 1.2% maize starch, 0.5% yeast extract, 0.08% dipotassium hydrogen phosphate, and 1.1% (v/v) glycerol trioleate, pH 7.1), and then cultured at 25°C, with shaking on an orbital shaker at 200 rpm for 48 h to obtain seed cultures. Next, 5 mL seed cultures were transferred to 100 mL SCF fermentation medium (2.7% soybean powder, 2.2% soybean protein extract, 3.0% maltodextrin, 0.15% potassium chloride, 0.1% magnesium chloride hexahydrate, 0.2% dipotassium hydrogen phosphate, 0.04% calcium chloride dihydrate, 0.008% ferric chloride hexahydrate, 0.001% zinc chloride, 0.018% sodium chloride, and 4.2% MOPS, pH 7.1) supplemented with or without 1.6% (v/v) glycerol trioleate and grown at 25°C, with shaking on an orbital shaker at 200 rpm. For HPLC analysis of CA, 1 mL samples of fermentation liquid were collected at 24, 72, 120, 168, and 216 h and centrifuged at 5000 rpm to collect the supernatant. In addition, the biomass was measured before the analysis of CA production, using 1 g samples of fermentation liquid centrifuged at 5000 rpm to collect the mycelium.
DNA Manipulation
Genomic DNA from S. clavuligerus was isolated using the Kirby mix procedure (Kieser et al., 2000). Plasmids were extracted from E. coli using plasmid mini-prep columns (BioTeke, China) according to the manufacturer’s protocol. Restriction endonuclease digestions of plasmid DNA were carried out according to the manufacturer’s recommendations. DNA ligation was performed using Solution I (TaKaRa, Japan) according to the manufacturer’s recommendations.
Construction and Complementation of a cagRS Null Mutant
The cagRS genes were knocked out through homologous recombination using a strategy similar to that described (Gust et al., 2003; Zhang et al., 2014). The DNA fragment serving as the left arm of cagRS was amplified by PCR using primers cagRS L-F/R and S. clavuligerus F613-1 genomic DNA as template, and then the amplified PCR products were cloned into the general cloning vector pEasy-Blunt-Simple to obtain the recombinant plasmid pEBS-cagRS L. The DNA fragment serving as the right arm of cagRS was amplified by PCR using primers cagRS R-F/R, and then the amplified PCR products were cloned into the general cloning vector pEasy-Blunt-Simple to obtain the recombinant plasmid pEBS-cagRS R. After verification by DNA sequencing, both pEBS-cagRS L and pEBS-cagRS R were digested with HindIII and BamHI, and the digested right arm of cagRS was cloned into the digested recombinant plasmid pEBS-cagRS L to obtain the recombinant plasmid pEBS-cagRS L/R. After verification by DNA sequencing, the cagRS L/R fragment was excised from pEBS-cagRS L/R using SpeI and BamHI and then cloned into plasmid pJTU1278 (also digested with SpeI and BamHI) to obtain the recombinant plasmid pJTU-cagRS.
Deletion of cagRS was performed by double recombination between the S. clavuligerus F613-1 genome and the pJTU1278-derived plasmid pJTU-cagRS, resulting in the knockout of the cagRS genes (Figure 1). Conjugation was performed using S. clavuligerus F613-1 and E. coli ET12567/pUZ8002 as described (Sambrook et al., 1989; Kieser et al., 2000). The ΔcagRS mutant strain was confirmed by PCR.
For complementation, cagRS was amplified with the primers CagRS com-F and CagRS com-R, generating a fragment carrying the coding sequence and the cagRS promoter, and cloned into NdeI/XbaI-cut pSET152 to create pSET-cagRS. The plasmids pSET152 and pSET-cagRS were introduced individually into the ΔcagRS mutant by conjugation.
Construction of a CagR-3 × Flag-Complemented S. clavuligerus Strain
To engineer an S. clavuligerus strain expressing CagR with a C-terminal, triple-Flag tag (DYKDHDGDYKDHDIDYKDDDDK), the pSET152-derived construct pSET-cagRFlag was created via assembly of multiple DNA fragments using the Gibson Assembly Cloning Kit (New England BioLabs). To avoid folding of the 3 × Flag tag into the inside of the CagR protein, the [Gly4Ser]3 linker (GGGGSGGGGSGGGGS) (Bush et al., 2013) was inserted between the 3 × Flag tag and the coding region of cagR. The flow chart for construction of the recombinant plasmid pSET-cagRFlag is shown in Supplementary Figure S1. The recombinant plasmid pSET-cagRFlag was confirmed by DNA sequencing, and then pSET-cagRFlag was introduced into the ΔcagRS mutant by conjugation, and its ability to restore CA production was assessed during liquid-state fermentation.
Bioassay and HPLC Analysis of CA Production
The concentration of CA was analyzed by bioassay analysis and HPLC analysis. The indicator E. coli strain MA18 was spread on LB solid medium supplemented with 100 μg/mL ampicillin (Jones et al., 2005). Briefly, for the bioassay analysis, S. clavuligerus strains were grown on BSCA plates for 3–9 days, on MSF solid media for 5–11 days, on MM solid media for 9–15 days, or on ISP4 solid media for 7–13 days, and then the corresponding agar blocks were excavated with a 6 mm punch and transferred onto the LB agar plates. The diameter of the inhibition zone was gauged after overnight culturing at 37°C. The concentration of CA during the liquid-state fermentation was detected by HPLC with an Inertsil ODS-3 4.6 mm × 150 mm, 5 μm column (Jin et al., 2015; Qin et al., 2017), using clavulanate lithium (provided by Lunan Pharmaceutical Co.) as the standard for quantification. For bioassay and HPLC analysis of CA production, the experiments were conducted in triplicate. Statistical analysis was performed using SPSS Statistics V19.0 software.
Transcriptome Sequencing and Analysis
For transcriptome sequencing and analysis, mycelium of S. clavuligerus F613-1 and its derivative ΔcagRS were harvested from fermentation liquid at 72 h and rapidly frozen in liquid nitrogen. Total RNA of F613-1 and ΔcagRS was purified using an RNA extraction kit (SBSBIO, Beijing China) according to the manufacturer’s protocol. The extracted total RNA samples were then treated with RNase-free DNase I (Invitrogen) twice according to the recommended protocols to remove the residual chromosomal DNA. Two sets of RNA for both strains were prepared separately. The integrity of total RNA was determined using a NanoDrop One C (Thermo Fisher Scientific), and the RNA Integrity Number value of each sample met the standard required for preparing a cDNA library. The cDNA libraries were prepared according to the manufacturer’s instructions (Illumina). Briefly, the ribosomal RNA in 1–4 μg total RNA was removed using Ribo-zero rRNA Removal solution (Illumina), leaving only mRNA. The mRNA was then fragmented, to an average fragment length of about 200 nt, and reverse transcribed into single-stranded cDNA using random hexamer priming. When the second cDNA strand was synthesized, the dTTP was replaced by dUTP. The cDNA fragments with a single ‘A’ base overhang at their 3′-ends were obtained after end-repair and 3′-adenylation. Adapters were then ligated to the ends of the cDNA fragments. Fifteen rounds of PCR amplification were performed to enrich the adapter-modified cDNA library using primers complementary to the ends of the adapters, and PCR products were purified using Ampure XP beads (Agencourt). The ready-to-sequence Illumina library was quantified as previously described (Zhang et al., 2017).
The transcriptome was sequenced using a HiSeq 3000 sequencer (Illumina) at RibBio Corporation (Shenzhen, China). A paired-end, 2 × 150 bp sequencing strategy was used, and more than 1 Gb data was obtained for each sample. The sequencing generated 6 files of reads corresponding to F613-1 and ΔcagRS, with three replicates for each. After filtering the raw data, removing the linker sequences, low-quality reads and the residual rRNA sequences, the remaining data were marked as the effective reads. The effective reads could be obtained using fastx_clean1, a home-made software package based on the FASTX toolkit2 and SortMeRNA (excludes the ribosomal RNA-like reads) (Kopylova et al., 2012). The effective reads were used for subsequent genome comparisons, and the distribution of reads compared to the genome was statistically analyzed. For ΔcagRS, 93.58% of effective reads were distributed in ORFs (open reading frames), and 6.42% in intergenic regions. For F613-1, 95.18% of effective reads were distributed in exonic regions, and 4.82% in intergenic regions. The expression level of each gene was normalized by the number of reads per kilobase of transcriptome per million mapped reads (RPKM). The differentially expressed genes were selected using the Audics program with parameters of |log2FoldChange| > 1 and q-value < 0.001. The transcriptome data has been deposited in the Gene Expression Omnibus database3. The accession number is GSE119208.
Real-Time Quantitative PCR Analysis
Total RNA isolation and real-time quantitative PCR (RT-qPCR) procedures were performed as described previously (Fu et al., 2017). Mycelium of S. clavuligerus F613-1 and ΔcagRS were harvested from fermentation liquid at 24, 72, 120, 168, and 216 h, rapidly frozen in liquid nitrogen and then total RNA was extracted using an RNA extraction kit (SBSBIO, Beijing China) according to the manufacturer’s protocol. Total RNA samples were treated with Turbo DNA-free reagents (Ambion, United States) to remove the residual chromosomal DNA. The cDNAs were synthesized using random hexamer primers (pdN6, Amersham Pharmacia Biotech, England), M-MLV reverse transcriptase (Invitrogen, England) and dNTPs (Roche, Switzerland). Real-time PCR assays were performed on the Roche LightCycler 480 using SYBR Green Mix (ToYoBO, Osaka, Japan). Relative quantities of cDNA were normalized to the amounts of 16S rRNA. For RT-qPCR assays, experiments were conducted in triplicate. Statistical analysis was performed using SPSS Statistics V19.0 software.
Chromatin Immunoprecipitation and DNA Sequencing Assay (ChIP-Seq Assay)
Chromatin immunoprecipitation assay was performed as previously described (Bush et al., 2013). S. clavuligerus CagR-Flag (ΔcagRS:: cagR-[Gly4Ser]3-3∗Flag-cagS) was grown in four 50-mL SCF at 25°C for 72 h. Formaldehyde was added to cultures at a final concentration of 1% (vol/vol) for 30 min. Glycine was then added to a final concentration of 125 mM to stop the cross-linking. The samples were left at room temperature for 5 min and washed twice in PBS (phosphate-buffered saline, pH 7.4) buffer. The pellets were resuspended in 5 mL of ChIP-lysis buffer [10 mM Tris-HCl, pH 8.0, 50 mM NaCl, 1 mM phenylmethanesulfonyl fluoride (PMSF) and 15 mg/mL lysozyme] and incubated at 37°C for 30 min or until lysed. Then, 5 mL ChIP-IP buffer (50 mM Tris-Cl, pH 8.0, 250 mM NaCl, 0.8% [vol/vol] Triton X-100 and 1 mM PMSF) was added, and the samples were chilled on ice. Sonication was performed at a high-power setting for 40 cycles (10 s on and 10 s off) using an ultrasonic processor (FS-250N, Shengxi Ultrasonic Instrument Co., Ltd., Shanghai) to shear chromosomal DNA into fragments ranging from 200 to 500 bp on average. The samples were centrifuged at 12,000 rpm at 4°C for 10 min to collect the supernatant, after which 50 μL of each was set aside for total DNA extraction (input). Next, 40 μL of IgG-agarose (Sigma-Aldrich, A0919) was washed according to the manufacturer’s instructions and added to the remaining lysates. The mixtures were then incubated on a rotating wheel at 4°C for 2 h, and then the samples were centrifuged at 5,500 g at 4°C for 30 s to collect the supernatants. Next, the 40 μL anti-FLAG M2 Affinity Gel (Sigma-Aldrich, A2220) was washed according to the manufacturer’s instructions and added to the above supernatants. The mixtures were then incubated on a rotating wheel at 4°C overnight. The samples were centrifuged at 5,500 g at 4°C for 30 s, and the pellets were washed twice with 0.5 × ChIP-IP buffer and then twice with 1 × ChIP-IP buffer and transferred to new tubes after the first washing step. The pellets and 50 μL of total cell extracts (set aside earlier) were eluted overnight at 65°C in 100 μL of ChIP-IP elution buffer (50 mM Tris-HCl, pH 7.6, 10 mM EDTA and 1% SDS) to reverse the cross-links. The samples were centrifuged at 12,000 rpm for 5 min to remove the beads. The pellets were extracted with 50 μL of TE buffer (10 mM Tris-Cl, pH 7.4 and 1 mM EDTA) and incubated with 0.2 mg/mL proteinase K (Sigma) and 20 μg/mL RNase A (Sigma) for 2 h at 55°C. The samples were extracted twice with phenol-chloroform and once with chloroform and further purified using Bioteke columns (Bioteke, Beijing). DNA was quantified using a Nano-Drop spectrophotometer (Thermo Scientific).
ChIP-seq libraries were prepared and sequenced on a HiSeq 2500 sequencer (Illumina, Novogene) by Novogene Science and Technology Co., Ltd. BigWig files were generated from the alignment for visualization purposes (Kent et al., 2010). MACS2 (Model-based Analysis of ChIP-seq) was used to identify peaks using a p-value ≤ 0.005 (Zhang et al., 2008). To identify possible binding motifs of the CagR DNA-binding response regulator, the ChIP peak sequences were analyzed by Dreme software (Bailey and Elkan, 1994; Bailey, 2011).
Overexpression and Purification of His-Tagged CagR
The cagR gene of S. clavuligerus F613-1 was amplified using primer pairs cagRHis-F/R (Supplementary Table S2) and then inserted into the pMD18T vector to generate the intermediate recombinant plasmid pMD18T-cagR. After confirmation by DNA sequencing, cagR from pMD18T-cagR was cloned into the pET-15b expression vector, producing the recombinant plasmid pET-cagR. Finally, pET-cagR was introduced into E. coli BL21(DE3) for protein expression. His-tagged CagR protein was induced and purified as previously described (Fu et al., 2017). The purity of His-tagged CagR protein was determined on a 10% SDS-PAGE gel.
Electrophoretic Mobility Shift Assays (EMSAs)
PCR was used to amplify 150–300 bp fragments from the intergenic regions of genes using genomic DNA of F613-1 as template (primers are listed in Supplementary Table S2). The amplified DNA fragments were labeled at the 3′-end with biotin-11-UTP using the Biotin 3′ End DNA Labeling kit (Thermo Scientific), according to the manufacturer’s instruction. Non-specific cold probes (PolydI/dC) were added to control reaction mixtures as competitors. EMSAs were carried out as described previously (Zhang et al., 2015).
Results
Deletion of cagRS Results in Decreased Production of CA
Streptomyces clavuligerus F613-1 is an industrial CA producer, and its complete genome sequence has been reported (Cao et al., 2016). The putative TCS CagRS is located near the CA biosynthetic gene cluster in F613-1 (Figure 1C). To characterize the function of this TCS, a cagRS null mutant of F613-1 was constructed, and a complemented strain, ΔcagRScom, was also constructed by expressing cagRS in trans in the φC31 integration site in ΔcagRS (Figure 1A). Deletion and complementation were confirmed by PCR (Figure 1B).
On different media (BSCA, MSF, MM, and ISP4), no growth or phenotypic differences were noted for ΔcagRS compared with the parental strain F613-1 (Figure 2). Interestingly, a bioassay revealed that deletion of cagRS resulted in a modest reduction in CA biosynthesis, as indicated by the smaller diameter of the inhibition zone produced by ΔcagRS compared to that of the wild-type strain F613-1 (data not shown).
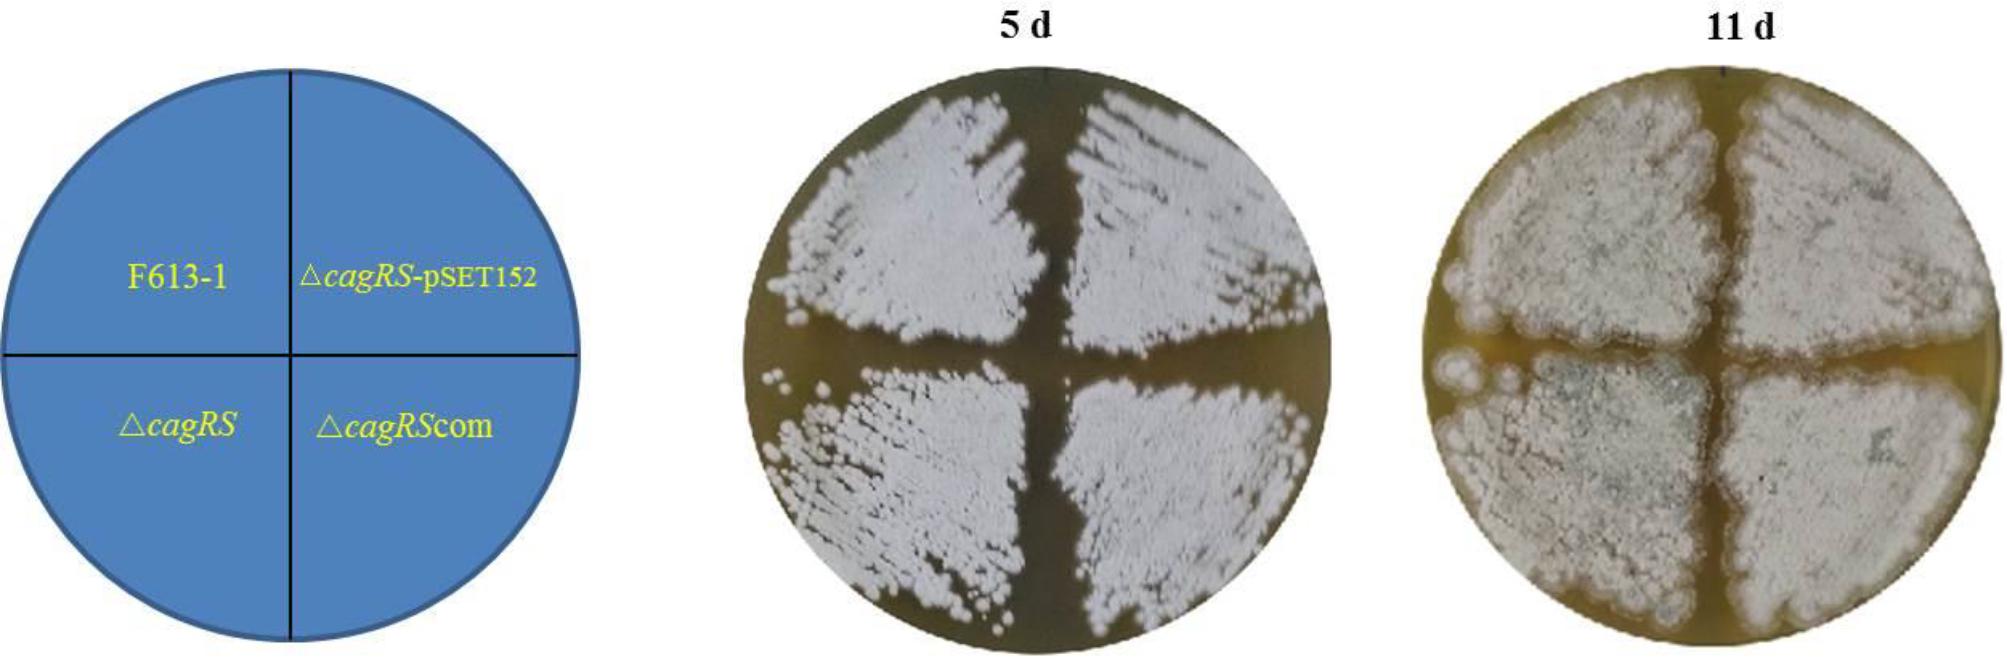
Figure 2. Phenotype of F613-1, ΔcagRS, ΔcagRS-pSET152, and ΔcagRS com on BCSA solid medium.
To examine the effect of CagRS on CA production in more detail, an HPLC assay was performed to quantitatively analyze the production of CA in ΔcagRS and F613-1. No differences were detected in the biomasses of ΔcagRS and F613-1 (Figures 3C,D). However, the CA concentration produced by ΔcagRS in fermentation medium supplemented with glycerol trioleate was decreased by 50.8% (t = 41, 63, P < 0.05) at 72 h, 40.9% (t = 69, 103, P < 0.05) at 120 h, 26.0% (t = 122, 190, P < 0.05) at 168 h, and by 26.1% (t = 109, 125, P < 0.05) at 216 h, when compared with production by F613-1 (Figure 3A). It was reported that the addition of glycerol trioleate could enhance CA production in S. clavuligerus NRRL 3585 (Kim et al., 2009). In this study, when compared with F613-1 levels, the CA concentrations produced by ΔcagRS in fermentation medium without glycerol trioleate were decreased by 87.9% (t = 32, 75, P < 0.05) at 72 h, 61.3% (t = 50, 101, P < 0.05) at 120 h, and 46.9% (t = 58, 99, P < 0.05) at 168 h (Figure 3B). The results revealed that CA production in ΔcagRS is decreased when compared with F613-1 whether or not glycerol trioleate is present in the fermentation medium, consistent with the bioassay results. Additionally, CA production by ΔcagRS dropped more markedly in the absence of glycerol trioleate supplementation, indicating that cagRS may affect metabolic processing of the CA direct precursor glyceraldehyde 3-phosphate (G3P).
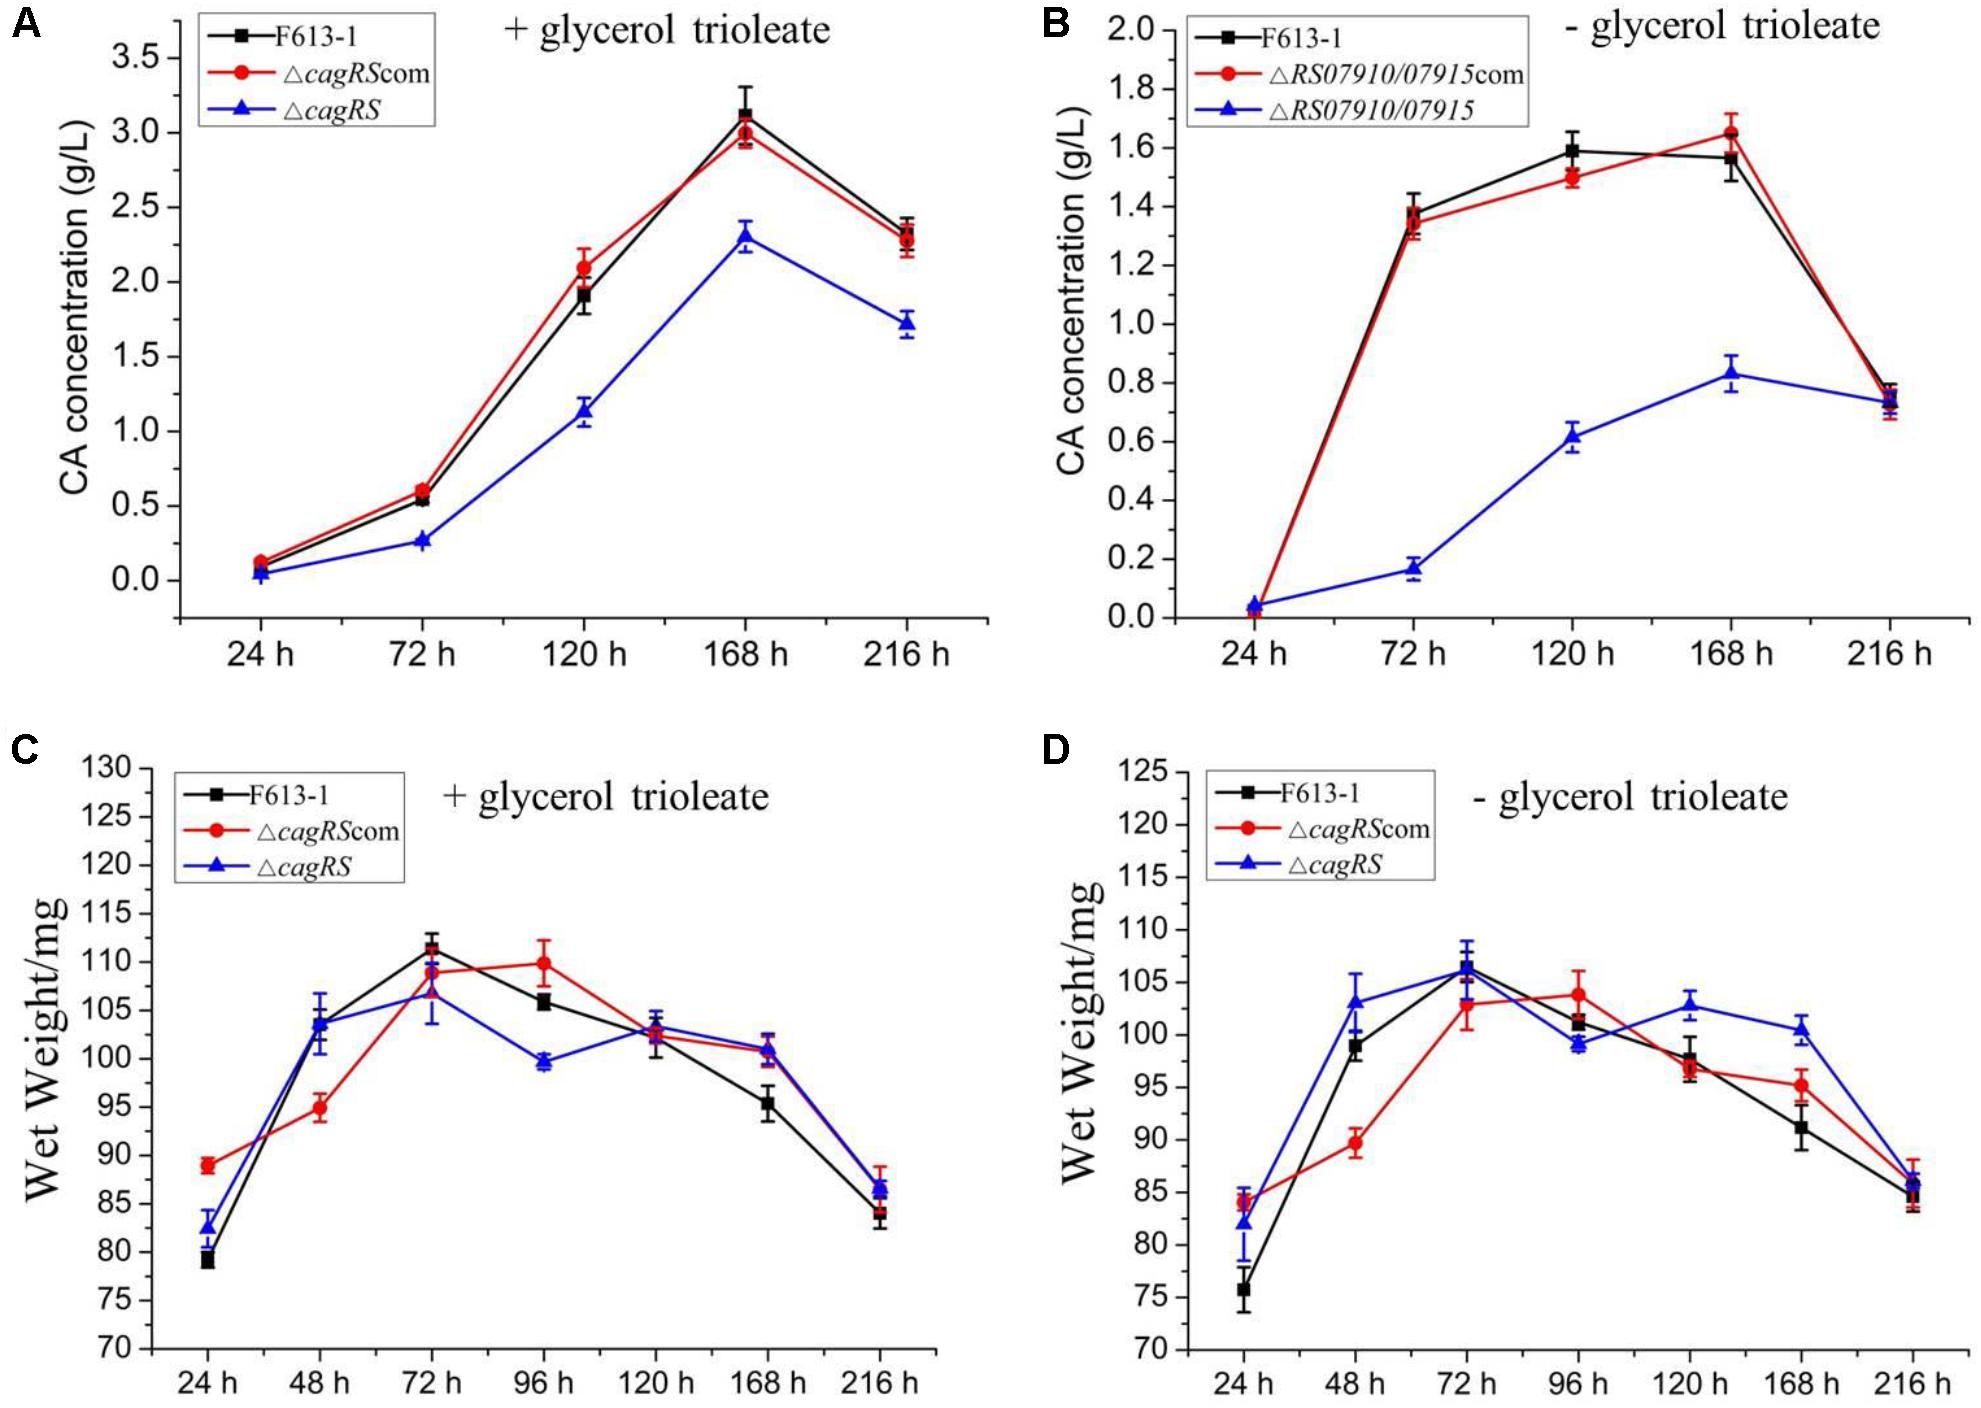
Figure 3. Clavulanic acid (CA) liquid fermentation titers of F613-1, ΔcagRS and the complemented strain. Analysis of the change of CA concentration during fermentation (A,B). For detecting CA production during the liquid fermentation process, spores (106/mL) were inoculated into 100 mL SCZ seed medium and cultured at 25°C, 200 rpm for 48 h to obtain seed cultures. Next, 5 mL seed cultures were transferred to 100 mL SCF fermentation medium supplemented with (A) or without (B) 1.6% (v/v) glycerol trioleate, and then grown at 25°C, 200 rpm for 216 h. To analyze CA concentration, 1 mL samples of fermentation liquid were collected at 24, 72, 120, 168, and 216 h, and centrifuged at 12000 rpm, 4°C, 5 min to collect the supernatant. Next, HPLC was performed immediately after the supernatant was filtered with a 0.22 mm filter membrane. (C,D) Growth curves of F613-1, ΔcagRS and ΔcagRScom with (C) or without (D) glycerol trioleate. Samples for growth curve analysis were harvested at seven time points (24, 48, 72, 96, 120, 168, and 216 h). Data are the mean ± SD of three separate experiments.
ΔcagRS was almost fully complemented by a wild-type copy of cagRS introduced into the φC31 integration site (Figures 2, 3), suggesting that the TCS CagRS contributes to regulation of CA production, although it does not affect the phenotype of S. clavuligerus F613-1.
Transcriptome Analysis Revealed That cagRS Regulates CA Production via Multiple Pathways
To gain further insights into the mechanisms by which CagRS regulates CA biosynthesis, transcriptome analysis was performed. Transcriptome sequencing revealed that 5943 genes were expressed in F613-1 under the test conditions, and 5843 genes were expressed in ΔcagRS. Statistical analysis showed that 2036 genes showed significant differences in expression (log2 FC > 1.0) between ΔcagRS and F613-1 during fermentation, with 1286 of these genes upregulated in ΔcagRS. The differentially expressed genes were further analyzed by Gene Ontology (GO) term enrichment analysis4 and KEGG pathway analysis5. Significant enrichment in GO terms was found mainly in the categories of “metabolic process,” “oxidation-reduction process,” and “regulation of transcription” (Supplementary Figure S3A). KEGG pathway analysis revealed that many of the differentially expressed genes are involved in fatty acid biosynthesis, pyruvate metabolism, arginine biosynthesis and carbon metabolism (Supplementary Figure S3B). RT-qPCR was also performed to validate the transcriptome results, and the results for the tested genes were in general agreement with the transcriptome results except for oat2 (Table 1).
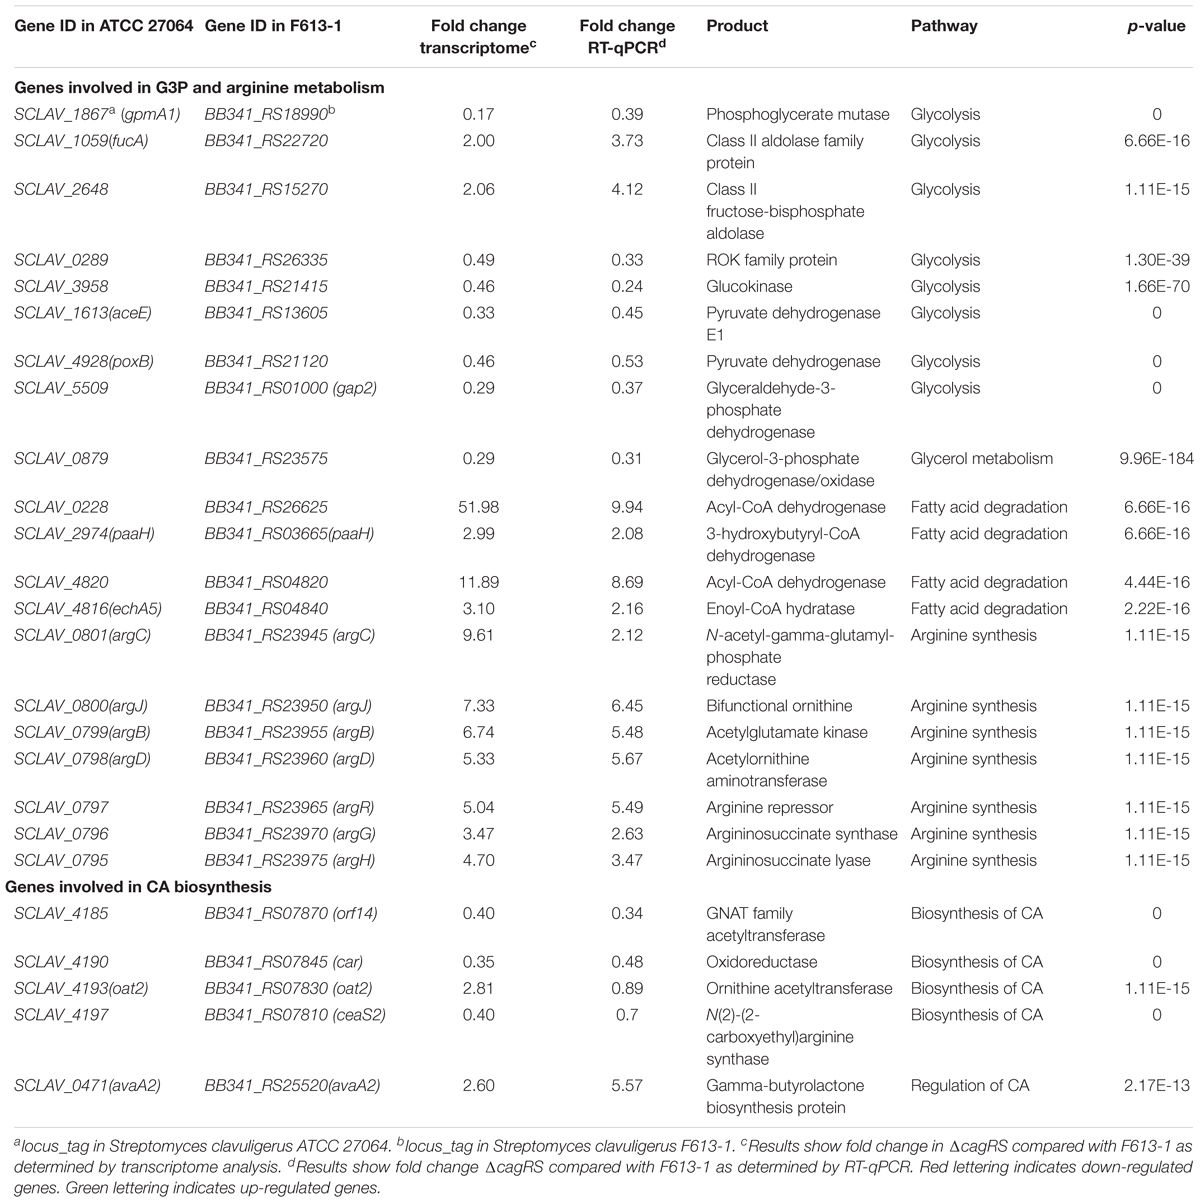
Table 1. Differential expression of genes associated with G3P and arginine metabolism and CA biosynthesis in ΔcagRS.
Arginine and G3P are two direct precursors of CA (Townsend and Meng-Fei, 1985; Khaleeli et al., 1999), and therefore, arginine and G3P metabolism may affect CA production. As shown in Table 1, the expression levels of all of the genes in the arginine biosynthetic gene cluster increased significantly in ΔcagRS compared with levels in F613-1, and the expression levels of many genes involved in G3P metabolism also changed notably in ΔcagRS compared with F613-1, suggesting that CagRS regulates arginine and G3P metabolism. In addition, the expression levels of ceaS2, oat2, car, and orf14, genes related to CA biosynthesis, were significantly changed in ΔcagRS when compared with F613-1 levels, suggesting that CagRS regulates the CA biosynthetic gene cluster. The above transcriptome data indicate that the TCS CagRS may affect CA production both directly, through the CA biosynthetic gene cluster, and indirectly, by affecting arginine and G3P metabolism.
ChIP-Seq Analysis of the in vivo Targets of the Response Regulator CagR
In order to further determine which genes are directly regulated in vivo by CagRS in S. clavuligerus F613-1, ChIP-seq analysis was conducted. Strain CagR-Flag was first constructed, which lacks CagRS at its native locus but expresses CagR and a C-terminal, triple Flag-tagged version of CagR. No growth or phenotypic differences were noted for strain CagR-Flag when compared with F613-1 and ΔcagRS, and the CA concentration of strain CagR -Flag was similar to F613-1 levels (Supplementary Figure S2A). Furthermore, CagR-[Gly4Ser]-3 × Flag was readily detected using anti-Flag antibody in western blot assays, without visible cross-reaction with any other protein, and the highest peak of CagR-[Gly4Ser]-3 × Flag expression emerged at 72 h during fermentation (Supplementary Figure S2B), suggesting optimal conditions for clean ChIP-seq experiments. Therefore, the mycelium of strain CagR-Flag was collected at 72 h during fermentation, and the ChIP-seq assay was conducted with Anti-FLAG M2 affinity gel. In addition, the total (non-immunoprecipitated) input DNA was used as a negative control.
The average DNA fragment sizes for the input and anti-Flag ChIP libraries were 294 and 253 bp, respectively. The input library had 12.74 million reads, and the Flag antibody ChIP library had 17.26 million reads. Over 95% of the reads were mapped to the S. clavuligerus F613-1 genome. The locations of the enriched peaks identified by the MACS2 program in the S. clavuligerus F613-1 genome are presented in a Supplemental Table (Additional File S2A). All 162 enriched regions were mapped to previously annotated genes in S. clavuligerus F613-1. Of those 162 CagR ChIP-seq targets, 22 targets are transcriptional regulators, and 41 targets are hypothetical proteins. In addition, eight targets of CagR are potentially involved in CA biosynthesis (Table 2 and Figure 4B): two genes (cyp450 and claR) located in the CA biosynthetic gene cluster; the BB341_RS25520 (avaA2) gene, as it encodes a gamma-butyrolactone biosynthesis protein and the γ-butyrolactone signaling system affects CA biosynthesis (Santamarta et al., 2005); pgk, encoding phosphoglycerate kinase; BB341_RS07030, BB341_RS26625 and BB341_RS03665 (paaH), which are involved in fatty acid degradation; and BB341_RS20995 (glnA3), a gene encoding glutamine synthetase, which is involved in arginine biosynthesis. Moreover, transcriptome analysis revealed that the expression level of the BB341_RS25520 (avaA2), BB341_RS26625 and BB341_RS03665 (paaH) genes increased significantly in ΔcagRS compared with F613-1 (Table 1).
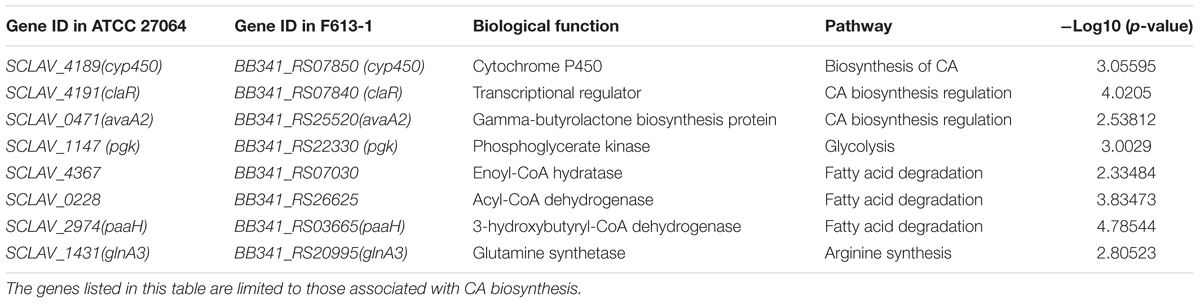
Table 2. Clavulanic acid (CA) biosynthesis-associated genes identified as CagR targets by ChIP-seq.
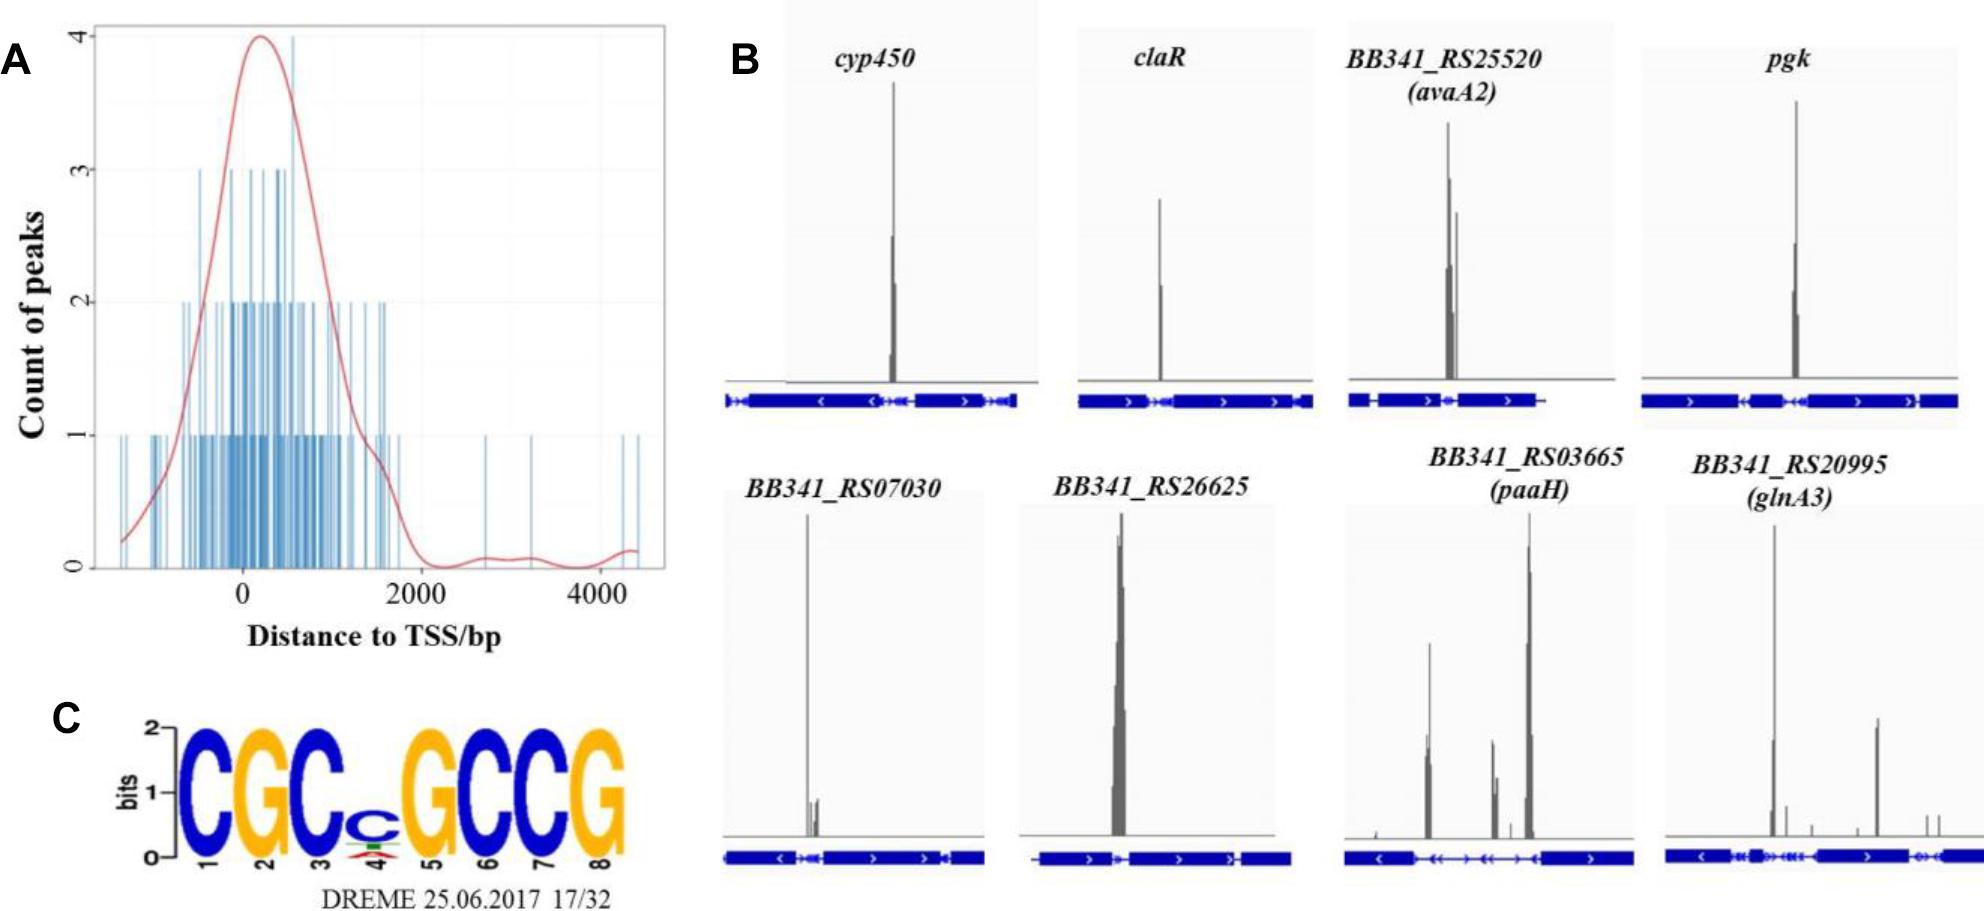
Figure 4. ChIP-seq data for the CagR target genes. (A) The distance between peak and transcription start site. TSS, transcription start site. The TSS of each peak-related gene is detected by Peak Annotator (Salmon-Divon et al., 2010). The count of peaks is calculated according to the distance between the peak and the TSS. (B) ChIP-seq peaks for eight selected CagR target genes: cyp450, claR, avaA2, pgk, BB341_RS07030, BB341_RS26625, paaHand glnA3. The blue boxes represent the gene coding regions, and the blue lines represent the intergenic regions. The eight corresponding ChIP-seq peak values for the negative control (input) dropped dramatically (data not shown). (C) The consensus binding sequence for CagR was determined by DREME (Discriminative Regular Expression Motif Elicitation) (Bailey, 2011). The height of the letters in the sequence logo, in bits, is proportional to the frequency of the A, C, T, or G nucleotides at each position of the motif. This sequence motif in S. clavuligerus F613-1 is nearly identical for that in S. clavuligerus ATCC27064.
Statistical analysis showed that the 162 enriched peaks were concentrated near transcriptional start sites, suggesting that CagR is a transcriptional regulatory protein (Figure 4A). Using the motif discovery algorithm DREME (Discriminative Regular Expression Motif Elicitation) (Bailey, 2011), the most significantly enriched motif within the peak regions was CGCNGCCG (P-value of 3.3e-10 and an E-value of 3.9e-009) (Figure 4C). Approximately 78% of the potential CagR targets had a CGCNGCCG motif correlating closely with the position of the ChIP-seq peak. Bioinformatics analysis found that the CGCNGCCG motif is also present in almost all homologous genes, i.e., the potential CagR target genes, in S. clavuligerus ATCC 27064. Of the 162 CagR ChIP-seq targets, approximately 35% of the associated genes showed a greater than twofold change in expression when comparing ΔcagRS to F613-1 in transcriptome analysis (Additional File S2B). Strikingly, 21% of the genes identified by ChIP-seq as CagR targets were upregulated significantly, and 16% were downregulated significantly, in ΔcagRS. These findings suggest that CagR is bifunctional, working almost equally as an activator and as a repressor to control differentiation in S. clavuligerus.
cagRS Regulates the Biosynthesis of Arginine, a Direct Precursor of CA
Arginine is one of the direct precursors for CA biosynthesis (Liras et al., 2008). Seven genes (argH, argG, argR, argD, argB, argJ, and argC) involved in the biosynthesis of arginine are located in the arginine biosynthetic gene cluster, in which argR, argD, and argB form an operon (Figure 5A). Transcriptome and RT-qPCR analyses revealed that the expression of the gene cluster increased significantly in ΔcagRS compared with F613-1 (Table 1). As deletion of CagRS was associated with activation of these seven consecutive genes, we speculated that CagR may interact directly with one or more of the intergenic regions in the arginine gene cluster. Therefore, we amplified five intergenic regions, i.e., the intergenic regions of argB, argC, argJ, argH, and argG, to use as probes in EMSAs. Obvious shifting was only observed with the intergenic region probes for argG and argC (Figure 5B and Supplementary Figure S5), and notably, these two intergenic regions contain sequences identical (argG) or highly similar (argC) to the conserved CGCNGCCG motif sequence (Figure 5C), consistent with the binding of CagR to these intergenic regions. However, we did not detect interactions between CagR and the intergenic region probes for the argB-D-R operon, argJ or argH, although the transcription levels of these genes also increased significantly in the ΔcagRS strain.
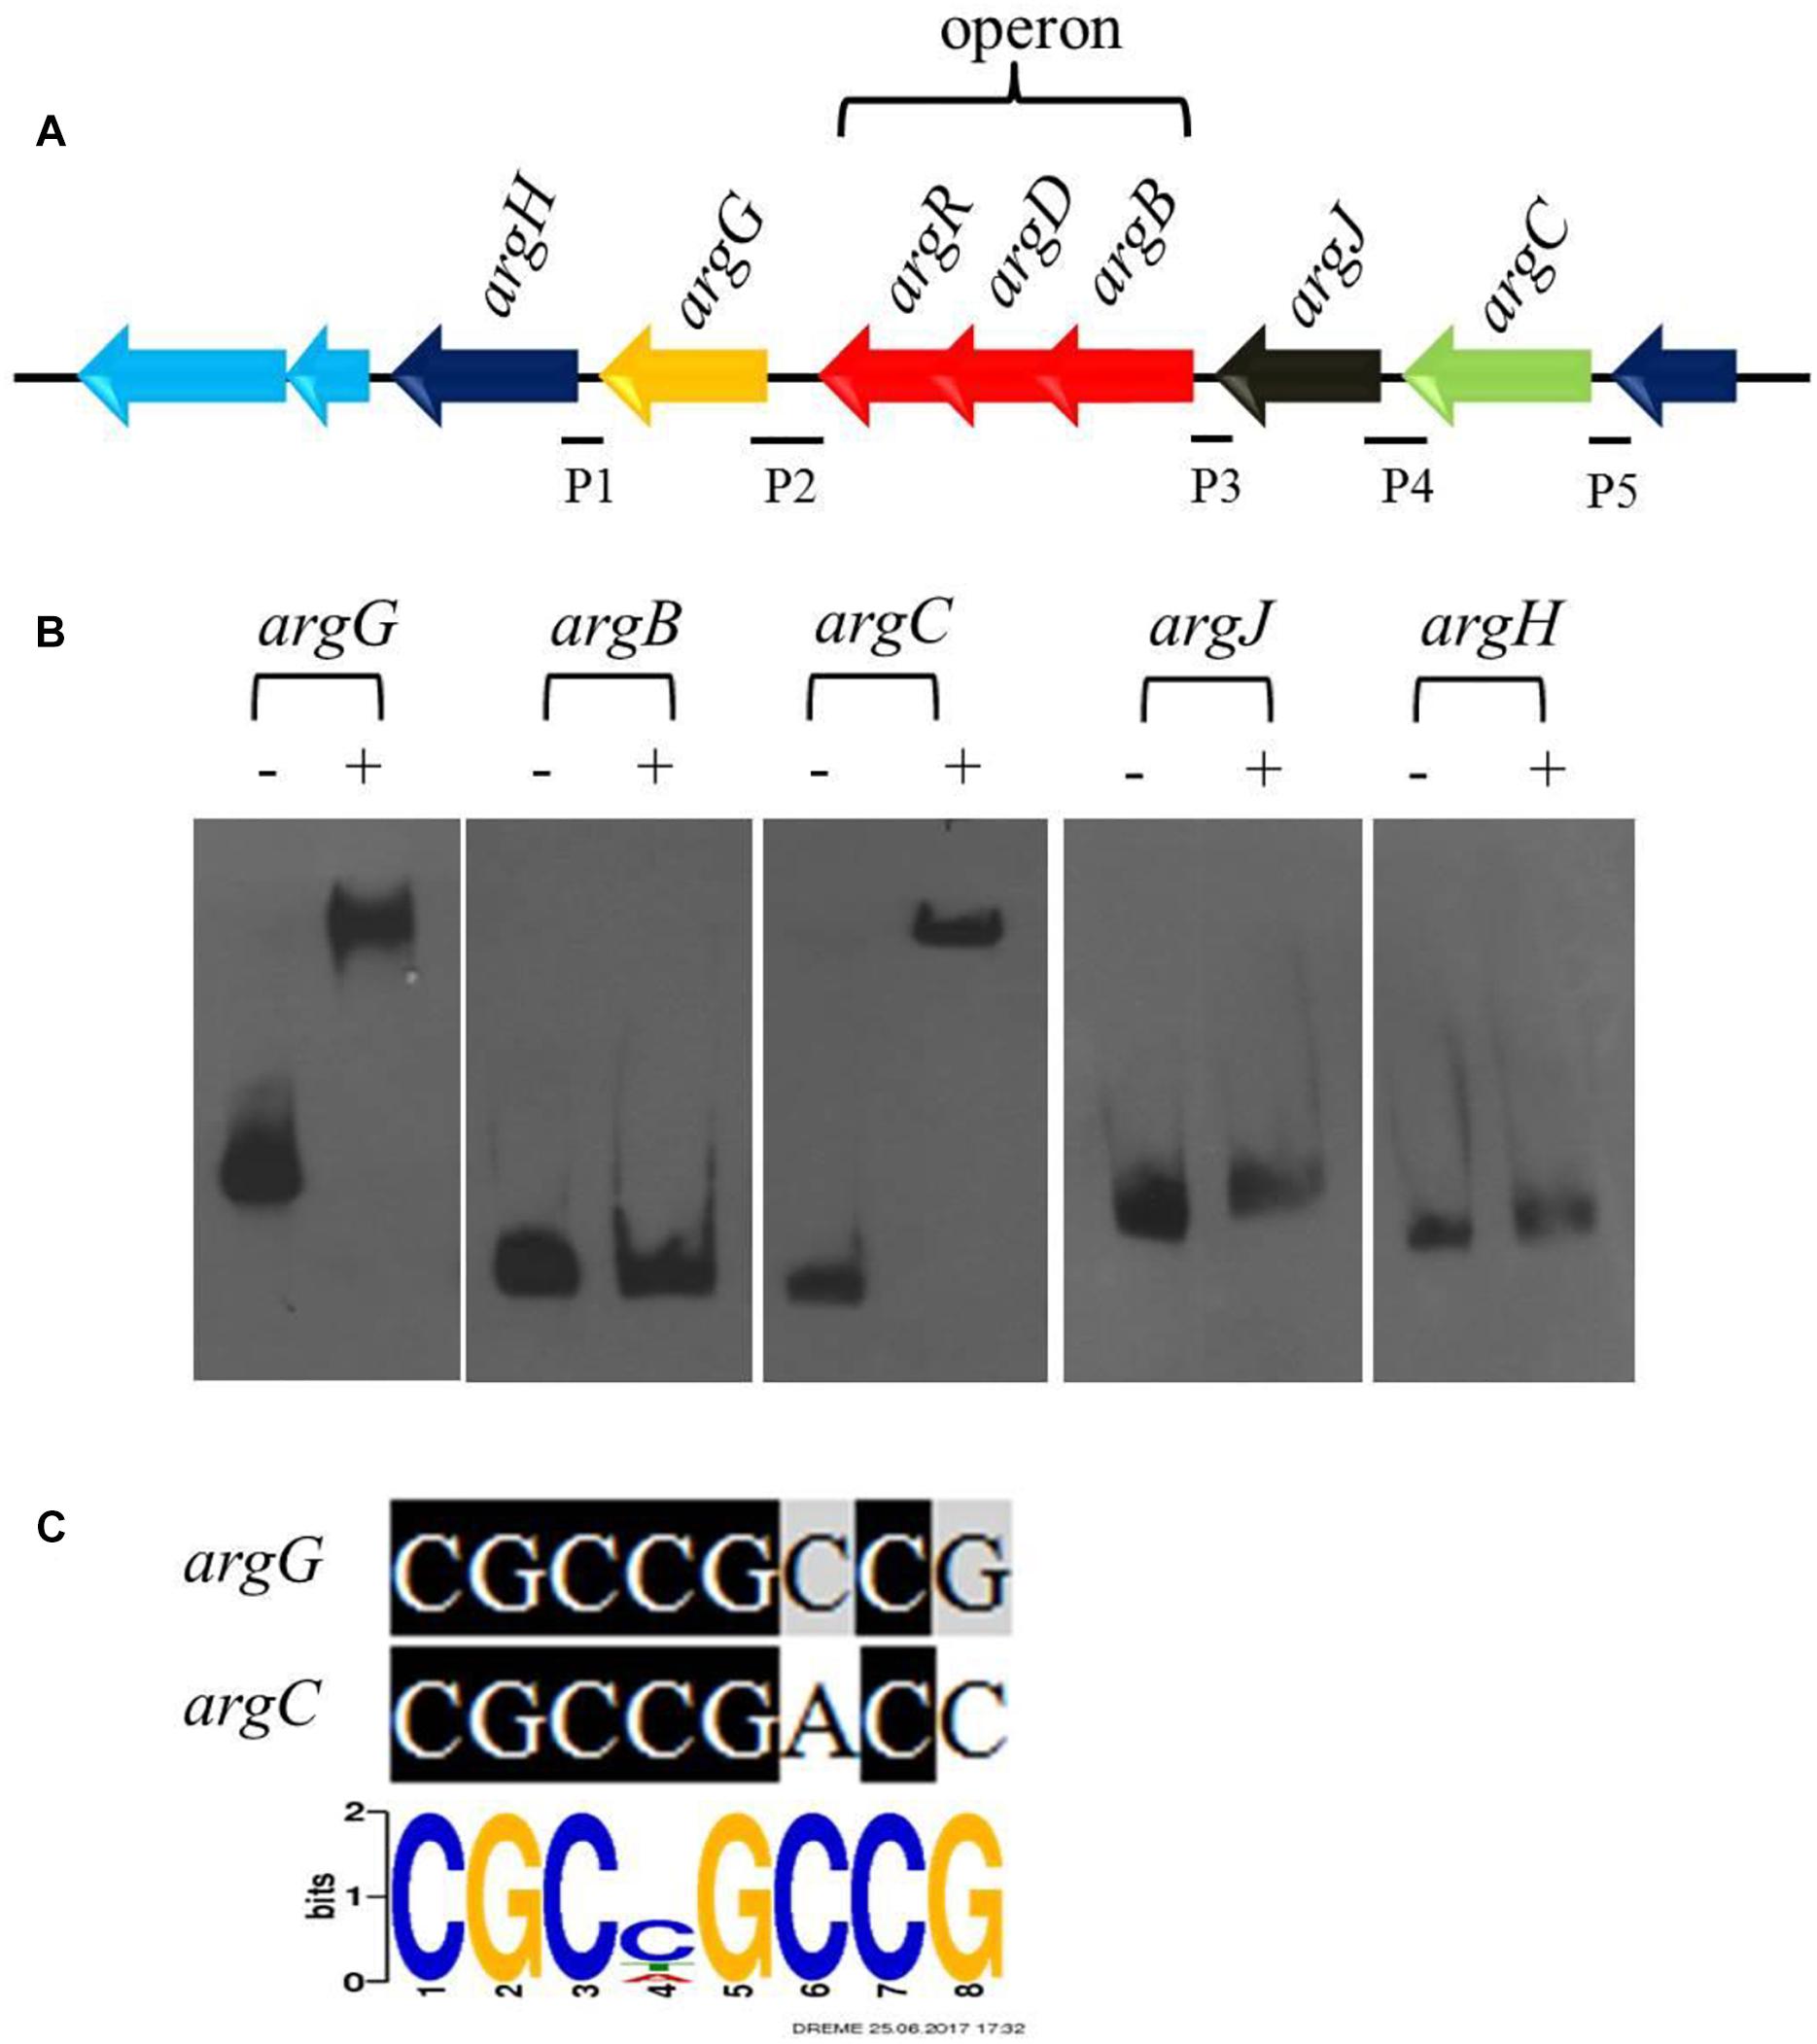
Figure 5. CagRS regulates the biosynthesis of arginine-the direct precursor of CA. (A) Schematic diagram of the arginine biosynthetic gene cluster. P1–P5 are different promoter regions of the arginine gene cluster: P1, 211 bp of the argH upstream region; P2, 299 bp of the argG upstream region; P3, 154 bp of the argB-D-R upstream region; P4, 271 bp of the argJ upstream region; P5, 160 bp of the argC upstream region. (B) The binding of CagR to the promoter regions of argC and argG. EMSAs of argG, argB, argC, argJ, and argH with purified His-tagged CagR. The promoter fragments were labeled with biotin-11-UTP using the Biotin 3′ End DNA Labeling kit. The above probes were incubated either with no protein (–) or 3.0 μg CagR (+). The appropriate amount of polydI/dC (1.0 mg) was used as competitor. (C) Comparison of argG and argC promoter sequences with the conserved CGCNGCCG motif for CagR binding.
cagRS May Regulate G3P Metabolic Processes
G3P is another direct primary metabolic precursor of CA (Khaleeli et al., 1999; Liras et al., 2008), and glyceraldehyde-3-phosphate dehydrogenases (GAPDHs) are responsible for catalyzing the formation of G3P into 1,3-diphosphoglycerate. Two genes (gap1 and gap2) encoding distinct GAPDHs have been characterized in S. clavuligerus 27064 (Li and Townsend, 2006). In this study, the expression level of gap2 in ΔcagRS was reduced significantly compared to levels in F613-1 (Table 1), whereas gap1 showed no significant differences in expression between the two strains. BB341_RS23575, which encodes glycerol-3-phosphate dehydrogenase, an enzyme involved in converting glycerol into G3P, was also significantly down-regulated in the mutant.
In addition, transcriptome analysis and RT-qPCR revealed that many genes involved in glycolysis, such as BB341_RS18990, BB341_RS26335, BB341_RS21415, BB341_RS13605, and BB341_RS21120, were also significantly down-regulated in ΔcagRS compared with F613-1 (Table 1). Furthermore, ChIP-seq assays revealed that BB341_RS22330 (pgk), encoding the phosphoglycerate kinase involved in glycolysis, may be directly regulated by CagR in vivo (Table 2 and Figure 4B). Both glycolysis and the glycerol-converting process affect G3P concentration, as summarized in Figure 8A, and our transcriptional data revealed that G3P concentration may be decreased in ΔcagRS when compared with F613-1.
Glycerol trioleate, which dissociates into glycerol and oleic acid, was reported to enhance CA production in S. clavuligerus (Kim et al., 2009), with the produced glycerol converted into G3P for CA production. We found that, although CA production decreased significantly in the absence of glycerol trioleate, CA concentration increased from 72 h to 168 h continuously in ΔcagRS, indicating that cagRS may affect primary metabolic processing of the direct CA precursor G3P.
cagRS Modulates Expression of the CA Biosynthetic Gene Cluster
As noted previously, gene clusters related to CA biosynthesis include the CA biosynthetic gene cluster, the paralog gene cluster and the clavam gene cluster (Figure 1C). Both the transcriptome and ChIP-seq analyses indicated that CagRS might affect the genes involved in CA biosynthesis (Tables 1, 2), so we speculated that CagR may interact directly with one or more of the promoters in the CA biosynthesis-related gene clusters. To investigate the targets of CagR, we amplified 14 promoter fragments (Figure 6A), which covered the upstream regions for 20 transcripts localizing to these gene clusters, to use as probes in EMSAs. Only the cas1 gene in the clavam gene cluster is involved in CA biosynthesis, but when incubated with purified His-tagged CagR, EMSA assays showed that CagR does not bind the intergenic region of cas1 (Figure 6A). ceaS1, bls1, pah1, and oat1 in the paralog gene cluster are also involved in CA biosynthesis, and EMSA assays showed that CagR does not bind the intergenic region of the bls1and pah1 genes, but CagR could bind the intergenic region of the ceaS1 and oat1 genes (Figure 6A and Supplementary Figure S5). For genes in the CA biosynthetic gene cluster, EMSA assays showed that CagR could bind the intergenic region of claR and oat2 genes (Figure 6A and Supplementary Figure S5). DNA sequence alignment also showed that promoter regions of claR, ceaS1, oat1, and oat2 contain sequences with strong similarity to the conserved CGCNGCCG motif (Figure 6B) in F613-1.
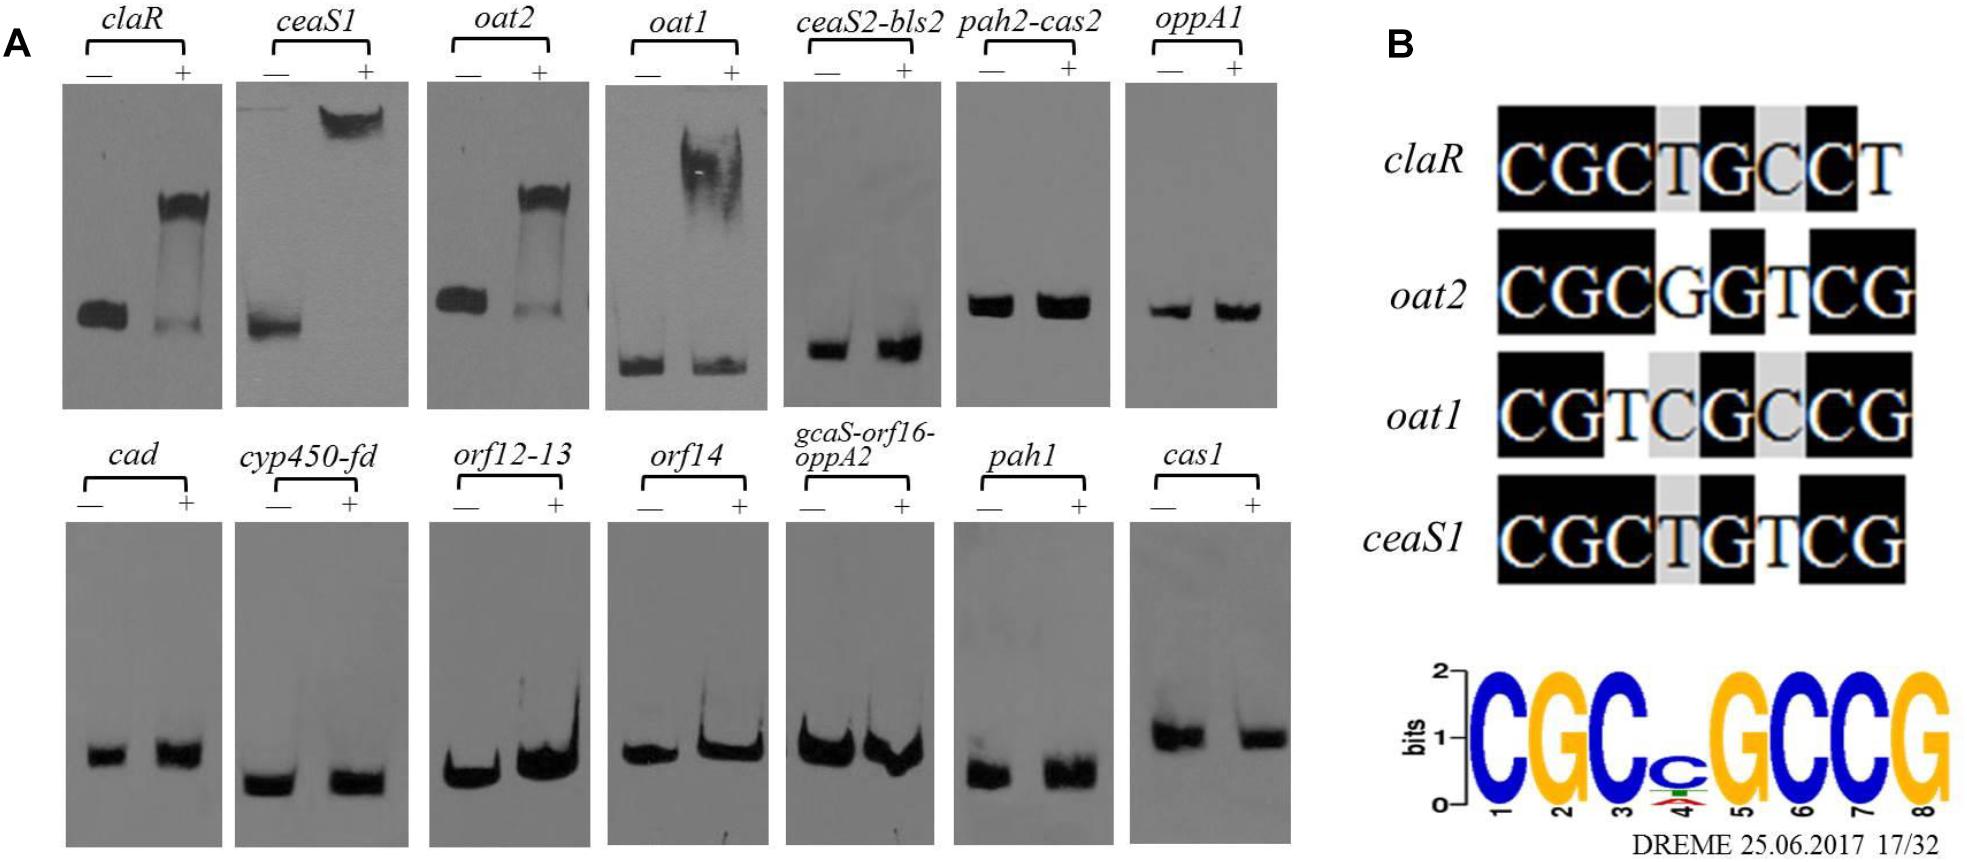
Figure 6. The binding of CagR to the promoter region of CA cluster genes. (A) The upstream promoter region of CA cluster genes are, respectively: 181 bp of the claR upstream region; 214 bp of the ceaS1 upstream region; 169 bp of the oat2 upstream region; 171 bp of the oat1 upstream region; 234 bp of the ceaS2-bls2 upstream region; 196 bp of the pah2-cas2 upstream region; 158 bp of the oppA1 upstream region; 191 bp of the car upstream region; 157 bp of the cyp450-fd upstream region; 246 bp of the orf12-orf13 upstream region; 137 bp of the orf14 upstream region; 171 bp of the gcaS-orf16-oppA2 upstream region; 213 bp of the pah1 upstream region; 183 bp of the cas1 upstream region. The probes were incubated either with no protein (–) or 3.0 μg CagR (+). The appropriate amount of polydI/dC (1.0 mg) was used as competitor. (B) Comparison of claR, oat2, oat1 and ceaS1 promoter sequences with the conserved motif for CagR binding.
The above data indicated that CagRS is directly associated with CA synthesis, so the relative expression levels of genes in the CA biosynthetic gene cluster, as well as of homologous genes needed for CA biosynthesis in the paralog and clavam gene clusters, were analyzed by RT-qPCR assays. The mycelium of F613-1 and ΔcagRS cultured at 24, 72, 120, 168, and 216 h was harvested, and the relative expression levels of genes involved in CA biosynthesis during the CA fermentation process were monitored. As shown in Figure 7, the expression level of claR, oat2, oppA1, oppA2, car, cyp450, orf12, orf14, orf16, and gcaS in the CA biosynthetic gene cluster increased during the fermentation process and peaked at 168 h; the expression level of oat1 and pah1 in the paralog gene cluster increased during the fermentation process and peaked at 168 h; and the expression level of cas1 in the clavam gene cluster also increased during the fermentation process and peaked at 168 h. When compared with F613-1 levels, the expression levels of almost all of the 20 tested genes were decreased in ΔcagRS before the 120 h time point. This trend in gene expression was similar to the trend in the CA fermentation levels (Figure 3).
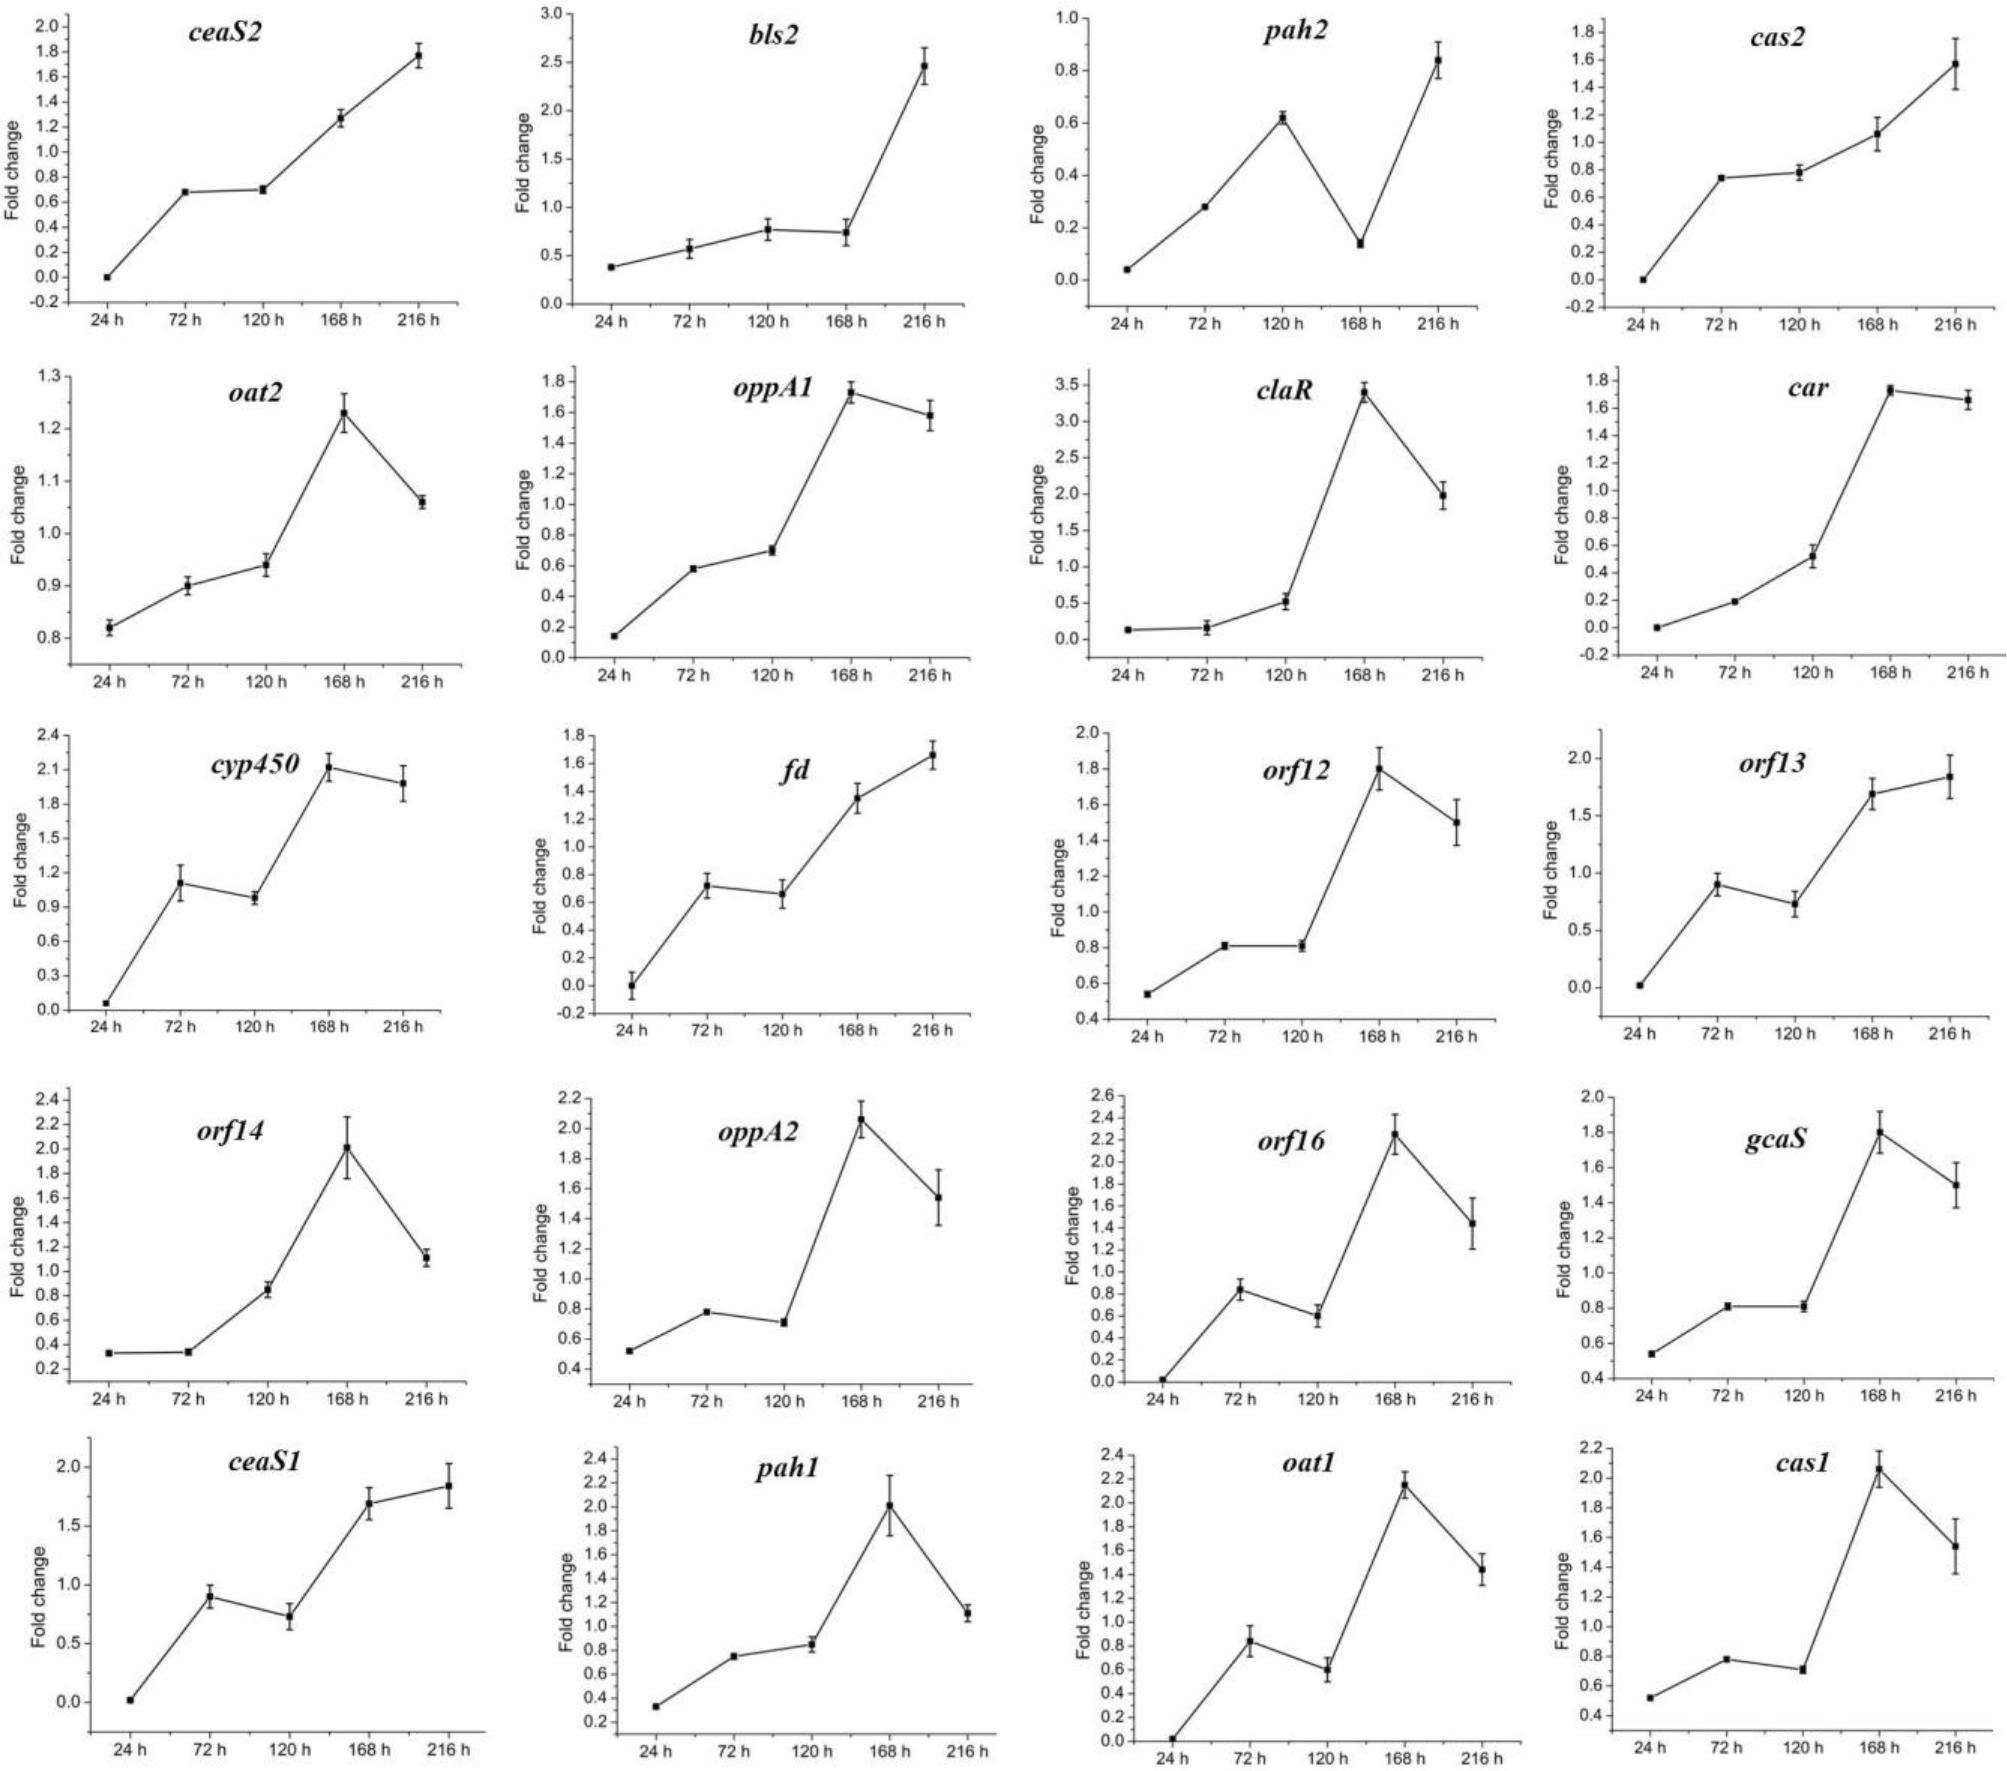
Figure 7. Expression of CA cluster genes by RT-qPCR in F613-1 and ΔcagRS. Results were normalized for 16S rDNA gene content and are shown as fold change over the F613-1 control, which was given a value of 1. Fold change: expression level in ΔcagRS compared with F613-1. Data are the mean ± SD of three separate experiments.
Discussion
cagRS Is a Global Regulatory TCS
Two-component regulatory systems constitute a family of proteins that mediate adaptation to changing environments by modifying the phosphorylated state of a pair of proteins: a sensor histidine kinase and a response regulator. TCSs are reported to be involved in a variety of bacterial cellular responses, such as biofilm development, morphological development, chemotaxis, sporulation, photosynthesis, osmoregulation, antibiotic production, and pathogenicity (Ogura and Tanaka, 2002; Bijlsma and Groisman, 2003; Hutchings et al., 2004; Mikkelsen et al., 2011). TCSs are very abundant in Streptomyces species and are reported to affect antibiotic production such as pimaricin biosynthesis (Mendes et al., 2007). The TCS orf22/orf23 of S. clavuligerus ATCC 27064 was reported to have high similarity to the TCS SCO4020/4021 of S. coelicolor A3(2) and to affect CA production in S. clavuligerus ATCC 27064; orf22/orf23 is located downstream of the CA gene cluster, and an orf23 deletion mutant reduced CA production, cell growth and sporulation in strain ATCC 27064 (Song et al., 2009). However, Jnawali et al. (2008) reported that orf23 deletion reduced CA production but had no effect on cell growth or morphological development. Beyond that, the mechanisms by which orf22/orf23 affects CA production have not been further investigated (Song et al., 2009). The TCS CagRS in S. clavuligerus F613-1, which was annotated as orf22/orf23 in ATCC 27064, is also located next to the CA biosynthetic gene cluster, and we found that deletion of CagRS significantly reduced CA production but did not affect the phenotype. We also found that single-gene deletion mutants of CagRS also significantly reduced CA production but did not affect the phenotype (Supplementary Figure S4). Our results with the cagRS double-gene deletion mutant were similar to those obtained with the previously described orf23 deletion mutant (Jnawali et al., 2008).
In our ChIP-seq experiments, enriched peaks were concentrated near transcriptional start sites, indicating that the response regulator CagR is indeed a transcriptional regulatory protein. Both the transcriptome and ChIP-seq data revealed that the TCS CagRS mainly regulates genes involved in fatty acid degradation, G3P and arginine metabolism, and CA production. Given the phenotype of the mutant and our transcriptome and ChIP-seq results, we conclude that CagRS is a global regulatory TCS and that this system regulates aspects of both primary metabolism (such as G3P and arginine metabolism) and secondary metabolism such as CA production. However, this TCS has little or no effect on phenotype or spore development under the test conditions.
cagRS Negatively Regulates Arginine Biosynthesis
As a direct precursor of CA biosynthesis, arginine is very important for CA production (Brian et al., 1993; Khaleeli et al., 1999). The arginine biosynthetic gene cluster of S. clavuligerus was characterized by Rodriguez-Garcia et al. (2000), and the schematic diagram of this cluster in S. clavuligerus F613-1 is shown in Figure 5A. In our study, transcriptome data revealed that deletion of cagRS resulted in the increased expression of the arginine biosynthetic gene cluster, and these findings were largely supported by RT-qPCR data for argB, argC, argJ, argH, and argG. Additionally, EMSAs revealed that CagR could bind to the promoter regions for argG and argC. Overall, these data suggest that CagRS modulates the biosynthesis of arginine in a negative manner.
cagRS May Positively Regulate G3P Metabolism
Glycerol, glycerol trioleate and other oils were reported to enhance CA production in S. clavuligerus (Baggaley et al., 1997; Ives and Bushell, 1997; Kim et al., 2009). The glycerol trioleate in the fermentation medium was absorbed into the cell and then was enzymatically dissociated into glycerol and oleic acid, with the produced glycerol converted into G3P (through primary metabolic pathways) for CA production. The produced G3P can also be converted into 1,3-bisphosphoglycerate by GAPDH in the glycolytic pathway and then enters the tricarboxylic acid cycle through pyruvate. Tricarboxylic acid cycle-intermediate accumulation is also reported to be associated with CA biosynthesis in S. clavuligerus (Ramirez-Malule et al., 2018). In this study, we found that conversion of glycerol into G3P may be inhibited in the ΔcagRS mutant strain because the gene (BB341_RS23575) that encodes glycerol-3-phosphate dehydrogenase was significantly down-regulated. Two genes (gap1 and gap2), whose protein products are distinct GAPDHs, were characterized in S. clavuligerus 27064, and whereas the gap1 mutant had twice the normal production levels of CA, the gap2 mutant produced a level of CA similar to that of the wild-type strain (Li and Townsend, 2006), indicating that gap1 plays a major role in converting G3P in S. clavuligerus. In ΔcagRS, the expression level of gap2 was reduced significantly compared with F613-1 levels; however, the expression level of gap1 was similar in the two strains, suggesting that the rate for conversion of G3P into acetyl-CoA in ΔcagRS would not differ greatly from that of F613-1. Additionally, our transcriptome and RT-qPCR analysis revealed that many genes involved in G3P and glycerol metabolism were significantly down-regulated in ΔcagRS compared with F613-1 (Table 1 and Figure 8A). Based on these data, we predict that the G3P concentration was therefore reduced, leading to the reduced CA production. Data from CA fermentation confirmedour hypothesis, as the amount of CA peaked at 168 h during the fermentation process whether supplemented with glycerol trioleate or not, but the CA concentration dropped significantly without glycerol trioleate.
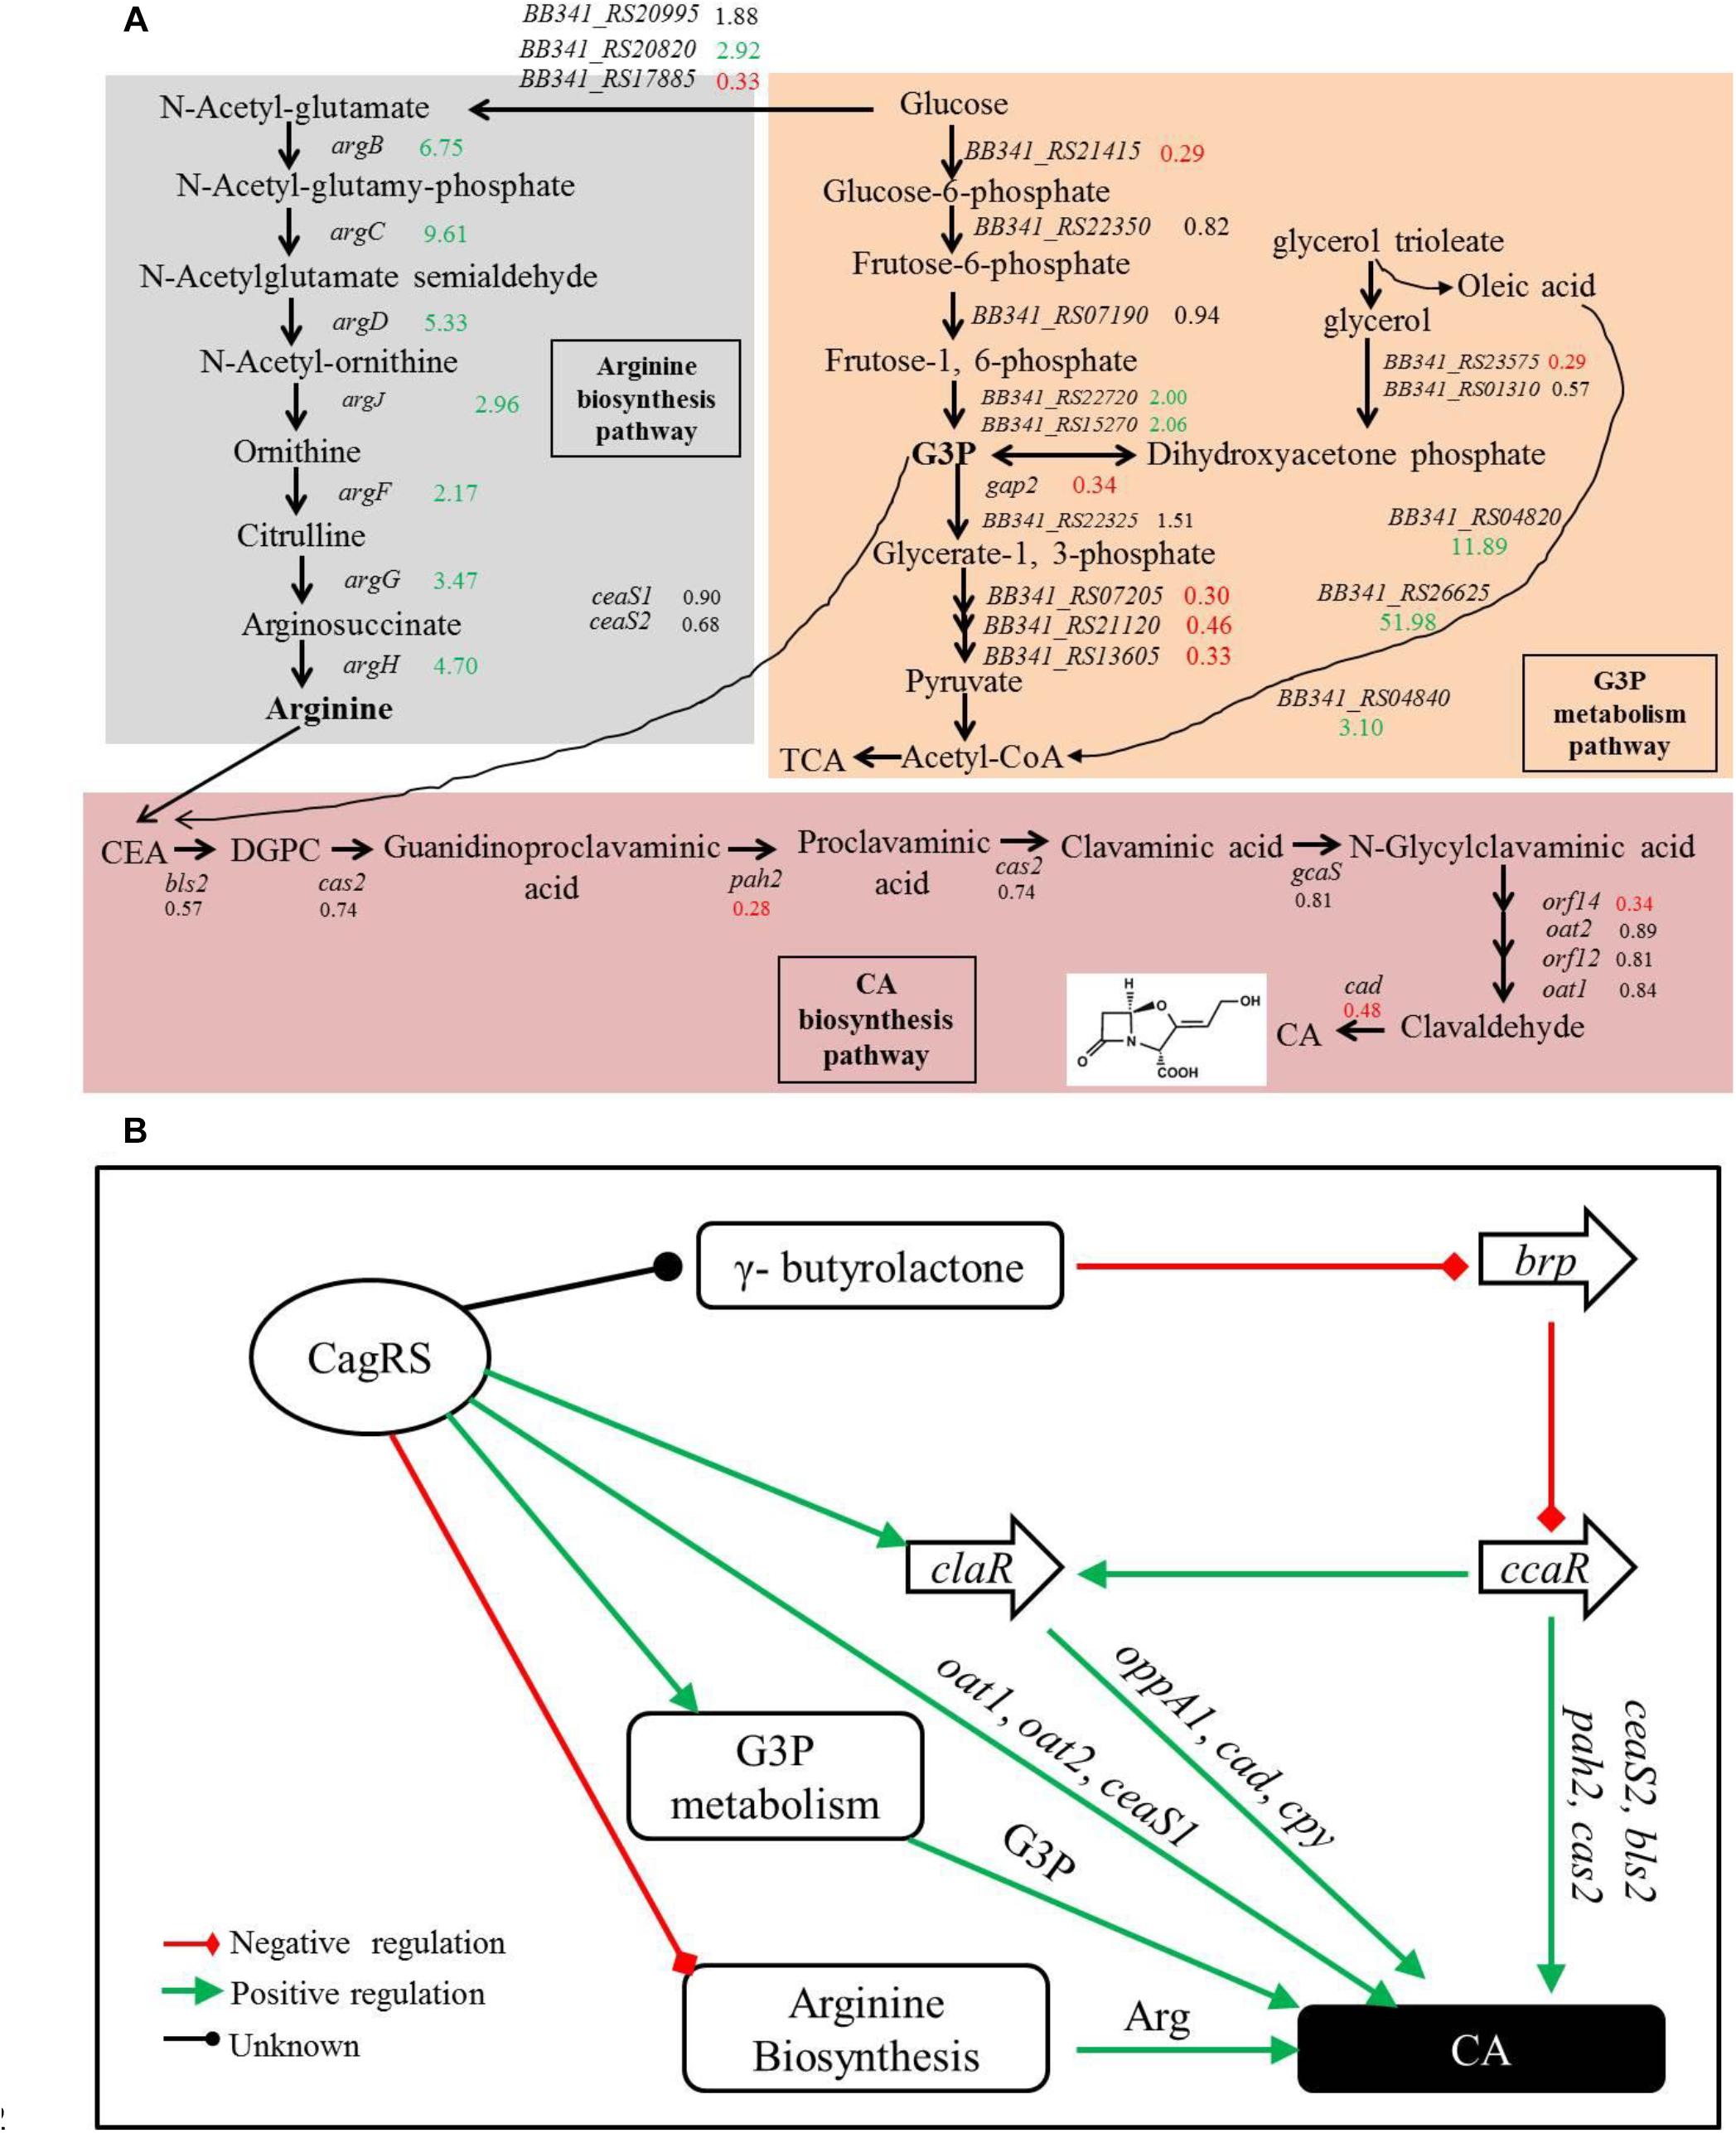
Figure 8. Clavulanic acid biosynthesis is regulated by the TCS CagRS. (A) Schematic overview of the expression profiles of genes involved in CA, G3P and the arginine metabolism pathway. CEA, N2-(2-carboxyethyl)-arginine; DGPC, deoxyguanidino-proclavaminic acid; TCA, tricarboxylic acid cycle. The numbers are the ratios of the comparative expression levels in ΔcagRS compared with the control F613-1, and the data are from the transcriptome and the RT-qPCR assays. Red indicates downregulation, green indicates upregulation, and black indicates no notable change. (B) Model of the TCS CagRS regulatory network of CA biosynthesis.
cagRS Positively Regulates the CA Biosynthetic Gene Cluster
Clavulanic acid is a potent β-lactamase inhibitor produced by S. clavuligerus F613-1 (Qin et al., 2017), a strain that also synthesizes cephamycin C (Reading and Cole, 1977) and a few other clavam-based structures. The biosynthesis pathway of CA and its related by-product (clavam) has been largely elucidated (Liras et al., 2008). However, there have been no reports on the global regulation of CA biosynthesis. In this study, deletion of CagRS resulted in markedly decreased production of CA, consistent with the reduced expression of multiple genes involved in CA biosynthesis at early time points, including pah2, bls2, claR, car (these four genes located in CA biosynthetic gene cluster), and oat1 (in paralog gene cluster), compared with levels in F613-1. ClaR is a pathway-specific regulatory factor of CA biosynthesis and positively regulates the expression of ceaS2 (Gomez-Escribano et al., 2006); the patterns of expression of the late CA synthetic genes, such as orf12, orf14, oppA1, oppA2, orf16, gcaS and car, were similar to claR expression patterns, indicating that cagRS may indirectly regulate these genes through claR. The above data indicate that CagRS positively regulates the expression of the CA biosynthetic gene cluster.
Our EMSAs revealed that CagR can interact with the promoters of ceaS1, oat1, and oat2. Both EMSA and ChIP-seq assays also revealed that CagR can interact with the claR promoter, indicating that CagR can directly regulate claR, thereby affecting the expression of ClaR target genes in the CA biosynthetic pathway. Given the above data, we propose that CagRS modulates CA biosynthesis through claR, ceaS1, oat1, and oat2. CcaR is another pathway-specific regulatory factor involved in the biosynthesis of CA and was reported to positively regulate the expression of early stage CA biosynthetic genes (such as ceaS2, bls2, pah2, and cas2) and claR (Santamarta et al., 2002, 2011; Alvarez-Alvarez et al., 2014), suggesting that CagR and CcaR both directly regulate CA synthesis. In addition, the γ-butyrolactone signaling system negatively regulates CA production through inhibiting ccaR (Santamarta et al., 2005). Interestingly, our ChIP-seq assays revealed that CagR can bind the promoter of the BB341_RS25520 (avaA2) gene, which encodes a gamma-butyrolactone biosynthesis protein, suggesting that CagR can also regulate CA production through the γ-butyrolactone signaling system-CcaR pathway (Figure 8B).
In conclusion, we found that CagR can modulate expression of the CA biosynthetic gene cluster and also affect genes involved in the metabolism of G3P and arginine, two direct precursors of CA. Our results provide new insights into the global regulation of CA biosynthesis and provide an important resource for future metabolic engineering efforts for CA production in S. clavuligerus.
Author Contributions
GC designed the work. RQ executed the experiments. JF analyzed the data and prepared the manuscript draft and revised the manuscript. GZ and CL carried out the interpretation of data, drawing up figures and statistical analysis. NK helped in data analysis. CZ contributed to the experimental design, manuscript preparation, and submission. All authors read and approved the final manuscript.
Funding
This work was supported by the National Natural Science Foundation of China (No. 31700065), Shandong Provincial Natural Science Foundation (No. ZR2017BC040), and the Innovation Project of the Shandong Academy of Medical Sciences (No. 201604).
Conflict of Interest Statement
The authors declare that the research was conducted in the absence of any commercial or financial relationships that could be construed as a potential conflict of interest.
Acknowledgments
We thank Dr. Susan T. Howard for critical reading of the manuscript.
Supplementary Material
The Supplementary Material for this article can be found online at: https://www.frontiersin.org/articles/10.3389/fmicb.2019.00244/full#supplementary-material
Footnotes
- ^http://www.genoscope.cns.fr/fastxtend
- ^http://hannonlab.cshl.edu/fastx_toolkit/
- ^http://www.ncbi.nlm.nih.gov/geo
- ^http://amigo.geneontology.org
- ^https://www.genome.jp/kegg/pathway.html
References
Alvarez-Alvarez, R., Rodriguez-Garcia, A., Santamarta, I., Perez-Redondo, R., Prieto-Dominguez, A., Martinez-Burgo, Y., et al. (2014). Transcriptomic analysis of Streptomyces clavuligerus deltaccar:tsr: effects of the cephamycin C-clavulanic acid cluster regulator CcaR on global regulation. Microb. Biotechnol. 7, 221–231. doi: 10.1111/1751-7915.12109
Arulanantham, H., Kershaw, N. J., Hewitson, K. S., Hughes, C. E., Thirkettle, J. E., and Schofield, C. J. (2006). ORF17 from the clavulanic acid biosynthesis gene cluster catalyzes the ATP-dependent formation of N-glycyl-clavaminic acid. J. Biol. Chem. 281, 279–287. doi: 10.1074/jbc.M507711200
Baggaley, K. H., Brown, A. G., and Schofield, C. J. (1997). Chemistry and biosynthesis of clavulanic acid and other clavams. Nat. Prod. Rep. 14, 309–333. doi: 10.1039/np9971400309
Bailey, T. L. (2011). DREME: motif discovery in transcription factor ChIP-seq data. Bioinformatics 27, 1653–1659. doi: 10.1093/bioinformatics/btr261
Bailey, T. L., and Elkan, C. (1994). Fitting a mixture model by expectation maximization to discover motifs in biopolymers. Proc. Int. Conf. Intell. Syst. Mol. Biol. 2, 28–36.
Bignell, D. R., Tahlan, K., Colvin, K. R., Jensen, S. E., and Leskiw, B. K. (2005). Expression of ccaR, encoding the positive activator of cephamycin C and clavulanic acid production in Streptomyces clavuligerus, is dependent on bldG. Antimicrob. Agents Chemother. 49, 1529–1541. doi: 10.1128/AAC.49.4.1529-1541.2005
Bijlsma, J. J., and Groisman, E. A. (2003). Making informed decisions: regulatory interactions between two-component systems. Trends Microbiol. 11, 359–366. doi: 10.1016/S0966-842X(03)00176-8
Brian, P. V., Christopher, R. B., Andrew, D., Jennifer, M., and Stephen, W. E. (1993). Evidence that arginine is a later metabolic intermediate than ornithine in the biosynthesis of clavulanic acid by Streptomyces clavuligerus. J. Chem. Soc. Chem. Commun. 15, 1210–1211. doi: 10.1039/C39930001210
Brown, A. G., Butterworth, D., Cole, M., Hanscomb, G., Hood, J. D., Reading, C., et al. (1976). Naturally-occurring beta-lactamase inhibitors with antibacterial activity. J. Antibiot. 29, 668–669. doi: 10.7164/antibiotics.29.668
Bush, M. J., Bibb, M. J., Chandra, G., Findlay, K. C., and Buttner, M. J. (2013). Genes required for aerial growth, cell division, and chromosome segregation are targets of WhiA before sporulation in Streptomyces venezuelae. mBio 4, e684–13. doi: 10.1128/mBio.00684-13
Cao, G., Zhong, C., Zong, G., Fu, J., Liu, Z., Zhang, G., et al. (2016). Complete genome sequence of Streptomyces clavuligerus F613-1, an industrial producer of clavulanic acid. Genome Announc. 4, e1020–16. doi: 10.1128/genomeA.01020-16
Fu, J., Zong, G., Zhang, P., Zhao, Z., Ma, J., Pang, X., et al. (2017). XdhR negatively regulates actinorhodin biosynthesis in Streptomyces coelicolor M145. FEMS Microbiol. Lett. 364:fnx226. doi: 10.1093/femsle/fnx226
Gomez-Escribano, J. P., Liras, P., Pisabarro, A., and Martin, J. F. (2006). An rplKDelta29-PALG-32 mutation leads to reduced expression of the regulatory genes ccaR and claR and very low transcription of the ceaS2 gene for clavulanic acid biosynthesis in Streptomyces clavuligerus. Mol. Microbiol. 61, 758–770. doi: 10.1111/j.1365-2958.2006.05266.x
Gomez-Escribano, J. P., Martin, J. F., Hesketh, A., Bibb, M. J., and Liras, P. (2008). Streptomyces clavuligerus relA-null mutants overproduce clavulanic acid and cephamycin C: negative regulation of secondary metabolism by (p)ppGpp. Microbiology 154, 744–755. doi: 10.1099/mic.0.2007/011890-0
Gust, B., Challis, G. L., Fowler, K., Kieser, T., and Chater, K. F. (2003). PCR-targeted Streptomyces gene replacement identifies a protein domain needed for biosynthesis of the sesquiterpene soil odor geosmin. Proc. Natl. Acad. Sci. U.S.A. 100, 1541–1546. doi: 10.1073/pnas.0337542100
Hodgson, J. E., Fosberry, A. P., Rawlinson, N. S., Ross, H. N., Neal, R. J., Arnell, J. C., et al. (1995). Clavulanic acid biosynthesis in Streptomyces clavuligerus: gene cloning and characterization. Gene 166, 49–55. doi: 10.1016/0378-1119(95)00560-9
Hutchings, M. I., Hoskisson, P. A., Chandra, G., and Buttner, M. J. (2004). Sensing and responding to diverse extracellular signals? Analysis of the sensor kinases and response regulators of Streptomyces coelicolor A3(2). Microbiology 150, 2795–2806. doi: 10.1099/mic.0.27181-0
Ishida, K., Hung, T. V., Liou, K., Lee, H. C., Shin, C. H., and Sohng, J. K. (2006). Characterization of pbpA and pbp2 encoding penicillin-binding proteins located on the downstream of clavulanic acid gene cluster in Streptomyces clavuligerus. Biotechnol. Lett. 28, 409–417. doi: 10.1007/s10529-005-6071-5
Ives, P. R., and Bushell, M. E. (1997). Manipulation of the physiology of clavulanic acid production in Streptomyces clavuligerus. Microbiology 143( Pt 11), 3573–3579. doi: 10.1099/00221287-143-11-3573
Jensen, S. E., Elder, K. J., Aidoo, K. A., and Paradkar, A. S. (2000). Enzymes catalyzing the early steps of clavulanic acid biosynthesis are encoded by two sets of paralogous genes in Streptomyces clavuligerus. Antimicrob. Agents Chemother. 44, 720–726. doi: 10.1128/AAC.44.3.720-726.2000
Jensen, S. E., and Paradkar, A. S. (1999). Biosynthesis and molecular genetics of clavulanic acid. Antonie Van Leeuwenhoek 75, 125–133. doi: 10.1023/A:1001755724055
Jensen, S. E., Paradkar, A. S., Mosher, R. H., Anders, C., Beatty, P. H., Brumlik, M. J., et al. (2004a). Five additional genes are involved in clavulanic acid biosynthesis in Streptomyces clavuligerus. Antimicrob. Agents Chemother. 48, 192–202. doi: 10.1128/AAC.48.1.192-202.2004
Jensen, S. E., Wong, A., Griffin, A., and Barton, B. (2004b). Streptomyces clavuligerus has a second copy of the proclavaminate amidinohydrolase gene. Antimicrob. Agents Chemother. 48, 514–520.
Jin, X., Cao, G., Zhang, X., Chen, Y., Wang, L., and Zhong, C. (2015). Studies on the formation and synthetic mechanism of related substance G in potassium clavulanate production. Braz. J. Pharm. Sci. 51, 77–83. doi: 10.1590/s1984-82502015000100008
Jnawali, H. N., Lee, H. C., and Sohng, J. K. (2010). Enhancement of clavulanic acid production by expressing regulatory genes in gap gene deletion mutant of Streptomyces clavuligerus NRRL3585. J. Microbiol. Biotechnol. 20, 146–152.
Jnawali, H. N., Liou, K., and Sohng, J. K. (2011). Role of sigma-factor (orf21) in clavulanic acid production in Streptomyces clavuligerus NRRL3585. Microbiol. Res. 166, 369–379. doi: 10.1016/j.micres.2010.07.005
Jnawali, H. N., Oh, T. J., Liou, K., Park, B. C., and Sohng, J. K. (2008). A two-component regulatory system involved in clavulanic acid production. J. Antibiot. 61, 651–659. doi: 10.1038/ja.2008.92
Jones, R. N., Craig, W. A., Ambrose, P. G., Dudley, M. N., and Pottumarthy, S. (2005). Reevaluation of Enterobacteriaceae MIC/disk diffusion zone diameter regression scattergrams for 9 beta-lactams: adjustments of breakpoints for strains producing extended spectrum beta-lactamases. Diagn. Microbiol. Infect. Dis. 52, 235–246. doi: 10.1016/j.diagmicrobio.2005.02.006
Kent, W. J., Zweig, A. S., Barber, G., Hinrichs, A. S., and Karolchik, D. (2010). Bigwig and bigbed: enabling browsing of large distributed datasets. Bioinformatics 26, 2204–2207. doi: 10.1093/bioinformatics/btq351
Khaleeli, N., Li, R. F., and Townsend, C. A. (1999). Origin of the β-Lactam carbons in clavulanic acid from an unusual thiamine pyrophosphate-mediated reaction. J. Am. Chem. Soc. 121, 9223–9224. doi: 10.1021/ja9923134
Kieser, T., Bibb, M. J., Chater, K. F., Buttner, M. J., and Hopwood, D. A. (2000). Practical Streptomyces Genetics: a Laboratory Manual. Norwich: John Innes Foundation.
Kim, S. J., Kim, J. O., Shin, C. H., Park, H. W., and Kim, C. W. (2009). An approach to strain improvement and enhanced production of clavulanic acid in Streptomyces clavuligerus. Biosci. Biotechnol. Biochem. 73, 160–164. doi: 10.1271/bbb.80569
Kopylova, E., Noe, L., and Touzet, H. (2012). SortMeRNA: fast and accurate filtering of ribosomal RNAs in metatranscriptomic data. Bioinformatics 28, 3211–3217. doi: 10.1093/bioinformatics/bts611
Kurt, A., Alvarez-Alvarez, R., Liras, P., and Ozcengiz, G. (2013). Role of the cmcH-ccaR intergenic region and ccaR overexpression in cephamycin C biosynthesis in Streptomyces clavuligerus. Appl. Microbiol. Biotechnol. 97, 5869–5880. doi: 10.1007/s00253-013-4721-4
Kwong, T., Tahlan, K., Anders, C. L., and Jensen, S. E. (2013). Carboxyethylarginine synthase genes show complex cross-regulation in Streptomyces clavuligerus. Appl. Environ. Microbiol. 79, 240–249. doi: 10.1128/AEM.02600-12
Li, R., and Townsend, C. A. (2006). Rational strain improvement for enhanced clavulanic acid production by genetic engineering of the glycolytic pathway in Streptomyces clavuligerus. Metab. Eng. 8, 240–252. doi: 10.1016/j.ymben.2006.01.003
Liras, P., Gomez-Escribano, J. P., and Santamarta, I. (2008). Regulatory mechanisms controlling antibiotic production in Streptomyces clavuligerus. J. Ind. Microbiol. Biotechnol. 35, 667–676. doi: 10.1007/s10295-008-0351-8
Liras, P., and Rodriguez-Garcia, A. (2000). Clavulanic acid, a beta-lactamase inhibitor: biosynthesis and molecular genetics. Appl. Microbiol. Biotechnol. 54, 467–475. doi: 10.1007/s002530000420
Lorenzana, L. M., Perez-Redondo, R., Santamarta, I., Martin, J. F., and Liras, P. (2004). Two oligopeptide-permease-encoding genes in the clavulanic acid cluster of Streptomyces clavuligerus are essential for production of the beta-lactamase inhibitor. J. Bacteriol. 186, 3431–3438. doi: 10.1128/JB.186.11.3431-3438.2004
Mackenzie, A. K., Valegard, K., Iqbal, A., Caines, M. E., Kershaw, N. J., Jensen, S. E., et al. (2010). Crystal structures of an oligopeptide-binding protein from the biosynthetic pathway of the beta-lactamase inhibitor clavulanic acid. J. Mol. Biol. 396, 332–344. doi: 10.1016/j.jmb.2009.11.045
Martinez-Burgo, Y., Alvarez-Alvarez, R., Rodriguez-Garcia, A., and Liras, P. (2015). The pathway-specific regulator ClaR of Streptomyces clavuligerus has a global effect on the expression of genes for secondary metabolism and differentiation. Appl. Environ. Microbiol. 81, 6637–6648. doi: 10.1128/AEM.00916-15
Mendes, M. V., Tunca, S., Anton, N., Recio, E., Sola-Landa, A., Aparicio, J. F., et al. (2007). The two-component phoR-phoP system of Streptomyces natalensis: inactivation or deletion of phoP reduces the negative phosphate regulation of pimaricin biosynthesis. Metab. Eng. 9, 217–227. doi: 10.1016/j.ymben.2006.10.003
Mikkelsen, H., Sivaneson, M., and Filloux, A. (2011). Key two-component regulatory systems that control biofilm formation in Pseudomonas aeruginosa. Environ. Microbiol. 13, 1666–1681. doi: 10.1111/j.1462-2920.2011.02495.x
Mosher, R. H., Paradkar, A. S., Anders, C., Barton, B., and Jensen, S. E. (1999). Genes specific for the biosynthesis of clavam metabolites antipodal to clavulanic acid are clustered with the gene for clavaminate synthase 1 in Streptomyces clavuligerus. Antimicrob. Agents Chemother. 43, 1215–1224. doi: 10.1128/AAC.43.5.1215
Ogura, M., and Tanaka, T. (2002). Recent progress in Bacillus subtilis two-component regulation. Front. Biosci. 7:d1815–d1824. doi: 10.2741/ogura
Paradkar, A. S., Aidoo, K. A., and Jensen, S. E. (1998). A pathway-specific transcriptional activator regulates late steps of clavulanic acid biosynthesis in Streptomyces clavuligerus. Mol. Microbiol. 27, 831–843. doi: 10.1046/j.1365-2958.1998.00731.x
Paradkar, A. S., and Jensen, S. E. (1995). Functional analysis of the gene encoding the clavaminate synthase 2 isoenzyme involved in clavulanic acid biosynthesis in Streptomyces clavuligerus. J. Bacteriol. 177, 1307–1314. doi: 10.1128/jb.177.5.1307-1314.1995
Paradkar, A. S., Mosher, R. H., Anders, C., Griffin, A., Griffin, J., Hughes, C., et al. (2001). Applications of gene replacement technology to Streptomyces clavuligerus strain development for clavulanic acid production. Appl. Environ. Microbiol. 67, 2292–2297. doi: 10.1128/AEM.67.5.2292-2297.2001
Perez-Redondo, R., Rodriguez-Garcia, A., Martin, J. F., and Liras, P. (1998). The claR gene of Streptomyces clavuligerus, encoding a LysR-type regulatory protein controlling clavulanic acid biosynthesis, is linked to the clavulanate-9-aldehyde reductase (car) gene. Gene 211, 311–321. doi: 10.1016/S0378-1119(98)00106-1
Qin, R., Zhong, C., Zong, G., Fu, J., Pang, X., and Cao, G. (2017). Improvement of clavulanic acid production in Streptomyces clavuligerus F613-1 by using a claR - neo reporter strategy. Electron. J. Biotechnol. 28, 41–46. doi: 10.1016/j.ejbt.2017.05.002
Ramirez-Malule, H., Junne, S., Nicolas Cruz-Bournazou, M., Neubauer, P., and Rios-Estepa, R. (2018). Streptomyces clavuligerus shows a strong association between TCA cycle intermediate accumulation and clavulanic acid biosynthesis. Appl. Microbiol. Biotechnol. 102, 4009–4023. doi: 10.1007/s00253-018-8841-8
Reading, C., and Cole, M. (1977). Clavulanic acid: a beta-lactamase-inhiting beta-lactam from Streptomyces clavuligerus. Antimicrob. Agents Chemother. 11, 852–857. doi: 10.1128/AAC.11.5.852
Rodriguez-Garcia, A., De La Fuente, A., Perez-Redondo, R., Martin, J. F., and Liras, P. (2000). Characterization and expression of the arginine biosynthesis gene cluster of Streptomyces clavuligerus. J. Mol. Microbiol. Biotechnol. 2, 543–550. doi: 10.1128/AAC.11.5.852
Salmon-Divon, M., Dvinge, H., Tammoja, K., and Bertone, P. (2010). PeakAnalyzer: genome-wide annotation of chromatin binding and modification loci. BMC Bioinformatics 11:415. doi: 10.1186/1471-2105-11-415
Sambrook, J., Fritsch, E. F., and Maniatis, J. (1989). Molecular Cloning: a Laboratory Manual, 2nd Edn. Cold Spring Harbor, NY: Cold Spring Harbor Laboratory Press.
Santamarta, I., Lopez-Garcia, M. T., Kurt, A., Nardiz, N., Alvarez-Alvarez, R., Perez-Redondo, R., et al. (2011). Characterization of DNA-binding sequences for CcaR in the cephamycin-clavulanic acid supercluster of Streptomyces clavuligerus. Mol. Microbiol. 81, 968–981. doi: 10.1111/j.1365-2958.2011.07743.x
Santamarta, I., Perez-Redondo, R., Lorenzana, L. M., Martin, J. F., and Liras, P. (2005). Different proteins bind to the butyrolactone receptor protein are sequence located upstream of the regulatory ccaR gene of Streptomyces clavuligerus. Mol. Microbiol. 56, 824–835. doi: 10.1111/j.1365-2958.2005.04581.x
Santamarta, I., Rodriguez-Garcia, A., Perez-Redondo, R., Martin, J. F., and Liras, P. (2002). CcaR is an autoregulatory protein that binds to the ccaR and cefD-cmcI promoters of the cephamycin C-clavulanic acid cluster in Streptomyces clavuligerus. J. Bacteriol. 184, 3106–3113. doi: 10.1128/JB.184.11.3106-3113.2002
Saudagar, P. S., Survase, S. A., and Singhal, R. S. (2008). Clavulanic acid: a review. Biotechnol. Adv. 26, 335–351. doi: 10.1016/j.biotechadv.2008.03.002
Song, J. Y., Jensen, S. E., and Lee, K. J. (2010). Clavulanic acid biosynthesis and genetic manipulation for its overproduction. Appl. Microbiol. Biotechnol. 88, 659–669. doi: 10.1007/s00253-010-2801-2
Song, J. Y., Kim, E. S., Kim, D. W., Jensen, S. E., and Lee, K. J. (2009). A gene located downstream of the clavulanic acid gene cluster in Streptomyces clavuligerus ATCC 27064 encodes a putative response regulator that affects clavulanic acid production. J. Ind. Microbiol. Biotechnol. 36, 301–311. doi: 10.1007/s10295-008-0499-2
Tahlan, K., Anders, C., and Jensen, S. E. (2004a). The paralogous pairs of genes involved in clavulanic acid and clavam metabolite biosynthesis are differently regulated in Streptomyces clavuligerus. J. Bacteriol. 186, 6286–6297. doi: 10.1128/JB.186.18.6286-6297.2004
Tahlan, K., Park, H. U., Wong, A., Beatty, P. H., and Jensen, S. E. (2004b). Two sets of paralogous genes encode the enzymes involved in the early stages of clavulanic acid and clavam metabolite biosynthesis in Streptomyces clavuligerus. Antimicrob. Agents Chemother. 48, 930–939. doi: 10.1128/AAC.48.3.930-939.2004
Townsend, C. A., and Meng-Fei, H. (1985). Biosynthesis of clavulanic acid_ origin of the C5 Unit. J. Am. Chem. 107, 1065–1066. doi: 10.1021/ja00290a056
Zhang, P., Wu, H., Chen, X. L., Deng, Z., Bai, L., and Pang, X. (2014). Regulation of the biosynthesis of thiopeptide antibiotic cyclothiazomycin by the transcriptional regulator SHJG8833 in Streptomyces hygroscopicus 5008. Microbiology 160, 1379–1392. doi: 10.1099/mic.0.076901-0
Zhang, P., Wu, L., Zhu, Y., Liu, M., Wang, Y., Cao, G., et al. (2017). Deletion of MtrA inhibits cellular development of Streptomyces coelicolor and alters expression of developmental regulatory genes. Front. Microbiol. 8:2013. doi: 10.3389/fmicb.2017.02013
Zhang, P., Zhao, Z., Li, H., Chen, X. L., Deng, Z., Bai, L., et al. (2015). Production of the antibiotic FR-008/candicidin in Streptomyces sp. FR-008 is co-regulated by two regulators, FscRI and FscRIV, from different transcription factor families. Microbiology 161, 539–552. doi: 10.1099/mic.0.000033
Keywords: Streptomyces clavuligerus, clavulanic acid, CagRS, arginine, glyceraldehyde 3-phosphate, primary metabolism
Citation: Fu J, Qin R, Zong G, Liu C, Kang N, Zhong C and Cao G (2019) The CagRS Two-Component System Regulates Clavulanic Acid Metabolism via Multiple Pathways in Streptomyces clavuligerus F613-1. Front. Microbiol. 10:244. doi: 10.3389/fmicb.2019.00244
Received: 23 September 2018; Accepted: 29 January 2019;
Published: 14 February 2019.
Edited by:
Marie-Joelle Virolle, Centre National de la Recherche Scientifique (CNRS), FranceReviewed by:
Rigoberto Rios-Estepa, Universidad de Antioquía, ColombiaHung Viet Trinh, Henry M. Jackson Foundation, United States
Copyright © 2019 Fu, Qin, Zong, Liu, Kang, Zhong and Cao. This is an open-access article distributed under the terms of the Creative Commons Attribution License (CC BY). The use, distribution or reproduction in other forums is permitted, provided the original author(s) and the copyright owner(s) are credited and that the original publication in this journal is cited, in accordance with accepted academic practice. No use, distribution or reproduction is permitted which does not comply with these terms.
*Correspondence: Chuanqing Zhong, emhvbmdjaHVhbnFpbmdAc2Rqei5lZHUuY24= Guangxiang Cao, Y2FvemhvbmcwNDAyQDE2My5jb20=