
94% of researchers rate our articles as excellent or good
Learn more about the work of our research integrity team to safeguard the quality of each article we publish.
Find out more
ORIGINAL RESEARCH article
Front. Microbiol. , 07 August 2018
Sec. Fungi and Their Interactions
Volume 9 - 2018 | https://doi.org/10.3389/fmicb.2018.01781
 Qiangyi Wang1
 Minghao Du1,2
 Shuai Wang3Linxia Liu4,5Liming Xiao1,2Linqi Wang4
 Tong Li1*
 Hui Zhuang1*
 Ence Yang1,2*
The opportunistic human pathogen Talaromyces marneffei exhibits a temperature-dependent dimorphic transition, which is closely related with its pathogenicity. This species grows as multinucleate mycelia that produce infectious conidia at 25°C, while undergoes a dimorphic transition to generate uninucleate yeast form cells at 37°C. The mechanisms of phenotype switching are not fully understood. The transcription factor madsA gene is a member of the MADS-box gene family. Previously, it was found that overexpression of madsA gene resulted in mycelial growth instead of yeast form at 37°C. In the current study, the madsA deletion mutant (ΔmadsA) and complemented strain (CMA) were constructed by genetic manipulation. We compared the phenotypes, growth, conidiation, conidial germination and susceptibility to stresses (including osmotic and oxidative) of the ΔmadsA with the wild-type (WT) and CMA strains. The results showed that the ΔmadsA displayed a faster process of the yeast-to-mycelium transition than the WT and CMA. In addition, the deletion of madsA led to a delay in conidia production and conidial germination. The tolerance of ΔmadsA conidia to hydrogen peroxide was better than that of the WT and CMA strains. Then, RNA-seq was performed to identify differences in gene expression between the ΔmadsA mutant and WT strain during the yeast phase, mycelium phase, yeast-to-mycelium transition and mycelium-to-yeast transition, respectively. Gene ontology functional enrichment analyses indicated that some important processes such as transmembrane transport, oxidation-reduction process, protein catabolic process and response to oxidative stress were affected by the madsA deletion. Together, our results suggest that madsA functions as a global regulator involved in the conidiation and germination, especially in the dimorphic transition of T. marneffei. Its roles in the survival, pathogenicity and transmission of T. marneffei require further investigation.
Talaromyces marneffei (formerly Penicillium marneffei) is a significant emerging pathogenic fungus endemic in Southeast Asia and South China (Vanittanakom et al., 2006; Hu et al., 2013; Yilmaz et al., 2014). Although an increasing number of cases have been reported in non-human immunodeficiency virus (HIV) infected patients (Chan et al., 2016), T. marneffei mainly infects HIV-positive patients (Wong and Wong, 2011; Hu et al., 2013). In endemic areas, penicilliosis marneffei, the disease caused by T. marneffei, has been the third most prevalent opportunistic infection in HIV-positive patients after tuberculosis and cryptococcosis, and therefore has become an important acquired immune deficiency syndrome defining condition (Supparatpinyo et al., 1994). The clinical manifestation of T. marneffei infection is characterized by a variety of symptoms, including fever, anemia, weight loss, lymphadenopathy, hepatosplenomegaly, and skin lesions (Vanittanakom et al., 2006; Cooper and Vanittanakom, 2008). The disseminated infection caused by T. marneffei is incurable and usually fatal if untreated (Wong and Wong, 2011).
T. marneffei is capable of alternating between a filamentous and a yeast growth form, a process known as dimorphic transition. T. marneffei grows as multicellular mycelium showing mold colonies with soluble brick-red pigment at 25°C and switches to a unicellular yeast growth form showing colonies that are glabrous and beige-colored at 37°C (Wong et al., 1999). Yeast cells are found in infected patients, suggesting that they are the pathogenic form (Boyce and Andrianopoulos, 2013). However, conidia are considered to be the infectious agent, because they cause infection when inhaled into the host's lungs (Boyce and Andrianopoulos, 2013). Thus, the morphogenetic transition is critical for both pathogenicity and transmission of T. marneffei (Boyce and Andrianopoulos, 2015). In the laboratory, the dimorphism between the mycelia and yeast growth forms has previously been induced upon alteration of the culture temperature (Bugeja et al., 2013). Thus, T. marneffei is also categorized as thermally dimorphic fungi, along with Histoplasma capsulatum, Blastomyces dermatitidis, Coccidioides immitis, Paracoccidioides brasiliensis, and Sporothrix schenckii (Boyce and Andrianopoulos, 2015).
The dimorphic transition of T. marneffei is a complex process controlled by a suite of genetic elements (Andrianopoulos, 2002; Boyce and Andrianopoulos, 2013). The mechanism regulating the dimorphic transition between yeast and mycelial growth forms is not clearly understood. Moreover, little is known about the specific transcription factors regulating dimorphic transition in T. marneffei. In our previous study, we showed that madsA was involved in the phase transition of T. marneffei (Yang et al., 2014). The madsA gene belongs to the MADS-box gene family. MADS-box derived from the abbreviation of the first letter of four founding members of this family, i.e., Mcm1, Agamous, Deficiens, and SRF (Schwarz-Sommer et al., 1990). Members of in this gene family contain a conserved sequence that encodes a DNA-binding domain typically containing 56–60 amino acids (Shore and Sharrocks, 1995). Some genes belonging to this family have been reported in fungi, such as FgMCM1, a key regulator of conidiation and virulence of Fusarium graminearum (Yang et al., 2015). The Aspergillus fumigatus rlmA gene is required for regulation of the cell wall integrity (Rocha et al., 2016). In our previous study mentioned above, we found that the expression level of madsA was significantly high both in yeast growth phase and during yeast-to-mycelium transition (Yang et al., 2014). In addition, overexpression of madsA was able to induce mycelial growth at 37°C, at which temperature the wild-type (WT) strain grew as yeast cells (Yang et al., 2014). However, the roles of madsA in dimorphic transition and the underlying mechanism remain to be clearly elucidated.
In this study, we constructed the deletion mutant and the complemented mutant of madsA in T. marneffei to determine its function in morphogenesis, dimorphic transition, and stress response. We found that the deletion mutant exhibited a faster transition from yeast (37°C) to mycelium (25°C) and had abnormal morphogenesis. The latter was characterized by diminished conidiation, slower conidial germination, and stronger tolerance of conidia to oxidative stress. We also compared the transcriptomic profiles between the madsA deletion mutant and the WT strain during different processes. The large dataset obtained from transcriptomic profile analysis provided rich information and revealed that the deletion of madsA affected genes involved in transmembrane transport, oxidation-reduction process, protein catabolic process and response to oxidative stress. Taken together, our data show that madsA function as a regulator of yeast-to-mycelium transition and is closely related to conidiation and germination in T. marneffei.
The T. marneffei strain PM1 was isolated from an HIV-negative patient suffering from culture-documented penicilliosis in Hong Kong (Woo et al., 2010). The genome of PM1 has been assembled by combining Sanger, Illumina, and PacBio sequencing technologies in our previous studies (Woo et al., 2011; Yang et al., 2014). Here, we used PM1 as a WT strain and a parental strain to construct mutant strains. All strains were maintained at 25°C on Sabouraud Dextrose Agar (SDA) (Becton, Dickinson and Company, USA), which was also used for preparing conidial inocula (see below). Sabouraud Dextrose Broth (SDB) (Becton, Dickinson and Company, USA) was employed for experiments involving liquid cultures of WT. For long-term storage, mycelia of a given strain were suspended in 30% (w/v) sterile glycerol and frozen at −80°C.
The madsA deletion mutant was constructed by the homologous recombination approach (Woo et al., 2006; Lau et al., 2013). Firstly, we used pAN7-1 plasmid as the vector for construction a recombinant plasmid harboring a hygromycin B phosphotransferase gene (hph) with madsA flanking sequences as adjacent sequences at each of its ends. The expression of the hph gene in pAN7-1 vector was controlled by Aspergillus nidulans gpd and trpC expression signals (Punt et al., 1987; Lau et al., 2013). The Integrated Genome Browser (IGB, http://bioviz.org/igb/) software was utilized to search the madsA open reading frame and its flanking sequences from the PM1 genome (AGCC00000000) for primer design (Woo et al., 2011; Yang et al., 2014). The madsA upstream (1,240 bp) and downstream (1,276 bp) flanking sequences were amplified from WT genomic DNA by polymerase chain reactions (PCRs) using the primer pairs of KO-F1/KO-R1 (each containing a BglII cleavage site) and KO-F2/KO-R2 (each containing a XbaI cleavage site) (see underlined sequences Table 1), respectively. The PCR was performed using PrimeSTAR Max DNA Polymerase (Takara, Japan) in accordance with the manufacturer's instruction. PCR protocol was composed of an initial cycle at 98°C for 10 s; 30 cycles at 98°C for 10 s, 58°C for 5 s, and 72°C for 10 s; 72°C for 5 min; and hold at 4°C. The pAN7-1 vector was linearized by BglII and XbaI digestion, respectively. Ligation of the linearized pAN7-1, madsA upstream and downstream flanking sequences was accomplished using ClonExpressTM II One Step Cloning Kit (Vazyme, China). The resulting plasmid, named pAN7-1-ΔmadsA (Figure 1A), contained the hph gene and the two homologous fragments to madsA flanking sequences, and was used for transformation of WT protoplasts to knock out madsA.
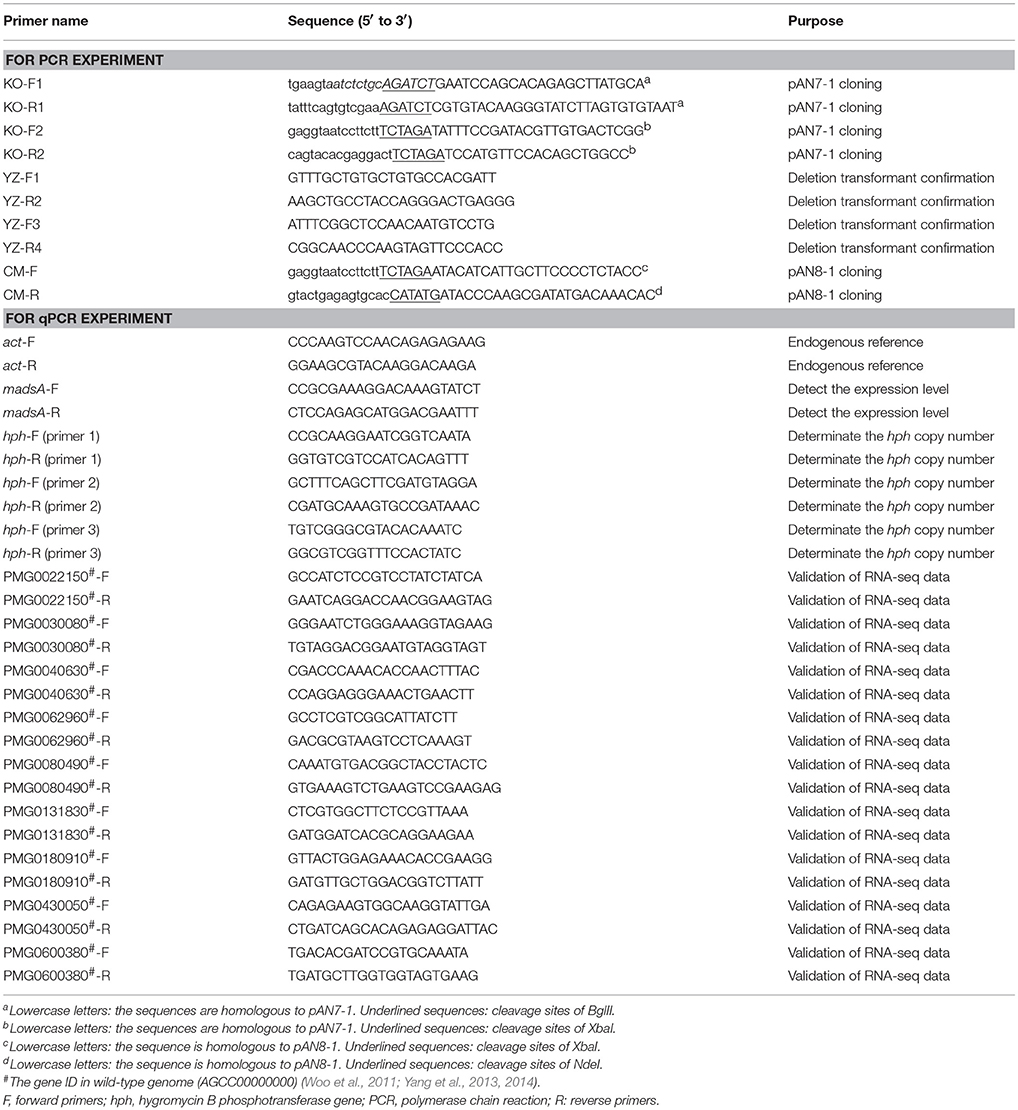
Table 1. List of primers used in this study.
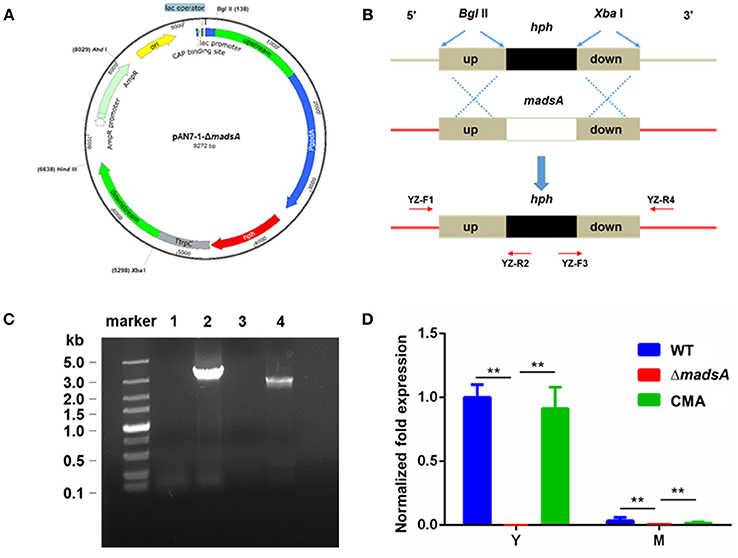
Figure 1. Deletion of madsA gene in T. marneffei by homologous recombination. (A) Structure of recombinant plasmid pAN7-1-ΔmadsA. (B) The process of homologous recombination. (C) Detection of the recombinant fragments in WT and ΔmadsA strains. Lane 1 and Lane 2: suspected PCR products from madsA upstream to hph in WT and ΔmadsA, respectively. Lane 3 and Lane 4: suspected PCR products from hph to madsA downstream in WT and ΔmadsA, respectively. (D) Expression levels of madsA in WT, ΔmadsA and CMA strains. **p < 0.0001. Error bar represents standard deviation (SD) from three biological replicates. CMA, complemented strain; hph, hygromycin B phosphotransferase; M, mycelium; PCR, polymerase chain reaction; WT, wild-type; Y, yeast.
The WT strain was transformed with the plasmid pAN7-1-ΔmadsA based on the protocol previously described (Borneman et al., 2001) with several modifications. Briefly, ~1 × 10⁷ PM1 conidia harvested from SDA were inoculated into 100 ml SDB and cultured for 18–20 h at 37°C and 150 rpm. The optimal time for protoplast preparation was when most of the germlings had short primary germ tubes. Highly branched germlings could be removed by filtration through Miracloth (Calbiochem, Germany). The culture was centrifuged and washed twice with 0.6 M MgSO4. The lysing enzyme mixture included lytic enzyme (Sigma, USA) and bovine serum albumin (9 dingchem, China) at final concentrations of 5 mg/ml and 1.2 mg/ml, respectively, in osmotic buffer (1.2 M MgSO4 and 10 mM sodium phosphate, pH 5.8). The 15 ml of lysing enzyme mixture with the germlings grown in 100 ml of SDB medium were incubated for 2 h at 28°C with gentle agitation. Protoplasts were harvested, washed and resuspended in STC buffer (1.2 M Sorbitol, 10 mM CaCl2 and 10 mM Tris-HCl pH 7.5) in a concentration of 1 × 10⁷−1 × 10⁸/ml. The 100 μl of protoplast suspension was incubated on ice with 5–8 μg (in 15 μl) of linearized pAN7-1-ΔmadsA for 50 min. Then 1.25 ml of PEG/CaCl2 solution (60% PEG 4000, 10 mM CaCl2 and 10 mM Tris-HCl pH 7.5) was added and incubated at room temperature for 30 min. Subsequently, the protoplasts were diluted with 5 ml of STC buffer and plated onto SDA supplemented with 200 μg/ml of hygromycin B and 0.6 M sorbitol. The plates were incubated at 37°C for 10 d. The hygromycin-resistant transformants were consecutively cultured on the SDA plates without and with hygromycin for 5 and 1 passages, respectively. The resulting stable-resistant colonies were selected, subjected to confirmation tests by PCR and sequencing with the primers YZ-F1/R2 and YZ-F3/R4 (Table 1, Figure 1B). To ensure a complete absence of madsA mRNA, quantitative reverse transcription PCR (RT-qPCR) was subsequently performed with triplicate in each of the three independent experiments. The hph copy number in the deletion mutant was verified by a qPCR (Stefano et al., 2016). Three pairs of primers (Table 1) were designed for hph gene to avoid the influence of amplification efficiency. The single copied β-actin (act) gene was used as an endogenous control (Kummasook et al., 2011; Yang et al., 2014). The confirmed madsA deletion strain was named as ΔmadsA.
For genetic complementation of the deletion mutant, plasmid pAN8-1 carrying bleomycin-resistant gene (ble) was used to construct the pCM-madsA vector (Jain et al., 1992; Lau et al., 2013). The CM-F and CM-R primers (Table 1) containing XbaI and NdeI site, respectively, were used to amplify the madsA gene consisting of the promotor and 3′ region from WT genomic DNA. The PCR product (982 bp) was inserted into pAN8-1. The plasmid pCM-madsA linearized with AhdI was transformed into the ΔmadsA mutant using protoplast transformation as described in the previous section. After transformation, the transformants were recovered in SDB containing 0.6 M sorbitol and incubated at 25°C, 150 rpm for 1–2 days (Nimmanee et al., 2015). Regenerated protoplasts were plated on SDA containing 100 μg/ml of bleomycin (Invitrogen, USA) and were cultured for 7–10 days. Strains were isolated from the colonies with bleomycin resistance through single spore separating. After the isolation, colonies similar to WT strain were selected and confirmed by PCR and sequencing. The expression of madsA in the complemented strains was further confirmed by RT-qPCR. One confirmed madsA-complemented strain was named as CMA and used for the study.
The WT, ΔmadsA mutant and madsA complemented CMA strains were subjected to phase transition treatments by temperature switching culture for 6 h according to our previous study (Yang et al., 2014). Each strain was initially cultured on the SDA plates at 37°C (or 25°C) for 7 d in order to get the stable yeasts (or mycelial organisms). For temperature switching experiments, yeasts grown at 37°C were transferred to 25°C for 6 h (yeast-to-mycelium, Y-to-M), and mycelia grown at 25°C were transferred to 37°C for 6 h (mycelium-to-yeast, M-to-Y). As the control group, the stable yeasts (or mycelial organisms) were subsequently cultured at the initial temperatures for 6 h as well. The cultures were grown in continuity at 37°C as yeasts (yeast, Y) or grown in continuity at 25°C as mycelia (mycelium, M). A simplified flow chart was shown in the Figure 2. Three independent experiments were performed.
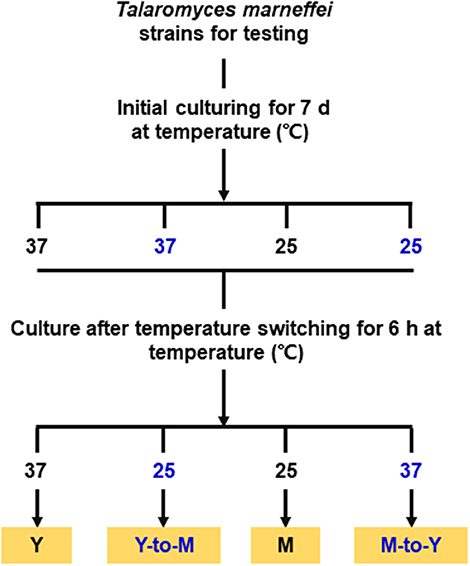
Figure 2. Flow chart for the phase transition treatments. M, mycelium; Y, yeast.
The conidial suspension of WT, ΔmadsA and CMA strains was prepared as follows. The surfaces of colonies cultured on SDA for 7 d at 25°C were scraped with a cotton swab to collect conidia (Suwunnakorn et al., 2015). The swabs were immersed in 10 mM phosphate buffered saline (PBS) to obtain conidial suspension, which then was filtered through sterile miracloth to remove mycelial fragments. Conidia of each strain were counted using a hemocytometer chamber and diluted to the same concentrations. For quantification of colony growth, 5 μl of 1 × 10⁴ conidia/ml of WT, ΔmadsA and CMA strains were dropped on SDA then incubated at either 25 or 37°C. The colony diameters were measured on 2–7 d of inoculation with three biological replicates (Suwunnakorn et al., 2014).
A modified germination assay was performed based upon a previously described method (Boyce and Andrianopoulos, 2007). Briefly, ~1 × 10⁶ conidia were inoculated into 4 ml of SDB then incubated at either 25 or 37°C. After 8 h, the numbers of germinating conidia were counted with 4-h interval in a population of 100 by using microscope (Revolve FL, Echo-Labs, USA) to measure the rate of germination. Three independent experiments were performed.
The assay for tolerance of the conidia to oxidative stress was performed based on the method previously described. (Woo et al., 2010). Conidial suspensions of WT, ΔmadsA and CMA strains were adjusted to 1 × 10⁶ conidia/ml in 10 mM PBS (pH 7.0) containing 25 mM hydrogen peroxide (H2O2). A 100 μl aliquot from each treatment was taken at 5-min interval, diluted to 100-fold (about 1 × 10⁴ conidia/ml) in 10 mM PBS. 100 μl of the suspension was plated onto SDA plates, then cultured at 37°C for 7 d. The visible colonies on the plates were counted. The relative survival of conidia capable of forming visible colonies was calculated. Three independent experiments were performed.
To test the chronic effects of H2O2 treatment on mycelia and yeast cell growth, 5 μl of conidial suspension (1 × 10⁵−1 × 10² conidia/ml) of WT, ΔmadsA and CMA strains was spotted on the surface of the SDA plate supplemented with 1.25, 2.5, 5, 10, or 20 mM H2O2, respectively. Then, the conidia were cultured on SDA plates for 7 d at 25°C or 37°C (Pongpom et al., 2013).
Under the similar experimental conditions, the susceptibility to osmotic stress was tested. Five microliters of conidial suspension (1 × 10⁵−1 × 10² conidia/ml) of each strains was spotted on the surface of the SDA plate supplemented with 0.125, 0.25, 0.5, 1, or 2 M sorbitol, respectively. Then, the conidia were cultured on SDA plates for 7 d at 25 or 37°C.
Total RNA was isolated under the four conditions described above in phase transition treatments, including Y, M, Y-to-M, and M-to-Y, respectively. The total RNAs were extracted from each condition for three independent biological replicates using the Fungal RNA Kit (Omega Bio-Tek, USA) and following the manufacturer's instructions for DNase I digestion to eliminate genomic DNA contamination.
For sequencing, the total RNA was extracted from WT and ΔmadsA strains cultured under four temperature treatment conditions, respectively. Three biological replicates were performed for each trial, from which the independent library was constructed for sequencing and analysis, respectively. In total, we made 24 cDNA libraries. The RNA integrity numbers (RIN) of all samples were analyzed using a 2100 Bioanalyzer (Agilent Technologies, USA). The cDNA library construction (Vazyme kit) and sequencing (Illumina kit) were performed by Mega Genomics (Beijing, China). The libraries were sequenced on an Illumina HiSeq 4000 platform using a strand-specific paired-end sequencing strategy.
The raw reads were assessed for quality by FASTQC v0.11.5 (http://www.bioinformatics.babraham.ac.uk/projects/fastqc/) and filtered to remove low-quality reads with Trimmomatic v0.36 (Bolger et al., 2014). Filtered reads were splice-aware aligned to the reference genome of T. marneffei (Yang et al., 2014) by using STAR v2.5.3a (Dobin et al., 2013). The gene expression levels were calculated by using FeatureCounts v1.5.2 (Liao et al., 2014) and then normalized based on the FPKM (fragments per kilobase of transcript per million fragments mapped) method (Trapnell et al., 2010). Differentially expressed genes were detected by DESeq2 (Love et al., 2014) in Bioconductor packages. Genes were considered to be differentially expressed between ΔmadsA strain and WT strain if the Benjamini–Hochberg adjusted p-value was below 0.05 and the fold change was above 2. Gene ontology (GO) term enrichment analysis on differentially expressed genes was performed with GOseq (Young et al., 2010; Yang et al., 2013), also available from Bioconductor packages using a background set annotated by running InterProScan v5.27-66.0 (Zdobnov and Apweiler, 2001). The enriched GO terms were summarized and visualized using REVIGO (Supek et al., 2011). Raw sequence data were deposited in the NCBI Sequence Read Archive database (SRA) under the accession number of SRP131610.
For each strain under all phase switching conditions, the cDNA was synthesized with random primer by reverse transcription of total RNA (1 μg) using Prime Script® RT reagent kit (TaKaRa, Japan). The cDNA (80 ng) samples were amplified in reaction mixtures containing SYBR Premix Ex Taq II (Takara, Japan) using an ABI Step One Real Time PCR System. The reaction was carried out with one cycle at 95°C for 15 s, 40 cycles at 95°C for 5 s and then 60°C for 30 s. A non-cDNA synthesis control was included to ensure that no DNA contamination existed. Primer sequences used for amplification of specific genes were shown in Table 1. The act gene was used as an endogenous control for gene expression analysis using the 2(−ΔΔCT) analysis method as suggested by a previous study (Livak and Schmittgen, 2001; Dankai et al., 2015). Triplicate in each test and three independent experiments were carried out.
Statistical analyses were performed using IBM SPSS Statistics 20.0 software program (IBM, USA). The Student's t-test or Chi-square test was used to analyze the appropriate data. A p < 0.05 was considered statistically significant.
The madsA gene consists of two exons and one intron. It encodes a protein of 109 amino acids. The protein sequence was deposited in the GenBank database with an accession number of KFX52038.1 (Yang et al., 2014). The structure of madsA gene is showed in Figure S1. To study the role of madsA in T. marneffei, we constructed the deletion mutant by replacing the coding sequence of madsA with hph cassette (Figure 1B). The putative transformants were verified by PCR amplification using internal and external primers specific to madsA and hph genes (Figure 1B). In ΔmadsA mutant, the hph gene was found to be integrated within the genome by homologous recombination (Figure 1C). The copy number of hph gene inserted in the mutant was identical to the act (Table S1). MadsA expression levels in ΔmadsA and CMA strains were compared against the WT strain by RT-qPCR, respectively. The madsA transcript was undetectable in ΔmadsA mutant, which was significantly different from those of the WT and CMA strains (Figure 1D). These results verified that the madsA gene deletion was successfully deleted and a single copy of hph gene was inserted into ΔmadsA mutant. Furthermore, the complemented strains that showed colonies similar to the WT were screened by PCR for the madsA and ble integration (data not shown). The expression level of madsA in CMA strain was close to WT strain under yeast and mycelial culture conditions (Figure 1D). The ΔmadsA and CMA strains were used in further studies.
To assess the roles of madsA in dimorphic morphogenesis of T. marneffei, we compared the morphologies among the ΔmadsA mutant, WT and CMA strains under four different culture conditions as illustrated in Figure 2. Except in the Y-to-M transition, we did not find any significant morphological differences among the three strains at the macroscopic or microscopic level. The morphologies of the complemented strain CMA were similar to the WT strain. Specifically, we found that all strains exhibited glabrous and beige-colored colonies without pigments (Figure 3A) at yeast growth. Microscopic examination of ΔmadsA cultures showed that the yeast-like cells were the same as those of other strains (data not shown). Similarly, regarding the stable mycelial culture condition, the ΔmadsA strain formed mycelium-like colony secreting diffusible red pigment (Figure 3A) that was similar to WT and CMA strains. The microscopic morphology of ΔmadsA strain was indistinguishable from the controls either (data not shown). However, during the Y-to-M transition, ΔmadsA mutant showed significant differences compared with the WT and CMA strains. After the temperature switch disposition, almost the entire colony of the ΔmadsA strain turned red, whereas the WT and CMA colonies only displayed marginal reddening (Figure 3A). The detailed morphology was further compared under microscopy. Mycelia was observed in ΔmadsA strain, indicating that the conversion from yeast to mycelial phase had occurred; cells of the WT and CMA strains maintained as yeasts under the same condition (Figure 3B). By contrast, in the reciprocal experiment from M-to-Y, ΔmadsA strain exhibited a phenotypic characteristic nearly identical to the other strains (Figure 3A). Three independent experiments were performed, and the phenotypic characteristics were reproducible. In general, the absence of madsA led to a faster Y-to-M transition, but had no detectable impact on phenotype during the M-to-Y transition.
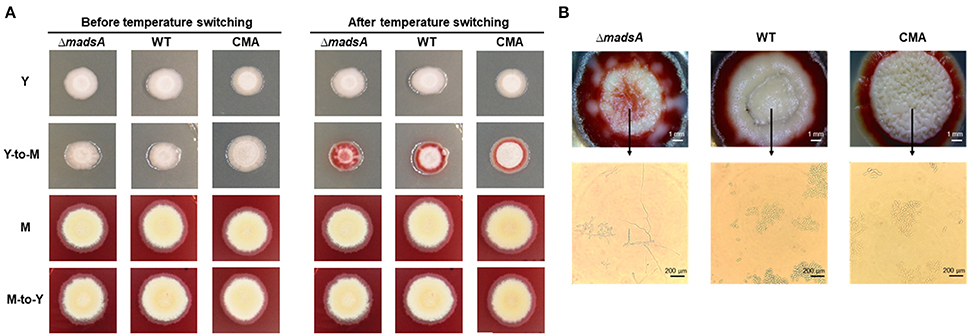
Figure 3. Morphological phenotypes of the ΔmadsA, WT and CMA strains in phase transition treatments. (A) The colonial morphologies of the three strains in four conditions. (B) The colonial and microscopic morphologies of the three strains in Y-to-M transition treatment. CMA, complemented strain; M, mycelium; WT, wild-type; Y, yeast.
To investigate the role of madsA gene in growth, we compared the colony diameters of ΔmadsA, WT and CMA strains cultured at 37 and 25°C for 2–7 d, respectively. At 37°C, there was a reduction in colony diameter of the ΔmadsA mutant in comparison with the WT and CMA strains at different incubation time points (Figure 4A).
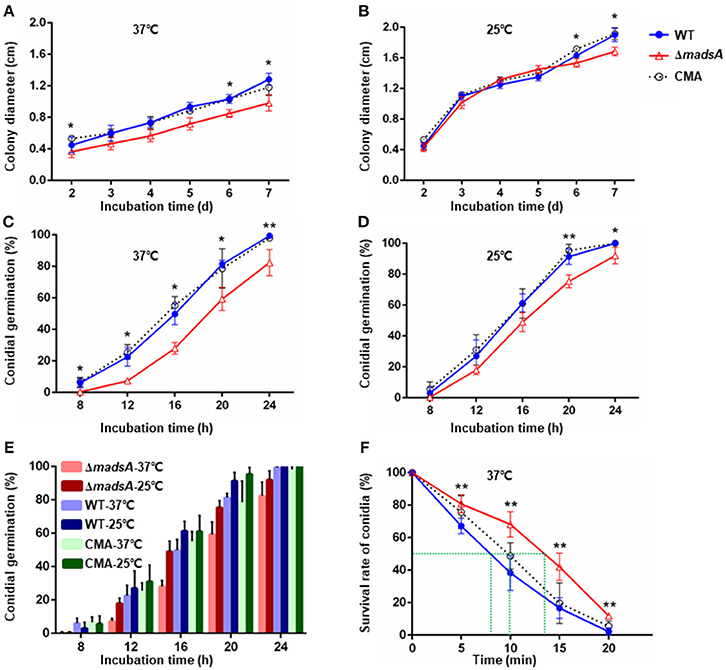
Figure 4. Characteristic of ΔmadsA, WT and CMA strains in growth, conidial germination and conidial susceptibility to H2O2. (A,B) Radial growth (colony diameter) at 37 and 25°C. (C,D) Conidial germination at 37 and 25°C. (E) Comparison of the germination rates among three strains at different culture temperatures. (F) Survival rates of conidia after H2O2 treatment for different times. *p < 0.05. **p < 0.0001. Error bar represents SD from three biological replicates. CMA, complemented strain; M, mycelium; SD, standard deviation; WT, wild-type; Y, yeast.
At 25°C, the colonies of ΔmadsA mutant had a similar diameter to other strains (Figure 4B). Although the diameters of WT and ΔmadsA strains were statistically different at the endpoint of incubation period, the growth curves showed similar kinetics. It is worth noting that the ΔmadsA mutant showed relatively smooth colony morphology whereas the WT and CMA strains showed rough colony morphology after 4 d inoculation at 25°C. In addition, the colonies of ΔmadsA mutant were gray with loss of the yellow color on the colony surface (Figure 5). A reduction in conidial production of ΔmadsA mutant was found by microscopic observation (Figure 5). Despite the initial reduction in conidia, after 7 d all strains were producing conidia. The ΔmadsA strain was not substantially different from the strains containing the madsA gene in colony morphology during subsequent culture at 25°C (Figure 3A).
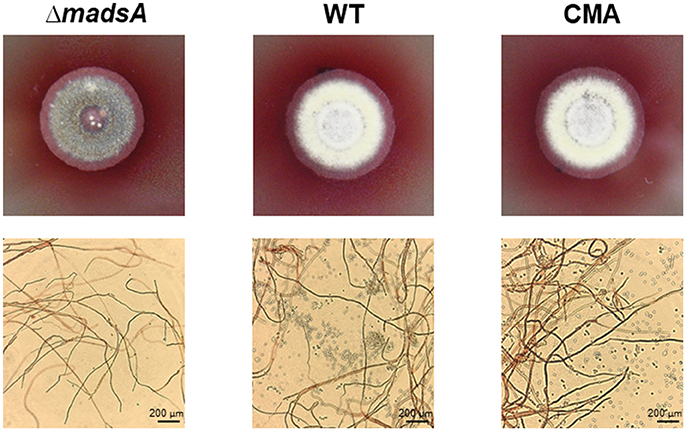
Figure 5. Phenotype of ΔmadsA, WT and CMA strains after 4 d growth at 25°C. The ΔmadsA strain showed a relatively smooth colony with reduced conidial production, whereas WT and CMA showed visibly rough colonies with abundant conidia. CMA, complemented strain; M, mycelium; WT, wild-type; Y, yeast.
To determine whether the madsA affected conidial germination, the rates of germination were assessed. The germination rates of WT and CMA strains were not significantly different (p > 0.05). However, the ΔmadsA strain showed delays in germination at both 37°C (Figure 4C) and 25°C (Figure 4D). In particular, significant differences (p < 0.05) were found at all sampling time points at 37°C. When comparing the germination rates between the WT and ΔmadsA strains at different culture temperatures (Figure 4E), we found that, on average, the ΔmadsA took about 4 h longer than WT to achieve the same germination rates at 37°C. As mentioned above, the colonies of ΔmadsA mutant were slightly smaller than that of WT. This might be due to the delay in germination of ΔmadsA mutant. To test the hypothesis, the synchronizing cultures were applied at 37°C. The conidia of ΔmadsA strain had a 4 h incubation in SDB prior to cultured on SDA plates. As a result, the colony diameter of ΔmadsA strain was similar to that of WT (Figure S2).
The survival rates of conidia at different incubation times in H2O2 were plotted (Figure 4F). The treatment time resulting in a 50% reduction in conidial survival were about 8 min for WT, 10 min for CMA strain and about 13.5 min for the ΔmadsA mutant, respectively. Thus, the ΔmadsA conidia displayed a stronger resistance to H2O2 than the WT strain. The chronic treatment of H2O2 revealed that neither ΔmadsA nor WT strains could grow at H2O2 concentration ≥2.5 mM regardless of the culture temperature. The colony morphology of ΔmadsA and WT strains had no obvious difference in the presence of 2 mM H2O2 (data not shown).
To determine the function of madsA in response to osmotic stress, the strains were grown on media supplemented with gradient concentration of sorbitol at 25 or 37°C, respectively. The colony morphology and pigmentation of ΔmadsA mutant grown under osmotic stress was similar to the WT (Figure S3). The microscopic visualization showed no significant difference either. The CMA strain exhibited a phenotype identical to the WT (data not shown). Thus, the susceptibility of the ΔmadsA mutant to osmotic stress was almost the same to that of WT.
To gain an insight into to the molecular processes regulated by madsA underlying the observed phenotypic characteristics, RNA sequencing (RNA-seq) was performed on total RNA extracted from the WT and ΔmadsA strains under the four experimental conditions as mentioned in the Figure 2. Table S2 showed the quantity and quality of total RNA for each sample. The RIN values for most samples were over 8.0 (22/24). The mean RIN value of the three replicates under each treatment condition was larger than 8.0, respectively, suggesting the RNA had good quality for transcriptome analysis.
For each sample, we obtained 11.06–18.20 million pairs of raw reads. After removing the low quality reads and adapter sequences, between 9.66 and 15.05 million pairs of clean reads were left for each sample (Table S3). Quality control parameters indicated that the resulting gene transcript data were reliable. In addition, there was good correlation of gene expression patterns and levels between biologically repeated samples, and the heat cluster map indicated high repeatability of the sequencing (Figure 6).
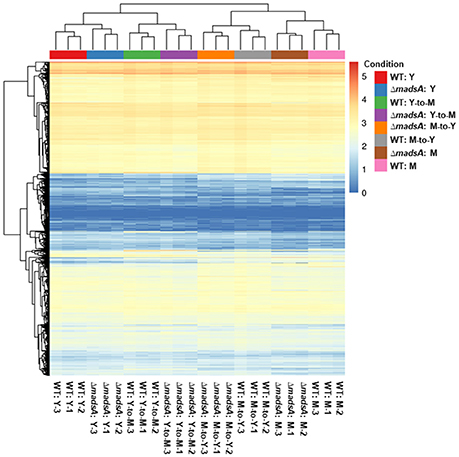
Figure 6. The gene expression levels of ΔmadsA and WT strains under four conditions. The correlation of gene expression patterns and levels between biologically repeated samples was consistent. The 0 (minimum) to 5 (maximum) bar represents relative abundance of gene expression. M, mycelium; WT, wild-type; Y, yeast.
Prior to identifying the differentially expressed genes (DEGs) between ΔmadsA and WT, gene expression levels in different samples were calculated using FPKM (Trapnell et al., 2010). The number of genes expressed in each sample was more than 8,200, which represented most of the genes predicted from the sequence analysis of the T. marneffei genome (Yang et al., 2014). Expression levels of these genes under different treatments were compared using the DESeq2 (Love et al., 2014).
We identified a total of 869 genes that were differentially expressed between WT and ΔmadsA strains. Compared with the WT strain, 198 genes of ΔmadsA were upregulated and 114 were downregulated in yeast growth. Likewise, in Y-to-M growth, 231 genes were upregulated and 38 were downregulated. However, many fewer DEGs were identified in M-to-Y transition, of which 29 genes were upregulated and 97 were downregulated. As for mycelial growth, 187 genes of ΔmadsA were upregulated and 245 were downregulated. A Venn diagram (Figure 7) shows both unique and common DEGs in different comparisons at Y, Y-to-M, M, and M-to-Y.
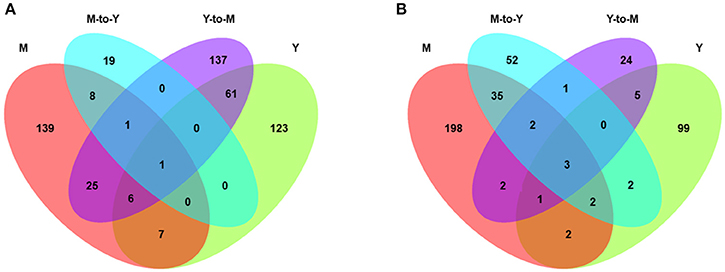
Figure 7. Transcriptome profiles of differentially expressed genes (DEGs) of ΔmadsA in comparison with WT under four conditions. (A) The unique and common upregulated DEGs under four conditions. (B) The unique and common downregulated DEGs under four conditions. M, mycelium; Y, yeast.
To analyze the function of DEGs showing up or down regulation in response to madsA knocked out, we performed GO enrichment analysis. Individual GO terms were considered to be enriched if their corrected p-value was < 0.05, Tables S4–S7 contains a list of the enriched GO terms under Y, Y-to-M, M, and M-to-Y, respectively.
DEGs were successfully enriched and classified into three main categories: biological process, cellular component and molecular function. Compared with WT, cellular process, cell, cell part, binding, catalytic activity, and metabolic process were the most enriched GO terms in ΔmadsA mutant. We identified 11, 6, 18, and 7 represented GO terms at Y, Y-to-M, M, and M-to-Y, respectively (Figure 8; Tables S4–S7). In yeast phase, GO terms of genes upregulated or downregulated included “integral component of membrane (GO:0016021),” “transmembrane transport (GO:0055085),” “cation transport (GO:0006812),” and “peroxidase activity (GO:0004601)” (Figure 8A). During Y-to-M transition, GO terms significantly enriched were those such as “oxidation-reduction process (GO:0055114)” and “integral component of membrane (GO:0016021)” (Figure 8B). For the mycelial phase, the represented GO terms included “response to oxidative stress (GO:0006979),” “metabolic process (GO:0008152)” and “response to UV (GO:0009411)” (Figure 8C). With regard to M-to-Y transition, “integral component of membrane (GO:0016021),” “oxidation-reduction process (GO:0055114)” and “transmembrane transport (GO:0055085)” were significantly enriched among the DEGs (Figure 8D). Of note, both in yeast and mycelial growth, the categories of upregulated genes included “transmembrane transport (GO:0055085)”. At all experimental conditions, the top five significantly enriched GO terms of genes upregulated or downregulated in ΔmadsA mutant are shown in Table 2. Taken together, these data suggest that madsA is closely related to transmembrane transport, oxidation-reduction process, catabolic process and response to oxidative stress.
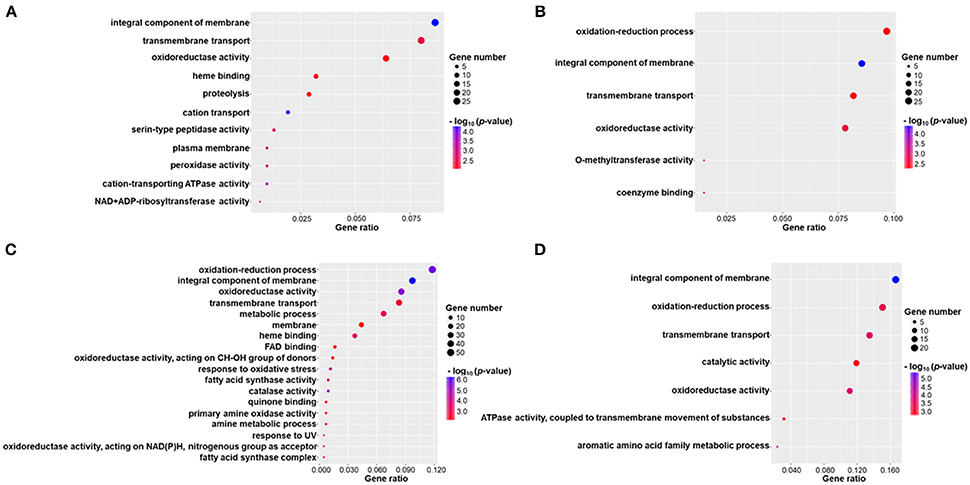
Figure 8. Gene ontology (GO) enrichment of differentially expressed genes (DEGs) in ΔmadsA under four conditions. (A–D) Y, Y-to-M, M and M-to-Y conditions. The x-axis shows the gene ratio (the ratio of the gene count in GO terms to the total DEGs count) and the y-axis displays names of the enriched GO terms. M, mycelium; Y, yeast.
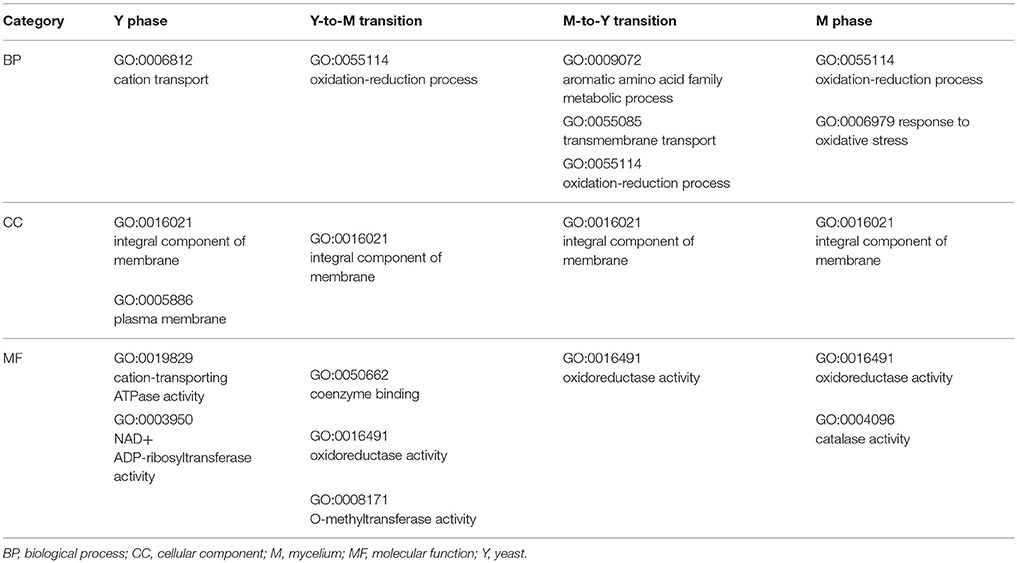
Table 2. Top 5 significantly enriched GO terms in ΔmadsA genes upregulated or downregulated.
The results obtained from the RNA-seq were validated by RT-qPCR with the same RNA samples. Several differently expressed genes including two genes (PMG0131830 and PMG0080490) related to oxidative tolerance were tested. Generally, the results of RT-qPCR were consistent with those of the RNA-seq (Table 3). For all the tested genes at different conditions, the trends of change were consistent in the two assays. The results suggest the reliability of the RNA-seq data. The expressions of two genes related to oxidative tolerance were found to be upregulated in both assays.
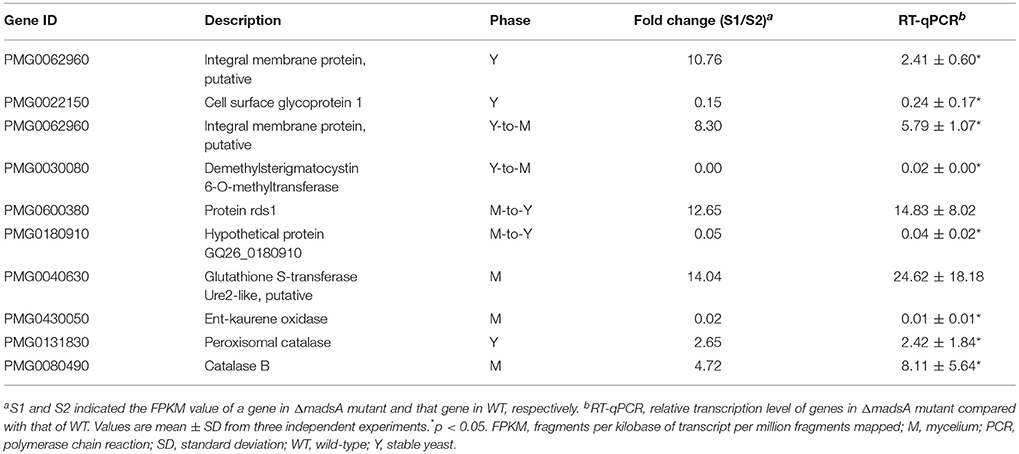
Table 3. Validation of the transcription levels of selected genes by RT-qPCR.
The MADS-box genes encode a eukaryotic family of transcriptional regulators involved in a number of important biological functions (Messenguy and Dubois, 2003). Previous studies revealed that the yeasts overexpressing madsA showed filamentous-like growth in T. marneffei at 37°C (Yang et al., 2014). This suggests that the madsA is involved in dimorphic transition. To better understand the roles of madsA in T. marneffei, its deletion mutant ΔmadsA was obtained by homologous recombination in this study. Then the phenotypes and transcriptomes of ΔmadsA and WT strains were compared at different growth conditions.
T. marneffei exhibits two distinct mycelium-yeast morphogenetic transitions and secretes the diffusible red pigment only at the mycelical phase, which could be used as a hallmark to indicate the transitions. For Y-to-M transition, madsA might play a regulatory role in this process. Deletion of madsA resulted in earlier occurrence of mycelium and red pigment, suggesting a short period to achieve the Y-to-M transition than those of WT and complemented strains. It is known that the pigments are composed of several compounds, in which some virulence factors have been identified in certain types of fungi (Noverr et al., 2004; da Silva et al., 2006; Silva et al., 2009). Thus, it would be interesting to study whether the madsA gene is involved in the virulence of T. marneffei in the future. In addition, the comparative transcriptomic analysis was conducted between the WT and ΔmadsA strains. Based on the GO functional enrichment analysis, we found that the significant DEGs were mainly involved in transmembrane transport within the biological process group. It has been known that the iron and calcium transports were required for dimorphic switching (Campos et al., 2008; Hilty et al., 2011). The madsA may work by regulating genes related to iron or calcium transport. In another process, during M-to-Y transition, the phenotype of ΔmadsA strain was identical to WT. As such, the madsA gene plays a key role in the transition of Y-to-M rather than M-to-Y. This is also supported by our observation that the expression level of madsA in WT is significantly higher in Y-to-M transition than that in M-to-Y transition.
In mycelial growth, we observed that the ΔmadsA mutant produced much less conidia than WT at the initial stage. Another MADS-box transcription factor VdMcm1 has been reported as a key regulator of conidiation of Verticillium dahliae (Xiong et al., 2016). The similar phenotypes were reported for two other genetic regulators of conidial development in T. marneffei, i.e., yakA and rttA (Suwunnakorn et al., 2014, 2015). The absence of madsA in T. marneffei also induces a delay in conidial germination in mycelial phase. Despite the low expression level of madsA in mycelial phase of WT, the absence of madsA caused numerous genes to be upregulated or downregulated. These suggest that madsA at low expression level in mycelium may still play important roles. The differences between ΔmadsA and WT strains such as conidial production and germination in mycelium indirectly validated this conjecture.
In yeast phase, cells have to adapt to the reactive oxygen species (ROS) in the macrophage lysosome environment during host colonization. In A. fumigatus, the rlmA gene, a member of MADS-box transcription factors was reported to be involved in tolerance to oxidative damage and transcriptional regulation of genes related to oxidative stress adaptation (Rocha et al., 2016). In this study, we examined the response of the strains to H2O2, a ROS generated by macrophages. The deletion of madsA led to enhanced conidial tolerance to 25 mM H2O2 (Figure 4F). However, the chronic treatment of H2O2 at a concentration higher than 2.5 mM could inhibit the yeast and mycelial growth for both ΔmadsA and WT. In addition, the GO term “response to oxidative stress (GO:0006979)” was found to be enriched among upregulated genes in ΔmadsA mutant. Both RNA-seq and RT-qPCR data showed that two genes related to catalase (PMG0131830 and PMG0080490) were upregulated in both the yeast phase and the mycelial phase in the absence of H2O2 (p < 0.05, Table 3). However, in the presence of 2 mM H2O2, the expression level of PMG0131830 in yeast phase had no statistical difference between ΔmadsA and WT strains; while the expression of PMG0080490 in the mycelial phase was downregulated in ΔmadsA with 0.04-fold (p < 0.05). Our results indicated that the phenotypic and transcriptional patterns in response to oxidative stress seemed to be complicated. The methodological difference and other potential genes might affect the results and data interpretation. It is worth mentioning that the delay in germination might be a factor in the conidial tolerance to H2O2. Further investigations are needed to reveal the function of madsA in response to oxidative stress in T. marneffei.
In this study, it was important to choose a suitable housekeeping gene for transcriptional study. For S. schenckii and P. brasiliensis, it has been reported that the act gene had a differential expression during the dimorphic transition (Han-Yaku et al., 1996; Niño-Vega et al., 2007). However, a study compared the expression levels of the most commonly used housekeeping genes including act, gapdh and 18S rRNA gene across different cell types or under different conditions in T. marneffei, and validated that the act gene was the most suitable one for use as an endogenous control under morphological changes by RT-qPCR (Dankai et al., 2015). In addition, our results also showed that the threshold cycle (Ct) values for the act gene in WT strain at four conditions (Y, M, Y-to-M and M-to-Y) were in the range of 20.12–20.76, while they were 20.42–20.82 for the ΔmadsA mutant. There was no significant difference within strains under different conditions and between strains at the same condition (p > 0.05). Our results suggested that the act gene expression was stable in both WT and ΔmadsA strains. Thus, the transcriptional analysis based on this should be reliable.
In a previous study we found that overexpression of madsA was able to induce mycelial growth at 37°C, at which temperature the WT strain grew as yeast cells (Yang et al., 2014). However, the results in this study showed that the ΔmadsA mutant displayed a faster transition from yeast (37°C) to mycelium (25°C). The results from the two studies seemed to be contradictory. One reason might be that the overexpression strain was observed during continuous culture at 37°C in the previous study, while the typical phenotype of ΔmadsA was observed at a temperature switching condition (from 37 to 25°C) in this study. As shown in Figures 6, 7, the DEGs profiles for Y and Y-to-M were different, suggesting that the roles of madsA should be temperature sensitive. In addition, genes other rather than madsA or in coupling with madsA might also contribute to transcriptional regulation of T. marneffei morphogenesis. It is also possible that a gene silencing process might be triggered by the overexpression of madsA. Further investigations on the MADS-box gene family and other potential genes are needed.
In summary, we have characterized ΔmadsA and CMA strains of T. marneffei to reveal the potential role of madsA gene in morphogenesis, dimorphic transition and stress response. To sum up, madsA may be one of the key factors in the dimorphic transition. Moreover, our results provide evidence that madsA plays pleiotropic and global roles through regulating hundreds of genes. The DEGs affected by madsA will be further investigated. Its roles in the survival, pathogenicity and transmission of T. marneffei also call for more investigation. The data presented in this study would facilitate the understanding of transcription factor madsA in T. marneffei.
EY, HZ, and TL conceived and designed the research, contributed reagents, materials, and supervised work. QW, SW, and LX carried out experiments. QW wrote the first draft of the manuscript. MD performed bioinformatics analysis and wrote sections of the manuscript. LL helped with assay set-up. LW gave critical review on the manuscript.
The authors declare that the research was conducted in the absence of any commercial or financial relationships that could be construed as a potential conflict of interest.
The reviewer GANV and handling editor declared their shared affiliation at time of review.
This work was supported by the One Hundred Talents Program of Peking University Health Science Center (BMU20150510). We thank Wei Ji and Yiwei Xiao for the assistance with the experiments of deletion construction. We are grateful to Dr. Hongshuo Song and Dr. Bethany Dearlove from U.S. Military HIV Research Program (MHRP), Walter Reed Army Institute of Research (WRAIR) for language polishment.
The Supplementary Material for this article can be found online at: https://www.frontiersin.org/articles/10.3389/fmicb.2018.01781/full#supplementary-material
act, β-actin gene; ble, bleomycin-resistant gene; CMA, complemented strain; Ct, threshold cycle; DEGs, differentially expressed genes; FPKM, fragments per kilobase of transcript per million fragments mapped; GO, gene ontology; H2O2, hydrogen peroxide; HIV, human immunodeficiency virus; hph, hygromycin B phosphotransferase gene; M, mycelium; PBS, phosphate buffered saline; PCR, polymerase chain reaction; RIN, RNA integrity numbers; ROS, reactive oxygen species; SD, standard deviation; SDA, sabouraud dextrose agar; SDB, sabouraud dextrose broth; SRA, sequence read archive database; WT, wild-type; Y, yeast.
Andrianopoulos, A. (2002). Control of morphogenesis in the human fungal pathogen Penicillium marneffei. Int. J. Med. Microbiol. 292, 331–347. doi: 10.1078/1438-4221-00217
Bolger, A. M., Lohse, M., and Usadel, B. (2014). Trimmomatic: a flexible trimmer for Illumina sequence data. Bioinformatics 30, 2114–2120. doi: 10.1093/bioinformatics/btu170
Borneman, A. R., Hynes, M. J., and Andrianopoulos, A. (2001). An STE12 homolog from the asexual, dimorphic fungus Penicillium marneffei complements the defect in sexual development of an Aspergillus nidulans steA mutant. Genetics 157, 1003–1014.
Boyce, K. J., and Andrianopoulos, A. (2007). A p21-activated kinase is required for conidial germination in Penicillium marneffei. PLoS Pathog. 3:e162. doi: 10.1371/journal.ppat.0030162
Boyce, K. J., and Andrianopoulos, A. (2013). Morphogenetic circuitry regulating growth and development in the dimorphic pathogen Penicillium marneffei. Eukaryot. Cell 12, 154–160. doi: 10.1128/EC.00234-12
Boyce, K. J., and Andrianopoulos, A. (2015). Fungal dimorphism: the switch from hyphae to yeast is a specialized morphogenetic adaptation allowing colonization of a host. FEMS Microbiol. Rev. 39, 797–811. doi: 10.1093/femsre/fuv035
Bugeja, H. E., Hynes, M. J., and Andrianopoulos, A. (2013). HgrA is necessary and sufficient to drive hyphal growth in the dimorphic pathogen Penicillium marneffei. Mol. Microbiol. 88, 998–1014. doi: 10.1111/mmi.12239
Campos, C. B., Di Benedette, J. P., Morais, F. V., Ovalle, R., and Nobrega, M. P. (2008). Evidence for the role of calcineurin in morphogenesis and calcium homeostasis during mycelium-to-yeast dimorphism of Paracoccidioides brasiliensis. Eukaryot. Cell 7, 1856–1864. doi: 10.1128/EC.00110-08
Chan, J. F., Lau, S. K., Yuen, K. Y., and Woo, P. C. (2016). Talaromyces (Penicillium) marneffei infection in non-HIV-infected patients. Emerg. Microbes Infect. 5:e19. doi: 10.1038/emi.2016.18
Cooper, C. R., and Vanittanakom, N. (2008). Insights into the pathogenicity of Penicillium marneffei. Future Microbiol. 3, 43–55. doi: 10.2217/17460913.3.1.43
da Silva, M. B., Marques, A. F., Nosanchuk, J. D., Casadevall, A., Travassos, L. R., and Taborda, C. P. (2006). Melanin in the dimorphic fungal pathogen Paracoccidioides brasiliensis: effects on phagocytosis, intracellular resistance and drug susceptibility. Microbes Infect. 8, 197–205. doi: 10.1016/j.micinf.2005.06.018
Dankai, W., Pongpom, M., and Vanittanakom, N. (2015). Validation of reference genes for real-time quantitative RT-PCR studies in Talaromyces marneffei. J. Microbiol. Methods 118, 42–50. doi: 10.1016/j.mimet.2015.08.015
Dobin, A., Davis, C. A., Schlesinger, F., Drenkow, J., Zaleski, C., Jha, S., et al. (2013). STAR: ultrafast universal RNA-seq aligner. Bioinformatics 29, 15–21. doi: 10.1093/bioinformatics/bts635
Han-Yaku, H., Naka, W., Tajima, S., Harada, T., and Nishikawa, T. (1996). Differential expression of the 45 kDa protein (actin) during the dimorphic transition of Sporothrix schenckii. J. Med. Vet. Mycol. 34, 175–180. doi: 10.1080/02681219680000291
Hilty, J., George Smulian, A., and Newman, S. L. (2011). Histoplasma capsulatum utilizes siderophores for intracellular iron acquisition in macrophages. Med. Mycol. 49, 633–642. doi: 10.3109/13693786.2011.558930
Hu, Y., Zhang, J., Li, X., Yang, Y., Zhang, Y., Ma, J., et al. (2013). Penicillium marneffei infection: an emerging disease in mainland China. Mycopathologia 175, 57–67. doi: 10.1007/s11046-012-9577-0
Jain, S., Durand, H., and Tiraby, G. (1992). Development of a transformation system for the thermophilic fungus Talaromyces sp. CL240 based on the use of phleomycin resistance as a dominant selectable marker. Mol. Gen. Genet. 234, 489–493. doi: 10.1007/BF00538710
Kummasook, A., Tzarphmaag, A., Thirach, S., Pongpom, M., Cooper, C. J., and Vanittanakom, N. (2011). Penicillium marneffei actin expression during phase transition, oxidative stress, and macrophage infection. Mol. Biol. Rep. 38, 2813–2819. doi: 10.1007/s11033-010-0427-1
Lau, S. K., Chow, W. N., Wong, A. Y., Yeung, J. M., Bao, J., Zhang, N., et al. (2013). Identification of microRNA-like RNAs in mycelial and yeast phases of the thermal dimorphic fungus Penicillium marneffei. PLoS Negl. Trop. Dis. 7:e2398. doi: 10.1371/journal.pntd.0002398
Liao, Y., Smyth, G. K., and Shi, W. (2014). FeatureCounts: an efficient general purpose program for assigning sequence reads to genomic features. Bioinformatics 30, 923–930. doi: 10.1093/bioinformatics/btt656
Livak, K. J., and Schmittgen, T. D. (2001). Analysis of relative gene expression data using real-time quantitative PCR and the 2−ΔΔCT Method. Methods 25, 402–408. doi: 10.1006/meth.2001.1262
Love, M. I., Huber, W., and Anders, S. (2014). Moderated estimation of fold change and dispersion for RNA-seq data with DESeq2. Genome Biol. 15:550. doi: 10.1186/s13059-014-0550-8
Messenguy, F., and Dubois, E. (2003). Role of MADS box proteins and their cofactors in combinatorial control of gene expression and cell development. Gene 316, 1–21. doi: 10.1016/S0378-1119(03)00747-9
Nimmanee, P., Woo, P. C., Kummasook, A., and Vanittanakom, N. (2015). Characterization of sakA gene from pathogenic dimorphic fungus Penicillium marneffei. Int. J. Med. Microbiol. 305, 65–74. doi: 10.1016/j.ijmm.2014.11.003
Niño-Vega, G., Pérez-Silva, C., and San-Blas, G. (2007). The actin gene in Paracoccidioides brasiliensis: organization, expression and phylogenetic analyses. Mycol. Res. 111, 363–369. doi: 10.1016/j.mycres.2006.12.004
Noverr, M. C., Williamson, P. R., Fajardo, R. S., and Huffnagle, G. B. (2004). CNLAC1 is required for extrapulmonary dissemination of Cryptococcus neoformans but not pulmonary persistence. Infect. Immun. 72, 1693–1699. doi: 10.1128/IAI.72.3.1693-1699.2004
Pongpom, M., Sawatdeechaikul, P., Kummasook, A., Khanthawong, S., and Vanittanakom, N. (2013). Antioxidative and immunogenic properties of catalase-peroxidase protein in Penicillium marneffei. Med. Mycol. 51, 835–842. doi: 10.3109/13693786.2013.807445
Punt, P. J., Oliver, R. P., Dingemanse, M. A., Pouwels, P. H., and van den Hondel, C. A. (1987). Transformation of Aspergillus based on the hygromycin B resistance marker from Escherichia coli. Gene 56, 117–124. doi: 10.1016/0378-1119(87)90164-8
Rocha, M. C., Fabri, J. H., Franco, D. G. K., Alves, D. C. P., Hori, J. I., Ferreira, D. C. A., et al. (2016). Aspergillus fumigatus MADS-Box transcription factor rlmA is required for regulation of the cell wall integrity and virulence. G3 6, 2983–3002. doi: 10.1534/g3.116.031112
Schwarz-Sommer, Z., Huijser, P., Nacken, W., Saedler, H., and Sommer, H. (1990). Genetic control of flower development by homeotic genes in Antirrhinum majus. Science 250, 931–936. doi: 10.1126/science.250.4983.931
Shore, P., and Sharrocks, A. D. (1995). The MADS-box family of transcription factors. Eur. J. Biochem. 229, 1–13. doi: 10.1111/j.1432-1033.1995.tb20430.x
Silva, M. B., Thomaz, L., Marques, A. F., Svidzinski, A. E., Nosanchuk, J. D., Casadevall, A., et al. (2009). Resistance of melanized yeast cells of Paracoccidioides brasiliensis to antimicrobial oxidants and inhibition of phagocytosis using carbohydrates and monoclonal antibody to CD18. Mem. Inst. Oswaldo Cruz. 104, 644–648. doi: 10.1590/S0074-02762009000400019
Stefano, B., Patrizia, B., Matteo, C., and Massimo, G. (2016). Inverse PCR and quantitative PCR as alternative methods to southern blotting analysis to assess transgene copy number and characterize the integration site in transgenic woody plants. Biochem. Genet. 54, 291–305. doi: 10.1007/s10528-016-9719-z
Supek, F., Bošnjak, M., Skunca, N., and Smuc, T. (2011). REVIGO summarizes and visualizes long lists of gene ontology terms. PLoS ONE 6:e21800. doi: 10.1371/journal.pone.0021800
Supparatpinyo, K., Khamwan, C., Baosoung, V., Nelson, K. E., and Sirisanthana, T. (1994). Disseminated Penicillium marneffei infection in southeast Asia. Lancet 344, 110–113. doi: 10.1016/S0140-6736(94)91287-4
Suwunnakorn, S., Cooper, C. J., Kummasook, A., Pongpom, M., Vanittanakom, P., and Vanittanakom, N. (2015). Role of the rttA gene in morphogenesis, stress response, and virulence in the human pathogenic fungus Penicillium marneffei. Med. Mycol. 53, 119–131. doi: 10.1093/mmy/myu063
Suwunnakorn, S., Cooper, C. J., Kummasook, A., and Vanittanakom, N. (2014). Role of the yakA gene in morphogenesis and stress response in Penicillium marneffei. Microbiology 160, 1929–1939. doi: 10.1099/mic.0.080689-0
Trapnell, C., Williams, B. A., Pertea, G., Mortazavi, A., Kwan, G., van Baren, M. J., et al. (2010). Transcript assembly and quantification by RNA-Seq reveals unannotated transcripts and isoform switching during cell differentiation. Nat. Biotechnol. 28, 511–515. doi: 10.1038/nbt.1621
Vanittanakom, N., Cooper, C. J., Fisher, M. C., and Sirisanthana, T. (2006). Penicillium marneffei infection and recent advances in the epidemiology and molecular biology aspects. Clin. Microbiol. Rev. 19, 95–110. doi: 10.1128/CMR.19.1.95-110.2006
Wong, S. S., Siau, H., and Yuen, K. Y. (1999). Penicilliosis marneffei–West meets East. J. Med. Microbiol. 48, 973–975. doi: 10.1099/00222615-48-11-973
Wong, S. Y., and Wong, K. F. (2011). Penicillium marneffei infection in AIDS. Patholog. Res. Int. 2011:764293. doi: 10.4061/2011/764293
Woo, P. C., Chong, K. T., Lau, C. C., Wong, S. S., Lau, S. K., and Yuen, K. Y. (2006). A novel approach for screening immunogenic proteins in Penicillium marneffei using the ΔAFMP1 ΔAFMP2 deletion mutant of Aspergillus fumigatus. FEMS Microbiol. Lett. 262, 138–147. doi: 10.1111/j.1574-6968.2006.00376.x
Woo, P. C., Lau, S. K., Liu, B., Cai, J. J., Chong, K. T., Tse, H., et al. (2011). Draft genome sequence of Penicillium marneffei strain PM1. Eukaryot. Cell 10, 1740–1741. doi: 10.1128/EC.05255-11
Woo, P. C., Tam, E. W., Chong, K. T., Cai, J. J., Tung, E. T., Ngan, A. H., et al. (2010). High diversity of polyketide synthase genes and the melanin biosynthesis gene cluster in Penicillium marneffei. FEBS J. 277, 3750–3758. doi: 10.1111/j.1742-4658.2010.07776.x
Xiong, D., Wang, Y., Tian, L., and Tian, C. (2016). MADS-Box transcription factor VdMcm1 regulates conidiation, microsclerotia formation, pathogenicity, and secondary metabolism of Verticillium dahliae. Front. Microbiol. 7:1192. doi: 10.3389/fmicb.2016.01192
Yang, C., Liu, H., Li, G., Liu, M., Yun, Y., Wang, C., et al. (2015). The MADS-box transcription factor FgMcm1 regulates cell identity and fungal development in Fusarium graminearum. Environ. Microbiol. 17, 2762–2776. doi: 10.1111/1462-2920.12747
Yang, E., Chow, W. N., Wang, G., Woo, P. C., Lau, S. K., Yuen, K. Y., et al. (2014). Signature gene expression reveals novel clues to the molecular mechanisms of dimorphic transition in Penicillium marneffei. PLoS Genet. 10:e1004662. doi: 10.1371/journal.pgen.1004662
Yang, E., Wang, G., Woo, P. C., Lau, S. K., Chow, W. N., Chong, K. T., et al. (2013). Unraveling the molecular basis of temperature-dependent genetic regulation in Penicillium marneffei. Eukaryot. Cell 12, 1214–1224. doi: 10.1128/EC.00159-13
Yilmaz, N., Visagie, C. M., Houbraken, J., Frisvad, J. C., and Samson, R. A. (2014). Polyphasic taxonomy of the genus Talaromyces. Stud. Mycol. 78, 175–341. doi: 10.1016/j.simyco.2014.08.001
Young, M. D., Wakefield, M. J., Smyth, G. K., and Oshlack, A. (2010). Gene ontology analysis for RNA-seq: accounting for selection bias. Genome Biol. 11, R14. doi: 10.1186/gb-2010-11-2-r14
Keywords: Talaromyces marneffei, madsA, dimorphic transition, transcriptome, yeast-to-mycelium, oxidative stress
Citation: Wang Q, Du M, Wang S, Liu L, Xiao L, Wang L, Li T, Zhuang H and Yang E (2018) MADS-Box Transcription Factor MadsA Regulates Dimorphic Transition, Conidiation, and Germination of Talaromyces marneffei. Front. Microbiol. 9:1781. doi: 10.3389/fmicb.2018.01781
Received: 04 February 2018; Accepted: 16 July 2018;
Published: 07 August 2018.
Edited by:
Hector Mora Montes, Universidad de Guanajuato, MexicoReviewed by:
Gustavo Alexis Niño-Vega, Universidad de Guanajuato, MexicoCopyright © 2018 Wang, Du, Wang, Liu, Xiao, Wang, Li, Zhuang and Yang. This is an open-access article distributed under the terms of the Creative Commons Attribution License (CC BY). The use, distribution or reproduction in other forums is permitted, provided the original author(s) and the copyright owner(s) are credited and that the original publication in this journal is cited, in accordance with accepted academic practice. No use, distribution or reproduction is permitted which does not comply with these terms.
*Correspondence: Tong Li, dG9uZ2xpMDhAdmlwLnNpbmEuY29t
Hui Zhuang, emh1YW5nYm11QDEyNi5jb20=
Ence Yang, eWFuZ2VuY2VAcGt1LmVkdS5jbg==
Disclaimer: All claims expressed in this article are solely those of the authors and do not necessarily represent those of their affiliated organizations, or those of the publisher, the editors and the reviewers. Any product that may be evaluated in this article or claim that may be made by its manufacturer is not guaranteed or endorsed by the publisher.
Research integrity at Frontiers
Learn more about the work of our research integrity team to safeguard the quality of each article we publish.