 Jieyun Hu
 Lu Lin1
 Weiling Yan
- 1Shanghai Food Research Institute, Shanghai, China
- 2Shanghai Municipal Center for Disease Control and Prevention, Shanghai, China
Staphylococcal enterotoxins (SEs) produced by Staphylococcus aureus (S. aureus) are the cause of Saphylococcal food poisoning (SFP) outbreaks. Thus, estimation of the time to detection (TTD) of SEs, that is, the time required to reach the SEs detection limit, is essential for food preservation and quantitative risk assessment. This study was conducted to explore an appropriate method to predict the TTD of SEs in cooked chicken product under variable environmental conditions. An S. aureus strain that produces staphylococcal enterotoxin A (SEA) was inoculated into cooked chicken meat. Initial inoculating concentrations (approximately 102, 103, 104 CFU/g) of S. aureus and incubation temperatures (15 ± 1, 22 ± 1, 29 ± 1, and 36 ± 1°C) were chosen as environmental variables. The counting of S. aureus colonies and the detection of SEA were performed every 3 or 6 h during the incubation. The TTD of SEA was considered a response of S. aureus to environmental variables. Linear polynomial regression was used to model the effects of environmental variables on the TTD of SEA. Result showed that the correlation coefficient (R2) of the regressed equation is higher than 0.98, which means the obtained equation was reliable. Moreover, the minimum concentration of S. aureus for producing a detectable amount of SEA under various environmental conditions was approximately 6.32 log CFU/g, which was considered the threshold for S. aureus to produce SEA. Hence, the TTD of SEA could be obtained by calculating the time required to reach the threshold by using an established S. aureus growth predictive model. Both established methods were validated through internal and external validation. The results of graphical comparison, RMSE, SEP, Af, and Bf showed that the accuracy of both methods were acceptable, and linear polynomial regression method showed more accurately.
Introduction
Staphylococcus aureus (S. aureus) is a worldwide cause of foodborne diseases. In the European Union (EU), 393 foodborne outbreaks caused by staphylococcal species were reported in 2014 (EFSA, 2014). In the US, foodborne illnesses caused by S. aureus were estimated to range from 72,341 to 529,417 (Scallan et al., 2011). According to the Notification of National Food Poison Outbreaks in 2015 issued by the National Health Commission of P. R. China (http://www.nhfpc.gov.cn/yjb/s7859/201604/8d34e4c442c54d33909319954c43311c.shtml), S. aureus is one of the major causes of foodborne diseases in China.
Ready-to-Eat (RTE) cooked meat products are very popular in China, the poultry is the major ingredient of RTE cooked meat products. In many local delis, RTE meat products are stored at room temperature, and almost all the products are stored without packaging or with very simple packaging (wrapped with polyethylene film) to prevent dust. In addition, some of these products such as cooked chickens or ducks would be sliced and displayed in counter for a quite long time before sell. This made them susceptible to contamination by microorganism including pathogens from the environment during the storage (Denayer et al., 2017). Several food safety monitoring studies in China (Ye et al., 2012; Chen et al., 2014; Zhou et al., 2014) indicated that S. aureus was one of the most common foodborne pathogens associated with cooked meat products.
Staphylococcal enterotoxins (SEs) are synthesized by S. aureus in food if growth conditions are adequate for the microorganism (Smith et al., 1983). It is a family consists of more than 20 serologically different SEs, share a sequence homology (Sospedra et al., 2013). SEs are capable of causing gastroenteritis in humans, thereby making them the causative agents of SFP (Wu and Su, 2014). In addition, SEs are resistant to proteolytic enzymes and normal heat processing; even if S. aureus have been sterilized, the biological activity of SEs remains unchanged. According to regulation (EC) No 1441/2007, if the coagulase-positive staphylococci (CPS, mainly S. aureus) counts are >105 CFU/g during the processing, then the testing of enterotoxins must be performed. Given that the SEs and not S. aureus itself caused the SFP, and the detection of SEs was reportedly an in-depth process (Cretenet et al., 2011), a question was raised: supposing the foodstuff was contaminated by S. aureus, is estimating the time to detection (TTD) of SEs (the time required to reach the SEs detection limit) in food possible? If so, how can this be done? Numerous studies on S. aureus growth or survive predictive models in meat (Rodriguez-Caturla et al., 2009; Valero et al., 2009; Min et al., 2012; Lee et al., 2015) had been developed. However, less attention was paid to predictive staphylococcal enterotoxin models, which are essential for ruling regulation, food preservation, and quantitative risk assessment (Schelin et al., 2010).
Similar to the survival and growth of S. aureus, which are environment dependent, SE production in different foods during processing and storage was also considered environment dependent in many articles (Smith et al., 1983; Wallin-Carlquist et al., 2010; Tsutsuura et al., 2013). Therefore, in the present study, we assumed that the TTD of SEs in food was a response of S. aureus to environmental variables. The effects of environmental variables on the growth kinetics (such as lag phase and maximal rate) of bacteria could be established by the construction of a second model. Thus, we assumed that the SEs could also be predicted by establishing a mathematical model that describes the effects of environmental variables on the TTD of SEs.
In this study, we attempted to use linear polynomial regression to quantify the effect of environmental variables on the TTD of SEs in food. Considering that the validity of applying predictive models constructed in the laboratories in real food matrix is often questioned, an S. aureus strain that produces enterotoxin A (SEA), the most common type of SEs in food products (Smith et al., 1983; Tsutsuura et al., 2013; Zeaki et al., 2014), was chosen for inoculation into cooked chicken meat. The S. aureus colonies were counted and the SEA was detected regularly during the incubation. Linear polynomial regression was applied to model the effects of environmental variables the TTD of SEA.
Materials and Methods
Experimental Design
To understand the basic technological profile of RTE cooked meat products, more than 20 cooked meat products were purchased from several delis around Shanghai. The NaCl level of these samples was tested in accordance with the China National Standards (GB/T12457-2008). Water activity (aw) and pH value were tested by an Aw meter (HygroLab2, Rotronic,) and a pH meter (Delta 320, Mettler Toledo, China) in accordance with GB 5009.238-2016 and GB 5009.237-2016, respectively. Results showed that the NaCl level, water activity (aw), and pH value of all the samples ranged from 0.5–2.2%, 0.960–0.980, and 6.52–6.84, respectively. S. aureus is well known for its tolerance to salt, low aw, and acidic environment. A previous study (Smith et al., 1983) revealed that the NaCl level required for S. aureus to produce enterotoxins ranged from 0 to 10%, and initial pH values of 5.0–8.0 yielded similar amounts of SEA production.
The above finding indicates that the NaCl level and pH value of RTE cooked chicken product in China appear to be unlikely to significantly affect the growth rate and SEs production of S aureus. Therefore, in this study, cooked chicken was selected as the food matrix, and various incubation temperatures and initial inoculating concentrations were chosen as the critical variables to develop the model (Table 1). Six additional experiment conditionals were used to validate the predicting model (Table 2).
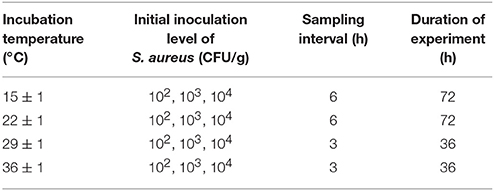
Table 1. Environmental factors and experimental design for modeling the TTD of SEA in cooked chicken product.
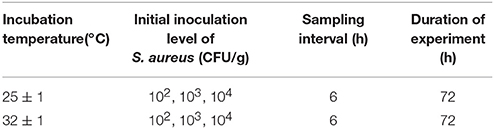
Table 2. Additional experiment groups designed for validating the predicted model.
Fresh Chicken Meat
A 500 g packet of chilled skinless chicken breasts (Tyson Food, Inc. China) was purchased at a local supermarket. The chilled skinless chicken breasts was determined to be S. aureus—free when samples were tested by a standard spread plate count assay (China National Food Safety Standards GB 4789.10-2010) and was verified to be SEA - free based on the results of the VIDAS SET2 described below.
S. aureus Strain and Preparation of Inoculum
An S. aureus strain (SA14966) that is known to produce SEA was isolated from food and preserved in Shanghai Food Research Institute (Wang, 2015). To prepare the inoculum, 0.1 mL of thawed bacteria was moved into 50 mL of Luria–Bertani (LB) medium and were grown to the cell concentration of approximately 9.0 log Colony-Forming Units (CFU)/mL in a thermostatic oscillating incubator (THZ-100, YiHeng, Shanghai, China) at 100 rpm at 36 ± 1°C for 18–20 h. Single colonies of bacteria were obtained from plate streaking, which were incubated at 36 ± 1°C for 24 h. Referencing the method of Peter and Robert (2005), bacteria obtained from a single colony was transferred into 50 mL of LB medium, and incubated in a thermostatic oscillating incubator at 100 rpm at 36 ± 1°C for 18–20 h. Then, the bacteria were centrifuged using a refrigerated benchtop centrifuge(H-2050R, XiangYi, HuNan, China) at 12,000 rpm at 4°C for 30 min and washed with sterile 0.1 mol/L potassium phosphate buffer (pH 7) solution two times and diluted to the desired concentration. Two times' washing guarantees that the resulting solution contains only S. aureus cells without carrying SEA.
Sample Preparation
Fresh chicken meats were divided into blocks and cooked in boiling water for 10 min. After cooling and draining, the cooked chicken meat was then immersed into an S. aureus solution with various cell concentrations for approximately 5 min. According to the experimental design of this study, the initial inoculation concentration of sample was designed to 102, 103, and 104 CFU/g separately. To guarantee the initial inoculation concentration of the sample close to the designed concentration, the desired concentration of S. aureus solution for inoculating was diluted to 10-times higher than the designed concentration; the sample to volume of suspension ratio was set to 1:5. The actual initial inoculation concentration of the sample would be confirmed based on the method described below.
Each 50 g inoculated chicken meat was then packaged into a sterile plastic bag under a clean bench and stored at 15 ± 1, 22 ± 1, 29 ± 1, and 36 ± 1°C. The samples were tested every 3 or 6 h to count the numbers of colonies.
Plate Counting of S. aureus and Detetion of Staphylococcal Enterotoxin A
About 25 g chicken meat from each sample was homogenized with 225 mL of sterile saline (0.9%) following shaking for 2 min with a stomacher (Analis BagMixer 400 p, Interscience, France). Viable counts were carried out by plating a dilution in sterile saline onto 3 M Petrifilm™ Staph Express Count Plate (3M Center, St. Paul, MN 55144,USA) after being incubated at 36 ± 1°C for 24 h. A total of 25–30 g residual from each sample was used to detect the SEA.
The VIDAS Staphylococcal Enterotoxin II (SET2) detection kits (Biomerieux, France) and a Mini-VIDAS auto analyzer (Biomerieux, France) were applied for the detection of SEA in this study. The principle of this measurement system is enzyme-linked fluorescent assay using polyclonal anti-enterotoxin antibody. Results are expressed as TV, which is the relative fluorescence value (RFV) of the test solution divided by the RFV of the standard in the VIDAS SET2 kit. A test solution with a TV value of ≥0.13 was considered positive. The detection limit is 0.5 ng/g of SEA.
Three replicates of plate counting and SEA detection were performed for each condition. The average values and the standard deviations of the transformed values were then calculated.
Correction of the Observed TTD of SEA and the Estimation of S. aureus Concentration at the TTD of SEA
One of the major factors that influence the successful establishment of the model is the determination of the actual TTD of SEA under designed conditions. Given the 3 or 6 h sampling interval in this study, the observed TTD of SEA (the first positive point) will not be the same as the actual TTD of SEA (TV = 0.13). To obtain the time close to the actual TTD of SEA, linear interpolation was used to correct the observed TTD. The linear interpolation approach is shown in Figure 1. The corrected TTD of SEA was close to the actual TTD of SEA.
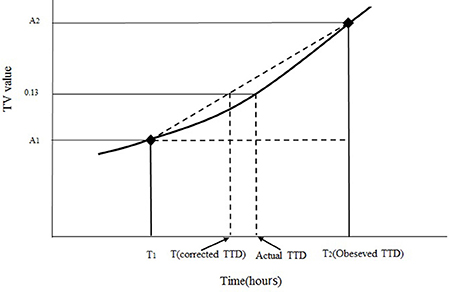
Figure 1. Diagram of the correction for obtaining the corrected TTD of the SEA. A1 is the TV value of the last negative point at the time of T1, A2 is the TV value of the first positive point at the time of T2, T is the corrected TTD of SEA. The curve with (♦) is the trend of TV value during incubation.
In accordance with Figure 1 and the principle of similar triangles, the corrected TTD of SEA could be obtained from Equation (1) (Tu and Huang, 2012).
where T is the corrected TTD of SEA, A1 is the TV value of the last negative point at the time of T1, A2 is the TV value of the first positive point at the time of T2, and 0.13 is the TV value at the SEA detection limit.
The concentration of S. aureus at the observed TTD of SEA was obtained by S. aureus counting from that point. The concentration of S. aureus at the corrected TTD of SEA could be obtained by substituting T into the modified Gompertz equation under the studied temperature.
Construction and Validation of the Model
Modeling of Primary Model for S. aureus Growth
According to the results of our previous study (Hu et al., 2016), the modified Gompertz equation (Gibson et al., 1987) was appropriate to describe the S. aureus growth in cooked chicken meat under the temperature range of 15 ± 1–36 ± 1°C.
Modeling of Linear Polynomial Regression
In this study, various initial inoculation concentrations and incubation temperature were chosen as the critical variables, and linear polynomial regression was used to model the effect of variables on the TTD of SEA. MATLAB2014a was used to regress the model. The linear polynomial regression was established as follows (Zhao et al., 2002; Basti and Razavilar, 2004):
where Linoc is the log(initial inoculation concentration) (CFU/g), T is the incubation temperature (°C), and ai is the coefficient estimated by regression (i = 0,1,2,… 5). The corrected TTD of SEA was used as the observed value during regression.
Validation and Reliability Evaluation of the Model
After the establishment of a predictive model, predicted values from 12 conditions for model establishment (Table 1) and additional 6 conditions (Table 2) for model validation were mathematically evaluated. The corrected TTD of SEA from all the conditions were regarded as observed values. In this paper, the accuracy of the predictive model describing the TTD of SEA was evaluated by four criteria: root mean-square error (RMSE), standard error of prediction (SEP) (Hervas et al., 2001; Garcia-Gimeno et al., 2005; Zurera-Cosano et al., 2006), bias factor (Bf), and accuracy factor (Af) (Ross, 1996; Garcia-Gimeno et al., 2005; Zurera-Cosano et al., 2006), which are shown as follows:
where obs is the observed value, pred is the predicted TTD calculated from the constructed predictive method, and meanobs is the mean of the observed value.
Statistical Analysis
An analysis of variance (ANOVA) of the established equation was performed and the correlation test of the variables on the TTD of SEA was measured by using SPSS Statistics 23.0.
Results
Predictive Model of TTD of SEA Using Linear Polynomial Regression
Figure 2 presents the S. aureus growth and SEA production in cooked chicken meat under 15 ± 1, 22 ± 1, 29 ± 1, and 36 ± 1°C with Initial inoculating concentrations approximately 102, 103, and 104 CFU/g. Table 3 shows the observed TTD of SEA, corrected TTD of SEA, and the concentration of S. aureus at the corrected TTD of SEA under various temperatures and initial inoculation concentrations. The TTD of SEA at 15°C could not be found in Table 3, because the SEA could not be detected at 15°C within 72 h. Thus, the temperature range for model regression was set from 22 to 36°C.
Figure 2. S. aureus growth and SEA production in cooked chicken meat at 15–36°C [(A) 15°C, (B) 22°C, (C) 29°C, (D) 36°C] with inoculating concentration approximately (1) 102CFU/g, (2) 103 CFU/g, (3) 104CFU/g. TV value ( ) of ≥0.13 was considered positive and SEA produced; TV value (
 ) of ≤0.13 was considered negative and no SEA produced. The curved line with (♦) shows measured viable cell counts, and the curved line without squares shows the curve modeled by the modified Gompertz model.
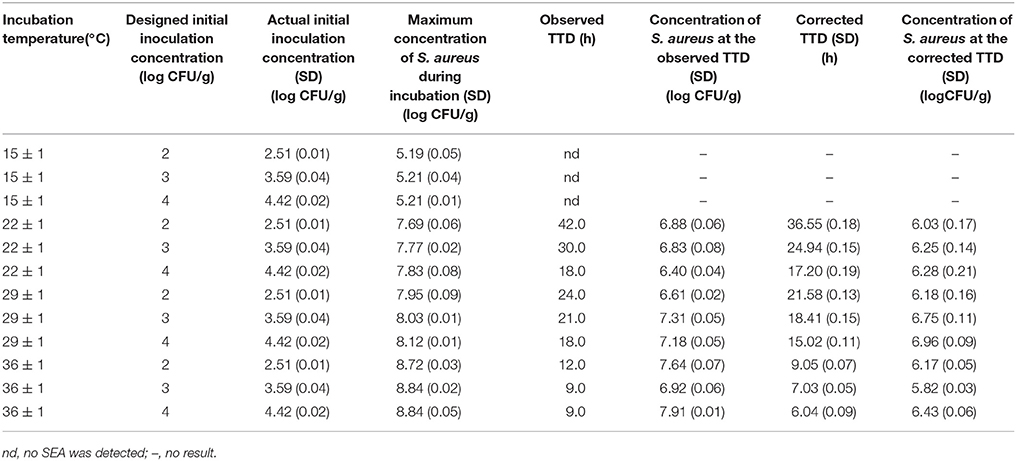
Table 3. TTD of SEA in cooked chicken meat under various combinations of incubation temperatures and initial inoculation concentrations of S. aureus.
A linear polynomial regression model that describes the effects of temperature and initial inoculation concentration on the TTD of SEA was established by stepwise regression as follows:
The ANOVA of the linear polynomial regression model indicated that Equation (7) was significant (p < 0.01). Thus, the regressed equation was reliable. On the basis of this finding, Equation (7) could be used to estimate the TTD of SEA under a temperature range of 22–36°C and an initial inoculation concentration range of 102-104 CFU/g. Therefore, this model was called the predictive model of TTD of SEA using linear polynomial regression.
On the basis of the linear polynomial regression equation of the obtained TTD predictive model (Equation 7), the effects of environmental variables (temperature and initial concentration) on the parameters (i.e., TTD of SEA) were analyzed. Even under the maximum initial inoculation concentration and temperature, the calculated value of the primary terms was much larger than that of the interaction term and quadratic terms. This condition means that the changes in values of TTD were mainly dependent on the primary terms of Equation (7). Given the negative coefficients of the primary terms, we can conclude that temperature and initial inoculation concentration have a decreasing effect on the values of the TTD. This conclusion is consistent with the observations of the experiments. For example, SEA can be detected 6–9 h after inoculation at 36°C. When the temperature decreased to 22°C, the TTD of SEA was delayed to 17–37 h. SEA could not be detected during 72 h at 15°C.
The result of correlation test for both independent factors also confirmed the effects of temperature and initial concentration on the TTD of SEA. The Pearson correlation coefficient (PCC) was −0.81, which meant the temperature was highly negative correlated with the TTD. The initial inoculation level also showed negative correlation with the TTD, but its correlation level was intermediate (PCC = −0.48).
The interactions of the environmental variables on the TTD of SEA are shown in a 3D surface plot (Figure 3). Figure 2 shows that the TTD of SEA decreased within the range of experimental limits with an increase in the temperature and initial inoculation level. Although both temperature and initial inoculation concentration had a negative effect on the TTD of SEA, the slopes of the combined plots of temperature and initial inoculation concentration indicated that the effect of incubation temperature was more significant (the direction of temperature is much steeper).
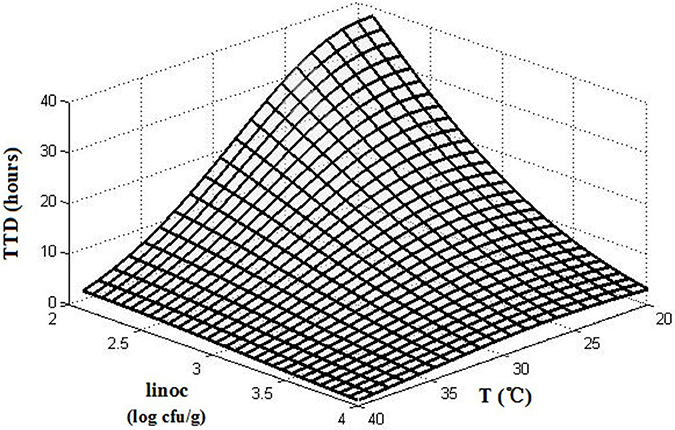
Figure 3. The 3D surface plots of TTD affected by temperature (T) and initial inoculation level (linoc).
The predicted results of 12 combinations for model establishment and 6 combinations for model validation as obtained by this model are shown in Tables 4, 5, respectively.
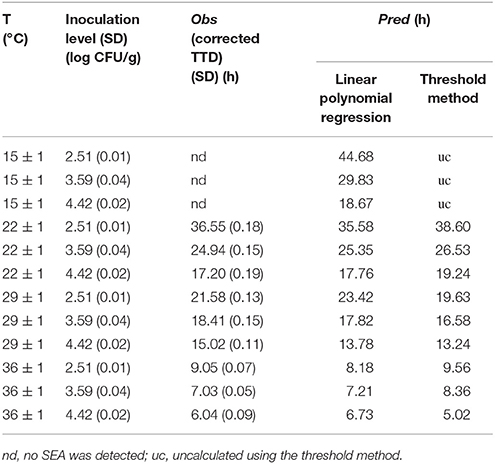
Table 4. Observed and predicted TTD of SEA under combined conditions for internal validation.
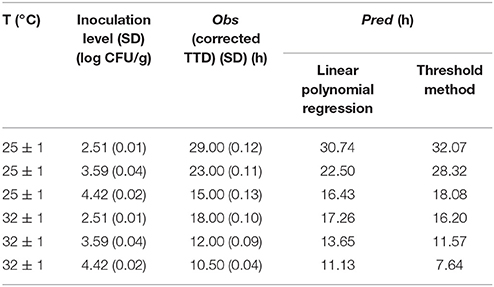
Table 5. Observed and predicted TTD of SEA under combined conditions for external validation.
Predictive Model of TTD of SEA Using the Threshold Method
Table 3 shows the concentration of S. aureus at the corrected TTD of SEA under designed environmental conditions. Figure 4 shows the effects of temperature and initial inoculation concentrations on the concentrations of S. aureus at the corrected TTD of SEA. A flat surface with a slight fluctuation (Figure 4) indicated that the concentration of S. aureus at the TTD of SEA was always within a narrow range regardless of the varying environmental conditions. In other words, SEA could be detected only when the concentration of S. aureus reached a particular level. According to the results of this experiment, this particular level (threshold) of S. aureus for producing a detectable amount of SEA in cooked chicken meat was estimated to be 6.32 ± 0.35 log CFU/g, which was the mean value of S. aureus concentration at the corrected TTD under designed environmental conditions.
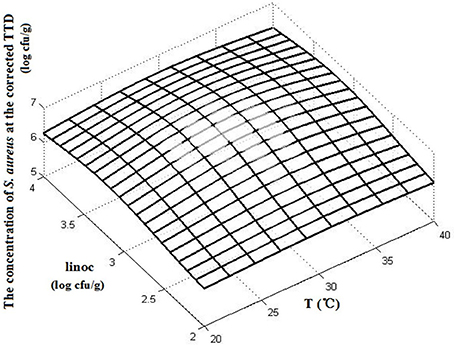
Figure 4. The concentration of S. aureus at the corrected TTD under various conditions.
The threshold concentration of S. aureus could be used as a critical reference to determine whether SEA could be detected. Thus, we considered that the time required to reach the threshold could be calculated by an S. aureus growth predictive model. In the present study, we thought the TTD of SEA in cooked chicken meat could be obtained by calculating the time required to reach the concentration of 6.32 log CFU/g using an S. aureus growth predictive model in cooked chicken. Thus, this method was called the predictive model of TTD of SEA using the threshold method.
Hu et al. (2016) built the predictive model for S. aureus growth in cooked chicken meat, inoculating the same S. aureus strain that produces SEA (SA14966) into the cooked chicken meat. Modified Gompertz model, modified logistic model, and Baranyi model were all used to fit the growth curve. The modified Gompertz model was considered the optimal primary model to describe the S. aureus growth in cooked chicken meat; this conclusion well agreed with the result of other author (Lee et al., 2015). The secondary model was established by using response surface equation. On the basis of the established primary model and secondary model, the time required to reach a certain S. aureus concentration could be calculated under a temperature range of 15–36°C and an initial inoculation concentration range of 102-104 CFU/g within 72 h.
The predicted results obtained by this method for model establishment and model validation are shown in Tables 4, 5, respectively.
Validation and Comparison of the Two Methods
In this study, both the linear polynomial regression and threshold methods were subjected to internal and external validation. The observed and the predicted values from the two methods are shown in Tables 4, 5.
The temperature of 15°C was considered beyond the interpolation ranges of Equation (7). Therefore, in this study, the data of 22, 29, and 37°C in Table 4 and the data of 25, and 32°C in Table 5 were used for model validation. The threshold concentration of S. aureus for producing a detectable amount of SEA in cooked chicken was considered to be 6.32 log CFU/g. However, the concentration of S. aureus would never reach this concentration within 72 h under certain conditions. As a result, the predicted values could not be calculated by using the established growth model. Thus, this situation in Tables 4, 5 was marked as “nc (no calculated result).”
The generalization properties of the models were evaluated by using graphical comparisons, and plots between the observed and predicted TTD of SEA by using linear polynomial regression and the threshold model under experimental conditions are shown in Figure 5.The results of graphical comparisons indicate that the correlation coefficients from internal validation were better than those from external validation. In the internal validation, both methods showed satisfactory regression results, while the prediction of linear polynomial regression method showed a slightly better agreement than the threshold model. In the external validation, the prediction method of linear polynomial regression was also significantly better than the threshold method (Figure 5).
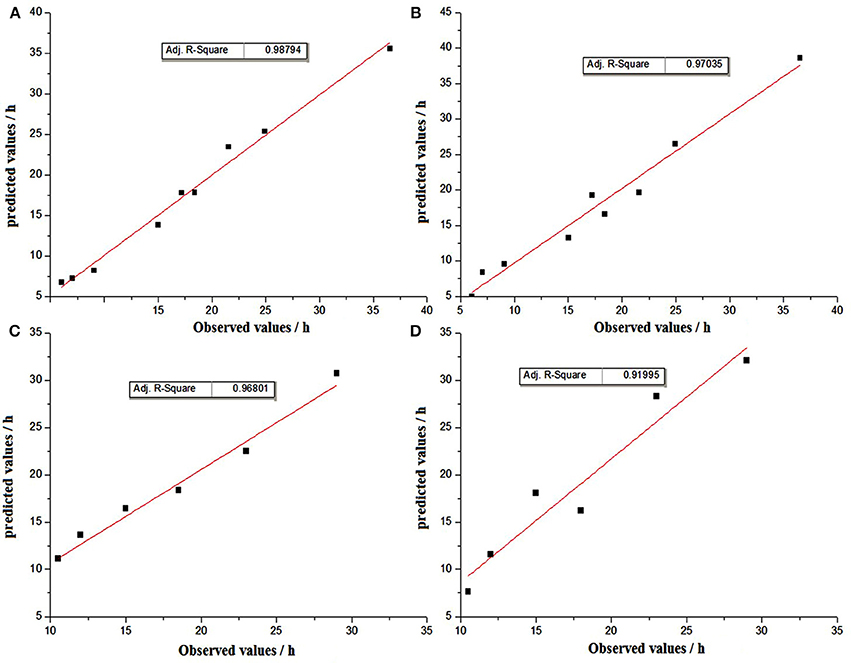
Figure 5. Graphical comparisons beteween observed and predicted TTD values by the method of linear polynomial regression for internal validation (A) and external validation (C); by the method of threshold for internal validation (B) and external validation (D).
For further evaluation of the established prediction models, RMSE, Bf, Af, and %SEP were calculated as described by Dong et al. (2007). The results of nine conditions for model establishment (Table 4) were used for internal evaluation, as shown in Table 6. The results of an additional six conditions for model validation (Table 5) were used for external evaluation, as shown in Table 6.
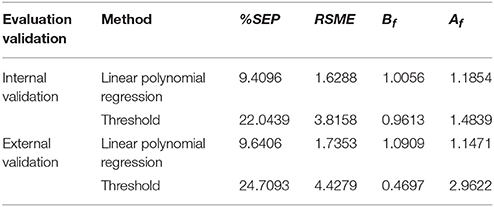
Table 6. Mathematical internal and external evaluation based on TTD of SEA by two methods for establishing the model.
RMSE is used to measure the dispersion of predicted values (Wang et al., 2011). Table 6 shows that the RMSE of internal evaluation from the linear polynomial regression method (1.6288) was better than that from the threshold method (3.8158).
Bf is a measure of the extent of under- or over prediction by the model and shows the structural deviation of the prediction model (Dong et al., 2007). Internal evaluation results (Table 6) demonstrated that Bf was close to 1 for both prediction methods (1.0051 and 0.9613). Based on the opinions proposed by Ross (1999), the interpretations of Bf when used for evaluating the model performance involving pathogens was described as following: “0.90–1.05 can be considered good; 0.70–0.90 or 1.06–1.15 can be considered acceptable; and <0.70 or >1.15 should be considered unacceptable.” This standard reflects that the internal evaluation results of Bf are within the good range.
Af values were also measured in this study. The average estimate tends to be less accurate with the increase in the Af value, while a value of 1 indicates perfect consistency between all predicted and observed values (Lebert et al., 2000). Ross et al. (2000) proposed that an acceptable accuracy factor could be determined by considering the numbers of environmental variables in a model. Therefore, the best performance that might be expected from the kinetic model that contains the effects of initial inoculation concentration and incubation temperature is an accuracy factor of 1.2. In this study, Af values of 1.1854 and 1.1471 for the linear polynomial regression method from both internal and external evaluation were within the acceptable range, but the Af values of 1.4839 and 2.9622 for the threshold method were unsatisfactory.
Standard error of prediction (%SEP) expressed as a percentage has the advantage of being dimensionless (Garcia-Gimeno et al., 2003). A few scientific studies reflect the %SEP values. For example, the best values obtained were 14.04% of SEP for the growth rate and 14.84% for the lag estimation of Lactobacillus plantarum (Garcia-Gimeno et al., 2002) by the best ANN model, which were much better than those obtained by RSM at 35.63 and 39.30%, respectively. Compared with the results in Tables 6, 7, the %SEP values of the linear regression model were much lower than those of the threshold method from both internal and external validation.
Tables 6 shows that the statistical results of RMSE, SEP, and factors Bf, Af of the internal validation were better than those of the external validation, and the linear polynomial regression method was more accurate than the threshold method.
Discussion and Conclusion
A preliminary exploration of the TTD predictive methods was performed in this study. We assumed that the TTD of SEA was a response of S. aureus to environmental variables. A mathematical model was used for the first time to quantify the effects of environmental variables on the TTD of SEA in cooked chicken meat. The experiment and validation results indicate the validity of our hypothesis and designed methods, that is to say, the TTD of SEA in food is highly correlated with environmental variables and it can be predicted by establishing a mathematical model that describes the effects of environmental variables on the TTD of SEA.
On the basis of the result of this study, temperature is considered the significant environmental factor that influences the TTD of SEA. The TTD would be delayed effectively when cooked meat products are stored at low temperatures. This condition serves as a reminder for manufacturers that low-temperature storage is critical for extending the shelf life of RTE cooked meat products. According to the local regulation issued by the Shanghai Municipal Food and drug administration (http://www.shfda.gov.cn/gb/node2/yjj/xxgk/zfxxgk/zxxxgk/sp/userobject1ai9285.html), the shelf life of RTE cooked meat products without packaging is within 24 h. On the basis of the calculated results from our established predictive model, if the cooked chicken product was contaminated with SEA-producing S. aureus at an initial concentration of approximately 103 CFU/g, then SEA could not be detected within 24 h when the product was stored at a temperature lower than 27.0°C. To ensure safety, the product should be stored at a temperature lower than 22.0°C. Hence, SEA could not be detected within 30.8 h.
Among the mathematical models used in predictive microbiology, linear polynomial regression is a useful method and has been widely used to predict the growth kinetics of bacteria (Zhao et al., 2002; Dong et al., 2007; Lee et al., 2015). The first use of polynomial regression to predict the enterotoxins was reported by Chaves et al. (2017). In that study, temperature, pH value (5.9–6.2) and NaCl concentration (0.8–2.3%) were considered as experimental variables to establish the predictive model, the results of that study confirmed our previous assumption that the pH value and NaCl concentration had no significant effect on TTD. Accordance with our experimental design, temperatures and initial inoculating concentrations were chosen as the environmental variables, the result of correlation test showed that the temperature had a high negative correlation with TTD, which is consistent with the conclusions of Chaves et al. (2017). The initial inoculating concentration also had negative correlation with TTD, but its correlation level was lower than that of temperature. The initial inoculating concentration was chosen as an environmental variable in this study because it can be used to simulate the level of food contamination in practical applications.
Some published papers reported the minimum concentration (threshold) of S. aureus for producing a detectable amount of SEA under variable environmental conditions in different foods (Anunciaçao et al., 1995; Fujikawa and Morozumi, 2006; Lin et al., 2015). It was Fujikawa and Morozumi (2006) who first proposed the threshold method in their study on predicting the amount of toxin in milk. The initial time (another expression of TTD) in that study was suggested to be predicted by using the threshold concentration of S. aureus and the established S. aureus growth model in milk. Tango et al. (2015) also analyzed the S. aureus cell density and the time when the toxin could be detected under various temperatures in cooked fish paste. However, both of them didn't apply and validate this method in their article.
To date, the monitoring of enterotoxins production during the incubation was performed by intermittent detection rather than continuous real-time detection, because the latter method could not be applied for practical use (Cretenet et al., 2011). Given the intermittent sampling in studies, the observed TTD of SEA will not be the same as the actual TTD of SEA. Thus, how to determine the actual TTD becomes a problem. To best of our current knowledge, the time of first positive point was usually considered as the earliest time to produce enterotoxins and used as observed value at all studies. In the present study, linear interpolation was used to correct the observed TTD. On the basis of the principle of interpolation calculation (Figure 1), the corrected TTD of SEA is close to the actual TTD. Given the corrected TTD used to the regress the polynomial equation instead of observed TTD, the predicted results obtained from the regressed equation would be more accurate.
Moreover, the use of linear interpolation would be helpful to obtain a more accurate threshold value, which makes the predicted result more accurate. Based on the calculated results of Table 3, the mean value of the S. aureus concentration at the observed TTD (7.08 ± 0.48 log CFU/g) was significantly higher (p < 0.01) than that at the corrected TTD (6.32 ± 0.35 log CFU/g).Using the former value as the threshold would result an unsafe prediction in practice because the predicted TTD using the former value as the threshold would obviously longer than that using the latter value as the threshold.
The major finding of this study is that both linear polynomial regression and threshold methods are suitable for predicting the TTD of SEA in cooked chicken products despite their different prediction approaches. The use of linear polynomial regression takes advantage of its straightforward approach and absence of knowledge of a particular process, while the threshold method is difficult to construct as it requires a considerable amount of data from microbial counting. However, a recent study reported that the use of a molecular predictive model could save more labor and time to develop more precise models of S. aureus (Guan et al., 2017). Also, the threshold method seems closer to the construction of mechanistic models because it contributes important information, i.e., the threshold concentration of S. aureus for producing a detectable amount of SEA, which shows great biological significance. Furthermore, the threshold value for S. aureus to produce SEA in various foods could be embedded into current microbial modeling software packages to add the function of SEA prediction, thereby significantly increasing the application of microbial modeling software packages.
Author Contributions
JH designed and performed the experiments, analyzed the data and wrote the manuscript. LL prepared reagents, materials and performed the experiments together with JH. MC performed the detection of enterotoxin. WY contributed to the conception of the study, conceived the experiments and approved the final version of the manuscript.
Funding
This study was supported by the program (2015-114) of the Development of Application Technology Project issued by Science and Technology Committee of Shanghai Municipal Government.
Conflict of Interest Statement
The authors declare that the research was conducted in the absence of any commercial or financial relationships that could be construed as a potential conflict of interest.
References
Anunciaçao, L. L., Linardi, W. R., Carmo, L. S., and Bergdoll, M. S. (1995). Production of staphylococcal enterotoxin A in cream-filled cake. Int. J. Food Microbiol. 26, 259–263.
Basti, A. A., and Razavilar, V. (2004). Growth response and modeling of the effects of selected factors on the time-to-detection and probability of growth initiation of Salmonella typhimurium. Food Microbiol. 21, 431–438. doi: 10.1016/j.fm.2003.10.006
Chaves, R. D., Silva, A. R., Alvarenga, V. O., Pereira, J. L., and Khaneghah, A. M. (2017). The modeling of time to enterotoxin detection of Staphylococcus aureus in chicken meat. J. Food Saf. 37:e12342. doi: 10.1111/jfs.12342
Chen, J., Gu, Q. F., Liu, C. H., and Zhang, X. I. (2014). Monitoring results on food-borne pathogens in food in Shanghai from 2011 to 2012. Shanghai J. Prev. Med. 26, 169–172.
Cretenet, M., Even, S., and Loir, W. L. (2011). Unveiling Staphylococcus aureus enterotoxin production in dairy products: a review of recent advances to face new challenges. Dairy Sci. Technol. 91, 127–150. doi: 10.1007/s13594-011-0014-9
Denayer, S., Delbrassinne, L., Nia, Y., and Botteldoorn, N. (2017). Food-Borne outbreak investigation and molecular typing: high diversity of Staphylococcus aureus strains and importance of toxin detection. Toxins 9:E407. doi: 10.3390/toxins9120407
Dong, Q. L., Tu, K., Guo, L. Y., Li, H. W., and Zhao, Y. (2007). Response surface model for prediction of growth parameters from spores of Clostridium sporogenes under different experimental conditions. Food Microbiol. 24, 624–632. doi: 10.1016/j.fm.2006.12.003
EFSA (2014). The European union summary report on trends and sources of zoonoses, zoonotic agents and food-borne outbreaks in 2014. EFSA J. 13:4329. doi: 10.2903/j.efsa.2015.4329
Fujikawa, H., and Morozumi, S. (2006). Modeling Staphylococcus aureus growth and enterotoxin production in milk. Food Microbiol. 23, 260–267. doi: 10.1016/j.fm.2005.04.005
Garcia-Gimeno, R. M., Barco, E., Rincon, F., and Zurera-Cosano, G. (2005). Response surface model for estimation for Escherichia coli O157:H7 growth under different experimental conditions. J. Food Sci. 70, M30–M36. doi: 10.1111/j.1365-2621.2005.tb09043.x
Garcia-Gimeno, R. M., Hervas-Martinez, C., Barco-Alcalas, E., ZureraCosano, G., and Sanz-Tapla, E. (2003). An artificial neural network approach to Escherichia coli O157:H7 growth estimation. J. Food Sci. 68, 639–645. doi: 10.1111/j.1365-2621.2003.tb05723.x
Garcia-Gimeno, R. M., Hervas-Matinez, C., and de Siloniz, I. (2002). Improving artificial neural network with a pruning methodology and genetic algorithms for their application in microbial growth prediction in foods. Int. J. Food Microbiol. 72, 19–30. doi: 10.1016/S0168-1605(01)00608-0
Gibson, A. M., Bratchell, N., and Roberts, T. A. (1987). The effect of sodium chloride and temperature on the rate and extent of growth of Clostridium botulinum type A in pasteurized pork slurry. J. Appl. Bacteriol. 62, 479–490.
Guan, Z. H. P., Jiang, Y., Gao, F., Zhang, L., Zhou, G. H., and Guan, Z. H. J. (2017). Analysis of a molecular predictive mode for the growth of Staphylococcus aureus in pork. Int. J. Food Prop. 20, 68–82. doi: 10.1080/10942912.2015.1136325
Hervas, C., Zurera, G., Garcia, R. M., and Martinez, J. (2001). Optimization of computational neural network for its application to the prediction of microbial growth in foods. Food Sci. Technol. Int. 7, 159–163. doi: 10.1155/2015/561024
Hu, J. Y., Lin, L., Wang, T., Chen, M., and Yan, W. L. (2016). Development of predictive model for Staphylococcus aureus growth in cooked chicken. Microbiol. China 43, 1999–2009. doi: 10.13344/j.microbiol.china.150738
Lebert, I., Robles-Olvera, V., and Lebert, A. (2000). Application of polynomial models to predict growth of mixed cultures of Pseudomonas spp. and Listeria in meat. Int. J. Food Microbiol. 61, 27–39. doi: 10.1016/S0168-1605(00)00359-7
Lee, Y. J., Jung, B. S., Kimb, K. T., and Paik, H. D. (2015). Predictive model for the growth kinetics of Staphylococcus aureus in raw pork developed using Integrated Pathogen Modeling Program(IPMP) 2013. Meat Sci. 107, 20–25. doi: 10.1016/j.meatsci.2015.04.006
Lin, L., Yan, W. L., Chen, P., Ou, J., and Chen, M. (2015). Isolation and identification of Toxigenic Staphylococcus aureus and analysis of its growth and enterotoxin production on products Baiye (Thin Sheet Tofu). Chin. J. Microbiol. 3, 9–16. doi: 10.3969/j.issn.1005-7021.2015.03.002
Min, K. J., Jung, Y. J., Kwon, K. Y., Kim, J. H., Hwang, I. G., and Yoon, K. S. (2012). Effect of temperature on the production of Staphylococcal enterotoxin and thermal inactivation kinetics of Staphylococcus aureus in selected ready-to-eat(RTE) food in KOREA. J. Food Saf. 33, 17–24. doi: 10.1111/jfs.12018
Peter, A. C., and Robert, B. B. (2005). “Growth of Staphylococcus aureus and enterotoxin production in blanched mushroom held in salt cbrines and the possible role of chitin,” in Fifth International Conference on Mushroom Biology and Mushroom products, Shanghai.
Ross, T. (1996). Indices for performance evaluation of predictive models in food microbiology. J. Appl. Bacteriol. 81, 501–508.
Ross, T. (1999). Predictive Food Microbiology Models in the Meat Industry. North Sydney, NSW: meat and livestock Australia (MLA), 196.
Ross, T., Dalgaard, P., and Tienungoon, S. (2000). Predictive modelling of the growth and survival of Listeria in fishery products. Int. J. Food Microbiol. 62, 231–245. doi: 10.1016/S0168-1605(00)00340-8
Rodriguez-Caturla, M. Y., Díaz, A. V., Vallejo, J. L., García-Gimeno, R. M., and Cosano, G. Z. (2009). Effect of pre-incubation conditions on growth and survival of Staphylococcus aureus in sliced cooked chicken breast. Meat Sci. 92, 409–416. doi: 10.1016/j.meatsci.2012.05.003
Scallan, E., Hoekstra, R. M., Angulo, F. J., Tauxe, R. V., Widdowson, M. A., and Roy, S. L. (2011). Foodborne illness acquired in the United States-major pathogens. Emerg. Infect. Dis. 17, 7–15. doi: 10.3201/eid1701.P11101
Schelin, J., Wallin-Carlquist, N., Cohn, M. T., Lindqvist, R., Barker, G. C., and Rådström, P. (2010). The formation of Staphylococcus aureus enterotoxin in food environments and advances in risk assessment. Virulence 2, 580–592. doi: 10.4161/viru.2.6.18122
Smith, J. L., Buchanan, R. L., and Palumb, S. A. (1983). Effect of food environment on staphylococcal enterotoxin synthesis: a review. J. Food Prot. 6, 545–555.
Sospedra, I., Soriano, J. M., and Mañes, J. (2013). Enterotoxinomics: the omic sciences in the study of staphylococcal toxins analyzed in food matrices. Food Res. Int. 54,1052–1060. doi: 10.1016/j.foodres.2013.03.002
Tango, C. H., Hong, S. S., Wang, J., and Oh, D. H. (2015). Assessment of enterotoxin production and cross-contamination of staphylococcus aureus between food processing materials and ready-to-eat cooked fish paste. J. Food Sci. 80, 2911–2916. doi: 10.1111/1750-3841.13143
Tsutsuura, S., Shimamura, Y., and Murta, M. (2013). Temperature dependence of the production of staphylococcal enterotoxin A by Staphylococcus aureus. Biosci. Biotechnol. Biochem. 77, 30–37. doi: 10.1271/bbb.120391
Tu, L. L., and Huang, D. (2012). Application of interpolation in data correction. Math. Theory Appl. 32, 110–116.
Valero, A., Pérez-Rodríguez, F., Carrasco, E., Fuentes-Alventosa, J. M., García-Gimeno, R. M., and Zurera, G. (2009). Modelling the growth boundaries of Staphylococcus aureus: effect of temperature,pH and water activity. Int. J. Food Microbiol. 133, 186–194. doi: 10.1016/j.ijfoodmicro.2009.05.023
Wallin-Carlquist, N., Márta, D., Borch, E., and Rådström, P. (2010). Prolonged expression and production of Staphylococcus aureus enterotoxin A in processed pork meat. Int. J. Food Microbiol. 141, S69–S74. doi: 10.1016/j.ijfoodmicro.2010.03.028
Wang, J., Dong, Q. L., and Ding, T. (2011). An overview of evaluation methods for predictive microbial growth models. Food Sci. 21, 268–272. doi: 10.7506/spkx1002-6630-201121054
Wang, T. (2015). The Study on the Growth, Enterotoxin Producing and Their Inhibitor Method of Staphylococcus aureus in Whipping Cream. Master's dissertation, Shanghai: Shanghai Ocean University.
Wu, X. L., and Su, Y-C. (2014). Growth of Staphylococcus aureus and enterotoxin production in pre-cooked tuna meat. Food Control 42, 63–70. doi: 10.1016/j.foodcont.2014.01.039
Ye, L. Q., Chen, W. W., Yang, Y. H., Ma, Q. F., and Hong, J. C. H. (2012). Contamination and drug resistance analysis of the Staphylococcus aureus strains from foodstuff at Fujian province in 2010. Strait J. Prev. Med. 18, 53–54.
Zeaki, N., Cao, R., Skandamis, P. N., Rådström, P., and Schelin, J. (2014). Assessment of high and low enterotoxin A producing Staphylococcus aureus strains on pork sausage. Int. J. Food Microbiol. 182–183, 44–50. doi: 10.1016/j.ijfoodmicro.2014.05.010
Zhao, L., Montville, T. J., and Schaffner, D. W. (2002). Time-to-detection, percent-growth-positive and maximum growth rate models for Clostridium botulinum 56A at multiple temperatures. Int. J. Food Microbiol. 77, 187–197.
Zhou, S. J., Liang, H., Zhu, H. M., Liu, C. H., Lin, X. Q., Huang, R., et al. (2014). Staphylococcus aureus contamination and risk evaluation in ready-to-eat meat products in Guangdong Province. Chin. J. Food Hyg. 26, 496–500. doi: 10.13590/j.cjfh.2014.05.021
Keywords: predictive microbiology, Staphylococcus aureus, Staphylococcal enterotoxins, time to detection, cooked chicken
Citation: Hu J, Lin L, Chen M and Yan W (2018) Modeling for Predicting the Time to Detection of Staphylococcal Enterotoxin A in Cooked Chicken Product. Front. Microbiol. 9:1536. doi: 10.3389/fmicb.2018.01536
Received: 02 February 2018; Accepted: 20 June 2018;
Published: 13 July 2018.
Edited by:
Qingli Dong, University of Shanghai for Science and Technology, ChinaReviewed by:
Huhu Wang, Nanjing Agricultural University, ChinaBeatrix Stessl, Veterinärmedizinische Universität Wien, Austria
Jun Wang, Qingdao Agricultural University, China
Copyright © 2018 Hu, Lin, Chen and Yan. This is an open-access article distributed under the terms of the Creative Commons Attribution License (CC BY). The use, distribution or reproduction in other forums is permitted, provided the original author(s) and the copyright owner(s) are credited and that the original publication in this journal is cited, in accordance with accepted academic practice. No use, distribution or reproduction is permitted which does not comply with these terms.
*Correspondence: Weiling Yan, eWFud2xpbmdAdG9tLmNvbQ==