 Shailendra P. Singh
 Beronda L. Montgomery
- 1MSU-DOE Plant Research Laboratory, Michigan State University, East Lansing, MI, USA
- 2Department of Biochemistry and Molecular Biology, Michigan State University, East Lansing, MI, USA
Filamentous cyanobacterium Fremyella diplosiphon is known to alter its pigmentation and morphology during complementary chromatic acclimation (CCA) to efficiently harvest available radiant energy for photosynthesis. F. diplosiphon cells are rectangular and filaments are longer under green light (GL), whereas smaller, spherical cells and short filaments are prevalent under red light (RL). Light regulation of bolA morphogene expression is correlated with photoregulation of cellular morphology in F. diplosiphon. Here, we investigate a role for quantitative regulation of cellular BolA protein levels in morphology determination. Overexpression of bolA in WT was associated with induction of RL-characteristic spherical morphology even when cultures were grown under GL. Overexpression of bolA in a ΔrcaE background, which lacks cyanobacteriochrome photosensor RcaE and accumulates lower levels of BolA than WT, partially reverted the cellular morphology of the strain to a WT-like state. Overexpression of BolA in WT and ΔrcaE backgrounds was associated with decreased cellular reactive oxygen species (ROS) levels and an increase in filament length under both GL and RL. Morphological defects and high ROS levels commonly observed in ΔrcaE could, thus, be in part due to low accumulation of BolA. Together, these findings support an emerging model for RcaE-dependent photoregulation of BolA in controlling the cellular morphology of F. diplosiphon during CCA.
Introduction
Cyanobacteria are important components of aquatic ecosystems where they perform ecologically important functions of photosynthesis and nitrogen fixation. In aquatic systems, both quality and quantity of light are known to differ at different depth levels (Postius et al., 2001), which can limit photosynthesis and nitrogen fixation. However, cyanobacteria have evolved peripheral light-harvesting structures called phycobilisomes (PBSs), which are attached to thylakoid membranes at the site of the photosystems, to efficiently harvest available photons (Shi et al., 2011; Gutu and Kehoe, 2012; Singh et al., 2015). PBSs are primarily composed of pigmented phycobiliproteins (PBPs), e.g., phycoerythrin (PE; λmax ∼565 nm), phycocyanin (PC; λmax ∼620 nm) and allophycocyanin (AP; λmax ∼650 nm), and largely non-pigmented linker proteins (Bogorad, 1975; Kehoe and Gutu, 2006; Singh et al., 2015). Some cyanobacteria have developed an ability to change the pigment and/or protein composition of rods of their PBSs in response to changes in the quality or predominant wavelength(s) of light in the environment, which allows cyanobacteria to sus tain photosynthesis and nitrogen fixation in prevailing light conditions (Campbell, 1996; Postius et al., 2001). The rods are primarily composed of PE under green light (GL), whereas PC constitute the rods of PBSs under red light (RL) in Fremyella diplosiphon (Gutu and Kehoe, 2012). This ecologically important phenomenon is known as complementary chromatic acclimation (CCA) and has been well characterized in the filamentous, freshwater cyanobacterium F. diplosiphon (Bennett and Bogorad, 1973; Kehoe and Gutu, 2006; Kehoe, 2010). CCA permits F. diplosiphon, also known as Tolypothrix sp. PCC 7601 (Yerrapragada et al., 2015), to tune photosynthesis to different light qualities by tuning the pigment composition of rods of PBSs (Campbell, 1996; Kehoe and Gutu, 2006; Gutu and Kehoe, 2012).
Complementary chromatic acclimation is controlled by a phytochrome-related cyanobacteriochrome RcaE which is known to sense the change in quality of light and promote GL- or RL-dependent abundance of PE or PC, respectively, in PBS rods (Kehoe and Grossman, 1996; Terauchi et al., 2004). RcaE possesses light-regulated kinase activity and mediates light-dependent activation or repression of transcription of PC or PE biosynthetic genes via its cognate response regulators (RR) RcaF and DNA-binding RcaC (Li et al., 2008; Bezy and Kehoe, 2010; Gutu and Kehoe, 2012; Hirose et al., 2013). RcaE has autokinase activity under RL and phosphorylates RcaF under these conditions, which in turn activates RcaC through phosphorylation. The phosphorylated form of RcaC activates transcription of PC biosynthetic genes; while simultaneously repressing transcription of PE biosynthetic genes under RL (Li et al., 2008; Bezy and Kehoe, 2010). In contrast, reduced kinase activity (Hirose et al., 2013) and/or phosphatase activity (Kehoe and Grossman, 1997) of RcaE under GL results in accumulation of RcaF and RcaC in unphosphorylated states, which results in transcriptional activation of PE biosynthetic genes due to de-repression, whereas PC biosynthetic genes are not expressed due to lack of accumulation of phosphorylated RcaC (Li et al., 2008; Bezy and Kehoe, 2010).
In addition to altering the pigment composition of PBSs, F. diplosiphon alters its cellular morphology and filament length during CCA to maximally utilize available resources (Montgomery, 2008). Rectangular cell shape and longer filaments are characteristics of morphological acclimation under GL, whereas spherical cell shape and shorter filaments are observed under RL (Bennett and Bogorad, 1973; Bogorad et al., 1983; Bordowitz and Montgomery, 2008). The molecular mechanism and ecological significance of light signaling-coupled alterations in pigmentation are well understood; however, the mechanism(s) and significance of morphological regulation that occurs during CCA are still emerging. One of the initial insights in this regard was the finding that photosensor RcaE controls the light-dependent regulation of F. diplosiphon morphology (Bordowitz and Montgomery, 2008). However, photoregulation of morphology was found to be largely independent of the photoregulation of pigmentation under GL and RL (Bordowitz and Montgomery, 2008; Bordowitz et al., 2010; Pattanaik et al., 2011). Recently, a correlation between RL-associated high levels of reactive oxygen species (ROS) and spherical morphology was established (Singh and Montgomery, 2012; Singh et al., 2013). GL-specific elongated cellular morphology has been proposed to provide greater cellular volume to support increased thylakoid membranes and light-harvesting complex capacity which would support efficient absorption of dim light and available GL photons in benthic environments (Montgomery, 2008). This would accommodate higher cellular amounts of PE, which is the sole GL-absorbing pigment (Campbell, 1996), and thus would allow maintenance of photosynthesis in benthic waters. Recent studies have supported this proposition, F. diplosiphon cells adopt a longer, rectangular shape in reduced light intensity and a spherical morphology in high light intensity, independent of whether the high intensity light is RL or GL (Pattanaik et al., 2012; Walters et al., 2013).
Recently, we conducted gene expression and gene function analyses in F. diplosiphon with an emphasis on the role of bolA and mreB morphogenes in the mechanistic bases of light-regulated morphological changes during CCA (Singh and Montgomery, 2014). Morphogene bolA was first identified in Escherichia coli by its ability to induce spherical morphology (Aldea et al., 1988). Stationary phase-dependent induction of spherical morphology was later shown to be associated with overexpression of bolA (Aldea et al., 1989). The expression of bolA is also upregulated in the presence of different stressors which are correlated with the induction of rod-to-spherical morphology changes of E. coli (Santos et al., 1999). The role of bolA in adaptation of bacterial systems to general stress has been explored in a recent review (Guinote et al., 2014).
BolA-dependent induction of spherical morphology in E. coli is known to be mediated, at least in part, by downregulation of transcription of the mreB gene through binding of BolA to the promoter region of mreB (Aldea et al., 1988, 1989; Santos et al., 1999; Freire et al., 2009). MreB is a bacterial actin-like ATPase, whose accumulation in bacterial cells is associated with rod-shape morphology and its absence with spherical cells (Cabeen and Jacobs-Wagner, 2007). The identification and functional characterization of BolA and MreB proteins in cyanobacteria and their role in maintaining cyanobacterial morphology have only recently begun to emerge (Hu et al., 2007; Gonzalez et al., 2010; Singh and Montgomery, 2014).
RcaE, which controls light-dependent regulation of cell shape (Bordowitz and Montgomery, 2008), was found to be required for normal WT expression of bolA (Singh and Montgomery, 2014). RL-dependent higher expression of bolA was correlated with lower expression of mreB; a converse relation was observed under GL (Singh and Montgomery, 2014). Lower expression of mreB under RL was proposed to be due to binding of accumulated BolA to the mreB promoter, which eventually results in spherical morphology due to decreased accumulation of MreB. In contrast, lower accumulation of BolA under GL permits higher expression of mreB which results in rod-shaped cell morphology due to higher accumulation of MreB (Singh and Montgomery, 2014).
To test whether RcaE-dependent regulation of cellular BolA protein abundance is a mechanism for photoregulation of cellular morphology, we generated antibodies against F. diplosiphon BolA and investigated whether known bolA expression patterns coincide with accumulation of BolA protein under GL and RL in F. diplosiphon. We also applied gene overexpression to probe whether elevated levels of BolA accumulation are correlated with induction of RL-characteristic spherical morphology independent of external light conditions and independent of the presence of functional RcaE to probe the molecular basis of morphological defects commonly observed in ΔrcaE null mutants.
Materials And Methods
Cyanobacterial Strains and Growth Conditions
The wild-type F. diplosiphon UTEX 481, hereafter UTEX 481; shortened-filament, wild-type pigmentation strain SF33 (Cobley et al., 1993), hereafter denoted SF33 WT; and RcaE-deficient mutant strain, i.e., ΔrcaE (Kehoe and Grossman, 1996), were used in this study. Strains were grown in BG-11 medium (Allen, 1968) containing 20 mM HEPES at pH 8.0 (hereafter BG-11/HEPES) in a GL growth chamber at an intensity of ∼15 μmol m-2 s-1 with continuous shaking at 175 rpm at 28°C. Exponentially growing cultures, which were diluted to an initial optical density of ∼0.2 at 750 nm (OD750), were then transferred to either GL or RL at an intensity of ∼15 μmol m-2 s-1 at 28°C with continuous shaking at 175 rpm. The sources of monochromatic GL and RL were those previously described (Bordowitz and Montgomery, 2008). The intensity of the light was measured with a LI-250A light meter (LI-COR, Lincoln, NE) equipped with a quantum sensor (model LI-190SA).
Overexpression of WT bolA Gene in WT and ΔrcaE Background Strains
The overexpression of bolA in WT and ΔrcaE background strains under the control of the native promoter of the apcA gene, which encodes the α-subunit of allophycocyanin (Capuano et al., 1991), was achieved using the pPL2.7GW shuttle vector (Bordowitz and Montgomery, 2008). The promoter sequence of apcA, hereafter apcAp, and coding sequence of bolA were amplified from the F. diplosiphon genome using primer sets apcAp_FP/apcAp_RP and bolA_FP/bolA_RP, respectively. All primer sequences used in this study are listed in Supplemental Table S1. The resulting PCR products for the 284 bp apcAp sequence and 272 bp bolA coding sequence were gel purified, and 70 ng of each product was mixed together for overlap PCR. A 1.5 μl aliquot of this mixture was used as a template in a new 50 μl overlap PCR reaction with primers apcAp_FP and bolA_RP to add the apcAp promoter to the bolA full-length gene. The 526 bp apcAp-bolA fusion PCR product was verified by sequencing. The verified fusion product was cloned into PCRTM8/GW/TOPO® vector (Invitrogen) according to the manufacturer’s protocol to produce entry vector PCRTM8/GW/TOPO-apcAp-bolA, and subsequently used to transform TOP10 chemically competent cells. Following selection of transformants in the presence of spectinomycin, PCRTM8/GW/TOPO-apcAp-bolA was isolated and thereafter recombined with pPL2.7GW (Bordowitz and Montgomery, 2008). All plasmids used or constructs made in this study are listed in Supplemental Table S2. The recombination was achieved by using the LR clonase II enzyme according to the manufacturer’s instruction (Invitrogen) to produce an expression vector pPL2.7GW-apcAp-bolA, which was used to transform DH5α cells. Transformants were selected in the presence of kanamycin. E. coli strains used in this study were grown overnight in liquid LB (Luria-Bertani) medium or on LB agar plates, i.e., LB solidified with the addition of 1.5% (w/v) agar, at 37°C. When indicated, antibiotics were added at the following concentration: spectinomycin at 100 μg/ml (w/v) or kanamycin at 50 μg/ml (w/v). pPL2.7GW-apcAp-bolA was transformed into WT and ΔrcaE strains via electroporation as described previously (Kehoe and Grossman, 1998) to obtain WT overexpression (OE) and ΔrcaE OE strains overexpressing bolA. Empty shuttle vector pPL2.7 (Chiang et al., 1992) was used during transformation as a positive control, whereas autoclaved double distilled water was used as a negative control. WT OE and ΔrcaE OE strains were grown in BG-11/HEPES medium supplemented with 3.5 and 6 μg/ml concentration of kanamycin, respectively.
Cell Density Measurements and Spectral Scans
Growth of different strains of F. diplosiphon was monitored based on cell density estimated based on optical density at 750 nm (OD750) using a SpectraMax M2 microplate reader (Molecular Devices, Sunnyvale, CA, USA). Whole-cell spectral scans were obtained between 400 and 800 nm after adjusting the OD800 of cell cultures to ∼0.1 using a SpectraMax M2 microplate reader.
Chlorophyll a (chl a) and Phycobiliprotein Quantification Assays
Chlorophyll a (chl a) was extracted from 1 ml of culture after 7 days of growth and quantified using a previously reported method (De Marsac and Houmard, 1988) with modifications as previously detailed (Singh and Montgomery, 2011). PBPs were extracted from 1 ml of cell culture after 7 days of growth as described (Kahn et al., 1997) with modifications previously detailed (Singh and Montgomery, 2011), except that the extraction was conducted for 1 h. PBP levels were calculated using equations from De Marsac and Houmard (1988).
Reactive Oxygen Species (ROS) Quantification Assay
Cellular levels of ROS were determined using the fluorescent dye 2′,7′-dichlorodihydrofluorescein diacetate (DCFH-DA; EMD chemicals) as previously described (Singh and Montgomery, 2012). Immediately after sample collection, the cells were incubated with 10 μM DCFH-DA (final concentration) in the dark for 1 h at room temperature with continuous shaking, and thereafter, DCF fluorescence was measured at 520 nm after excitation at 485 nm using a SpectraMax M2 microplate reader. Growth medium mixed with DCFH-DA dye acted as a negative control. Fluorescence from cellular components at 520 nm after excitation at 485 nm was measured using samples containing only cells and lacking DCFH-DA dye.
Confocal Microscopy-based Morphological Analyses
Fremyella diplosiphon cultures were inoculated at an OD750 of ∼0.2 and grown under GL and RL. After 3 days of growth, slides of live, immobilized F. diplosiphon cells were prepared as previously described (Bordowitz and Montgomery, 2008). Images of cells were acquired with an inverted Axiovert 200 Zeiss LSM 510 Meta confocal laser scanning microscope (Carl Zeiss MicroImaging, Thornwood, NY, USA) using differential interference contrast (DIC) optics and fluorescence excitation and emission filters as described earlier (Bordowitz and Montgomery, 2008, 2010). The length and width of cells (n = 50) and filament length (n = 30–50) were measured using LSM FCS Zeiss 510 Meta AIM imaging software.
Production of anti-BolA Antibodies and Affinity Purification
Purified F. diplosiphon (His)6-BolA protein was obtained as described previously (Singh and Montgomery, 2014). Purified protein (2.5 mg), which had been heated at 90°C for 5 min in 1X SDS sample buffer containing 5% (v/v) β-mercaptoethanol (i.e., reducing conditions), was separated on a 1-mm thick 15% (w/v) SDS-polyacrylamide gel and stained with Coomassie stain. Following staining, the BolA protein band was sliced from the gel and destained overnight. Thereafter, the (His)6-BolA-containing gel slice was frozen in liquid nitrogen and kept at -80°C until submitted to Pacific Immunology (Ramona, CA, USA) for the production of anti-(His)6-BolA antibodies in New Zealand white rabbits. The crude antiserum obtained was tested against purified (His)6-BolA using western blot analysis, and further affinity purification was performed against purified (His)6-BolA protein to obtain highly specific anti-BolA antibodies. Briefly, ∼300 μg of purified (His)6-BolA protein was run on a 15% (w/v) SDS-polyacrylamide gel and transferred to PVDF membrane by electro-blotting (see details for transfer during western blot analyses below). The transfer was evaluated by Ponceau S staining, and the portion of the membrane containing the BolA protein band was extracted. This membrane slice containing (His)6-BolA was incubated for 1 h at room temperature in TBS (20 mM Tris-HCl, pH 7.5, 150 mM NaCl) containing 0.1% (v/v) Tween 20 and 5% (w/v) BSA. The blot was then incubated overnight at 4°C on a rocking platform with crude antiserum, the latter of which was previously saturated with BSA (12 mg/ml; w/v) at 37°C for 4 h. Following this incubation, the blot was washed 3 × 15 min with TBS/0.1% Tween 20 followed by one additional washing with TBS. After washing, the blot was cut into small pieces and adsorbed antibodies eluted with 700 μl of 0.2 M HCl-glycine, pH 2.2, at room temperature for 15 min. Thereafter, the pH of the eluate was adjusted to pH 7 by adding 300 μl of 1M K2HPO4. The neutralized eluate was dialyzed overnight at 4°C against TBS using 10 KDa cut-off Snakeskin dialysis tubing (Thermo Scientific). After dialysis, 5% BSA was added to the eluted anti-BolA antibodies and aliquots were kept at -20°C for further use.
Total Protein Extraction and Western Blot Analyses
Liquid cultures (50 ml) of F. diplosiphon were started at an OD750 of 0.2 and grown under GL or RL growth conditions for 7 days to an OD750 of ∼0.7–0.9. Cells were flash chilled to ∼4°C in a flask by submersion in liquid nitrogen, then pelleted by centrifugation at 5000 g for 10 min at 4°C. Cell pellets were resuspended in 2 ml of CellLyticTM B cell Lysis reagent supplemented with 1 × SIGMAFASTTM protease inhibitor cocktail (Sigma–Aldrich). Cells were lysed by incubating the suspension at room temperature for 20 min with regular vortexing. After cell lysis, the extract was centrifuged at 16000 g for 10 min at 4°C to pellet the insoluble material, and supernatant was transferred to a new Eppendorf tube. Total protein concentrations of different samples were determined using a PierceTM BCA protein assay kit (Thermo Scientific). Proteins, which had been heated at 90°C for 5 min in 1X SDS sample buffer containing 5% (v/v) β-mercaptoethanol, were separated on a 1-mm thick 15% (w/v) reductive SDS-polyacrylamide gel and transferred onto Immobilon®-P polyvinylidene difluoride membrane (pore size 0.45 μm; Millipore, Billercia, MA, USA) via electro-blotting using a Trans Blot Turbo transfer system (Bio-Rad, Hercules, CA, USA) at 20 V, 1 A for 10 min at 24°C according to manufacturer’s instructions. To detect BolA, the membrane was incubated in a blocking solution (TBS/0.5% Tween 20/3% BSA) for 1 h at room temperature. Following blocking, immunoblot was incubated overnight at 4°C with affinity purified anti-BolA polyclonal antibodies in blocking solution (1:1000 dilution). After washing the blot 4 × 10 min with washing buffer (TBS/0.1% Tween 20), it was incubated for 3 h at room temperature with anti-rabbit secondary antibodies conjugated to horseradish peroxidase (Pierce Biotechnology, Inc., Rockford, IL, USA) that was diluted (1:10,000) in blocking solution. Following 4 × 10 min washes with washing buffer, signal was detected using WesternBrightTM ECL western blotting detection kit (Advansta, Menlo Park, CA, USA) on a Molecular Imager VersaDoc MP 4000 imaging system (Bio-Rad, Hercules, CA, USA).
Biofilm Formation Assay
Biofilm formation by F. diplosiphon WT and WT OE strains under GL and RL was assessed according to the method described previously with minor modifications (O’Toole and Kolter, 1998). Briefly, 1-ml aliquots of actively growing cultures of WT and WT OE strains, which were adjusted to an OD750 of 0.5 in fresh medium, were transferred in triplicate into wells of a Greiner Bio-One CELLSTAR® 24-well polystyrene cell culture plate (BioExpress, Kaysville, UT, USA). BG11 medium without cells was added in triplicate as a control. Plates were transferred to GL and RL growth conditions with gentle shaking. On the fourth day after transfer, medium was removed from each well, wells were washed three times with autoclaved double-distilled water to remove unattached cells, and plates were air-dried for 30 min. Biofilm was stained for 30 min with 0.25% (w/v) crystal violet in water, after which the stain was removed and wells were washed three times with water. The stain in attached biofilms was extracted in 500 μl of 100% ethanol for 15 min, and OD595 measured to quantify the biofilm formation.
Statistics
All experiments were conducted with three replicates and results are presented as the mean value (±SD). Data were analyzed by a one-way ANOVA test using OpenStat statistical software [version 10.01.08; (Miller, 2013)]. Once a significant difference was detected, post hoc multiple comparisons were made using the Tukey test. The significance level was set at 0.05 for all statistical analyses.
Results
BolA Levels are Regulated Transcriptionally in an RcaE-dependent Manner
Prior analyses indicated that photoregulation of bolA mRNA levels is inversely correlated with accumulation of bacterial-actin encoding mreB mRNA levels, which is associated with light-dependent regulation of cellular morphology in F. diplosiphon (Singh and Montgomery, 2014). We generated antibodies against F. diplosiphon BolA and examined accumulation of BolA under GL and RL in different strains of F. diplosiphon in order to investigate whether bolA mRNA levels reflect BolA protein accumulation. In accordance with previous observations for bolA mRNA accumulation under GL and RL in WT (Singh and Montgomery, 2014), BolA protein was found to accumulate to higher levels in cells under RL than in GL (Figure 1A). FdBolA is present as both a monomer and dimer, as previously observed for BolA (Couturier et al., 2014). The monomeric form has been reported as a glutathionylated form, the dimeric form contains a disulfide bridge, and the monomer:dimer ratio can change during incubation or storage (Couturier et al., 2014). We also examined levels of BolA under GL and RL in ΔbolA and ΔrcaE strains, which previously were found to have lower accumulation of bolA mRNA relative to WT (Singh and Montgomery, 2014). Both ΔbolA and ΔrcaE strains were found to accumulate low levels of BolA protein under GL and RL in comparison to WT (Figure 1). BolA accumulation thus appears to be largely regulated transcriptionally (Figure 1; Singh and Montgomery, 2014). Furthermore, functional RcaE promotes light-dependent BolA accumulation under GL and RL, indicating that RcaE-dependent higher expression of bolA under RL results in higher accumulation of BolA protein.
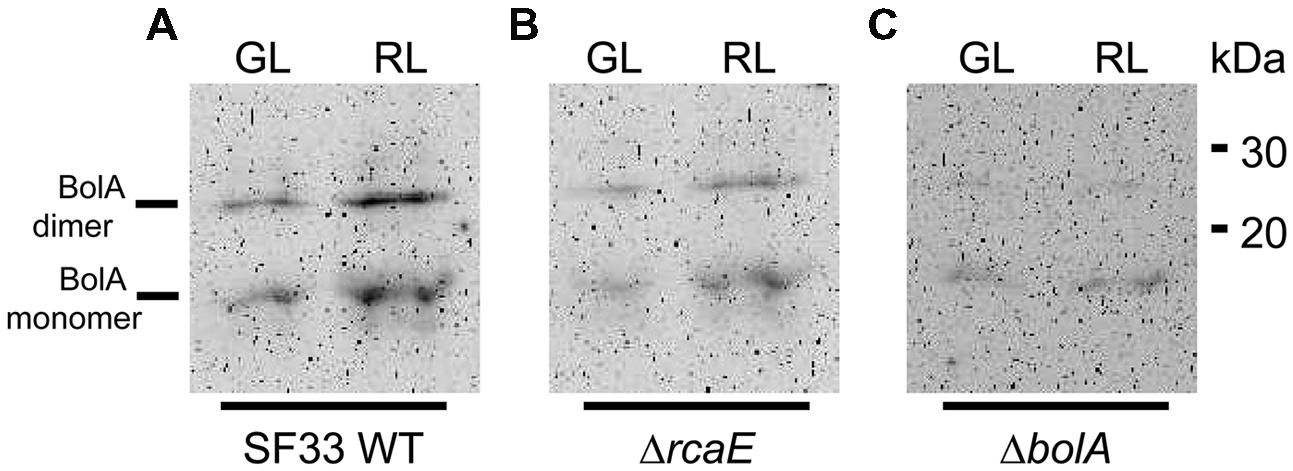
FIGURE 1. Immunoblot analyses of BolA accumulation in Fremyella diplosiphon strains. BolA accumulation in (A) WT, (B) ΔrcaE, and (C) ΔbolA strains of F. diplosiphon under green light (GL) or red light (RL). 150 μg of total protein extract from different strains of F. diplosiphon were separated on 15% SDS-PAGE. After blotting, BolA was detected using affinity-purified anti-BolA antibodies. Molecular mass in kilodalton (kDa) is indicated to the right. BolA monomer (∼11 kDa) and putative dimer (∼22 kDa) are marked to the left.
BolA Overaccumulation Induces Spherical Morphology and Long Filaments Independent of the External Light Conditions
To probe the specific role of BolA in photoregulation of morphology during CCA by altering bolA copy number, we overexpressed bolA in F. diplosiphon. We first attempted to overexpress bolA under the control of its endogenous promoter (i.e., npbolA) in WT; however, an npbolA-overexpressing (OE) strain was found to accumulate lower levels of BolA compared to the WT strain (Supplemental Figure S1). Therefore, we overexpressed bolA under the control of the promoter sequence of the apcA gene, which is known to be expressed equally under GL and RL and at relatively high levels in cells (Oelmüller et al., 1988; Capuano et al., 1991). In comparison to the WT strain that was transformed with an empty vector control (hereafter designated WT) and for which we observed more monomer than dimer, the WT strain overexpressing bolA gene under the control of the apcA promoter (hereafter designated WT OE) accumulated higher levels of BolA than WT under GL and RL (Figure 2A). The overexpression of bolA resulted in induction of a RL-associated spherical morphology of cells in the WT OE strain under both GL and RL, whereas cells of the WT strain possessed WT-characteristic rectangular shape under GL and spherical morphology under RL which was similar to that previously reported for F. diplosiphon (Figure 2B; Bennett and Bogorad, 1973; Bordowitz and Montgomery, 2008). Similar to previous reports, decreased cell length and no significant difference between length and width of the cells were observed under RL, whereas the length of cells was greater than width under GL, which corresponded to a rectangular morphology of WT cells (Figure 2C; Bordowitz and Montgomery, 2008; Singh and Montgomery, 2012). Higher accumulation of BolA in the WT OE strain was associated with a decrease in the length of cells, and no significant difference between length and width of cells was observed under GL or RL (Figure 2C). In addition to an effect on cell shape, higher BolA accumulation in the WT OE strain unexpectedly resulted in an increase in filament length under both light conditions, whereas the filament length of WT under GL and RL was comparable to previous observations (Figure 3; Bordowitz and Montgomery, 2008).
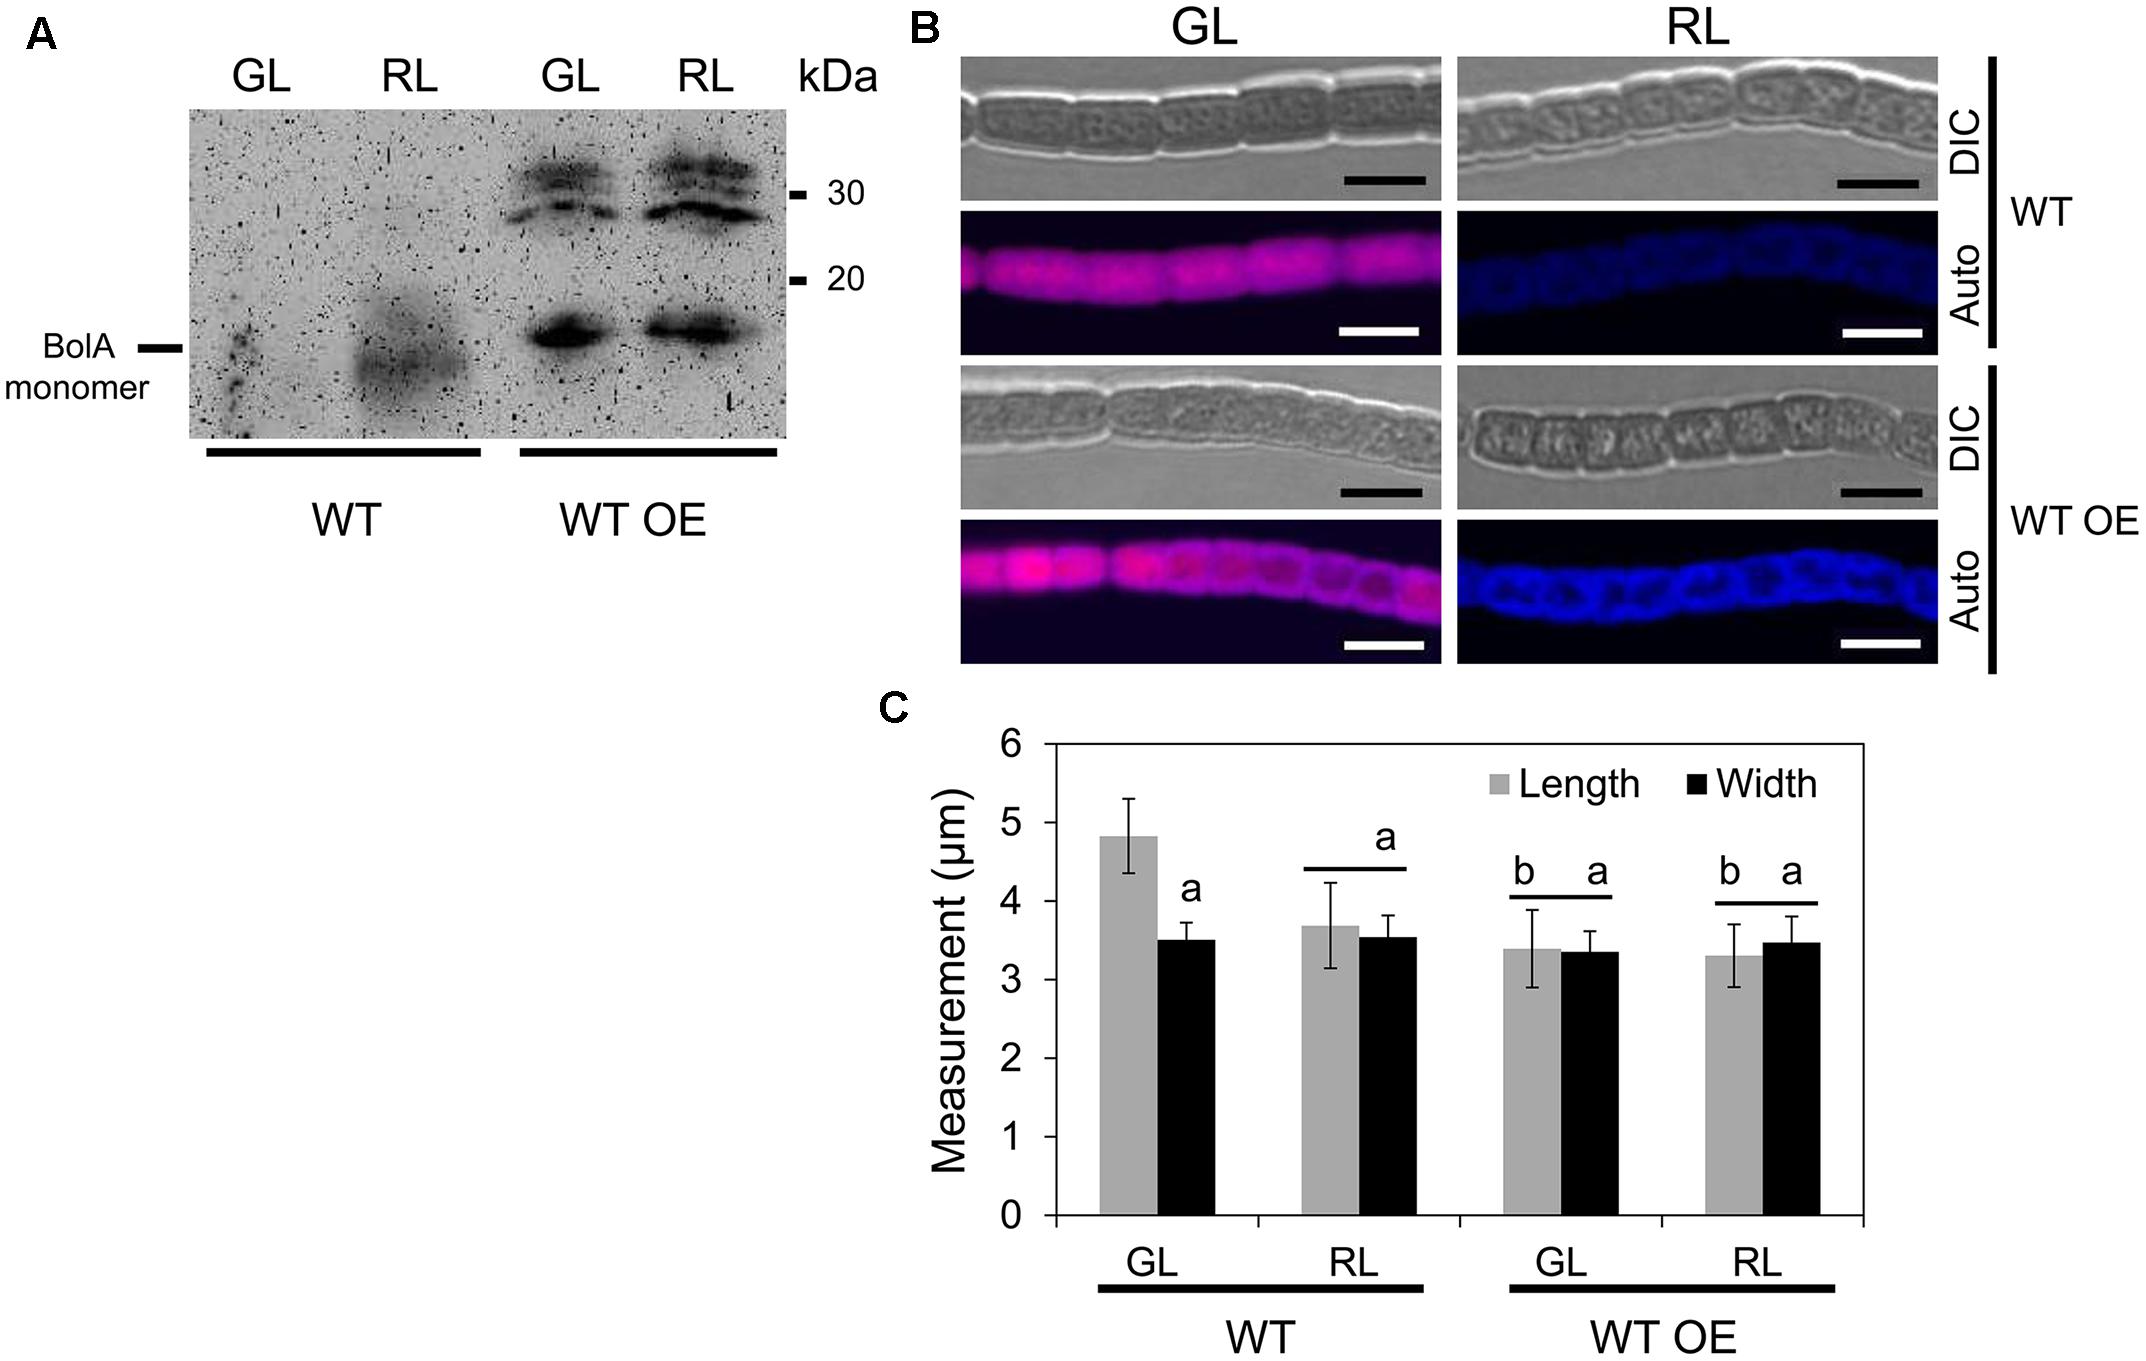
FIGURE 2. Immunoblot analysis of BolA accumulation and confocal laser scanning microscopy analyses of the cellular morphology of F. diplosiphon wild-type (WT) and WT strain overexpressing bolA (WT OE) grown under green light (GL) or red light (RL). (A) 150 μg of total protein extract from different strains of F. diplosiphon grown under GL or RL were separated on 15% SDS-PAGE. After blotting, BolA was detected using affinity-purified anti-BolA antibodies. Molecular mass in kilodalton (kDa) is indicated to the right. (B) Representative optical slices from a Z-series of differential interference contrast (DIC) images and corresponding maximum intensity projection PBP autofluorescence (auto) images of WT and WT OE strains grown under GL or RL for 72 h. Images were acquired using a 40×oil immersion objective with 2× zoom setting. Bars, 5 μm. (C) Cell length and width measurements of F. diplosiphon WT and WT OE strains grown under GL or RL for 72 h. Identical letters over bars represent a homogenous mean group (P > 0.05), whereas line over bars indicate no significant difference between the length and width of cells (P > 0.05) for a particular condition. No symbol over the bar indicates a significant difference (P < 0.05) from others.
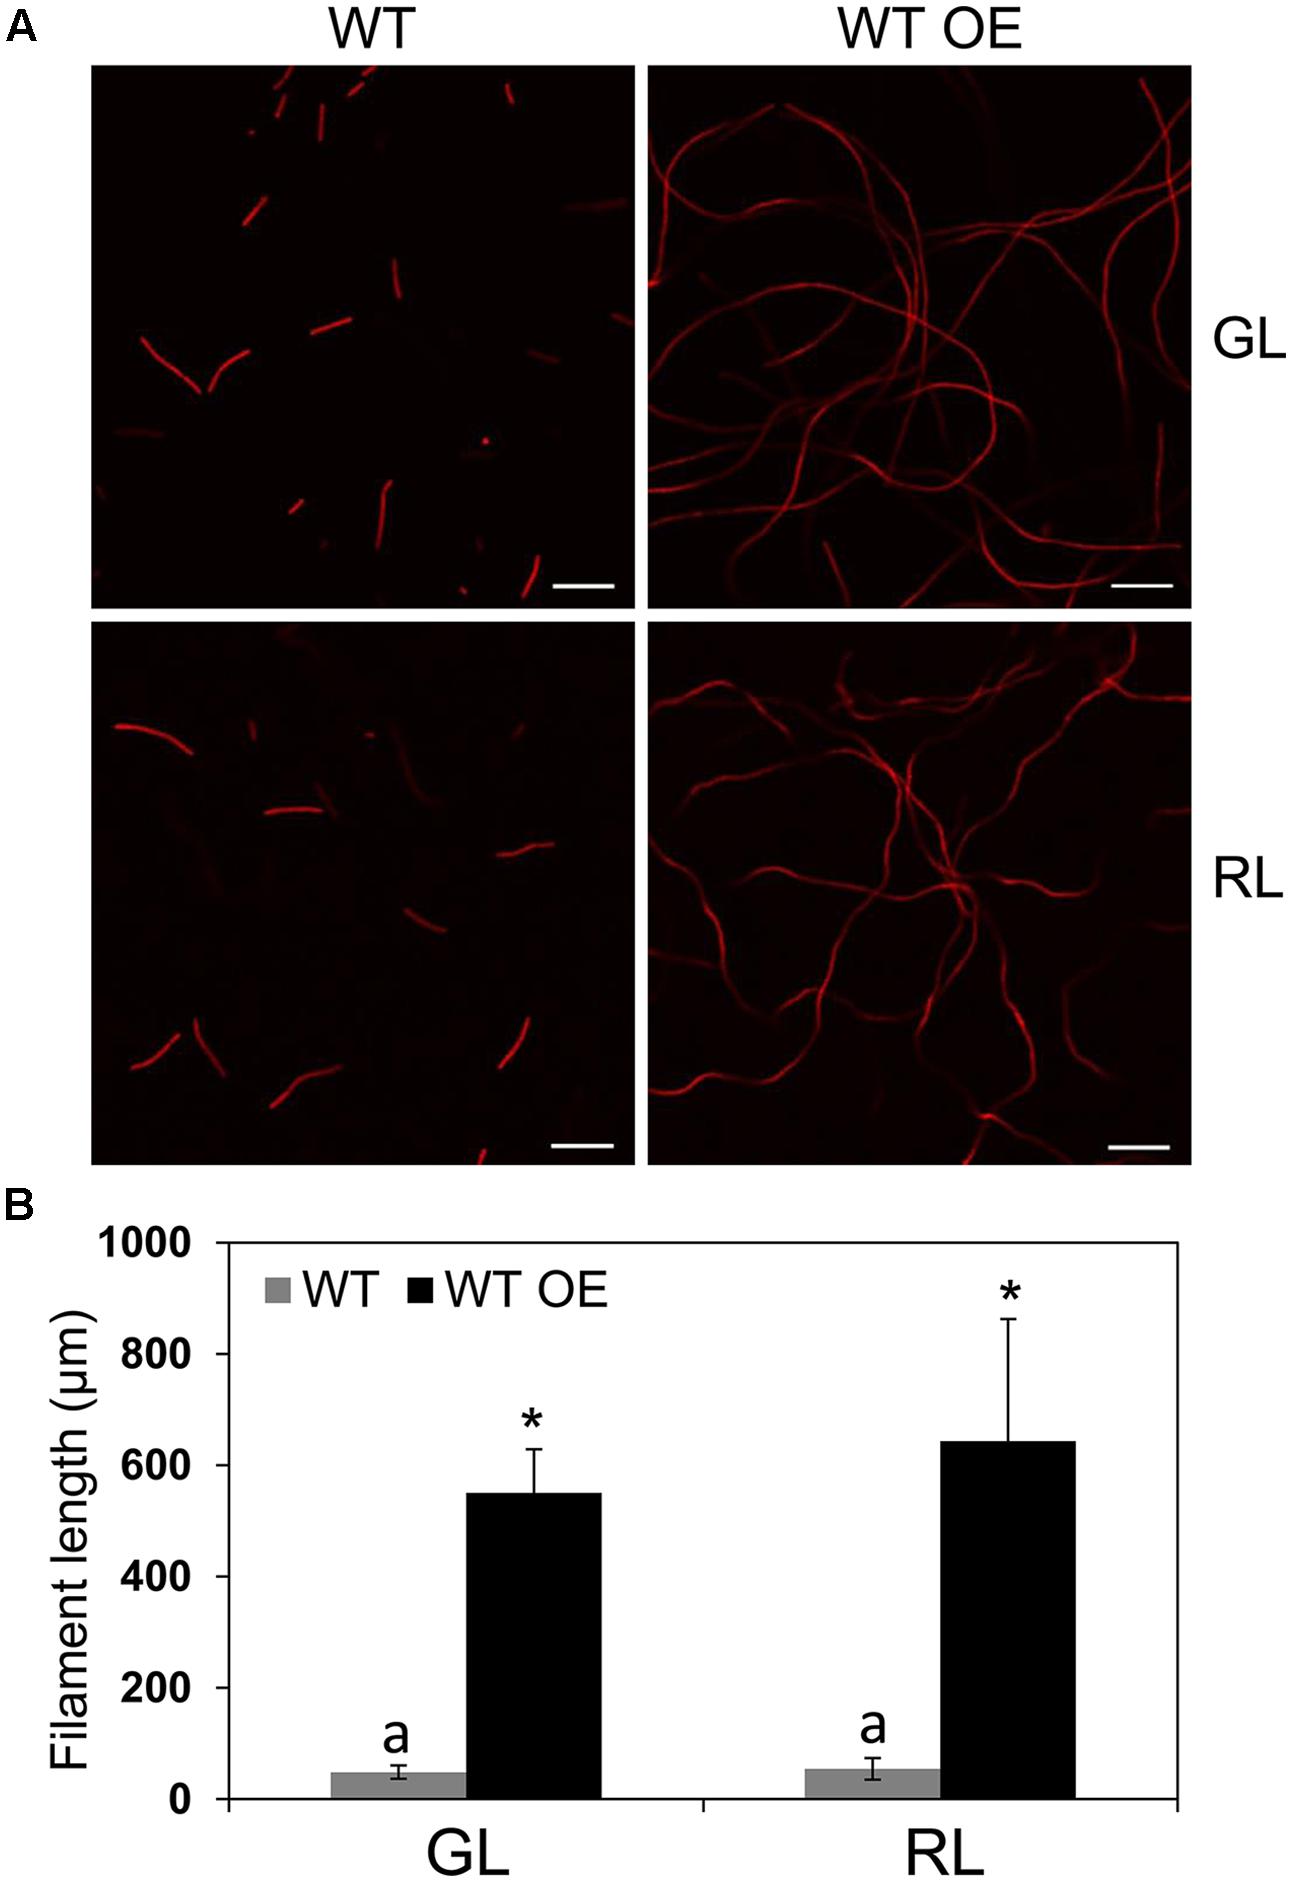
FIGURE 3. Confocal laser scanning microscopy analyses of filament morphology of F. diplosiphon wild-type (WT) and WT strain overexpressing bolA (WT OE) grown under GL or RL. (A) Representative optical slices from a Z-series of chlorophyll autofluorescence images of WT and WT OE strains grown under GL and RL for 72 h. Images were acquired using a 10× objective with 2× zoom setting. Bars, 50 μm. (B) Filament length measurements of WT and WT OE strains grown under GL or RL for 72 h. Identical letters over bars represent a homogeneous mean group (P > 0.05), whereas asterisks indicate a significant difference (P < 0.05) from WT.
BolA Overaccumulation Reduces ROS Accumulation
Removal of all but a few copies of bolA in a partially segregated ΔbolA strain (a complete null was lethal; Singh and Montgomery, 2014) resulted in significantly higher levels of ROS under GL and RL, which suggested an involvement of BolA in controlling intracellular ROS levels (Singh and Montgomery, 2014). Notably, a higher accumulation of BolA in the WT OE strain was associated with significantly decreased levels of ROS under GL and RL in comparison to WT (Figure 4). In WT, ROS levels were higher under RL compared to GL (Figure 4), as reported earlier (Singh and Montgomery, 2012; Singh et al., 2013).
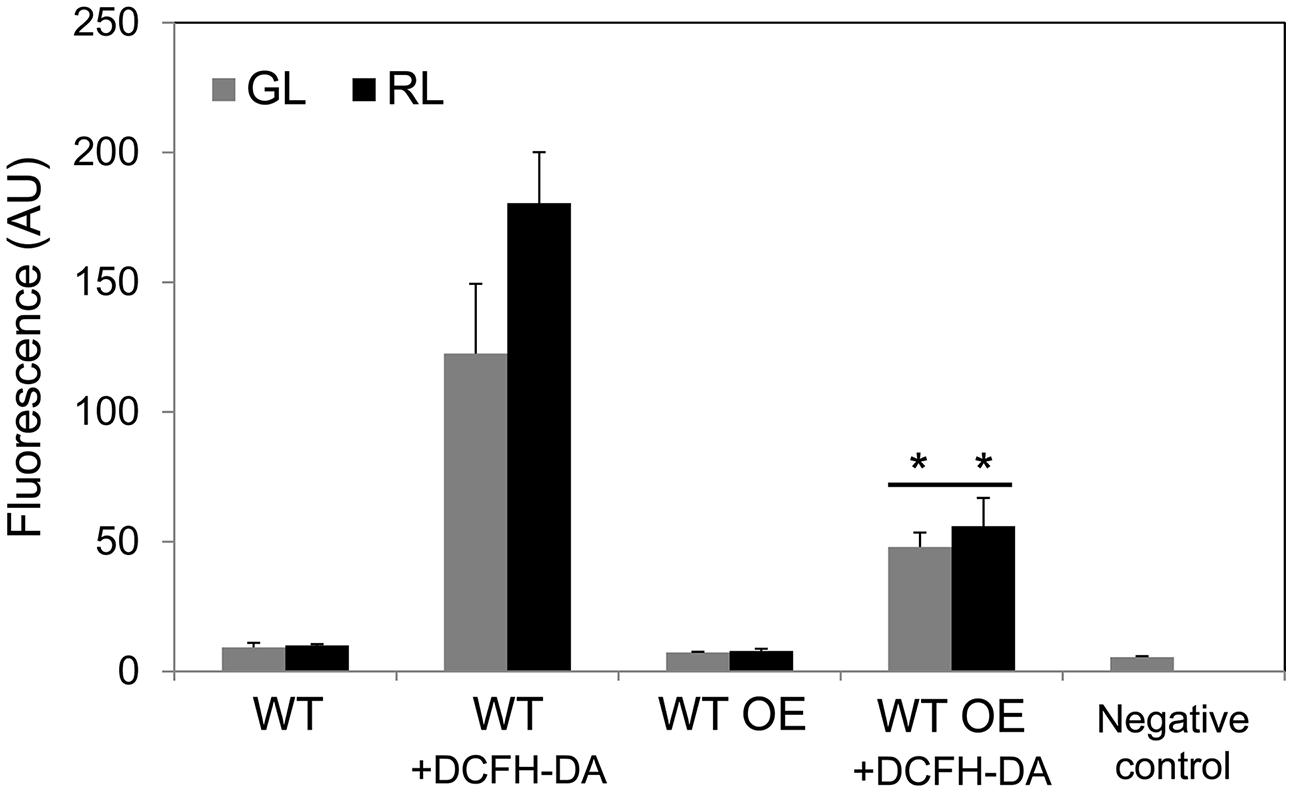
FIGURE 4. Reactive oxygen species (ROS) accumulation in F. diplosiphon wild-type (WT) and WT strain overexpressing bolA (WT OE) grown under GL or RL. Cellular component-associated fluorescence at 520 nm or ROS-dependent dichlorodihydrofluorescein (DCF) fluorescence at 520 nm in arbitrary units (AU) after 72 h of growth of cells with DCFH-DA dye added (+DCFH-DA) under GL or RL. The negative control represents fluorescence originating from BG-11 medium + ROS-sensitive dye DCFH-DA without cells added. Asterisks indicate significant difference (P < 0.05) from WT counterpart grown under GL or RL, whereas line over bars indicate no significant difference (P > 0.05) between GL- and RL- grown samples of a particular strain.
BolA Overexpression does not Induce Biofilm Formation in Filamentous F. diplosiphon
Overexpression of native bolA or bolA from distantly related organisms, including F. diplosiphon, was found to induce an increased level of biofilm formation and spherical morphology in E. coli (Vieira et al., 2004; Freire et al., 2009; Khona et al., 2013; Singh and Montgomery, 2014). These observations suggested that BolA function is conserved and prompted us to examine whether BolA accumulation in F. diplosiphon is associated with an increased level of biofilm formation. However, we found that a higher level of BolA accumulation in the WT OE strain was correlated with a decreased level of biofilm formation in comparison to the WT strain under both GL and RL (Figure 5), distinct from its overexpression in a unicellular E. coli strain (Singh and Montgomery, 2014). Noticeably, the longer filaments of WT OE strain predominantly collected at the surface of growth medium in comparison to the WT strain where a comparatively higher proportion of filaments were attached to the bottom of the plate. This difference was associated with an apparent significantly higher level of biofilm formation in WT strain than in WT OE (Figure 5).
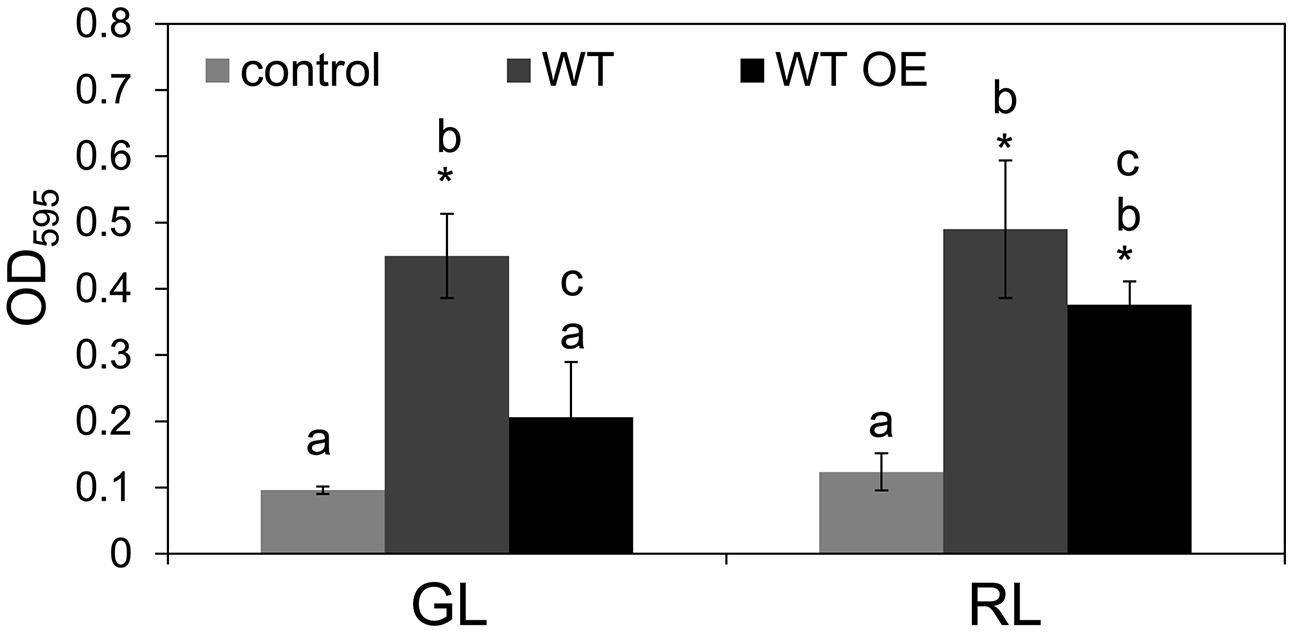
FIGURE 5. Biofilm development in F. diplosiphon wild-type (WT) and WT strain overexpressing bolA (WT OE) under GL and RL growth conditions. Biofilm formation was measured as optical density at 595 nm (OD595) after staining with crystal violet. Bars represent average (±SD) from three independent biological replicates. Asterisks indicate significant difference (P < 0.05) from control samples, whereas identical letters over bars represent homogenous mean groups (P > 0.05).
BolA Overaccumulation in WT has Minor Impacts on Growth or Pigmentation during CCA
We also conducted whole-cell spectral scans of WT and WT OE strains to test whether higher accumulation of BolA in the WT OE strain has any effect on growth or the CCA response of this strain. The WT OE strain accumulated GL- and RL-dependent PBPs PE and PC, respectively, similar to the WT strain under identical growth conditions (Supplemental Figure S2A). These results suggested that there was no alteration in the CCA response of the WT OE strain due to higher accumulation of BolA. This observation is in accordance with there being no significant impact on CCA related to a decreased gene dosage of bolA in the ΔbolA strain (Singh and Montgomery, 2014), which accumulates low levels of BolA under GL and RL (Figure 1). In comparison to WT, a higher accumulation of BolA in the WT OE strain did not impose any major quantitative effect on pigment accumulation under GL and RL. However, the WT OE strain accumulated a higher concentration of PE under GL compared to the WT (Supplemental Figure S3). No major effect of increased levels of BolA accumulation was seen on the growth of WT OE strain. However, the WT OE strain registered moderately increased growth under GL in comparison to WT after few days of growth estimation (Supplemental Figure S2B).
BolA Overexpression in ΔrcaE Reverts Phenotypic Defects
Observed low levels of bolA transcript and BolA accumulation under GL and RL in the ΔrcaE strain suggested that part of the morphological defects and high ROS levels commonly observed in ΔrcaE relative to WT could be associated with low accumulation of BolA in the absence of RcaE (Bordowitz and Montgomery, 2008; Singh and Montgomery, 2012, 2014). Our experimental attempt to overexpress the F. diplosiphon bolA gene in WT background strain under the control of its native promoter sequence resulted in a WT-npbolA strain with decreased accumulation of BolA in comparison to the WT (Supplemental Figure S1). We, thus, assessed whether this WT-npbolA strain exhibited an altered morphology associated with reduced BolA levels similar to ΔrcaE. Indeed, reduced BolA accumulation in this strain was associated with altered cellular morphology (Supplemental Figure S4), which was comparable to the known cellular morphology of the ΔrcaE strain that also exhibits reduced BolA levels (Bordowitz and Montgomery, 2008). To further probe the association of BolA accumulation in a ΔrcaE background with observed cellular morphology, we overexpressed bolA in the ΔrcaE null mutant (hereafter designated ΔrcaE OE). In comparison to ΔrcaE, the ΔrcaE OE strain accumulated higher levels of BolA under GL and RL (Figure 6A). Cells of the ΔrcaE null mutant are characterized by comparatively larger size and round shape morphology than WT under both GL and RL, which is apparently caused by an increase in width of ΔrcaE cells (Bordowitz and Montgomery, 2008; Singh and Montgomery, 2012). Notably, a higher accumulation of BolA under GL and RL in ΔrcaE OE strain was found to be associated with altered cellular morphology relative to the parent strain (Figure 6B). Increased levels of BolA in this ΔrcaE OE strain under GL was associated with a significant increase in length and a decrease in width of cells, which ultimately resulted in cells more rectangular in morphology than parental ΔrcaE cells (Figures 6B,C). The more rectangular morphology of ΔrcaE OE cells was much more similar, though not identical, to the known GL-specific cellular morphology of WT (compare Figures 2B and 6B; Bordowitz and Montgomery, 2008; Singh and Montgomery, 2012). Higher accumulation of BolA in the ΔrcaE OE strain under RL was associated with significant decreases in length and width of cells in comparison to the RL-grown ΔrcaE strain (Figure 6C). No major difference was observed between length and width of cells under RL which resulted in cells that were still spherical though smaller in ΔrcaE OE than in ΔrcaE (Figures 6B,C). The higher accumulation of BolA in ΔrcaE OE strain under GL and RL was also associated with a significant increase in the length of filaments, which was similar to the observation made for the WT OE strain (Figure 7). However, a homogenous population of longer ΔrcaE OE filaments was observed under GL in comparison to the RL-grown cultures where a comparatively heterogeneous population of short and long filaments was observed (Figure 7A). A percentage distribution analysis of filaments of RL-grown ΔrcaE and ΔrcaE OE strains demonstrated that filaments longer than 80 μm were only observed in ΔrcaE OE strain (Figure 7C).
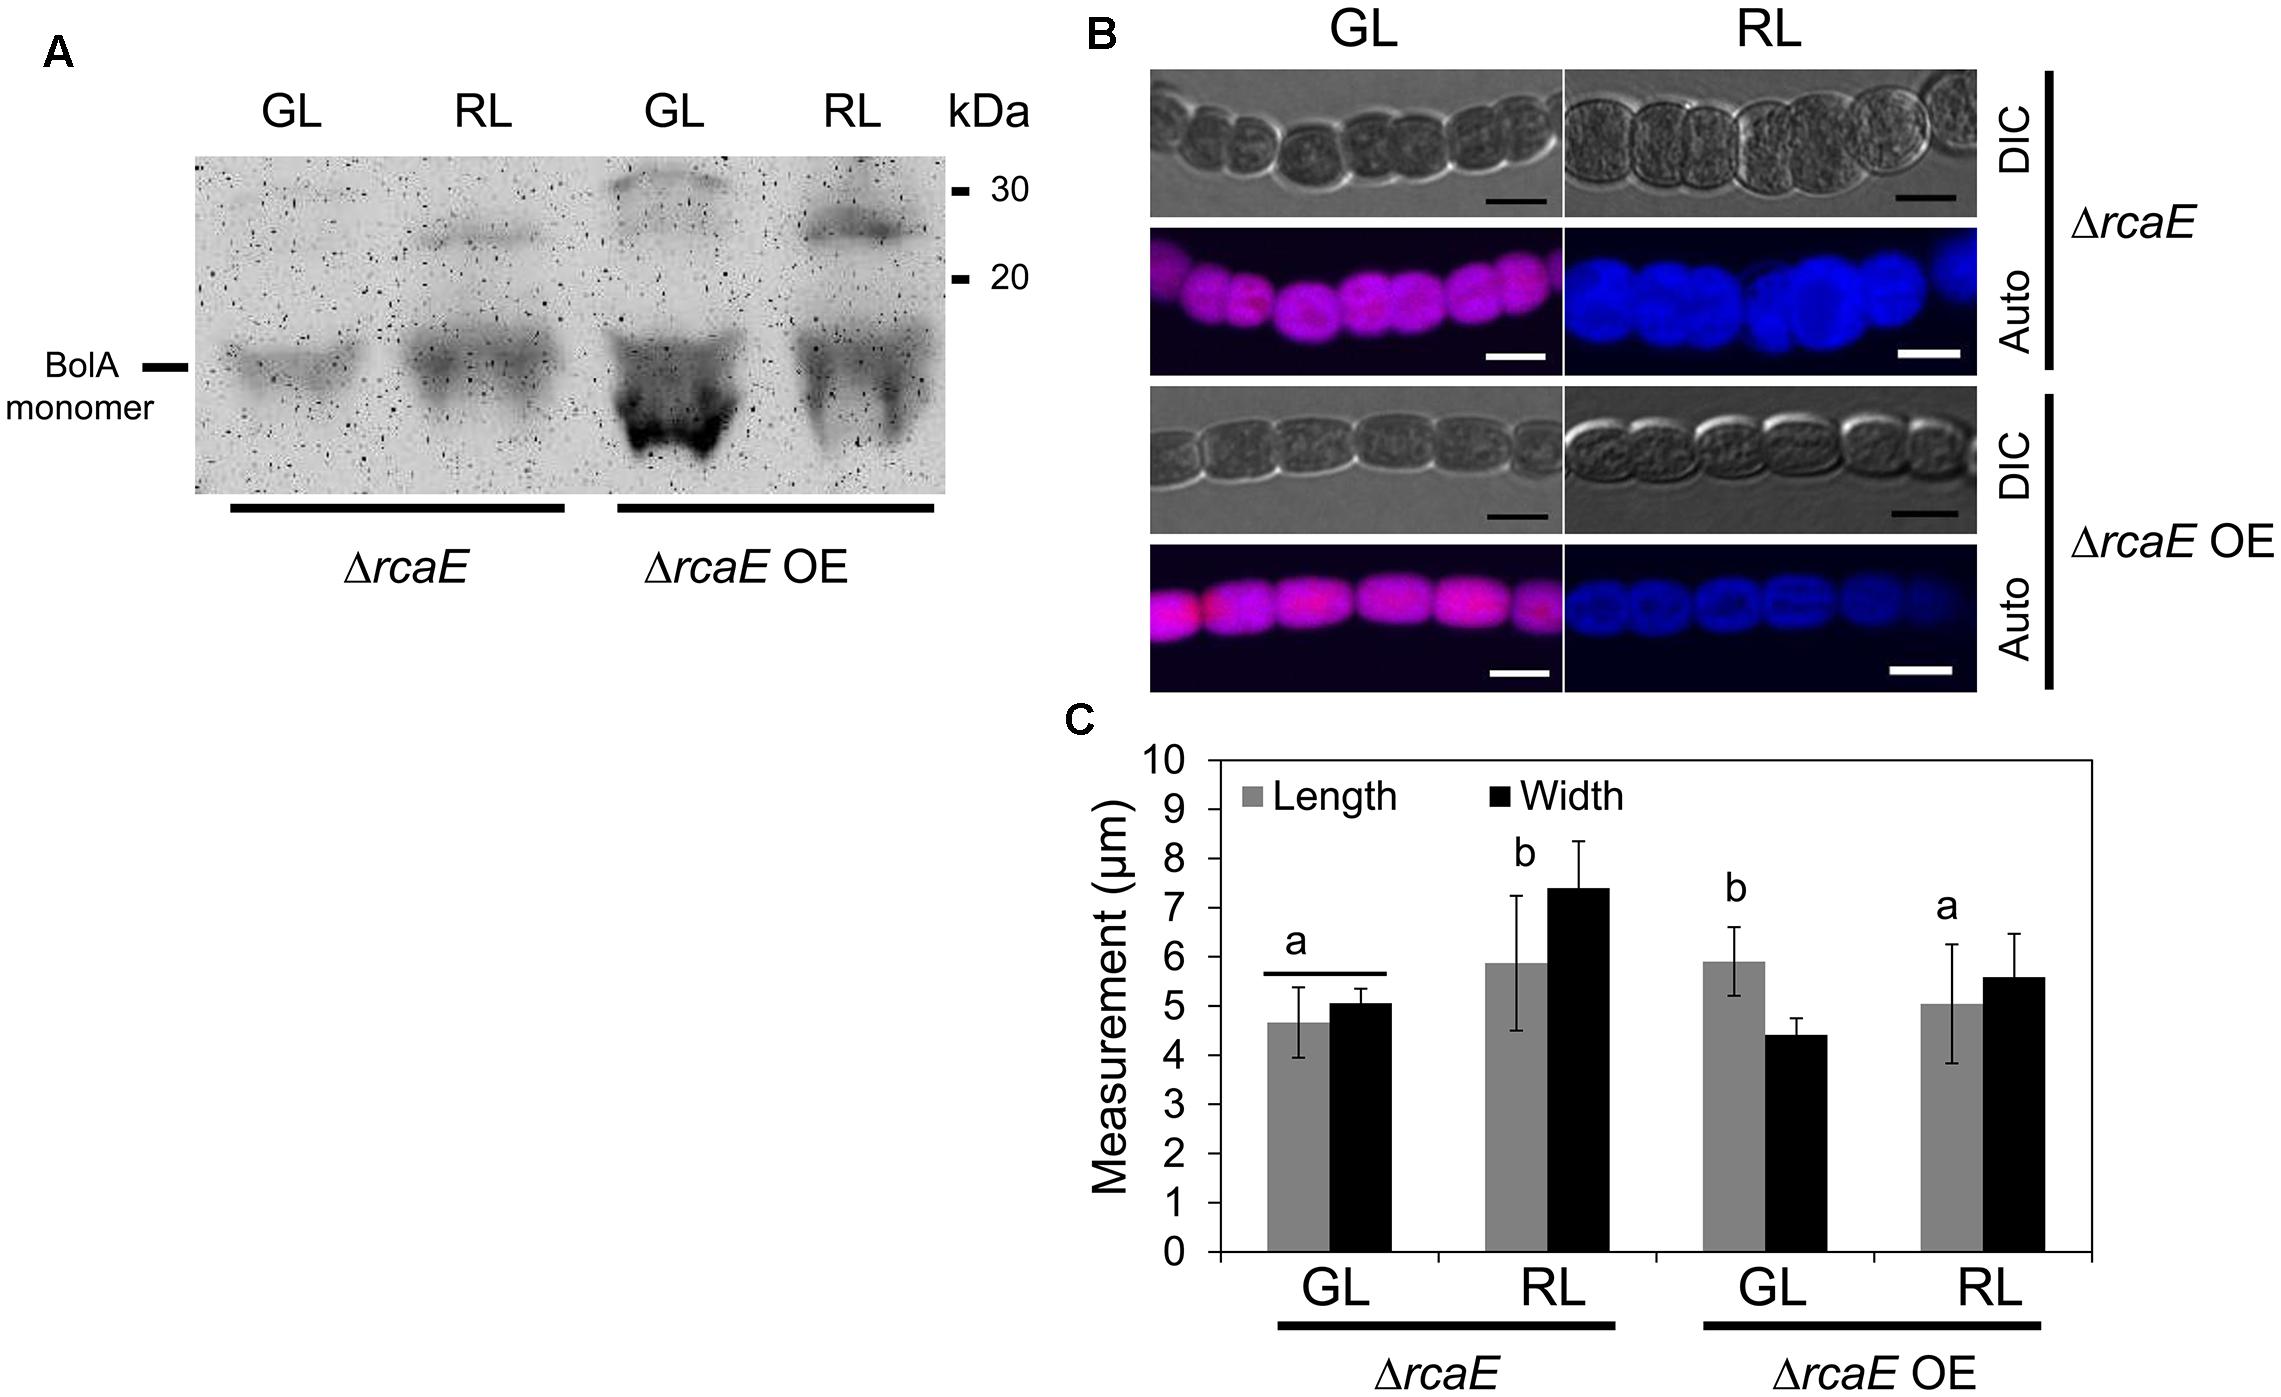
FIGURE 6. Immunoblot analysis of BolA accumulation and confocal laser scanning microscopy analyses of the cellular morphology of F. diplosiphon ΔrcaE and ΔrcaE strain overexpressing bolA (ΔrcaE OE) grown under GL or RL. (A) 300 μg of total protein extract from different strains of F. diplosiphon grown under GL or RL was separated on 15% SDS-PAGE. After blotting, BolA was detected using affinity-purified anti-BolA antibodies. Molecular mass in kilodalton (kDa) is indicated to the right. (B) Representative optical slices from a Z-series of DIC images and corresponding maximum intensity projection PBP autofluorescence (auto) images of ΔrcaE and ΔrcaE OE strains grown under GL or RL for 72 h. Images were acquired using a 40× oil immersion objective with 2× zoom setting. Bars, 5 μm. (C) Cell length and width measurement of F. diplosiphonΔrcaE and ΔrcaE OE strains grown under GL or RL for 72 h. Identical letters over bars represent a homogenous mean group (P > 0.05), whereas line over bars indicate no significant difference between the length and width of cells (P > 0.05) for a particular condition. No symbol over the bar indicates a significant difference (P < 0.05) from others.
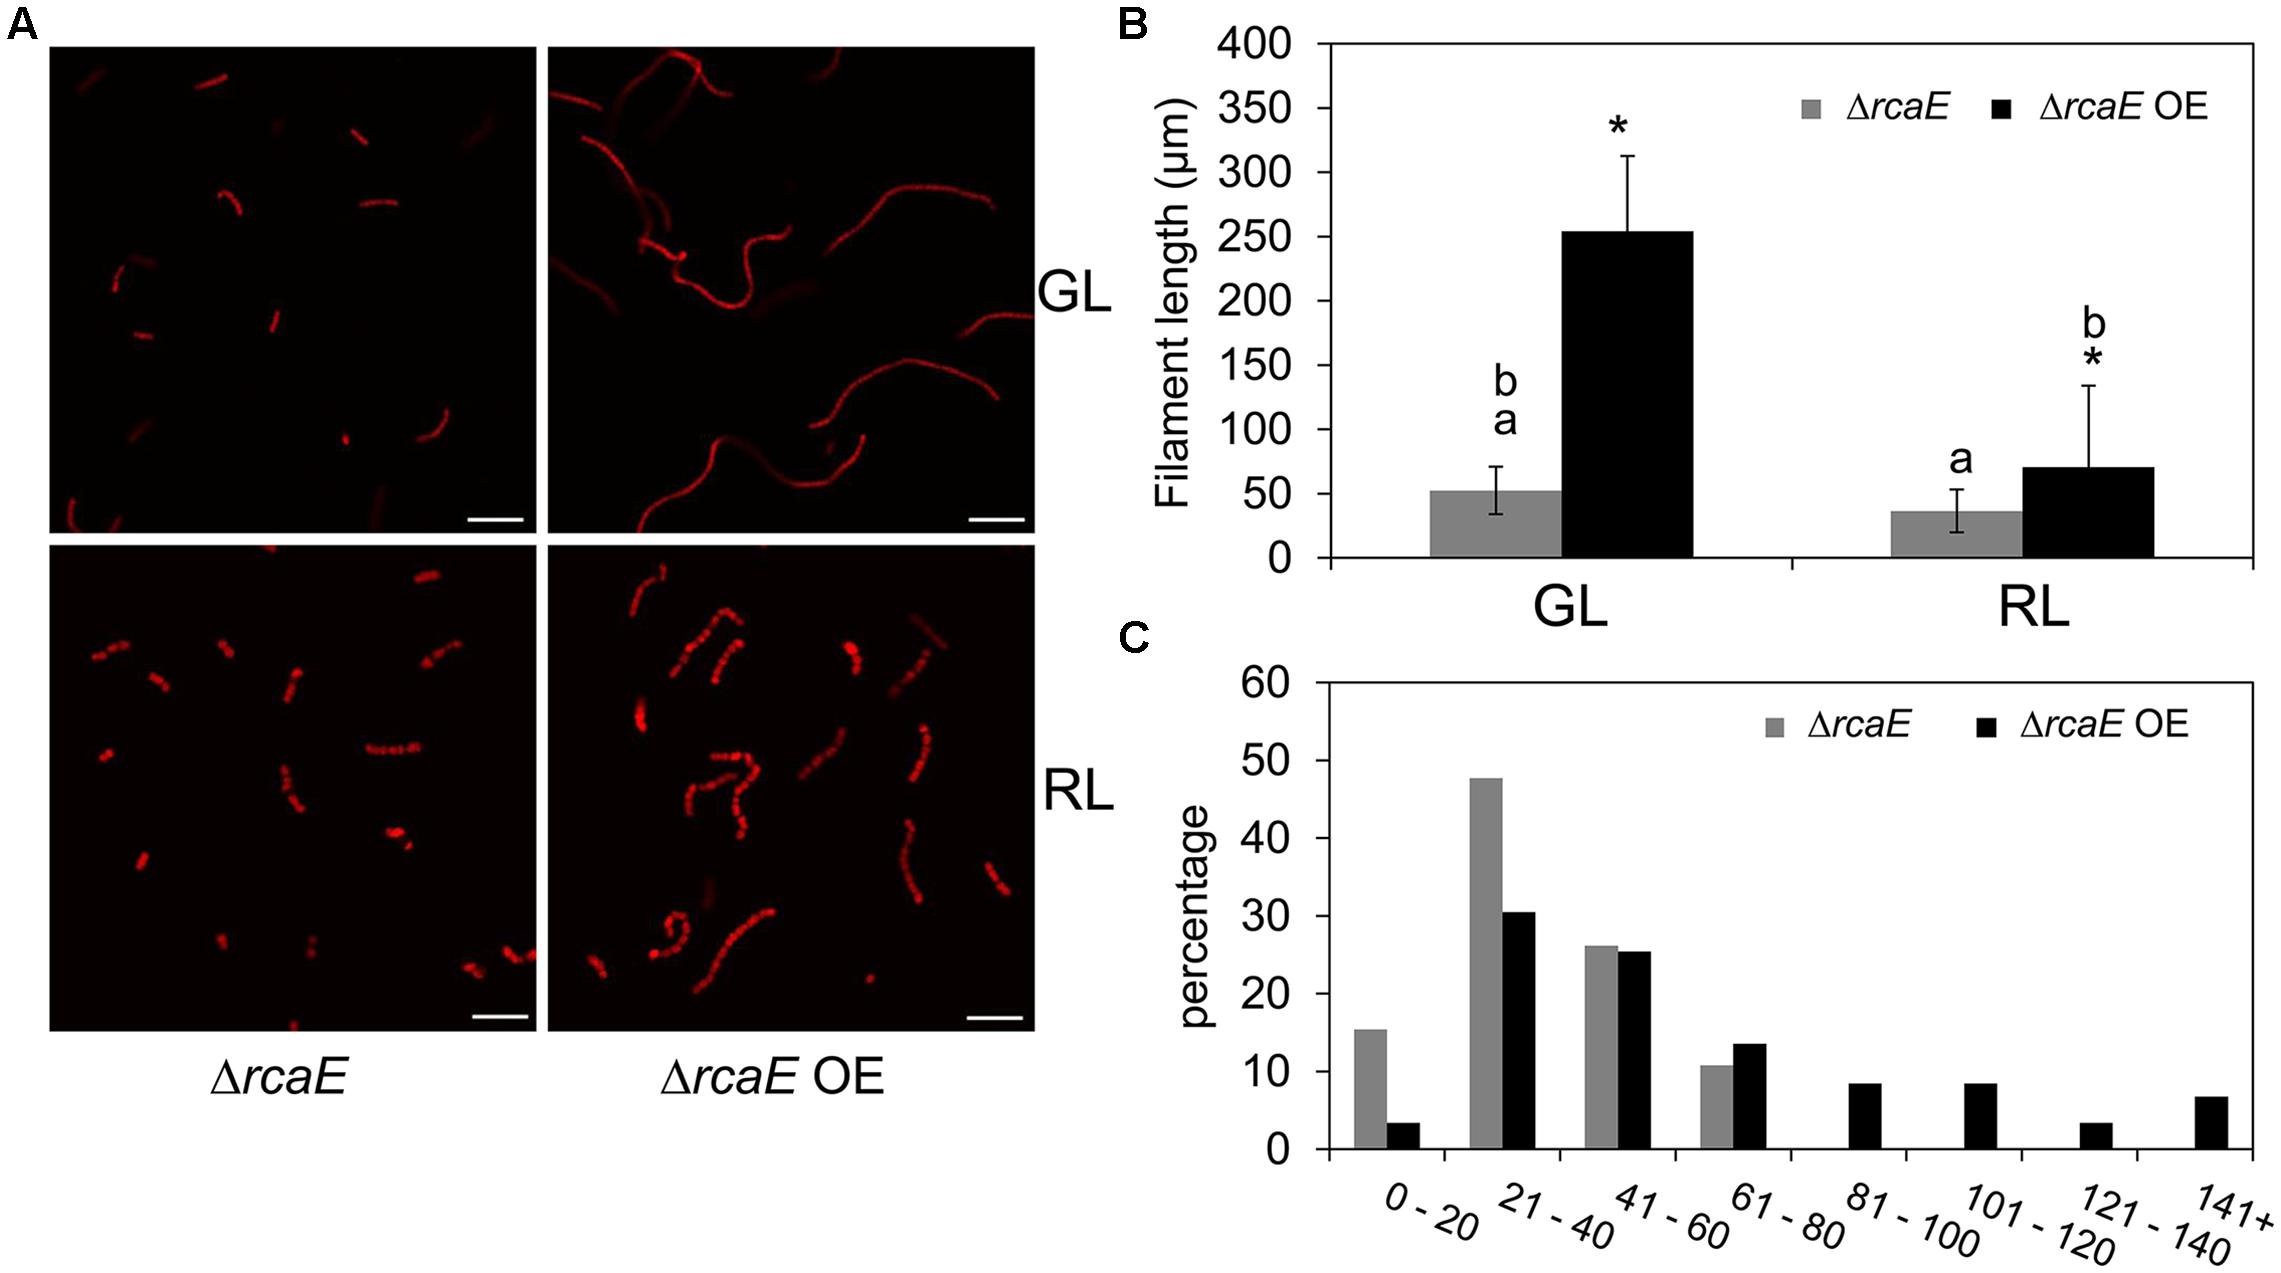
FIGURE 7. Confocal laser scanning microscopy analyses of filament morphology of F. diplosiphon ΔrcaE and ΔrcaE strain overexpressing bolA (ΔrcaE OE) grown under GL or RL. (A) Representative optical slices from a Z-series of chlorophyll autofluorescence images of ΔrcaE and ΔrcaE OE strains grown under GL or RL for 72 h. Images were acquired using a 10× objective with 2× zoom setting. Bars, 50 μm. (B) Filament length measurements of ΔrcaE and ΔrcaE OE strains grown under GL or RL for 72 h. Identical letters over bars represent a homogeneous mean group (P > 0.05), whereas asterisk indicates a significant difference (P < 0.05) from ΔrcaE. (C) Percentage distribution of filaments among indicated measured length (μm) in RL-grown cultures of ΔrcaE and ΔrcaE OE strains.
Similar to the WT OE strain, a higher accumulation of BolA in ΔrcaE OE was associated with decreased levels of ROS under GL and RL compared to ΔrcaE (Figure 8). In contrast to the observed impact on ROS levels, there was no noted difference in the growth response or whole-cell absorption spectra of ΔrcaE and ΔrcaE OE strains when grown under identical conditions (Supplemental Figure S5). However, the concentrations of PE, PC and AP were higher in ΔrcaE OE than in ΔrcaE under identical growth conditions (Supplemental Figure S6B). The concentration of chl a in ΔrcaE and ΔrcaE OE strains was similar under GL; however, the observed concentration of chl a in ΔrcaE OE was higher under RL than in ΔrcaE (Supplemental Figure S6A).
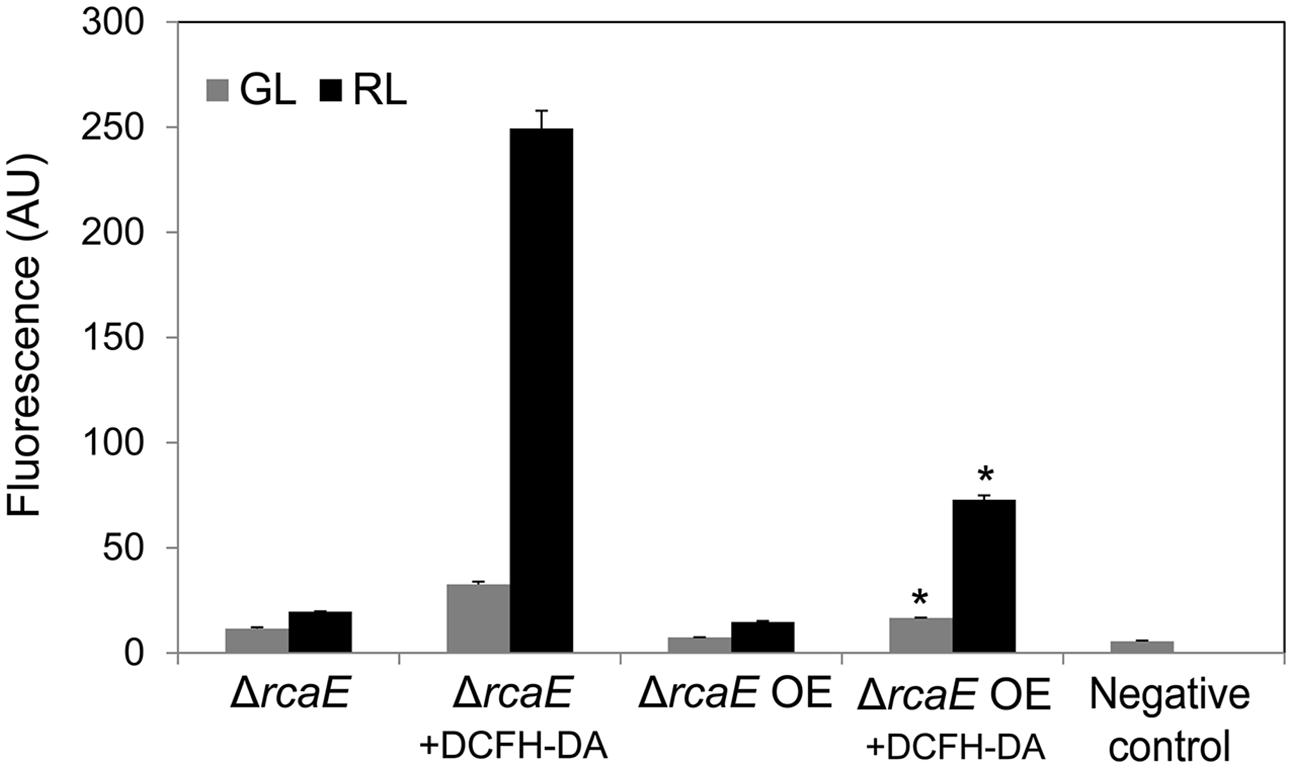
FIGURE 8. Reactive oxygen species accumulation in F. diplosiphon ΔrcaE and ΔrcaE strain overexpressing bolA (ΔrcaE OE) grown under GL or RL. Cellular component-associated fluorescence at 520 nm or ROS-dependent DCF fluorescence at 520 nm in arbitrary units (AU) after 72 h of growth of cells with DCFH-DA dye added (+DCFH-DA) under GL or RL. The negative control represents fluorescence originating from BG-11 medium + ROS-sensitive dye DCFH-DA without cells added. Asterisks indicate significant difference (P < 0.05) from ΔrcaE counterpart grown under GL or RL.
Differences in Morphology in Distinct F. diplosiphon Strains Correlated with BolA Accumulation
Fremyella diplosiphon UTEX 481 strain, which is the parent of the shortened filament WT-pigmentation SF33 strain, is characterized by longer filaments than SF33 (Bordowitz and Montgomery, 2008). The longer UTEX 481 filaments are comparable to the longer filaments we observed in the WT OE strain (Figure 3). This observation suggested that longer filaments in UTEX 481 could be associated with its ability to accumulate higher cellular levels of BolA than the SF33 strain. To test this hypothesis, SF33 and UTEX 481 cultures were grown under identical GL conditions, and immunoblot analysis conducted to compare the levels of BolA in these two strains. UTEX 481 was found to accumulate higher levels of BolA in comparison to the SF33 strain (Figure 9). The relative abundance of PsbA was similar between these strains, suggesting the higher accumulation of BolA may be relevant to the observed differences in cellular volume and morphology between the two strains. UTEX481 also accumulated larger immunoreactive bands, similar to WT OE (compare Figures 2A and 9).
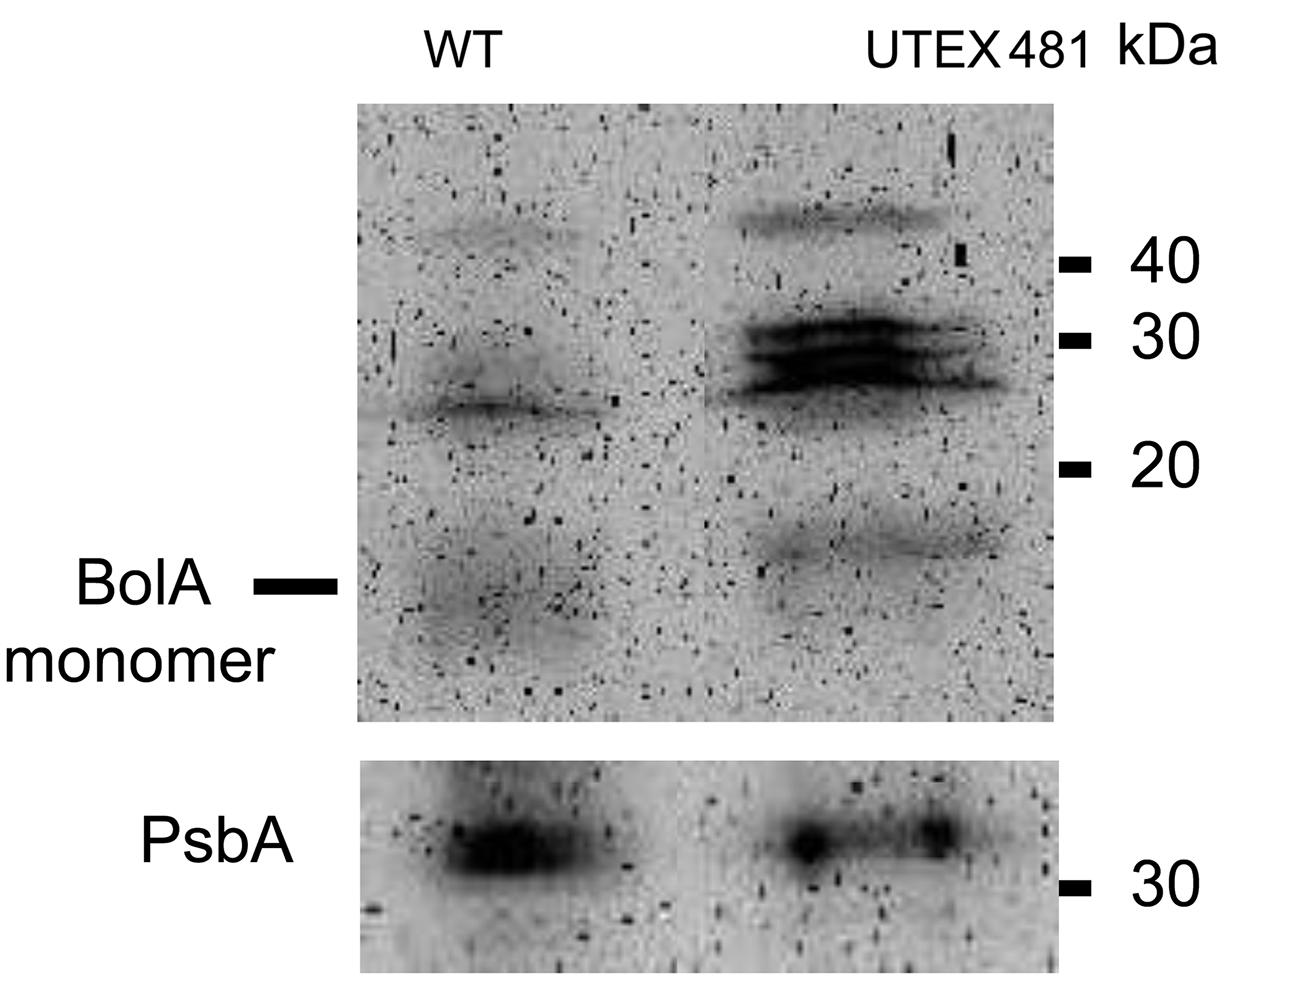
FIGURE 9. Immunoblot analyses of BolA (upper) and PsbA (lower) accumulation in SF33 (WT) and UTEX 481 strains of F. diplosiphon grown under GL. 150 μg of total protein extract from different strains of F. diplosiphon were separated on 15% SDS-PAGE. After blotting, BolA was detected using affinity-purified anti-BolA antibodies. After stripping of the blot to remove anti-BolA antibodies, the blot was probed with anti-PsbA antibodies to detect PsbA as a control of total protein quantification to account for differences in cellular volume and morphology of the two strains. A molecular mass in kilodalton (kDa) is indicated to the right.
Discussion
The expression of morphogene bolA was found to be differentially regulated under GL and RL in a RcaE-dependent manner in F. diplosiphon (Singh and Montgomery, 2014). Furthermore, the light-regulated expression of bolA under GL and RL was inversely correlated with expression of mreB and mreC genes which are known to encode rod shape determining bacterial cytoskeleton proteins (Kruse et al., 2005; Cabeen and Jacobs-Wagner, 2007; Divakaruni et al., 2007; Singh and Montgomery, 2014). Based on results obtained from gene expression analyses, protein-DNA binding assays and functional characterization of F. diplosiphon bolA and mreB genes, we proposed a working model where RcaE promotes accumulation of BolA under RL, which leads to binding of BolA to the promoter of mreB and associated downregulation of mreB expression that is associated with RL-specific spherical morphology (Singh and Montgomery, 2014). Under GL, lower levels of BolA was predicted to promote MreB accumulation and GL-associated rod shaped cells (Singh and Montgomery, 2014). Here, we examined BolA protein levels under GL and RL in WT, ΔbolA and ΔrcaE strains and in strains with BolA overexpression to probe the relationship between BolA abundance and specific effects on cellular morphology regulation. Higher accumulation of BolA due to overexpression of bolA resulted in induction of RL-characteristic cellular morphology under GL in the WT OE strain. This observation strongly supports BolA accumulation as a critical factor for inducing spherical morphology due to RcaE-dependent higher expression of bolA under RL (Singh and Montgomery, 2014). Notably, the maximum permissible concentration of kanamycin for WT OE cultures was 3.5 μg/ml in contrast to a permissible concentration of 50 μg/ml for WT transformed with an empty vector. Higher concentrations were associated with lysis of WT OE cells evident by release of PBPs into the growth medium at higher kanamycin levels (data not shown). An inability to grow the WT OE strain at higher concentrations of kanamycin, i.e., above 3.5 μg/ml, could be associated with a prior correlation of increased antibiotic selection with maintenance of a higher cellular plasmid load and associated higher protein expression from plasmid-encoded genes (Chong et al., 2003; Bangen et al., 2004). This observation suggests that F. diplosiphon can tolerate only certain intracellular levels of BolA, and that higher accumulation of BolA beyond permissible levels is lethal for the cells. We have noted similar responses for other proteins in F. diplosiphon (Agostoni et al., 2015). By comparison, the ΔrcaE OE strain was able to grow initially at a concentration of 22.5 μg/ml kanamycin; however, cell lysis was evident in cultures maintained at higher concentrations of kanamycin after a few rounds of subculturing. ΔrcaE OE could be sustainably maintained at 6 μg/ml of kanamycin. Survival of ΔrcaE OE at a higher selection pressure compared to the WT OE strain, i.e., 6 μg/ml vs. 3.5 μg/ml of kanamycin, respectively, may be associated with the ability of ΔrcaE OE to support a higher level of BolA accumulation relative to its parental stain due to the lower initial endogenous level of BolA in ΔrcaE than in the WT strain (Figure 1B).
The requirement of functional RcaE for normal expression of bolA under GL and RL was clearly demonstrated by the fact that ΔrcaE strain accumulates lower levels of bolA transcript (Singh and Montgomery, 2014) and BolA protein (Figure 1B) than WT. In comparison to WT, ΔrcaE null mutant cells are characterized by large, round shape and high ROS levels (Bordowitz and Montgomery, 2008; Singh and Montgomery, 2012). The depletion of all but a few copies of bolA in ΔbolA strain, which results in low levels of BolA accumulation (Figure 1), was found to cause larger cell shape and increased levels of ROS relative to WT (Singh and Montgomery, 2014). Together, these findings suggested that morphological defects and high ROS levels in ΔrcaE cells could be due, at least in part, to aberration in expression of bolA and associated BolA accumulation in the absence of RcaE. Here, we show that higher accumulation of BolA in ΔrcaE OE results in decreased levels of ROS relative to the parent ΔrcaE and altered cellular morphology which was comparable to WT (Figures 6 and 8). This observation suggests that RcaE may function to repress ROS levels through BolA and that RcaE-dependent photoregulation of morphology may involve maintaining suitable cellular levels of BolA under GL and RL in F. diplosiphon.
The function of BolA as a reductase was put forward based on comparative genomic, phylogenetic distribution, and 3D structure analyses, and it was proposed that BolA can catalyze the reduction of ROS by obtaining reducing power from monothiol glutaredoxin (Huynen et al., 2005). Recently, interaction of BolA with monothiol glutaredoxin was established in yeast and Arabidopsis thaliana, which supports the proposition that BolA might obtain reducing power from monothiol glutaredoxin to catalyze the reduction of ROS (Huynen et al., 2005; Li et al., 2011; Couturier et al., 2014; Roret et al., 2014). The co-occurrence of the genes encoding monothiol glutaredoxin and BolA is highly conserved in eukaryotic and prokaryotic organisms (Huynen et al., 2005; Stroher and Millar, 2012). This conservation of co-occurrence of genes encoding BolA and monothiol glutaredoxin was also found in all but a few cyanobacteria, including F. diplosiphon (Singh and Montgomery, 2014). Reduced accumulation of BolA in the ΔbolA strain of F. diplosiphon resulted in increased levels of ROS under GL and RL, which is in accordance with proposed involvement of BolA in controlling intracellular ROS levels (Huynen et al., 2005; Singh and Montgomery, 2014). Overexpression of bolA results in decreased levels of ROS under GL and RL (Figures 4 and 8). These results further support involvement of BolA in the regulation of intracellular ROS (Huynen et al., 2005; Singh and Montgomery, 2014).
In addition to affecting cellular morphology and ROS levels of WT OE and ΔrcaE OE strains, increased levels of BolA accumulation in these strains was surprisingly associated with an unprecedented increase in the length of filaments (Figures 3 and 7). The observed increased filament length could be the result of decreased levels of ROS associated with higher accumulation of BolA in WT OE and ΔrcaE OE strains. Filament length of F. diplosiphon UTEX 481 was found to be increased in the presence of an antioxidant which reduces levels of ROS under GL and RL (Singh and Montgomery, 2012). Additionally, ROS accumulation has been shown to be associated with increased level of lipid peroxidation in cyanobacterial systems which could eventually impact integrity of filaments (He and Häder, 2002; Rastogi et al., 2010). RL-dependent higher accumulation of ROS in comparison to GL is associated with shorter filaments in WT F. diplosiphon, and it has been proposed that selective lysis of cells by oxidative stress results in fragmentation of filaments under RL (Bennett and Bogorad, 1973; Singh and Montgomery, 2012). UV-radiation dependent increased levels of ROS in cyanobacterial systems have been shown to be associated with fragmentation of filaments (Ma and Gao, 2009; Rastogi et al., 2010; Singh et al., 2014). However, direct involvement of BolA in maintaining intact filaments cannot be ruled out.
In summary, the present study supports a role for RcaE-dependent, morphogene-mediated regulation of cellular morphogenesis during CCA. We also provide evidence that the observed morphological and oxidative stress defects in the ΔrcaE strain could be associated with low levels of BolA. Results from our study also provide evidence that apposite regulation of intracellular ROS levels impacts filament length.
Author Contributions
SS and BM conceived and designed experiments. SS conducted experiments. SS and BM analyzed data and wrote and edited the paper.
Funding
This work was supported by the National Science Foundation (grant no. MCB-1243983 to BM). Confocal analyses of cells were supported in part by the US Department of Energy (Chemical Sciences, Geosciences and Biosciences Division, Office of Basic Energy Sciences, Office of Science, grant no. DE-FG02-91ER20021 to BM).
Conflict of Interest Statement
The authors declare that the research was conducted in the absence of any commercial or financial relationships that could be construed as a potential conflict of interest.
Acknowledgment
We thank Haley Miller for technical support with the experiments.
Supplementary Material
The Supplementary Material for this article can be found online at: http://journal.frontiersin.org/article/10.3389/fmicb.2015.01215
References
Agostoni, M., Waters, C. M., and Montgomery, B. L. (2015). Regulation of biofilm formation and cellular buoyancy through modulating intracellular cyclic di-GMP levels in engineered cyanobacteria. Biotechnol. Bioeng. doi: 10.1002/bit.25712 [Epub ahead of print].
Aldea, M., Garrido, T., Hernández-Chico, C., Vicente, M., and Kushner, S. R. (1989). Induction of a growth-phase-dependent promoter triggers transcription of bolA, an Escherichia coli morphogene. EMBO J. 8, 3923–3931.
Aldea, M., Hernández-Chico, C., De La Campa, A. G., Kushner, S. R., and Vicente, M. (1988). Identification, cloning, and expression of bolA, an ftsZ-dependent morphogene of Escherichia coli. J. Bacteriol. 170, 5169–5176.
Allen, M. M. (1968). Simple conditions for growth of unicellular blue-green algae on plates. J. Phycol. 4, 1–4. doi: 10.1111/j.1529-8817.1968.tb04667.x
Bangen, K., Hong, N., Louie, A., Mei, G., and Trewartha, J. (2004). The effects of incubation with ampicillin and tetracycline on the expression of the bla and tetA genes of pBR322. J. Exp. Microbiol. Immunol. 5, 23–28.
Bennett, A., and Bogorad, L. (1973). Complementary chromatic adaptation in a filamentous blue-green alga. J. Cell. Biol. 58, 419–435. doi: 10.1083/jcb.58.2.419
Bezy, R. P., and Kehoe, D. M. (2010). Functional characterization of a cyanobacterial OmpR/PhoB class transcription factor binding site controlling light color responses. J. Bacteriol. 192, 5923–5933. doi: 10.1128/JB.00602-10
Bogorad, L. (1975). Phycobiliproteins and complementary chromatic adaptation. Ann. Rev. Plant. Physiol. 26, 369–401. doi: 10.1146/annurev.pp.26.060175.002101
Bogorad, L., Gendel, S. M., Haury, J. F., and Koller, K. P. (1983). “Photomorphogenesis and complementary chromatic adaptation,” in Fremyella Diplosiphon. Photosynthetic Prokaryotes: Cell Differentiation and Function, eds G. C. Papageorgiou and L. Packer (New York, NY: Elsevier Biomedical), 119–126.
Bordowitz, J. R., and Montgomery, B. L. (2008). Photoregulation of cellular morphology during complementary chromatic adaptation requires sensor-kinase-class protein RcaE in Fremyella diplosiphon. J. Bacteriol. 190, 4069–4074. doi: 10.1128/JB.00018-08
Bordowitz, J. R., and Montgomery, B. L. (2010). Exploiting the autofluorescent properties of photosynthetic pigments for analysis of pigmentation and morphology in live Fremyella diplosiphon cells. Sensors 10, 6969–6979. doi: 10.3390/s100706969
Bordowitz, J. R., Whitaker, M. J., and Montgomery, B. L. (2010). Independence and interdependence of the photoregulation of pigmentation and development in Fremyella diplosiphon. Commun. Integr. Biol. 3, 151–153. doi: 10.4161/cib.3.2.10367
Cabeen, M. T., and Jacobs-Wagner, C. (2007). Skin and bones: the bacterial cytoskeleton, cell wall, and cell morphogenesis. J. Cell Biol. 179, 381–387. doi: 10.1083/jcb.200708001
Campbell, D. (1996). Complementary chromatic adaptation alters photosynthetic strategies in the cyanobacterium Calothrix. Microbiology 142, 1255–1263. doi: 10.1099/13500872-142-5-1255
Capuano, V., Braux, A.-S., De Marsac, N. T., and Houmard, J. (1991). The “anchor polypeptide” of cyanobacterial phycobilisomes. Molecular characterization of the Synechococcus sp. PCC 6301 apcE gene. J. Biol. Chem. 266, 7239–7247.
Chiang, G. G., Schaefer, M. R., and Grossman, A. R. (1992). Transformation of the filamentous cyanobacterium Fremyella diplosiphon by conjugaison or electroporation. Plant Physiol. Biochem. 30, 315–325.
Chong, M., Leung, R., Wong, C., and Yuen, A. (2003). The effects of ampicillin versus tetracycline on the plasmid copy numbers of pBR322. J. Exp. Microbiol. Immunol. 3, 87–95.
Cobley, J. G., Zerweck, E., Reyes, R., Mody, A., Seludo-Unson, J. R., Jaeger, H., et al. (1993). Construction of shuttle plasmids which can be efficiently mobilized from Escherichia coli into the chromatically adapting cyanobacterium, Fremyella diplosiphon. Plasmid 30, 90–105. doi: 10.1006/plas.1993.1037
Couturier, J., Wu, H.-C., Dhalleine, T., Pégeot, H., Sudre, D., Gualberto, J. M., et al. (2014). Monothiol glutaredoxin-BolA interactions: redox control of Arabidopsis thaliana BolA2 and SufE1. Mol. Plant 7, 187–205. doi: 10.1093/mp/sst156
De Marsac, N. T., and Houmard, J. (1988). Complementary chromatic adaptation: physiological conditions and action spectra. Methods Enzymol. 167, 318–328. doi: 10.1016/0076-6879(88)67037-6
Divakaruni, A. V., Baida, C., White, C. L., and Gober, J. W. (2007). The cell shape proteins MreB and MreC control cell morphogenesis by positioning cell wall synthetic complexes. Mol. Microbiol. 66, 174–188. doi: 10.1111/j.1365-2958.2007.05910.x
Freire, P., Moreira, R. N., and Arraiano, C. M. (2009). BolA inhibits cell elongation and regulates MreB expression levels. J. Mol. Biol. 385, 1345–1351. doi: 10.1016/j.jmb.2008.12.026
Gonzalez, A., Teresa Bes, M., Barja, F., Luisa Peleato, M., and Fillat, M. F. (2010). Overexpression of FurA in Anabaena sp. PCC 7120 reveals new targets for this regulator involved in photosynthesis, iron uptake and cellular morphology. Plant Cell Physiol. 51, 1900–1914. doi: 10.1093/pcp/pcq148
Guinote, I. B., Moreira, R. N., Barahona, S., Freire, P., Vicente, M., and Arraiano, C. M. (2014). Breaking through the stress barrier: the role of BolA in Gram-negative survival. World J. Microbiol. Biotechnol. 30, 2559–2566. doi: 10.1007/s11274-014-1702-4
Gutu, A., and Kehoe, D. M. (2012). Emerging perspectives on the mechanisms, regulation, and distribution of light color acclimation in cyanobacteria. Mol. Plant 5, 1–13. doi: 10.1093/mp/ssr054
He, Y.-Y., and Häder, D.-P. (2002). UV-B-induced formation of reactive oxygen species and oxidative damage of the cyanobacterium Anabaena sp.: protective effects of ascorbic acid and N-acetyl-L-cysteine. J. Photochem. Photobiol. B Biol. 66, 115–124. doi: 10.1016/S1011-1344(01)00278-0
Hirose, Y., Rockwell, N. C., Nishiyama, K., Narikawa, R., Ukaji, Y., Inomata, K., et al. (2013). Green/red cyanobacteriochromes regulate complementary chromatic acclimation via a protochromic photocycle. Proc. Natl. Acad. Sci. U.S.A. 110, 4974–4979. doi: 10.1073/pnas.1302909110
Hu, B., Yang, G., Zhao, W., Zhang, Y., and Zhao, J. (2007). MreB is important for cell shape but not for chromosome segregation of the filamentous cyanobacterium Anabaena sp. PCC 7120. Mol. Microbiol. 63, 1640–1652. doi: 10.1111/j.1365-2958.2007.05618.x
Huynen, M. A., Spronk, C. A. E. M., Gabaldón, T., and Snel, B. (2005). Combining data from genomes, Y2H and 3D structure indicates that BolA is a reductase interacting with a glutaredoxin. FEBS Lett. 579, 591–596. doi: 10.1016/j.febslet.2004.11.111
Kahn, K., Mazel, D., Houmard, J., Tandeau Demarsac, N., and Schaefer, M. R. (1997). A role for cpeYZ in cyanobacterial phycoerythrin biosynthesis. J. Bacteriol. 179, 998–1006.
Kehoe, D. M. (2010). Chromatic adaptation and the evolution of light color sensing in cyanobacteria. Proc. Natl. Acad. Sci. U.S.A. 107, 9029–9030. doi: 10.1073/pnas.1004510107
Kehoe, D. M., and Grossman, A. R. (1996). Similarity of a chromatic adaptation sensor to phytochrome and ethylene receptors. Science 273, 1409–1412. doi: 10.1126/science.273.5280.1409
Kehoe, D. M., and Grossman, A. R. (1997). New classes of mutants in complementary chromatic adaptation provide evidence for a novel four-step phosphorelay system. J. Bacteriol. 179, 3914–3921.
Kehoe, D. M., and Grossman, A. R. (1998). Use of molecular genetics to investigate complementary chromatic adaptation: advances in transformation and complementation. Methods Enzymol. 297, 279–290. doi: 10.1016/S0076-6879(98)97021-5
Kehoe, D. M., and Gutu, A. (2006). Responding to color: the regulation of complementary chromatic adaptation. Annu. Rev. Plant Biol. 57, 127–150. doi: 10.1146/annurev.arplant.57.032905.105215
Khona, D. K., Dongre, S. S., Arraiano, C. M., and D’souza, J. S. (2013). A BolA-like morphogene from the alga Chlamydomonas reinhardtii changes morphology and induces biofilm formation in Escherichia coli. FEMS Microbiol. Lett. 339, 39–47. doi: 10.1111/1574-6968.12051
Kruse, T., Bork-Jensen, J., and Gerdes, K. (2005). The morphogenetic MreBCD proteins of Escherichia coli form an essential membrane-bound complex. Mol. Microbiol. 55, 78–89. doi: 10.1111/j.1365-2958.2004.04367.x
Li, H., Mapolelo, D. T., Dingra, N. N., Keller, G., Riggs-Gelasco, P. J., Winge, D. R., et al. (2011). Histidine 103 in Fra2 is an iron-sulfur cluster ligand in the [2Fe-2S] Fra2-Grx3 complex and is required for in vivo iron signaling in yeast. J. Biol. Chem. 286, 867–876. doi: 10.1074/jbc.M110.184176
Li, L., Alvey, R. M., Bezy, R. P., and Kehoe, D. M. (2008). Inverse transcriptional activities during complementary chromatic adaptation are controlled by the response regulator RcaC binding to red and green light-responsive promoters. Mol. Microbiol. 68, 286–297. doi: 10.1111/j.1365-2958.2008.06151.x
Ma, Z., and Gao, K. (2009). Photoregulation of morphological structure and its physiological relevance in the cyanobacterium Arthrospira (Spirulina) platensis. Planta 230, 329–337. doi: 10.1007/s00425-009-0947-x
Montgomery, B. L. (2008). Shedding new light on the regulation of complementary chromatic adaptation. Cent. Eur. J. Biol. 3, 351–358.
Oelmüller, R., Conley, P. B., Federspiel, N., Briggs, W. R., and Grossman, A. R. (1988). Changes in accumulation and synthesis of transcripts encoding phycobilisome components during acclimation of Fremyella diplosiphon to different light qualities. Plant Physiol. 88, 1077–1083. doi: 10.1104/pp.88.4.1077
O’Toole, G. A., and Kolter, R. (1998). Initiation of biofilm formation in Pseudomonas fluorescens WCS365 proceeds via multiple, convergent signalling pathways: a genetic analysis. Mol. Microbiol. 28, 449–461. doi: 10.1046/j.1365-2958.1998.00797.x
Pattanaik, B., Whitaker, M. J., and Montgomery, B. L. (2011). Convergence and divergence of the photoregulation of pigmentation and cellular morphology in Fremyella diplosiphon. Plant Signal. Behav. 6, 2038–2041. doi: 10.4161/psb.6.12.18239
Pattanaik, B., Whitaker, M. J., and Montgomery, B. L. (2012). Light quantity affects the regulation of cell shape in Fremyella diplosiphon. Front. Microbiol. 3:170. doi: 10.3389/fmicb.2012.00170
Postius, C., Neuschaefer-Rube, O., Haid, V., and Böger, P. (2001). N2-fixation and complementary chromatic adaptation in non-heterocystous cyanobacteria from Lake Constance. FEMS Microbiol. Ecol. 37, 117–125. doi: 10.1111/j.1574-6941.2001.tb00859.x
Rastogi, R. P., Singh, S. P., Häder, D.-P., and Sinha, R. P. (2010). Detection of reactive oxygen species (ROS) by the oxidant-sensing probe 2’,7’-dichlorodihydrofluorescein diacetate in the cyanobacterium Anabaena variabilis PCC 7937. Biochem. Biophys. Res. Commun. 397, 603–607. doi: 10.1016/j.bbrc.2010.06.006
Roret, T., Tsan, P., Couturier, J., Zhang, B., Johnson, M. K., Rouhier, N., et al. (2014). Structural and spectroscopic insights into BolA-glutaredoxin complexes. J. Biol. Chem. 289, 24588–24598. doi: 10.1074/jbc.M114.572701
Santos, J. M., Freire, P., Vicente, M., and Arraiano, C. M. (1999). The stationary-phase morphogene bolA from Escherichia coli is induced by stress during early stages of growth. Mol. Microbiol. 32, 789–798. doi: 10.1046/j.1365-2958.1999.01397.x
Shi, F., Qin, S., and Wang, Y. C. (2011). The coevolution of phycobilisomes: molecular structure adapting to functional evolution. Comp. Funct. Genomics 2011, 230–236. doi: 10.1155/2011/230236
Singh, N. K., Sonani, R. R., Rastogi, R. P., and Madamwar, D. (2015). The phycobilisomes: an early requisite for efficient photosynthesis in cyanobacteria. EXCLI J. 14, 268–289. doi: 10.17179/excli2014-723
Singh, S. P., Miller, H. L., and Montgomery, B. L. (2013). Temporal dynamics of changes in reactive oxygen species (ROS) levels and cellular morphology are coordinated during complementary chromatic acclimation in Fremyella diplosiphon. Photosyn. Res. 118, 95–104. doi: 10.1007/s11120-013-9938-7
Singh, S. P., and Montgomery, B. L. (2011). Temporal responses of wild-type pigmentation and RcaE-deficient strains of Fremyella diplosiphon during light transitions. Commun. Integr. Biol. 4, 503–510. doi: 10.4161/cib.4.5.16788
Singh, S. P., and Montgomery, B. L. (2012). Reactive oxygen species are involved in the morphology-determining mechanism of Fremyella diplosiphon cells during complementary chromatic adaptation. Microbiology 158, 2235–2245. doi: 10.1099/mic.0.060475-0
Singh, S. P., and Montgomery, B. L. (2014). Morphogenes bolA and mreB mediate the photoregulation of cellular morphology during complementary chromatic acclimation in Fremyella diplosiphon. Mol. Microbiol. 93, 167–182. doi: 10.1111/mmi.12649
Singh, S. P., Rastogi, R. P., Häder, D.-P., and Sinha, R. P. (2014). Temporal dynamics of ROS biogenesis under simulated solar radiation in the cyanobacterium Anabaena variabilis PCC 7937. Protoplasma 251, 1223–1230. doi: 10.1007/s00709-014-0630-3
Stroher, E., and Millar, A. H. (2012). The biological roles of glutaredoxins. Biochem. J. 446, 333–348. doi: 10.1042/bj20112131
Terauchi, K., Montgomery, B. L., Grossman, A. R., Lagarias, J. C., and Kehoe, D. M. (2004). RcaE is a complementary chromatic adaptation photoreceptor required for green and red light responsiveness. Mol. Microbiol. 51, 567–577. doi: 10.1046/j.1365-2958.2003.03853.x
Vieira, H. L. A., Freire, P., and Arraiano, C. M. (2004). Effect of Escherichia coli morphogene bolA on biofilms. Appl. Environ. Microbiol. 70, 5682–5684. doi: 10.1128/AEM.70.9.5682-5684.2004
Walters, K. J., Whitaker, M. J., Singh, S. P., and Montgomery, B. L. (2013). Light intensity and reactive oxygen species are centrally involved in photoregulatory responses during complementary chromatic adaptation in Fremyella diplosiphon. Commun. Integr. Biol. 6:e25005. doi: 10.4161/cib.25005
Yerrapragada, S., Shukla, A., Hallsworth-Pepin, K., Choi, K., Wollam, A., Clifton, S., et al. (2015). Extreme sensory complexity encoded in the 10-Megabase draft genome sequence of the chromatically acclimating cyanobacterium Tolypothrix sp. PCC 7601. Genome Announc. 3:e355–e415. doi: 10.1128/genomeA.00355-15
Keywords: BolA, cellular morphology, complementary chromatic acclimation (CCA), cyanobacteria, light signaling, photomorphogenesis
Citation: Singh SP and Montgomery BL (2015) Regulation of BolA abundance mediates morphogenesis in Fremyella diplosiphon. Front. Microbiol. 6:1215. doi: 10.3389/fmicb.2015.01215
Received: 16 September 2015; Accepted: 19 October 2015;
Published: 05 November 2015.
Edited by:
Weiwen Zhang, Tianjin University, ChinaReviewed by:
Alberto A. Iglesias, Instituto de Agrobiotecnología del Litoral (UNL-CONICET), ArgentinaRajesh P. Rastogi, Sardar Patel University, India
Copyright © 2015 Singh and Montgomery. This is an open-access article distributed under the terms of the Creative Commons Attribution License (CC BY). The use, distribution or reproduction in other forums is permitted, provided the original author(s) or licensor are credited and that the original publication in this journal is cited, in accordance with accepted academic practice. No use, distribution or reproduction is permitted which does not comply with these terms.
*Correspondence: Beronda L. Montgomery, bW9udGcxMzNAbXN1LmVkdQ==