- 1International Center for Tropical Agriculture, Kampala, Uganda
- 2Biosciences, University of Exeter, Exeter, UK
- 3Fera Science Ltd., York, UK
- 4Africa Regional Office, International Center for Tropical Agriculture, Consultative Group for International Agricultural Research (CGIAR), Nairobi, Kenya
Common bacterial blight is a devastating seed-borne disease of common beans that also occurs on other legume species including lablab and Lima beans. We sequenced and analyzed the genomes of 26 strains of Xanthomonas axonopodis pv. phaseoli and X. fuscans subsp. fuscans, the causative agents of this disease, collected over four decades and six continents. This revealed considerable genetic variation within both taxa, encompassing both single-nucleotide variants and differences in gene content, that could be exploited for tracking pathogen spread. The bacterial strain from Lima bean fell within the previously described Genetic Lineage 1, along with the pathovar type strain (NCPPB 3035). The strains from lablab represent a new, previously unknown genetic lineage closely related to strains of X. axonopodis pv. glycines. Finally, we identified more than 100 genes that appear to have been recently acquired by Xanthomonas axonopodis pv. phaseoli from X. fuscans subsp. fuscans.
Introduction
Common bacterial blight (CBB) is a devastating, widespread and seed-borne disease of common beans (Phaseolus vulgaris). The bacteria that cause CBB are genetically diverse (Gilbertson et al., 1991; Alavi et al., 2008; Parkinson et al., 2009; Fourie and Herselman, 2011) and include fuscous strains, which produce a brown pigment on tyrosine-containing medium, and non-fuscous strains. Currently, the non-fuscous strains are classified as Xanthomonas axonopodis pv. phaseoli (Xap) while the fuscous strains are classified into a different species as X. fuscans subsp. fuscans (Xff) (Schaad et al., 2005; Bull et al., 2012), though some authors consider the species X. fuscans to be a subclade within X. axonopodis (Rodriguez-R et al., 2012; Mhedbi-Hajri et al., 2013).
The main host of Xap and Xff is common bean (Phaseolus vulgaris) but they have also been isolated from the closely related Lima bean (Phaseolus lunatus) and lablab bean (Lablab purpureus, formerly Dolichos lablab) as well as several other legumes, including Vigna species (Bradbury, 1986). Lablab bean is a drought-resistant legume that stays green during the dry season and is used to improve soil and to feed livestock (Schaaffhausen, 1963). Lablab bean has been reported to be the main leguminous fodder crop used in Sudan around Khartoum, where it is known as hyacinth bean, bonavist bean or, in Arabic, lubia afin (Schaaffhausen, 1963). It is also grown in Sudan as a pulse legume (Mahdi and Atabani, 1992). Infection by Xap has been observed when lablab was sown during the rainy months (Tarr, 1958). It is not currently clear whether a single bacterial population moves frequently between host species or to what extent CBB agents colonizing different plant species represent distinct and genetically isolated populations or distinct taxa. For example, do the strains from Lima bean and lablab bean belong to the same genetic lineages as do strains from common bean?
A key determinant of pathogenicity in Xanthomonas species is the Hrp type-three secretion system (T3SS), which functions as a molecular syringe that secretes and translocates a number of bacterial effector proteins into the cytoplasm of the host cell, thereby modifying the host defenses to the advantage of the pathogen (Alfano and Collmer, 1997, 2004; Galán and Collmer, 1999; Grant et al., 2006; Kay and Bonas, 2009). Host ranges of X. axonopodis are significantly associated with the bacteria's repertoires of effectors and phylogenetically distinct strains' convergence on a common host plant might be at least partially explained by shared effectors (Hajri et al., 2009). The particular set of effectors expressed by a pathogen has some practical implications; many plant resistance genes trigger host defenses in response to detection of specific pathogen effectors. Effectors may act as virulence factors, enabling the pathogen to overcome host defenses. Therefore, rational deployment of available genetic resistance depends on knowledge of which effectors are likely to be present in a pathogen population. For example, it might be prudent to deploy resistance genes that recognize core effectors that are present in all strains of the pathogen that the plant will encounter rather than against rarely occurring effectors; this was the rationale for a recent study of the genome sequences of 65 strains of Xanthomonas axonopodis pv. manihotis (Bart et al., 2012).
CBB is currently a serious challenge to bean production in many African countries. In order to make optimal and rational use of limited available resources to contain and manage the impacts of this disease, it is important to understand the spread pathways of the Xap and Xff pathogens over both long and short geographical distances. Studies of spread rely on molecular markers that can be used to link strains from different times and locations based on their sharing similar genotypes.
According to multi-locus sequence analysis (MLSA), strains from Phaseolus species each fell into one of four genetic lineages (GL): GL 1, GL 2, GL 3, and GL fuscans (Mhedbi-Hajri et al., 2013) that corresponded to genetic lineages previously determined on the basis of amplified fragment length polymorphism (AFLP) (Alavi et al., 2008). The MLSA-based genetic lineages are consistent with an earlier classification of X. axonopodis strains into “genetic groups” based on conserved repetitive sequences BOX, enterobacterial repetitive intergenic consensus (ERIC), and repetitive extragenic palindromic (REP) (rep-PCR) (Rademaker et al., 2005), though the MLSA-based classification provides higher resolution. Rademaker's genetic group 9.4 includes GL 1, while genetic group 9.6 includes both GL 2 and GL 3 and GL fuscans (Mhedbi-Hajri et al., 2013), implying that GL 2 and GL 3 are more closely related to GL fuscans than to GL 1.
Whole-genome sequencing is relatively cheap, easy and quick and readily discovers genetic variation that can be utilized as neutral molecular markers to track specific genotypes (Vinatzer et al., 2014; Goss, 2015). It can also reveal biologically interesting variation and the incidence and distribution of avirulence factors (e.g., T3SS effectors) across the pathogen population allowing for rational deployment of genetic resistance in host crop plants, as was recently proposed for cassava and its pathogen X. axonopodis pv. manihotis (Bart et al., 2012). Other authors have pointed out that deployment of resistance without an awareness of pathogenic variation within the pathogen population could result in costly failure (Taylor et al., 1996; Fourie and Herselman, 2011). At the time of writing (July 2015) sequence assemblies are publicly available for 379 Xanthomonas genomes. No genome sequences were currently available for Xap, but two Xff genome sequences have been published: a finished genome for strain 4834-R (Darrasse et al., 2013b) and a draft assembly for strain 4844 (Indiana et al., 2014). A previous review (Ryan et al., 2011) presented some of the insights into Xanthomonas biology revealed by genome sequencing.
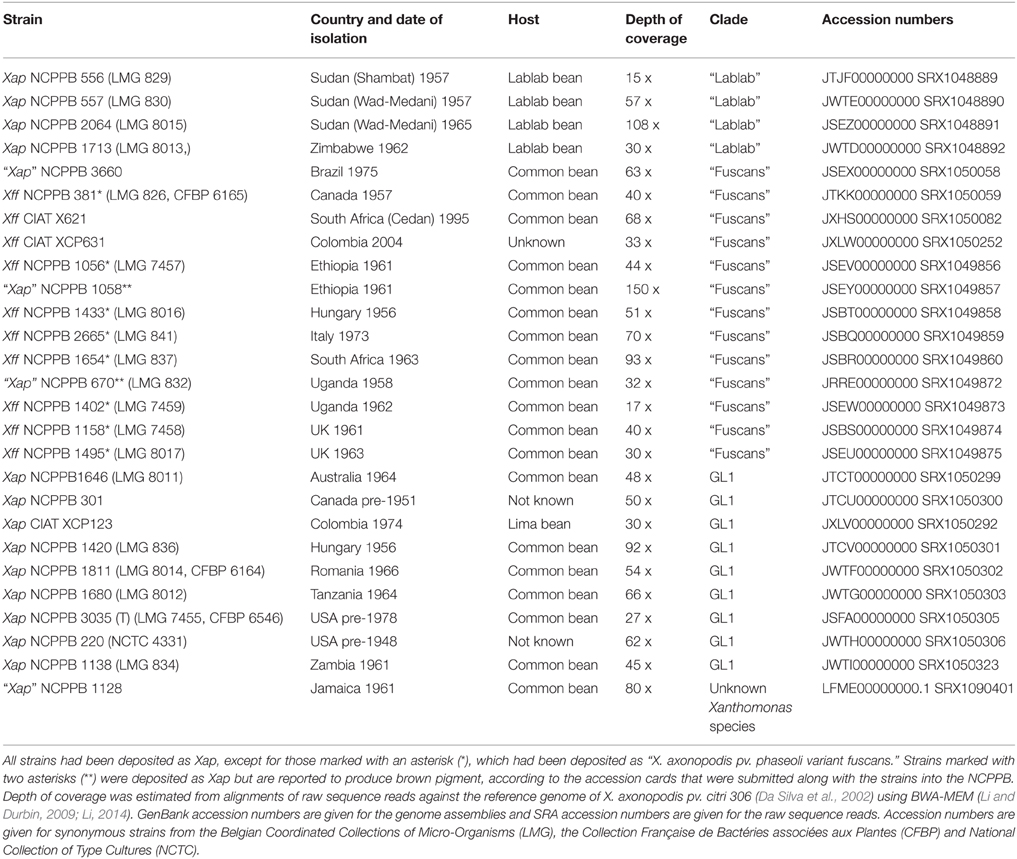
In the current study, we aimed to exploit whole-genome sequencing to catalog genetic diversity of CBB pathogens within each of the MLSA-based genetic lineages from common bean and strains from lablab and Lima beans. We also hypothesized that there might be some genetic features that are shared between phylogenetically distant lineages of CBB pathogens that reflect genetic exchange or adaptation to a common host. Therefore, we sequenced and bioinformatically analyzed the genomes of 26 strains deposited in the strain collections as Xap or Xff spanning six continents and more than four decades.
The specific objectives of this study were:
• To determine the phylogenomic relationships between Xap and Xff bacterial strains from different host species: common, lablab and Lima beans.
• To identify genetic variation within Xap or within Xff. These sequence variations could be exploited as molecular markers for use in epidemiological and phylogeographic studies.
• To determine patterns of conservation and variation in the complement of T3SS effectors between and within Xap and Xff. This knowledge can inform future rational deployment of disease resistance genes in beans.
• To identify genes or alleles that have been recently transmitted between phylogenetically divergent CBB bacteria.
• Identify candidate genetic determinants of the fuscous genotype, i.e., production of the brown pigment on tyrosine-containing medium.
Materials and Methods
Genome Sequencing
Genomic DNA was prepared from overnight liquid cultures of bacteria revived from the NCPPB grown on Yeast extract-Dextrose-Calcium Carbonate solid medium (i.e., agar plates) for 2 days at 28°C. DNA extraction was performed using the QIAamp DNA Mini kit (Qiagen, Hilden, Germany) applying proteinase K incubation for 30 min. We used the Nextera XT kit (Illumina, San Diego, USA) for library preparation following manufacturer's instructions. Purification was carried after tagmentation using AMPure XP beads (Beckman Coulter, High Wycombe, UK) prior to pooling. The 15pM library was then sequenced on an Illumina MiSeq using reagent kit chemistry v3 with 600 cycles.
Bioinformatics
Quality Control on Genomic Sequence Data
The quality of sequence data was checked using FastQC (Andrews)1 Poor-quality and adaptor-containing reads were filtered and trimmed using FastQ-MCF (Aronesty, 2011).
Alignment of Sequence Reads vs. a Reference Genome Sequence
For alignment of genomic sequence reads against reference genome sequences of Xff 4834-R (Darrasse et al., 2013b) and X. axonopodis pv. citri 306 (Da Silva et al., 2002), we used BWA-MEM (Li, 2014). Resulting alignments were visualized using IGV (Thorvaldsdóttir et al., 2013).
Phylogenetic Analysis and Calling Single-nucleotide Variations
Phylogenetic analysis of the multi-locus sequence data was conducted in MEGA6 (Tamura et al., 2013). Multiple sequence alignments were performed using Muscle (Edgar, 2004). Evolutionary history was inferred using the maximum likelihood method based on the general time reversible model (Nei and Kumar, 2000). Initial tree(s) for the heuristic search were obtained by applying the Neighbor-Joining method to a matrix of pairwise distances estimated using the maximum composite likelihood (MCL) approach.
For phylogenetic analysis of whole-genome assemblies, we used the Parsnp program from the Harvest suite (Treangen et al., 2014). Phylogenetic trees generated from Parsnp in Newick format were imported into MEGA6 for preparation of the final figures. Parsnp uses FastTree2 to generate approximately maximum likelihood trees (Price et al., 2010). Distributions of single-nucleotide variations, calculated by Parsnp, were visualized using Gingr from the Harvest suite.
To check the reliability of the SNPs called by Parsnp, we further checked them using our previously described method (Mazzaglia et al., 2012; Wasukira et al., 2012; Clarke et al., 2015). For this method, we aligned the sequence reads against the reference genome sequence using BWA-mem version 0.7.5a-r405 (Li, 2013, 2014) with default parameter values and excluding any reads that did not map uniquely to a single site on the reference genome. From the resulting alignments, we generated pileup files using SAMtools version 0.1.19-96b5f2294a (Li et al., 2009). We then parsed the pileup-formatted alignments to examine the polymorphism status of each single-nucleotide site in the entire Xff 4834-R reference genome. For each single-nucleotide site we categorized it as either ambiguous or unambiguous. A site was considered to be un- ambiguous only if there was at least 5 × coverage by genomic sequence reads from each and every bacterial strain and only if for each and every bacterial strain, at least 95% of the aligned reads were in agreement. Any sites that did not satisfy these criteria were considered to be ambiguous and excluded from further analysis. Over the remaining unambiguous sites, we could be very confident in the genotype for all the sequenced strains.
De Novo Assembly
Prior to assembly, we combined overlapping reads using FLASH (Magoč and Salzberg, 2011). Genomes were assembled using SPAdes version 3.5.0 (Bankevich et al., 2012) with read error correction and with the “- - careful” switch. We assessed the quality of the assemblies and generated summary statistics using Quast (Gurevich et al., 2013) and REAPR (Hunt et al., 2013).
Automated Annotation of Genome Assemblies
Genome assemblies were annotated via the Prokaryotic Genomes Automatic Annotation Pipeline (PGAAP) at the NCBI.
Comparison of Gene Content
To determine the presence or absence of genes in the newly sequenced genomes, we used alignment of genomic sequence reads against a reference pan-genome rather than comparison between genome assemblies. The reference pan-genome consisted of a set of gene sequences, each being a sole representative of a cluster of orthologous genes from all Xanthomonas genomes whose sequences were currently available; clustering of orthologous gene sequences was performed using UCLUST (Edgar, 2010). The reason for taking this approach (i.e., alignment of raw reads rather than alignment of assemblies) was to avoid potential errors arising from gaps in the genome assemblies. We aligned sequence reads against the reference genome sequence using BWA-MEM (Li and Durbin, 2009; Li, 2014) and used coverageBed from the BEDtools package (Quinlan and Hall, 2010) to determine the breadth of coverage of each gene in the resulting alignment. These breadths of coverage were visualized as heatmaps using the pheatmap module in R (R Development Core Team, 2013). We also compared genome assemblies using BRIG (Alikhan et al., 2011).
Results
Overview of Sequencing Results
We performed genomic re-sequencing on a collection of 26 Xap and Xff strains from the strain collections at NCPPB and CIAT as summarized in Table 1. For most of the strains, we obtained a depth of coverage of at least 40 x and thus were able to generate de novo genome assemblies. However, for seven of the genomes, there was less than 40 x coverage. We investigated the relationship between coverage depth and assembly quality by assembling subsets of the sequence reads from NCPPB 1058. We found that contig N50 length peaked at around 40 x coverage, with further increases in depth yielding little or no increase in contig lengths.
Figure 1 shows an overview of the de novo assemblies of each sequenced Xap and Xff genome aligned against that of the X. axonopodis pv. citri 306 (Da Silva et al., 2002). See also the Supplementary Figures for genome-wide alignments of the assemblies using Mauve (Darling et al., 2004). Note that the 26 Xap and Xff genomes were assembled de novo, using SPAdes (Bankevich et al., 2012), without use of a reference sequence.
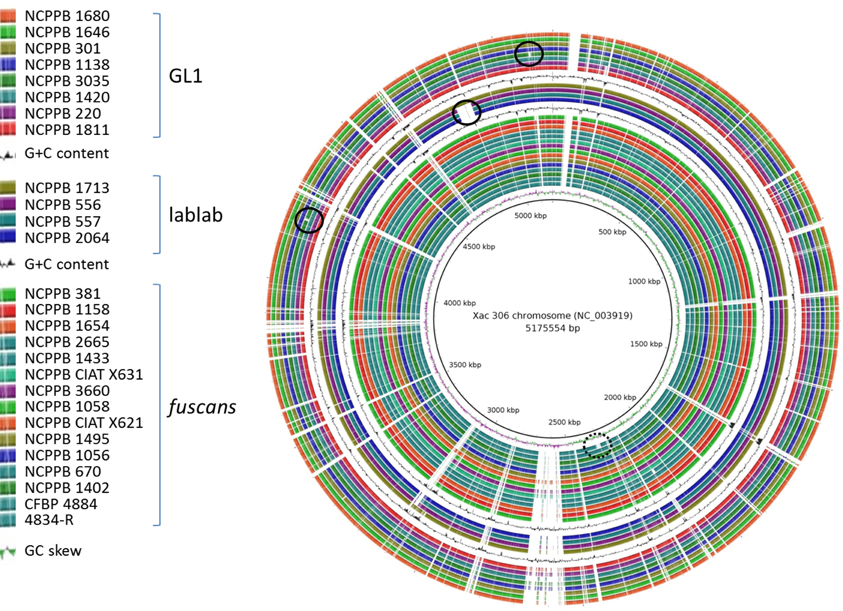
Figure 1. Overview of genomic conservation among Xap and Xff. The newly sequenced genome sequences and those of previously sequenced Xff strains 4834-R (Darrasse et al., 2013b) and CFBP 4884 (Indiana et al., 2014) were aligned against the Xac 306 chromosome reference sequence (Da Silva et al., 2002) using BLASTN with an E-value threshold of 1 × 10⁻⁶. The alignments are visualized using BLAST Ring Image Generator (BRIG) (Alikhan et al., 2011). The innermost ring indicates the position on the reference chromosome. Positions covered by BLASTN alignments are indicated with a solid color; whitespace gaps represent genomic regions not covered by the BLASTN alignments. For clarity, the three genetic lineages (GL 1, lablab-associated strains and GL fuscans) are separated by repetitions of the plot of G+C content. The black circle indicates the previously reported (Darrasse et al., 2013b) absence of the flagellar gene cluster in Xff 4834-R. The solid-lined black circles indicate strain-specific genomic deletions observed in the present study.
The contiguities of the assemblies were comparable to those of previously sequenced Xanthomonas genomes. This is illustrated by the distribution of N50 contig lengths, which ranged from 39.4 to 123.6 kb. The range for a recent study of 65 X. axonopodis pv. manihotis was 7.4–111.0 kb (Bart et al., 2012). A full summary of assembly statistics, calculated using Quast (Gurevich et al., 2013), is provided in the Supplementary Table S1.
Contiguity of an assembly does not necessarily correlate with accuracy. Therefore, in addition to the Quast analysis of assembly contiguity, we also assessed the accuracies of the assemblies using REAPR (Hunt et al., 2013). This method is based on aligning to the assembly the sequence reads from which it was generated. This allows detection of anomalies in coverage of the assembly by reads and flags two classes of potential errors: fragment coverage distribution (FCD) errors and low fragment coverage errors. We compared the frequencies of these two classes of potential error for each of our genome assemblies and also for each of the 65 previously published X. axonopodis pv. manihotis assemblies (Bart et al., 2012); see Supplementary Figure S1. The genome assemblies generated in the present study were of comparable quality to those from the previously published study. However, there is a general trend toward our genome assemblies having more “low fragment coverage” errors and fewer “FCD” errors.
To ascertain the phylogenetic positions of each sequenced strain, we initially used a multi-locus sequence analysis (MLSA) approach, using concatenated sequences from six genes that had been used in previous MLSA studies (Young et al., 2008; Almeida et al., 2010; Hajri et al., 2012; Hamza et al., 2012). This approach had the advantage that we could include in the analysis many Xap strains and other xanthomonads whose genomes had not been sequenced but for which MLSA data were available. Nucleotide sequences are available for these six genes from a large number of xanthomonads, either from whole-genome sequence assemblies or from the MLSA studies. We combined the publicly available sequences with homologous sequences extracted from the genomes newly sequenced for this study. The results of the MLSA revealed that the newly sequenced Xap and Xff genomes each fell into one of three distinct clades: GL 1, GL fuscans and a previously undescribed lineage associated with lablab bean (Figure 2).
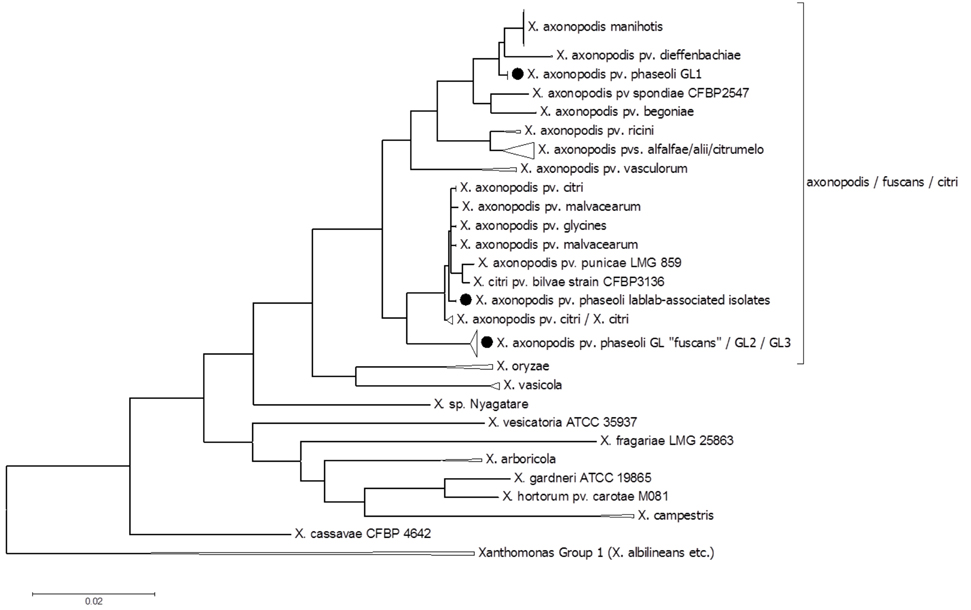
Figure 2. Multi-locus sequence analysis to determine the phylogenetic positions of the sequenced strains within the species X. axonopodis and X. fuscans. The phylogenetic tree is based on alignment of six concatenated gene sequences (atpD, dnaK, efp, fyuA, glnA, and gyrB). The sequences for NCPPB 220, 301, 1138, 1420, 1646, 1680, 1811, 3035, and CIAT XCP123 were identical to those of CFBP 412, 6164, 6546, 6982, 6983, 6984, and 6985, which are classified as belonging to “pv. phaseoli GL1” (Alavi et al., 2008; Mhedbi-Hajri et al., 2013) and genetic group 9.4 (Rademaker et al., 2005). The sequences for NCPPB 381, 670, 1056, 1058, 1158, 1402, 1433, 1495, 1654, 2665, 3660, and CIAT X621 were identical to those of CFBP 1845, and 4834-R, which are classified as “pv. phaseoli GL fuscans” (Alavi et al., 2008; Mhedbi-Hajri et al., 2013) and genetic group 9.6 (Rademaker et al., 2005). The evolutionary history was inferred by using the Maximum Likelihood method based on the General Time Reversible model (Nei and Kumar, 2000). The tree with the highest log likelihood (−17100.2449) is shown. The percentage of trees in which the associated taxa clustered together is shown next to the branches. Initial tree (s) for the heuristic search were obtained by applying the Neighbor-Joining method to a matrix of pairwise distances estimated using the Maximum Composite Likelihood (MCL) approach. The tree is drawn to scale, with branch lengths measured in the number of substitutions per site. The analysis involved 284 nucleotide sequences. All positions containing gaps and missing data were eliminated. There were a total of 2697 positions in the final dataset. Evolutionary analyses were conducted in MEGA6 (Tamura et al., 2013).
The newly sequenced strains from lablab bean comprised a third clade, quite distinct from both Xap GL1 and from GL fuscans and indeed all previously described lineages of bean pathogens. The lablab-associated strains are closely related to members of Rademaker's genetic group 9.5, along with strains of pathovars bilvae, citri, malvacearum, and mangiferaeindicae that are pathogens of diverse plants including Bengal quince, Citrus spp., cotton and mango respectively (Bradbury, 1986; Rademaker et al., 2005). Also falling within this MLSA-based clade are strains of X. axonopodis pv. glycines, causative agent of bacterial pustule in soybean (Jones, 1987).
Genome-wide SNP Analysis Elucidates Phylogeny at Greater Resolution
Based on six-gene MLSA alone, strains could be ascribed to one of the three genetic lineages (GL 1, GL fuscans, and GL lablab). However, genome-wide sequence comparisons provided additional resolution and revealed distinct clades (or sub-lineages) within each lineage. Figure 3A illustrates the distribution of single-nucleotide variations across the reference sequence of the chromosome of Xff 4834-R for 160 publicly available related genome sequences. Figure 3B shows a phylogenetic reconstruction of those 160 genomes based on those variants. Consistent with the MLSA results, the strains sequenced in the present study similarly fell into three clades.
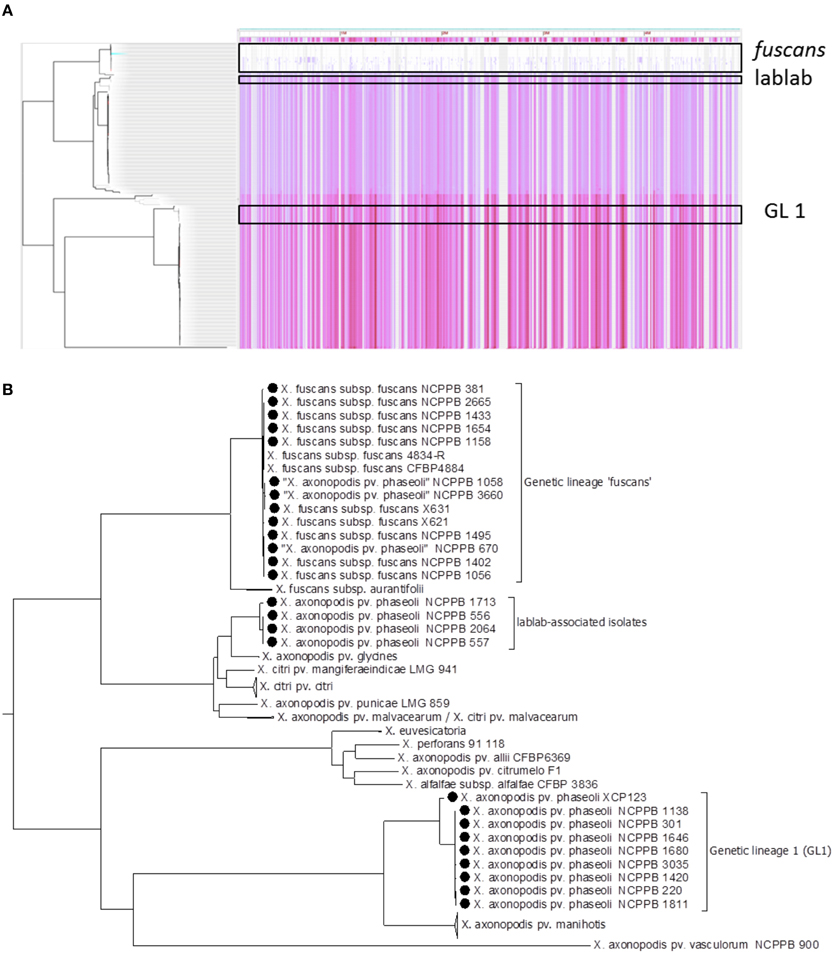
Figure 3. Genome-wide identification of single-nucleotide variations. Panel (A) shows a density plot of single-nucleotide variations paired with a phylogenetic tree, both generated using Harvest (Treangen et al., 2014) with the chromosome of Xff 4834-R (Darrasse et al., 2013b) as the reference sequence. Panel (B) shows the same phylogenetic tree as in Panel (A) but with taxon labels and some clades collapsed for clarity. In addition to the 26 newly sequenced genomes, all 134 publicly available genome assemblies from X. axonopodis, X. fuscans, X. citri, and X. euvesicatoria were included.
Within the fuscans lineage, the genome-wide comparison revealed at least three distinct sub-lineages, depicted in Figure 4 in red, blue and green respectively. Each of these three lineages includes strains from diverse geographical locations and years. For example, one sub-lineage includes strains from France (1998), Hungary (1956), Italy (1963), South Africa (1963) and the UK (1962). This suggests that this sub-lineage has been circulating in Europe for nearly six decades and has spread between Europe and South Africa at least once, perhaps indirectly via another locality. This pattern is consistent with spread of the pathogen via global trade of seeds.
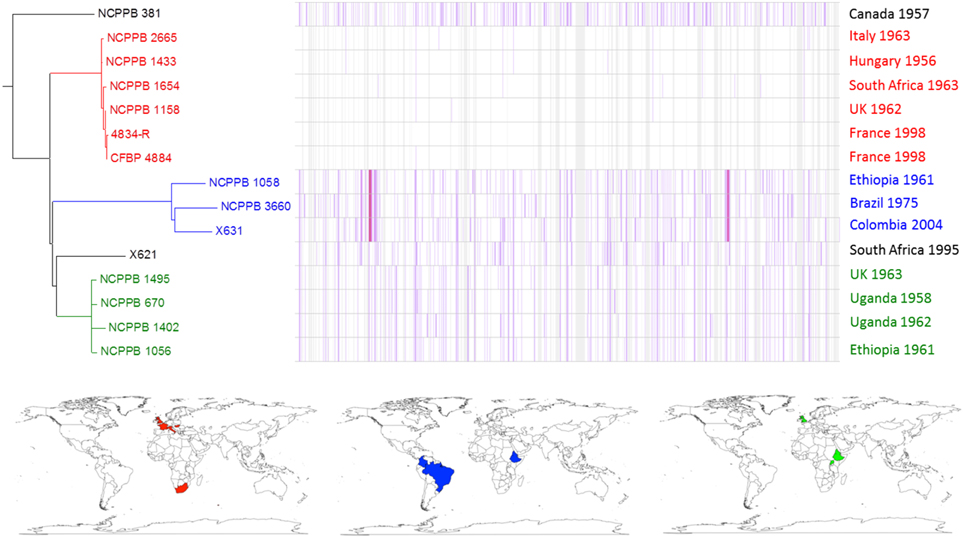
Figure 4. Single-nucleotide variation within fuscans genetic lineage. A density plot of single-nucleotide variations is shown paired with a phylogenetic tree, both generated using Harvest (Treangen et al., 2014) with the chromosome of Xff 4834-R (Darrasse et al., 2013b) as the reference sequence. The country and year of isolation is indicated for each bacterial strain. Three multi-strain sub-lineages are indicated by coloring in red, blue, and green respectively. The geographical locations of the countries of isolation are indicated on the world maps for each of the three sub-lineages, again colored respectively in red, blue, or green.
The genome-wide sequence analysis also reveals that multiple genetic lineages may be present within a single geographical area. For example, NCPPB 1056 and NCPPB 1058 were both isolated in the same country and the same year (Ethiopia, 1961) and fall into two distinct sub-lineages (Figure 4).
Similar, intra-lineage variation can be observed for strains within the lablab-associated strains (Figure 5) and GL 1 (Figure 6). Among lablab-associated strains, those collected in Sudan between 1957 and 1965 cluster together and are distinct from NCPPB 1713, which originates from Zimbabwe in 1962. Within GL 1, there are two multi-strain sub-lineages, which are indicated in blue and green in Figure 5. The former sub-lineage spans Australia, Canada, and Tanzania. The latter sub-lineage includes strains from Hungary, Romania, and the USA. Strain NCPPB 1138 (from Zambia, 1961) is distinct from both of these. The single GL 1 strain from Lima bean (CIAT XCP123, Colombia, 1974) is distinct from all of the strains from common bean (Figure 5); however, based on MLSA alone, it is indistinguishable from the other GL 1 strains.
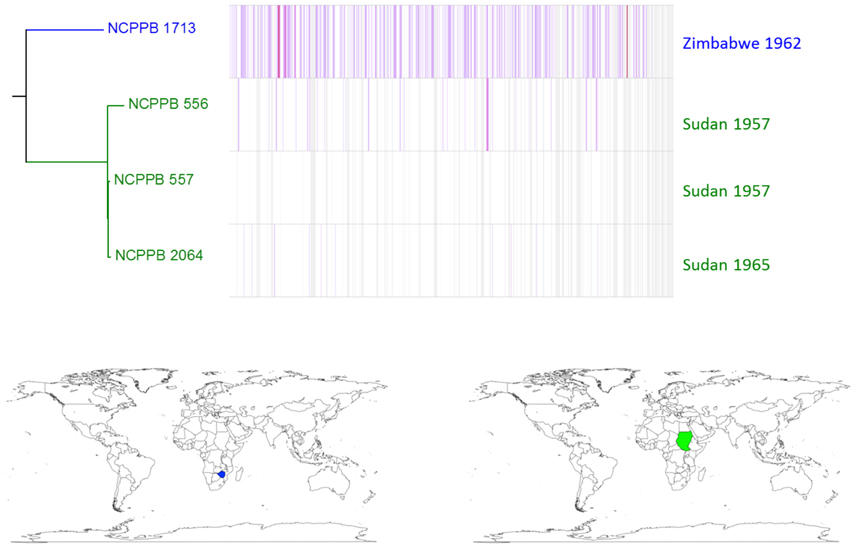
Figure 5. Single-nucleotide variation among lablab-associated strains. A density plot of single-nucleotide variations is shown paired with a phylogenetic tree, both generated using Harvest (Treangen et al., 2014) with the chromosome of NCPPB 557 as the reference sequence. The country and year of isolation is indicated for each bacterial strain. Two sub-lineages are indicated by coloring in blue (a single strain) and red (three strains) respectively. The geographical locations of the countries of isolation are indicated on the world maps for each of the three sub-lineages, again colored respectively in blue or red.
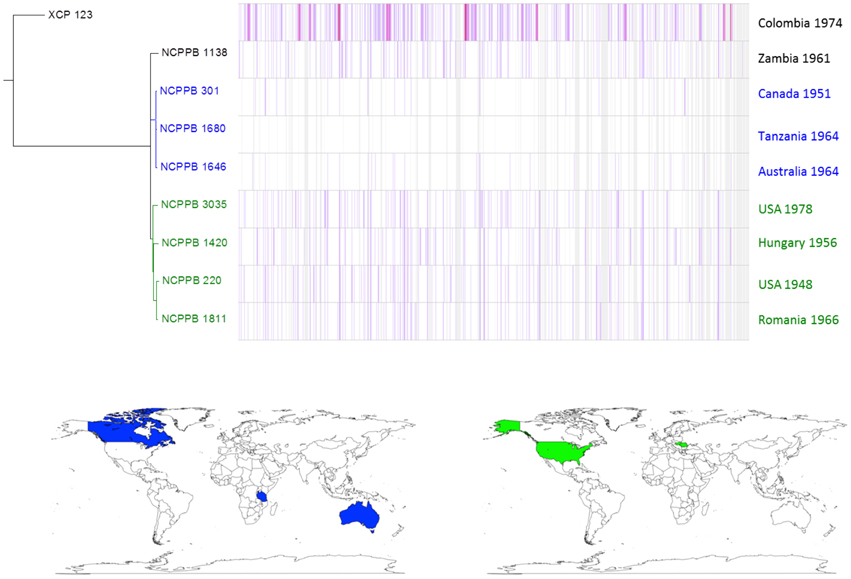
Figure 6. Single-nucleotide variation within Xap GL 1. A density plot of single-nucleotide variations is shown paired with a phylogenetic tree, both generated using Harvest (Treangen et al., 2014) with the chromosome of NCPPB 1680 as the reference sequence. The country and year of isolation is indicated for each bacterial strain. Two multi-strain sub-lineages are indicated by coloring in blue and red respectively. The geographical locations of the countries of isolation are indicated on the world maps for each of the three sub-lineages, again colored respectively in blue or red.
Across the 4,981,995-bp chromosome sequence of Xff 4834-R, Harvest identified a total of 135,321 SNPs. This number includes all single-nucleotide sites that show variation between any of the 160 genome assemblies included in the analysis. A subset of 61,462 of those SNPs showed polymorphism among the 26 Xap and Xff genomes sequenced in the present study. The Harvest SNP calling takes as its input assembled genome sequences. Thus, substitution errors in the assemblies then could appear as false positives. Gaps in the assemblies are unlikely to generate false-positive SNP calls as Harvest only considers the core genome, i.e., those regions of the genome that are present in all of the genome assemblies and discards genomic regions present in only a subset of the assemblies. To assess the reliability of the Harvest SNP calls, we compared the results with a read-based method of SNP calling that we have used previously (Mazzaglia et al., 2012; Wasukira et al., 2012; Clarke et al., 2015). Read-based methods have the advantage of not being reliant on assembly and they exploit the signal from multiple independent overlapping sequence reads at each site in the genome sequence. However, sequence reads are not available for the majority of Xanthomonas genome sequences, since for most studies only the assemblies and not the reads have been deposited in the public repositories. Of the 61,462 SNPs that Harvest called for the Xap and Xff genomes, our read-based method confirmed 53,811 (87.5%).
It is evident from Figures 3–6 that single-nucleotide variations occur throughout the chromosome. However, the distribution is not uniform and there are several apparent “hotspots” of variation. The most likely explanation for these regions of higher-than-average sequence divergence is horizontal acquisition of genetic material from relatively distantly related strains. Such incongruent patterns of sequence similarity due to horizontal transfer have been reported previously in Xanthomonas species (Fargier et al., 2011; Hamza et al., 2012).
Gene-content Varies between and within Each Clade
Consistent with the indications of horizontal genetic transfer described in the previous section, we observed significant variations in gene presence and absence among strains within each of the three genetic lineages (Figure 7). Within the fuscans strains, there were 1188 clusters of orthologous genes that were present in at least one strain and absent from at least one other (Figure 7A). Among the lablab-associated strains, 472 orthologous gene clusters showed presence-absence polymorphism (Figure 7B). Among GL 1, the number was 535 (Figure 7A). Clustering of genomes according to gene content is broadly congruent with phylogeny. Supplementary Tables S2–S7 list genes whose presence distinguishes between Xff, Xap GL 1 and lablab-associated strains. Additionally, the four lablab-associated strains all contain six genes that have no close homologs amongst other sequenced xanthomonads. These are predicted to encode: three hypothetical proteins (KHS05433.1, KKY05378.1, and KHS05434.1), pilus assembly protein PilW (KHS05489.1), an oxidoreductase (KHS05432.1), and an epimerase (KHS05485.1).
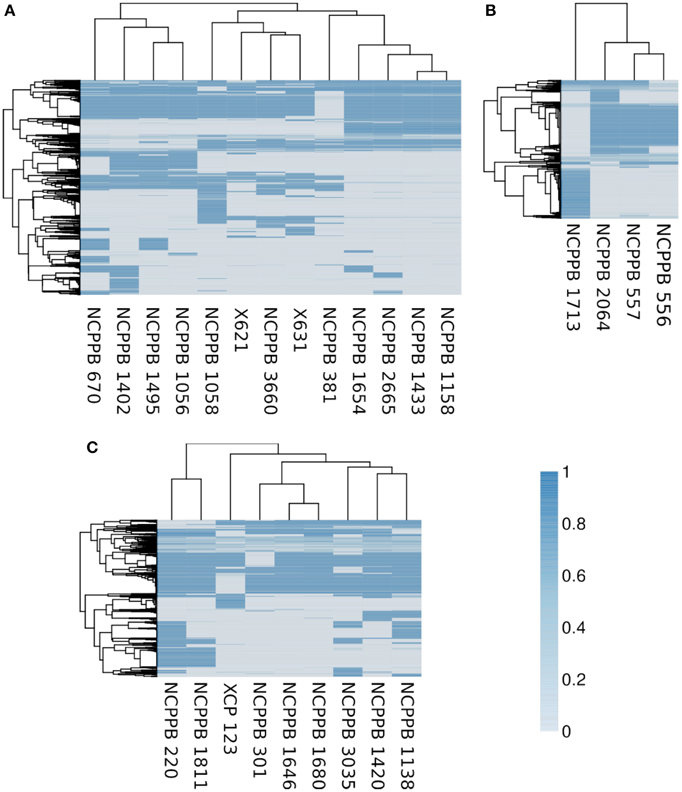
Figure 7. Variation in gene content within each genetic lineage. The heatmaps essentially indicate the presence or absence of each gene in each sequenced genome. To determine the breadth of coverage of a gene, the genomic raw sequence reads are aligned against a reference pan-genome using BWA-MEM (Li, 2013, 2014) and the breadth of coverage is calculated using coverageBed (Quinlan and Hall, 2010). A coverage of one indicates complete coverage of the gene by aligned genomic sequence reads, indicating presence of the gene. A coverage of zero indicates that no genomic sequence reads matched the gene, indicating that it is absent (or at least highly divergent in sequence). In each heatmap, the genomes (columns) are clustered according to gene content and the genes (rows) are clustered according to their patterns of presence and absence across the genomes. The core genome, i.e., the subset of genes that are present in all strains, is excluded from the heatmap. (A) Summarizes the pattern of presence and absence for 1188 genes in the fuscans lineage, (B) for 472 genes in lablab-associated strains and (C) for 535 genes in Xap GL 1. Note that each gene is the representative of a cluster of orthologous genes.
Strain-specific Large Chromosomal Deletions
A large chromosomal deletion has been previously reported in Xff 4834-R in which a large part of the flagellar gene cluster is absent (Darrasse et al., 2013b). This deletion is visible in Figure 1 at around position 2310 kb in the Xac 306 chromosome and indicated by a black circle with broken line. Although, similar deletions were reported in 5% of the strains tested (Darrasse et al., 2013b), this flagellar gene cluster was intact in all of the genomes sequenced in the current study as well as in the previously sequenced Xff 4884 (Indiana et al., 2014).
In addition to the strain-specific flagellar deletion, Figure 1 reveals several other large genomic deletions, examples of which are indicated with black circles. The largest example is a 50-kb region of the Xac 306 chromosome sequence that is absent from the three Sudanese lablab-associated strains but present in the Zimbabwe strain. This absence is visible in Figure 1 at between 4.82 and 4.87 Mb on the reference chromosome sequence and indicated by a black circle. The absence of this region is supported not only by the de novo assemblies of NCPPB 556, 557 and 2064, but also by alignment of the raw sequence reads against the Xac 306 reference genome, eliminating the possibility that it merely represents an assembly artifact. This region is illustrated in Supplementary Figure S6, includes locus tags XAC4111–XAC4147 and is predicted to encode a type-6 secretion system (Darrasse et al., 2013b).
Other examples include a deletion of approximately 9 Kb that is deleted in Xap NCPPB 3035, resulting in loss of its ortholog of gene XAC RS17930 and parts of the two flanking genes XAC_RS17925 and XAC_RS17935 at around position 4.20 Mb on the reference genome (Supplementary Figure S7). A second example of a deletion unique to NCPPB 3035 spans approximately 10 kb at around position 5.10 Mb (Supplementary Figure S8). The deleted region contains genes XAC_RS21755 (predicted plasmid stabilization protein) to XAC_RS21815 (predicted transposase) and likely represents a mobile element.
Strains of Xap GL1 Encode a SPI-1-like T3SS
A previously published suppression subtractive hybridizations study comparing bean pathogens and closely related xanthomonads revealed the presence of genes encoding several protein components of a T3SS similar to that of Salmonella pathogenicity island 1 (SPI-1) in the genome of Xap CFBP 6164 (Alavi et al., 2008). This strain is synonymous with NCPPB 1811 and belongs to lineage GL 1. Subsequently, genome sequencing revealed that X. albilineans encodes a SPI-1-like T3SS (Pieretti et al., 2009, 2015) and targeted sequencing confirmed its presence in two further Xap GL 1 strains: CFBP 2534 (same as NCPPB 3035) and CFBP 6982 (Marguerettaz et al., 2011). Whole-genome sequencing in the current study indicated that this SPI-1-like T3SS was encoded in the genomes of all GL 1 strains from common bean and Lima bean (Figure 8) but was absent from GL fuscans and from the lablab-associated strains. All of the putative structural genes for the T3SS are conserved in Xap GL 1 but the xapABCDEFGH genes, hypothesized to encode effectors that are substrates of the T3SS in X. albilineans (Marguerettaz et al., 2011), are not conserved in Xap.

Figure 8. The SPI-1-like T3SS in Xap GL 1. The figure shows a TBLASTN alignment of the X. albilineans chromosome (Pieretti et al., 2009) vs. the genome of Xap NCPPB 3035 (sequenced in the present study). Sequence identity is indicated by the black-gray-white color scale.
Repertoires of Hrp T3SS Effectors
Previous genome sequencing of Xff 4834-R revealed the presence of genes encoding 30 predicted effectors potentially secreted by the Hrp T3SS (Darrasse et al., 2013b). We searched for orthologs of these and other Xanthomonas T3SS effectors in the newly sequenced Xap and Xff genomes using TBLASTN (Altschul et al., 1990) to search the genome assemblies against each protein query sequence. The results are summarized in Figure 9. There is a core set of 14 effectors that is encoded in all sequenced strains of Xap and Xff : XopK, XopZ, XopR, XopV, XopE1, XopN, XopQ, XopAK, XopA, XopL, AvrBs2, and XopX. Four of these are also included in the core set of effectors conserved among 65 strains of X. axonopodis pv. manihotis (Bart et al., 2012), namely XopE1, XopL, XopN, and XopV. Several others are encoded in most but not all of the newly sequenced genomes, for example: XopC1, XfuTAL2, and XopJ5. Others appear to be limited to just one of the three lineages. For example, XopF2 is limited to lineage fuscans, XopC2 is found only in Xap GL1 and XopAI is restricted to the lablab-associated strains.
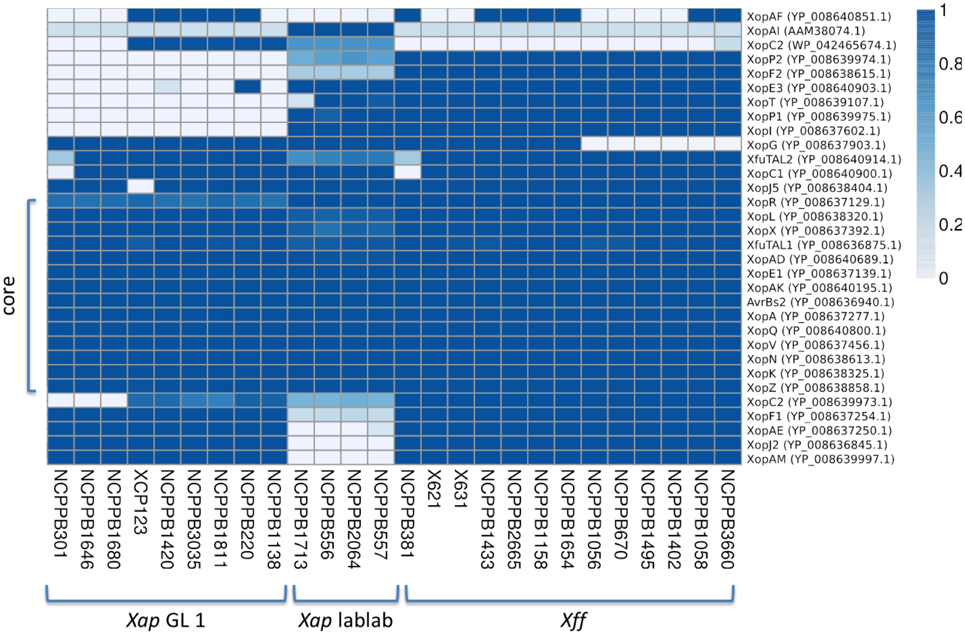
Figure 9. Repertoires of T3SS effectors. The heatmap indicates the proportion covered by aligned genomic sequence reads over each T3SS effector gene DNA sequence. GenBank accession numbers are given on the right side. Genomic sequence reads were aligned against the effector gene sequences using BWA-MEM. A coverage of 1.0 represents complete coverage, indicating that the gene is present in the respective genome. A coverage of 0.0 represents a complete absence of aligned sequence reads, indicating absence of the gene from the respective genome.
The Molecular basis for Pigmentation
Some bacterial strains from CBB infections produce a brown pigment when grown in tyrosine-containing medium and are therefore described as “fuscous.” The pigment is not believed to be directly associated with virulence (Gilbertson et al., 1991; Fourie, 2002) but fuscous strains tend to be very virulent on bean (Birch et al., 1997; Toth et al., 1998). The brown color arises from oxidized homogentisic acid (2,5 dihydroxyphenyl acetic acid), an intermediate in the tyrosine catabolic pathway that gets secreted and oxidized in these fuscous strains (Goodwin and Sopher, 1994). Genome sequencing of the fuscous strain Xff 4834-R revealed a single-nucleotide deletion in hmgA, the gene encoding homogentisate oxygenase (Darrasse et al., 2013b). This enzyme catalyzes a step in the tyrosine degradation pathway that converts tyrosine to fumarate and hence its inactivation likely disrupts tyrosine degradation leading to accumulation of homogentisate and its subsequent oxidation to form the brown pigment. Consistent with this hypothesis, we found that the single-nucleotide deletion was present in all of the sequenced strains belonging to GL fuscans resulting in a predicted protein product that is truncated, while the hmgA gene was intact in all of the Xap GL1 and lablab-associated Xap genomes (see Figure 10).
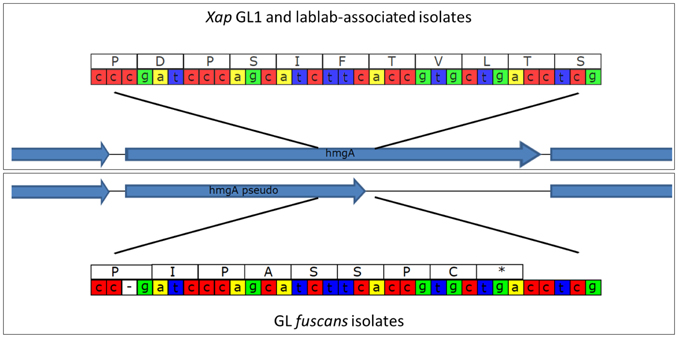
Figure 10. Disruption of the hmgA gene in GL fuscans. The cartoon illustrates a sequence polymorphism in the hmgA gene whereby all of the sequenced GL fuscans strains (including previously sequenced 4834-R and CFBP4884) have a single-nucleotide deletion that results in a frame-shift and premature stop codon. All of the Xap GL 1 and lablab-associated strains encode a full-length protein product.
Recent Genetic Exchange between Xap GL 1 and GL Fuscans
Patterns of single-nucleotide variation (Figure 3A) revealed some regions of the genome where Xap GL 1 had many fewer variants with respect to the Xff 4384-R reference genome than did the closely related X. axonopodis pv. manihotis. Closer inspection revealed numerous genes where the Xap GL 1 strains shared an identical allele with Xff, a pattern that is incongruent with their relatively distant phylogenetic relationship.
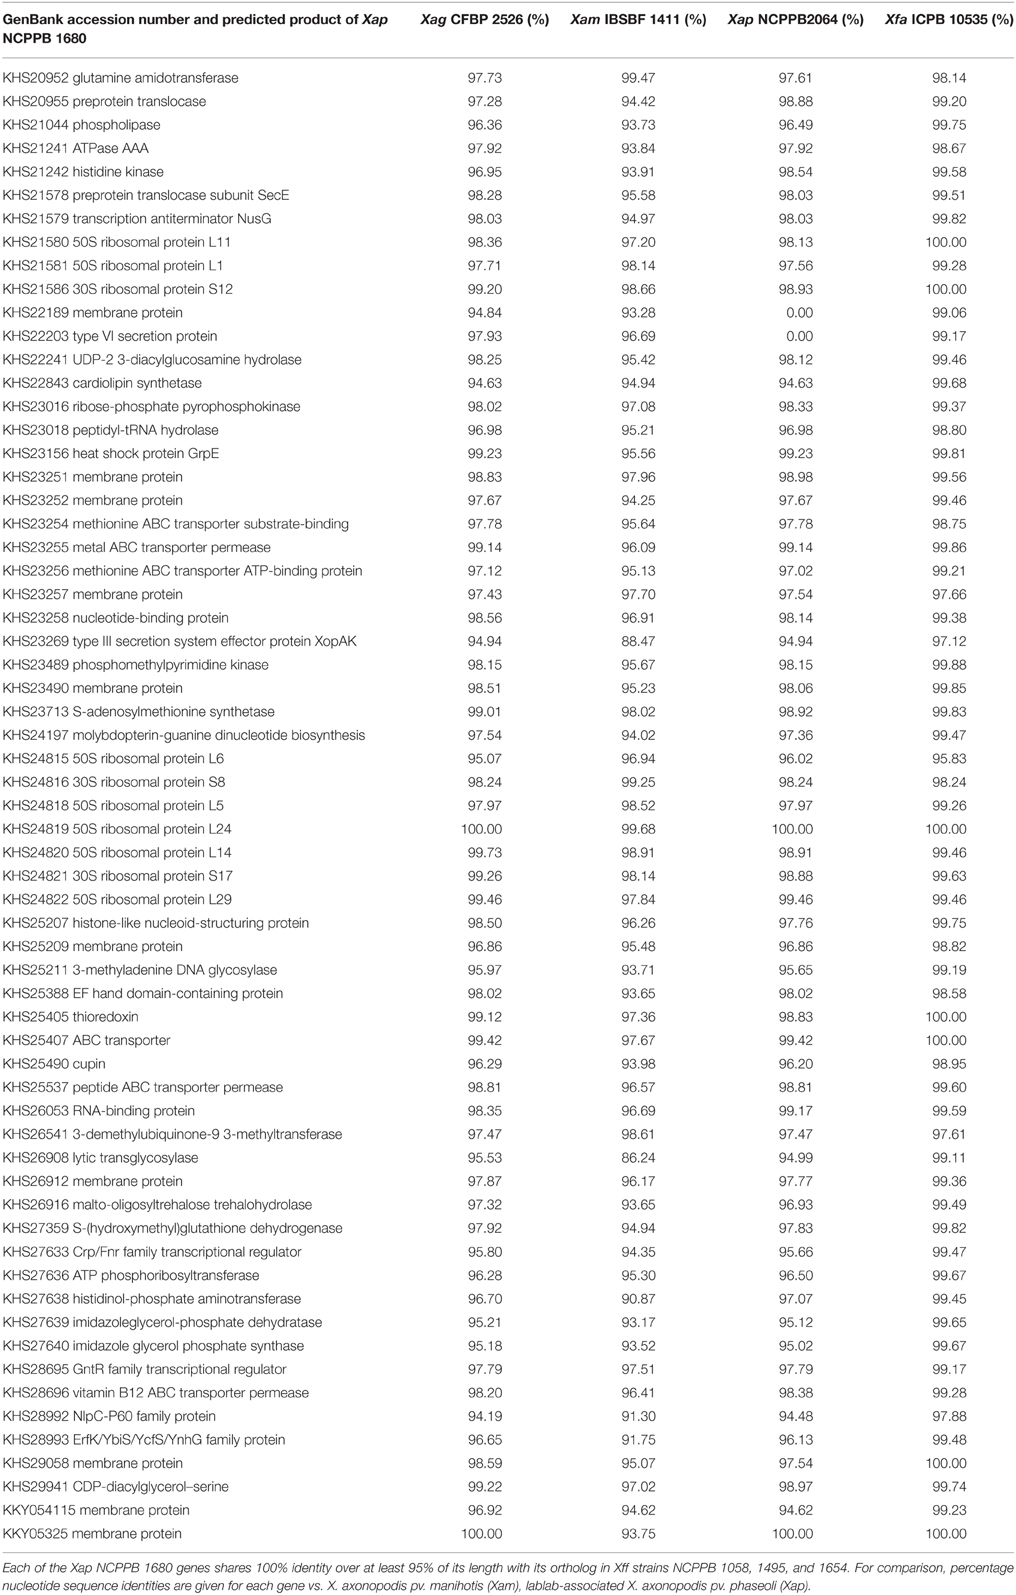
To further investigate this phenomenon, we calculated pairwise nucleotide sequence identities for each Xap GL 1 gene vs. its closest homolog in other lineages within X. axonopodis and X. fuscans. The results are summarized in Figure 11. Pairwise sequence identities between Xap GL 1 and Xff (GL fuscans) followed a bimodal distribution with peaks at around 96% and at 100%. The peak at 100% was not observed for identities between Xap GL 1 and other lineages (X. axonopodis pv. glycines, X. axonopodis pv. citri, X. axonopodis pv. manihotis, X. fuscans subsp. Aurantifolii, and lablab-associated Xap). Table 2 lists examples of genes with 100% identity between Xap GL 1 and Xff. Essentially the same set of genes is affected in all of the Xap GL 1 strains and the alleles are more similar to alleles from pathovars citri and glycines than to manihotis. Therefore, the most parsimonious explanation is that these alleles have been acquired by the ancestors of Xap GL 1 from the fuscans lineage.
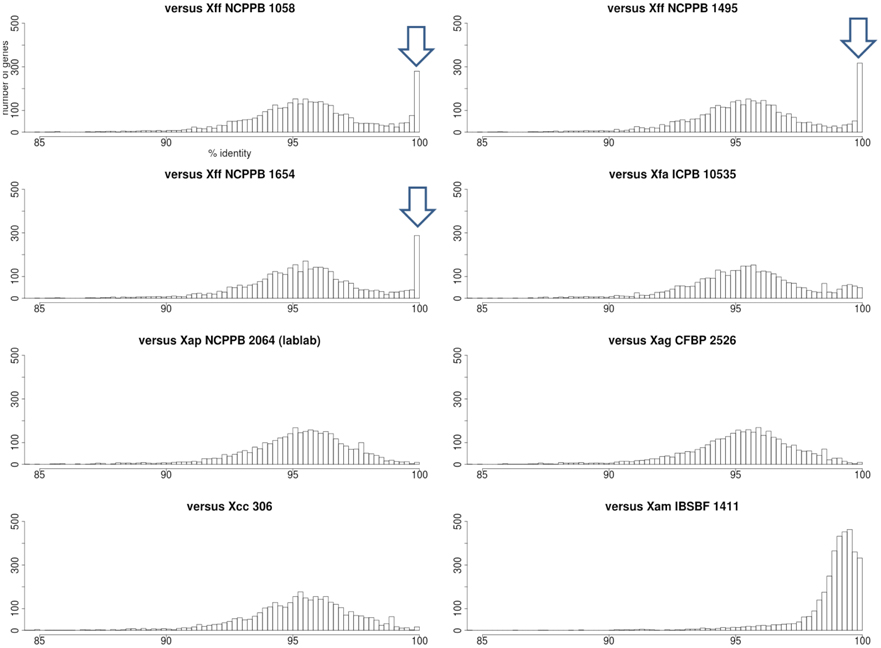
Figure 11. Nucleotide sequence identities of Xap GL 1 genes vs. other lineages and pathovars. Each histogram shows the frequency distribution of sequence identity between genes from a Xap GL 1 strain (NCPPB 1680) and their closest BLASTN matches in other lineages including GL fuscans (NCPPB 1058, 1494 and 1654), lablab-associated Xap (NCPPB 2064), X. fuscans subsp. aurantifolii (ICPB 10535), X. axonopodis pv. glycines (CFBP 2526), X. axonopodis pv. citri (306) and X. axonopodis pv. manihotis (IBSBF 1411) (Da Silva et al., 2002; Moreira et al., 2010; Bart et al., 2012; Darrasse et al., 2013a). The arrowheads indicate the positions of the peaks at 100% sequence identity between GL 1 and GL fuscans.
Genome sequencing of Xap strains from lablab bean has revealed a previously unknown distinct lineage of Xap. This lineage is more closely related to strains of X. axonopodis pv. glycines that to any of the previously described genetic lineages of Xap. The existence of a separate lablab-associated lineage on lablab suggests that there may not be frequent movement of CBB bacteria between this species and common bean. However, conformation of this hypothesis will require genotyping of larger numbers of strains; with the availability of these genome data it will be straightforward to design PCR-based assays to identify bacterial strains belonging to this newly discovered lineage.
It was previously observed that a Xap strain from common bean (NCPPB 302) was less pathogenic on lablab than bacteria isolated from naturally infected lablab (Sabet, 1959). The same study also reported that the Xap strains (Dol1, 2 and 3) were less pathogenic on common bean than was Xap NCPPB 302, hinting at the presence of distinct populations of Xap differentially adapted to different host species. Furthermore, a subsequent study found that Xap strain Dol 3, isolated from lablab in Medani, Sudan, 1965, was pathogenic only on common bean and lablab bean; it was not pathogenic on any of the other leguminous plants that were tested, including several Vigna spp., Rhynchosia memnonia, mungo bean, pigeon pea, alfalfa, butterfly pea, velvet bean, pea, and white lupin.
To the best of our knowledge, no recent quantitative data are available for the extent and severity of common bacterial blight on lablab. However, in 1959, leaf blight on this crop was reported as widespread and often severe in the Gezira and central Sudan (Sabet, 1959).
The single sequenced bacterial strain from Lima bean clearly fell within Xap GL 1, along with strains from common bean, including the pathovar type strain (NCPPB 3035). However, genome-wide phylogenetic reconstruction revealed that the Lima-associated strain was the most early-branching within this lineage and suggests that it has been genetically isolated from the population that is geographically widely dispersed on common bean (Figure 6). Again, the availability of these genomic data will facilitate development of PCR-based assays to rapidly genotype larger panels of strains to elucidate the population genetics.
The newly sequenced genomes confirm and extend previous observations (Alavi et al., 2008; Marguerettaz et al., 2011; Egan et al., 2014), suggesting that a SPI-1-like T3SS is probably universal among Xap GL 1 but absent from Xff and from the newly discovered lablab-associated lineage. We also confirm that a frame-shift in the hmgA gene, resulting in a presumably defective homogentisate 1,2-dioxygenase, is common to all sequenced strains of Xff and probably explains the accumulation of brown pigment in fuscous strains (Darrasse et al., 2013b). The hmgA gene appeared to be intact in all the GL 1 and lablab-associated strains consistent with the absence of report of pigment in these.
Previous comparative genomics studies of Xanthomonas species have highlighted the presence of rearrangements of fragments of the genome (Qian et al., 2005; Darrasse et al., 2013a). We observed no evidence of such rearrangements among the Xff, Xap GL1 nor among the lablab-associated Xap genomes sequenced in the present study (See Supplementary Figures S3–S5). However, the lack of evidence should not be interpreted as meaning that there are no such rearrangements; draft-quality genome assemblies, such as those generated in the present other related studies (Bart et al., 2012; Indiana et al., 2014; Schwartz et al., 2015), are fragmented into multiple contigs and/or scaffolds and if the breakpoints in the genomic rearrangements coincide with gaps or breakpoints in the assembly, then they would not be detected.
A previous study reported large genomic deletions in about 5% of the examined Xanthomonas strains, including Xff 4834-R, resulting in loss of flagellar motility (Darrasse et al., 2013b). Although, none of the genomes sequenced in the present study displayed this deletion, there were several other strain-specific multi-kilobase deletions (see Figure 1) suggesting that this is a relatively common phenomenon among xanthomonads.
Discussion
In the present study, we sequenced the genomes of 26 strains of the causative agents of CBB, whose times and places of isolation spanned several decades and several continents. This resource adds to the already published genome sequences of Xff 4834-R and CFBP 4884 (Darrasse et al., 2013b; Indiana et al., 2014) with a further 13 sequenced genomes. We also present the first genome sequences for Xap, including 9 strains belonging to a previously described lineage known as GL 1. These 9 sequenced GL 1 strains include 8 from common bean and one from Lima bean. We also sequenced a further four strains from lablab bean.
Our data reveal genetic sub-lineages within Xff and within Xap GL 1, each having a widely dispersed geographical distribution. The availability of these genome sequence data will be a useful source of genetic variation for use in developing molecular markers for distinguishing individual sub-lineages or genotypes and thus aiding the study of routes of pathogen spread (Vinatzer et al., 2014; Goss, 2015). We observed considerable intra-lineage variation with respect to gene content as well as single-nucleotide variations (Figures 4–7).
Whole-genome sequencing revealed the repertoires of predicted T3SS effectors. Our results (Figure 9) were consistent with a previous survey of effector genes (Hajri et al., 2009) except for two apparent discrepancies. First, we find no evidence for presence of avrRxo1 (xopAJ) in the genomes of Xap nor Xff though Hajri and colleagues found this gene in Xap GL 1. Second, genome-wide sequencing sequencing was able to distinguish between xopF1 and xopF2. We find xopF1 in both Xff and Xap GL 1 but find xopF2 only in Xff. Hajri reported presence of xopF2 in both Xff and Xap GL1; this might be explained by cross-hybrisisation of xopF1 with the xopF2 probes.
Arguably the most surprising finding to arise from the present study is the observation that Xff and Xap GL 1 share 100% identical alleles at dozens of loci even though on average most loci share only about 96% identity. This phenomenon is apparent from the bimodal distributions of sequence identities in Figure 11. This phenomenon is apparently restricted to sharing between GL 1 and Xff; no such bimodal distribution is seen between GL 1 and the lablab-associated strain not between GL 1 and X. fuscans subsp. aurantifolii (which is closely related to Xff). Furthermore, many of the alleles sharing 100% identity between GL 1 and Xff show significantly less identity between Xap GL 1 and X. axonopodis pv. manihotis, despite the close phylogenetic relationship between these last two. On the other hand, these shared sequences are more similar to sequences from X. fuscans subsp. aurantifolii than to sequence from X. axonopodis pv. manihotis, suggesting that they were acquired by Xap GL 1 from Xff rather than vice versa. Examples are listed in Table 2. It remains to be tested whether these alleles are adaptive for survival on a common ecological niche.
Conflict of Interest Statement
The authors declare that the research was conducted in the absence of any commercial or financial relationships that could be construed as a potential conflict of interest.
Acknowledgments
We are grateful for assistance from Jayne Hall, Erin Lewis and James Chisholm as well as the curators of NCPPB at Fera and Carlos Jara who kindly provided the CIAT strains and information about their origins. Genome sequencing was supported by the Canadian International Development Agency (Department of Foreign Affairs, Trade, and Development) grant to Pan-Africa Bean Research Alliance. VA was supported on this work by the BBSRC SCPRID Bean Grant BB/J011568/1. JH was supported by a BBSRC PhD studentship. DS was supported by BBSRC Grant BB/L012499/1.
Supplementary Material
The Supplementary Material for this article can be found online at: http://journal.frontiersin.org/article/10.3389/fmicb.2015.01080
Footnotes
1. ^Andrews, S. FastQC A Quality Control tool for High Throughput Sequence Data. Available online at: http://www.bioinformatics.babraham.ac.uk/projects/fastqc/ [Accessed May 13, 2015].
References
Alavi, S. M., Sanjari, S., Durand, F., Brin, C., Manceau, C., and Poussier, S. (2008). Assessment of the genetic diversity of Xanthomonas axonopodis pv. phaseoli and Xanthomonas fuscans subsp. fuscans as a basis to identify putative pathogenicity genes and a type III secretion system of the SPI-1 family by multiple suppression subtractive h. Appl. Environ. Microbiol. 74, 3295–3301. doi: 10.1128/AEM.02507-07
Alfano, J. R., and Collmer, A. (1997). The type III (Hrp) secretion pathway of plant pathogenic bacteria: trafficking harpins, Avr proteins, and death. J. Bacteriol. 179, 5655–5662.
Alfano, J. R., and Collmer, A. (2004). Type III secretion system effector proteins: double agents in bacterial disease and plant defense. Annu. Rev. Phytopathol. 42, 385–414. doi: 10.1146/annurev.phyto.42.040103.110731
Alikhan, N.-F., Petty, N. K., Ben Zakour, N. L., and Beatson, S. A. (2011). BLAST Ring Image Generator (BRIG): simple prokaryote genome comparisons. BMC Genomics 12:402. doi: 10.1186/1471-2164-12-402
Almeida, N. F., Yan, S., Cai, R., Clarke, C. R., Morris, C. E., Schaad, N. W., et al. (2010). PAMDB, a multilocus sequence typing and analysis database and website for plant-associated microbes. Phytopathology 100, 208–215. doi: 10.1094/PHYTO-100-3-0208
Altschul, S. F., Gish, W., Miller, W., Myers, E. W., and Lipman, D. J. (1990). Basic local alignment search tool. J. Mol. Biol. 215, 403–410. doi: 10.1016/S0022-2836(05)80360-2
Aronesty, E. (2011). ea-utils?: Command-line Tools for Processing Biological Sequencing Data. Available online at: http://code.google.com/p/ea-utils
Mahdi, A. A., and Atabani, I. M. A. (1992). Response of Bradyrhizobium-inoculated soyabean and lablab bean to inoculation with vesicular-arbuscular mycorrhizae. Exp. Agric. 28, 399. doi: 10.1017/S001447970002010X
Bankevich, A., Nurk, S., Antipov, D., Gurevich, A. A., Dvorkin, M., Kulikov, A. S., et al. (2012). SPAdes: a new genome assembly algorithm and its applications to single-cell sequencing. J. Comput. Biol. 19, 455–477. doi: 10.1089/cmb.2012.0021
Bart, R., Cohn, M., Kassen, A., McCallum, E. J., Shybut, M., Petriello, A., et al. (2012). High-throughput genomic sequencing of cassava bacterial blight strains identifies conserved effectors to target for durable resistance. Proc. Natl. Acad. Sci. U.S.A. 109, E1972–E1979. doi: 10.1073/pnas.1208003109
Birch, P. R. J., Hyman, L. J., Taylor, R., Opio, A, F., Bragard, C., and Toth, I. K. (1997). RAPD PCR-based differentiation of Xanthomonas campestris pv. phaseoli and Xanthomonas campestris pv. phaseoli var. fuscans. Eur. J. Plant Pathol. 103, 809–814.
Bradbury, J. F. (1986). Guide to Plant Pathogenic Bacteria. CAB International Available online at: http://www.cabdirect.org/abstracts/19871324885.html;jsessionid=D5C161DFDC715BFA77A16BC4EE1BF1AE [Accessed July 19, 2014]
Bull, C. T., De Boer, S. H., Denny, T. P., Firrao, G., Fischer-Le Saux, M., Saddler, G. S., et al. (2012). List of new names of plant pathogenic bacteria (2008-2010). J. Plant Pathol. 94, 21–27. doi: 10.4454/JPP.V96I2.026
Clarke, C. R., Studholme, D. J., Hayes, B., Runde, B., Weisberg, A., Cai, R., et al. (2015). Genome-enabled phylogeographic investigation of the quarantine pathogen ralstonia solanacearum race 3 biovar 2 and screening for sources of resistance against its core effectors. Phytopathology 105, 597–607. doi: 10.1094/PHYTO-12-14-0373-R
Darling, A. C. E., Mau, B., Blattner, F. R., and Perna, N. T. (2004). Mauve: multiple alignment of conserved genomic sequence with rearrangements. Genome Res. 14, 1394–1403. doi: 10.1101/gr.2289704
Darrasse, A., Bolot, S., Serres-Giardi, L., Charbit, E., Boureau, T., Fisher-Le Saux, M., et al. (2013a). High-quality draft genome sequences of Xanthomonas axonopodis pv. glycines Strains CFBP 2526 and CFBP 7119. Genome Announc. 1:e01036-13. doi: 10.1128/genomeA.01036-13
Darrasse, A., Carrère, S., Barbe, V., Boureau, T., Arrieta-Ortiz, M. L., Bonneau, S., et al. (2013b). Genome sequence of Xanthomonas fuscans subsp. fuscans strain 4834-R reveals that flagellar motility is not a general feature of xanthomonads. BMC Genomics 14:761. doi: 10.1186/1471-2164-14-761
Da Silva, A. C. R., Ferro, J. A., Reinach, F. C., Farah, C. S., Furlan, L. R., Quaggio, R. B., et al. (2002). Comparison of the genomes of two Xanthomonas pathogens with differing host specificities. Nature 417, 459–463. doi: 10.1038/417459a
Edgar, R. C. (2004). MUSCLE: multiple sequence alignment with high accuracy and high throughput. Nucleic Acids Res. 32, 1792–1797. doi: 10.1093/nar/gkh340
Edgar, R. C. (2010). Search and clustering orders of magnitude faster than BLAST. Bioinformatics 26, 2460–2461. doi: 10.1093/bioinformatics/btq461
Egan, F., Barret, M., and O'Gara, F. (2014). The SPI-1-like Type III secretion system: more roles than you think. Front. Plant Sci. 5:34. doi: 10.3389/fpls.2014.00034
Fargier, E., Saux, M. F.-L., and Manceau, C. (2011). A multilocus sequence analysis of Xanthomonas campestris reveals a complex structure within crucifer-attacking pathovars of this species. Syst. Appl. Microbiol. 34, 156–165. doi: 10.1016/j.syapm.2010.09.001
Fourie, D. (2002). Distribution and severity of bacterial diseases on dry beans (Phaseolus vulgaris L.) in South Africa. J. Phytopathol. 150, 220–226. doi: 10.1046/j.1439-0434.2002.00745.x
Fourie, D., and Herselman, L. (2011). Pathogenic and genetic variation in Xanthomonas axonopodis pv. Phaseoli and its fuscans variant in Southern Africa. African Crop Sci. J. 19, 393–407. doi: 10.4314/acsj.v19i4
Galán, J. E., and Collmer, A. (1999). Type III secretion machines: bacterial devices for protein delivery into host cells. Science 284, 1322–1328.
Gilbertson, R. L., Otoya, M. M., Pastor-Corrales, M. A., and Maxwell, D. P. (1991). Genetic diversity in common blight bacteria is revealed by cloned repetitive DNA sequences. Ann. Rep. Bean Impr. Conf. 34, 37–38.
Goodwin, P. H., and Sopher, C. R. (1994). Brown pigmentation of Xanthomonas campestris pv. phaseoli associated with homogentisic acid. Can. J. Microbiol. 40, 28–34. doi: 10.1139/m94-005
Goss, E. M. (2015). Genome-enabled analysis of plant-pathogen migration. Annu. Rev. Phytopathol. 53, 121–135. doi: 10.1146/annurev-phyto-080614-115936
Grant, S. R., Fisher, E. J., Chang, J. H., Mole, B. M., and Dangl, J. L. (2006). Subterfuge and manipulation: type III effector proteins of phytopathogenic bacteria. Annu. Rev. Microbiol. 60, 425–449. doi: 10.1146/annurev.micro.60.080805.142251
Gurevich, A., Saveliev, V., Vyahhi, N., and Tesler, G. (2013). QUAST: quality assessment tool for genome assemblies. Bioinformatics 29, 1072–1075. doi: 10.1093/bioinformatics/btt086
Hajri, A., Brin, C., Hunault, G., Lardeux, F., Lemaire, C., Manceau, C., et al. (2009). A “repertoire for repertoire” hypothesis: repertoires of type three effectors are candidate determinants of host specificity in Xanthomonas. PLoS ONE 4:e6632. doi: 10.1371/journal.pone.0006632
Hajri, A., Brin, C., Zhao, S., David, P., Feng, J.-X., Koebnik, R., et al. (2012). Multilocus sequence analysis and type III effector repertoire mining provide new insights into the evolutionary history and virulence of Xanthomonas oryzae. Mol. Plant Pathol. 13, 288–302. doi: 10.1111/j.1364-3703.2011.00745.x
Hunt, M., Kikuchi, T., Sanders, M., Newbold, C., Berriman, M., and Otto, T. D. (2013). REAPR: a universal tool for genome assembly evaluation. Genome Biol. 14:R47. doi: 10.1186/gb-2013-14-5-r47
Indiana, A., Briand, M., Arlat, M., Gagnevin, L., Koebnik, R., Noël, L. D., et al. (2014). Draft Genome Sequence of the Flagellated Xanthomonas fuscans subsp. fuscans Strain CFBP 4884. Genome Announc. 2, e00966–14. doi: 10.1128/genomeA.00966-14
Jones, S. B. (1987). Bacterial pustule disease of soybean: microscopy of pustule development in a susceptible cultivar. Phytopathology 77:266. doi: 10.1094/Phyto-77-266
Kay, S., and Bonas, U. (2009). How Xanthomonas type III effectors manipulate the host plant. Curr. Opin. Microbiol. 12, 37–43. doi: 10.1016/j.mib.2008.12.006
Li, H. (2013). Aligning Sequence Reads, Clone Sequences and Assembly Contigs with BWA-MEM. 3. Available online at: http://arxiv.org/abs/1303.3997 [Accessed July 20, 2014].
Li, H. (2014). Toward better understanding of artifacts in variant calling from high-coverage samples. Bioinformatics 30, 1–9. doi: 10.1093/bioinformatics/btu356
Li, H., and Durbin, R. (2009). Fast and accurate short read alignment with Burrows-Wheeler transform. Bioinformatics 25, 1754–1760. doi: 10.1093/bioinformatics/btp324
Li, H., Handsaker, B., Wysoker, A., Fennell, T., Ruan, J., Homer, N., et al. (2009). The sequence alignment/map format and SAMtools. Bioinformatics 25, 2078–2079. doi: 10.1093/bioinformatics/btp352
Magoč, T., and Salzberg, S. L. (2011). FLASH: fast length adjustment of short reads to improve genome assemblies. Bioinformatics 27, 2957–2963. doi: 10.1093/bioinformatics/btr507
Marguerettaz, M., Pieretti, I., Gayral, P., Puig, J., Brin, C., Cociancich, S., et al. (2011). Genomic and evolutionary features of the SPI-1 type III secretion system that is present in Xanthomonas albilineans but is not essential for xylem colonization and symptom development of sugarcane leaf scald. Mol. Plant Microbe. Interact. 24, 246–259. doi: 10.1094/MPMI-08-10-0188
Mazzaglia, A., Studholme, D. J., Taratufolo, M. C., Cai, R., Almeida, N. F., Goodman, T., et al. (2012). Pseudomonas syringae pv. actinidiae (PSA) strains from recent bacterial canker of kiwifruit outbreaks belong to the same genetic lineage. PLoS ONE 7:e36518. doi: 10.1371/journal.pone.0036518
Mhedbi-Hajri, N., Hajri, A., Boureau, T., Darrasse, A., Durand, K., Brin, C., et al. (2013). Evolutionary history of the plant pathogenic bacterium Xanthomonas axonopodis. PLoS ONE 8:e58474. doi: 10.1371/journal.pone.0058474
Moreira, L. M., Almeida, N. F., Potnis, N., Digiampietri, L. A., Adi, S. S., Bortolossi, J. C., et al. (2010). Novel insights into the genomic basis of citrus canker based on the genome sequences of two strains of Xanthomonas fuscans subsp. aurantifolii. BMC Genomics 11:238. doi: 10.1186/1471-2164-11-238
Nei, M., and Kumar, S. (2000). Molecular Evolution and Phylogenetics. Oxford University Press. Available online at: https://books.google.com/books?hl=en&lr=&id=vtWW9bmVd1IC&pgis=1 [Accessed May 13, 2015].
Parkinson, N., Cowie, C., Heeney, J., and Stead, D. (2009). Phylogenetic structure of Xanthomonas determined by comparison of gyrB sequences. Int. J. Syst. Evol. Microbiol. 59, 264–274. doi: 10.1099/ijs.0.65825-0
Pieretti, I., Pesic, A., Petras, D., Royer, M., Süssmuth, R. D., and Cociancich, S. (2015). What makes Xanthomonas albilineans unique amongst xanthomonads? Front. Plant Sci. 6:289. doi: 10.3389/fpls.2015.00289
Pieretti, I., Royer, M., Barbe, V., Carrere, S., Koebnik, R., Cociancich, S., et al. (2009). The complete genome sequence of Xanthomonas albilineans provides new insights into the reductive genome evolution of the xylem-limited Xanthomonadaceae. BMC Genomics 10:616. doi: 10.1186/1471-2164-10-616
Price, M. N., Dehal, P. S., and Arkin, A. P. (2010). FastTree 2 - Approximately maximum-likelihood trees for large alignments. PLoS ONE 5:e9460. doi: 10.1371/journal.pone.0009490
Qian, W., Jia, Y., Ren, S. X., He, Y. Q., Feng, J., Lu, L., et al. (2005). Comparative and functional genomic analyses of the pathogenicity of phytopathogen. Genome Res. 15, 757–767. doi: 10.1101/gr.3378705
Quinlan, A. R., and Hall, I. M. (2010). BEDTools: a flexible suite of utilities for comparing genomic features. Bioinformatics 26, 841–842. doi: 10.1093/bioinformatics/btq,033
Rademaker, J. L. W., Louws, F. J., Schultz, M. H., Rossbach, U., Vauterin, L., Swings, J., et al. (2005). A comprehensive species to strain taxonomic framework for xanthomonas. Phytopathology 95, 1098–1111. doi: 10.1094/PHYTO-95-1098
R Development Core Team R. (2013). R: a language and environment for statistical computing. R Found. Stat. Comput. 1, 409. doi: 10.1007/978-3-540-74686-7
Hamza, A. A., Robene-Soustrade, I., Jouen, E., Lefeuvre, P., Chiroleu, F., Fisher-Le Saux, M., et al. (2012). MultiLocus sequence analysis- and amplified fragment length polymorphism-based characterization of xanthomonads associated with bacterial spot of tomato and pepper and their relatedness to Xanthomonas species. Syst. Appl. Microbiol. 35, 183–190. doi: 10.1016/j.syapm.2011.12.005
Rodriguez-R, L. M., Grajales, A., Arrieta-Ortiz, M., Salazar, C., Restrepo, S., and Bernal, A. (2012). Genomes-based phylogeny of the genus Xanthomonas. BMC Microbiol. 12:43. doi: 10.1186/1471-2180-12-43
Ryan, R. P., Vorhölter, F.-J., Potnis, N., Jones, J. B., Van Sluys, M.-A., Bogdanove, A. J., et al. (2011). Pathogenomics of Xanthomonas: understanding bacterium-plant interactions. Nat. Rev. Microbiol. 9, 344–355. doi: 10.1038/nrmicro2558
Sabet, K. A. (1959). Studies in the bacterial diseases of Sudan crops III. On the occurrence, host range and taxonomy of the bacteria causing leaf blight diseases of certain leguminous plants. Ann. Appl. Biol. 47, 318–331.
Schaad, N. W., Postnikova, E., Lacy, G. H., Sechler, A., Agarkova, I., Stromberg, P. E., et al. (2005). Reclassification of Xanthomonas campestris pv. citri (ex Hasse 1915) Dye 1978 forms A, B/C/D, and E as X. smithii subsp. citri (ex Hasse) sp. nov. nom. rev. comb. nov., X. fuscans subsp. aurantifolii (ex Gabriel 1989) sp. nov. nom. rev. comb. nov., and X. Syst. Appl. Microbiol. 28, 494–518. doi: 10.1016/j.syapm.2005.03.017
Schaaffhausen, R. V. (1963). Dolichos lablab or hyacinth bean: - Its uses for feed, food and soil improvement. Econ. Bot. 17, 146–153. doi: 10.1007/BF02985365
Schwartz, A. R., Potnis, N., Timilsina, S., Wilson, M., Patane, J., Martins, J. J., et al. (2015). Phylogenomics of Xanthomonas field strains infecting pepper and tomato reveals diversity in effector repertoires and identifies determinants of host specificity. Front. Microbiol. 6:535. doi: 10.3389/fmicb.2015.00535
Tamura, K., Stecher, G., Peterson, D., Filipski, A., and Kumar, S. (2013). MEGA6: molecular evolutionary genetics analysis version 6.0. Mol. Biol. Evol. 30, 2725–2729. doi: 10.1093/molbev/mst,197
Tarr, S. A. J. (1958). Experiments in the Sudan Gezira on control of wilt of dolichos bean (Dolichos lablab) associated with attack by cockshafer grubs (Scizonya sp.). Ann. Appl. Biol. 46, 630–638. doi: 10.1111/j.1744-7348.1958.tb02246.x
Taylor, J. D., Teverson, D. M., Allen, D. J., and Pastor Corrales, M. A. (1996). Identification and origin of races of Pseudomonas syringae pv. phaseolicola from Africa and other bean growing areas. Plant Pathol. 45, 469–478. doi: 10.1046/j.1365-3059.1996.d01-147.x
Thorvaldsdóttir, H., Robinson, J. T., and Mesirov, J. P. (2013). Integrative Genomics Viewer (IGV): high-performance genomics data visualization and exploration. Briefings Bioinforma. 14, 178–192. doi: 10.1093/bib/bbs017
Toth, I. K., Hyman, L. J., Taylor, R., and Birch, P. R. J. (1998). PCR-based detection of Xanthomonas campestris pv. phaseoli var. fuscans in plant material and its differentiation from X. c. pv. phaseoli. J. Appl. Microbiol. 85, 327–336. doi: 10.1046/j.1365-2672.1998.00514.x
Treangen, T. J., Ondov, B. D., Koren, S., and Phillippy, A. M. (2014). The Harvest suite for rapid core-genome alignment and visualization of thousands of intraspecific microbial genomes. Genome Biol. 15:524. doi: 10.1186/s13059-014-0524-x
Vinatzer, B. A., Monteil, C. L., and Clarke, C. R. (2014). Harnessing population genomics to understand how bacterial pathogens emerge, adapt to crop hosts, and disseminate. Annu. Rev. Phytopathol. 52, 19–43. doi: 10.1146/annurev-phyto-102313-045907
Wasukira, A., Tayebwa, J., Thwaites, R., Paszkiewicz, K., Aritua, V., Kubiriba, J., et al. (2012). Genome-wide sequencing reveals two major sub-lineages in the genetically monomorphic pathogen xanthomonas campestris pathovar musacearum. Genes (Basel) 3, 361–377. doi: 10.3390/genes3030361
Keywords: beans, Phaseolus vulgaris, Phaseolus lunatus, Lablab purpureus, Dolichos lablab, Xanthomonas fuscans, Xanthomonas axonopodis
Citation: Aritua V, Harrison J, Sapp M, Buruchara R, Smith J and Studholme DJ (2015) Genome sequencing reveals a new lineage associated with lablab bean and genetic exchange between Xanthomonas axonopodis pv. phaseoli and Xanthomonas fuscans subsp. fuscans. Front. Microbiol. 6:1080. doi: 10.3389/fmicb.2015.01080
Received: 30 May 2015; Accepted: 22 September 2015;
Published: 07 October 2015.
Edited by:
Nicolas Denancé, Institut National de la Recherche Agronomique, FranceReviewed by:
Dennis Gross, Texas A&M University, USAMarie-Agnès Jacques, Institut National de la Recherche Agronomique, France
Copyright © 2015 Aritua, Harrison, Sapp, Buruchara, Smith and Studholme. This is an open-access article distributed under the terms of the Creative Commons Attribution License (CC BY). The use, distribution or reproduction in other forums is permitted, provided the original author(s) or licensor are credited and that the original publication in this journal is cited, in accordance with accepted academic practice. No use, distribution or reproduction is permitted which does not comply with these terms.
*Correspondence: David J. Studholme, Biosciences, University of Exeter, Stocker Road, Exeter EX4 4QD, UK,ZC5qLnN0dWRob2xtZUBleGV0ZXIuYWMudWs=
 Valente Aritua1
 James Harrison
 Robin Buruchara
 Julian Smith
 David J. Studholme