
94% of researchers rate our articles as excellent or good
Learn more about the work of our research integrity team to safeguard the quality of each article we publish.
Find out more
ORIGINAL RESEARCH article
Front. Met. Alloy, 19 July 2024
Sec. Physical Metallurgy
Volume 3 - 2024 | https://doi.org/10.3389/ftmal.2024.1397636
 Jonathon Bracci1*
 Kevin Kaufmann1,2
 Jesse Schlatter1
 James Vecchio1
 Naixie Zhou1
 Sicong Jiang1
 Kenneth S. Vecchio1,2Justin Cheney1
Metal-based additive manufacturing offers potential to disrupt the manufacturing process across multiple industries. However, the vast majority of modern alloys are incompatible with the complex thermal histories of additive manufacturing. For example, the high gamma prime forming nickel-based superalloys are of considerable commercial interest owing to their properties; however, their gamma prime content renders them non-weldable and prone to cracking during additive manufacturing. Computational materials modeling and big data analytics is becoming an increasingly valuable tool for developing new alloys for additive manufacturing. This work reports the use of such tools toward the design of a high gamma prime superalloy with reduced cracking susceptibility while maintaining similar hardness to CM247. Experimental fabrication and characterization of the candidate alloys is performed. Results show the candidate alloys have improved printability, up to 41x reduction in crack density (mm/mm2) compared with CM247, and good agreement with the modeled predictions.
The development of computational materials design using the CALPHAD (CALculation of PHAse Diagrams) method has become a common tool used by material scientists and engineers in the design and development of new alloys (Kattner, 1997). Utilizing the CALPHAD method has the possibility of generating large amounts of data, an aspect that is often not fully utilized toward materials design. This becomes especially apparent when considering complex alloy systems such as Ni-based superalloys. Most modern Ni-based superalloys can contain 10–15 elements and slight compositional changes in any of these elements can drastically affect the performance of the alloy. Naturally, the next progression of computational materials design is linking big data processing with the CALPHAD method to generate large-scale data and extract useful information for alloying decisions. Big data processing allows for the managing, storage, and analysis of large data sets, which can be paired with screening and visualization tools to sort through the complex materials data set and guide decision making. The CALPHAD and big data approach has been successfully proven in the design and development of new nanocrystalline, amorphous, and thermal spray coating alloys (Cheney and Kusinski, 2012; Cheney, 2018; Yi Wang et al., 2019; Liu, 2020). In many cases, this approach allows for the “clean sheet” design of an alloy (Jena et al., 2021; Bandyopadhyay et al., 2022; Dreano et al., 2022) in contrast to the more typical local optimization of a known alloy (Martin et al., 2017; Park et al., 2022).
Additive manufacturing (AM), including direct energy deposition (DED) and laser powder bed fusion (LPBF), have continued to gain momentum as a viable manufacturing process for industrial, automotive, and aerospace components (Blakey-Milner et al., 2021). To take full advantage of the benefits of advanced manufacturing processes, it is necessary to pair the process with materials specifically designed for additive manufacturing. Such advantages over conventional casting or forging techniques include the ability to produce complex geometries, increased component design freedoms, near-net-shape components, minimal post processing steps, and low material waste (Kruth et al., 1998). Many Fe-based, Ni-based, Ti-based, and Al-based alloys are applied in commercial manufacturing, primarily utilizing LPBF (Santos et al., 2006; Elsayed et al., 2019; Qian and Gu, 2022). LPBF and DED are processes in which powder is solidified by a laser layer-by-layer to form a three-dimensional component based on a CAD model (Dass and Moridi, 2019; Leary et al., 2021; Svetlizky et al., 2021; Yadroitsev et al., 2021; Yadroitsev and Yadroitsava, 2021). During AM, the component is subjected to high heating and cooling rates resulting in the build-up of residual stresses. These residual stresses can then lead to crack formation in the component and generally can be characterized as solidification cracking or strain-age cracking. Solidification cracking or hot cracking occurs during solidification of the alloy (Zhang and Singer, 2002). As the metal solidifies, high heating and cooling rates associated with AM causes tensile stresses to act on the solidifying layer. If enough liquid is present, these stresses can cause shrinkage cracks to form in the liquid region of the solidifying microstructure. The high-performance nickel-based superalloys with high gamma prime concentrations (i.e., generally greater than 40% phase fraction), are also susceptible to strain-age cracking. As examples, many of the non-weldable Ni-based superalloys such as CM247, Rene80, and IN713C are difficult to print crack free. Generally, the AM crack susceptibility of these non-weldable alloys is attributed to the high gamma prime content (Divya et al., 2016; Boswell et al., 2019; Zhou et al., 2020; Alhuzaim et al., 2021). The high gamma prime content is essential for the high temperature strength, oxidation and creep resistance associated with gamma prime superalloys.
The high complexity of Ni-based superalloys and the unique process history of AM poses a unique and difficult challenge which is well suited for a big data computational alloy development approach. This study demonstrates the application of CALPHAD coupled with data mining toward clean sheet development of a nickel-based superalloy with microstructure and properties similar to existing high-performance aerospace alloys (e.g., CM247, Rene80, and IN713) but with improved printability (i.e., reduced cracking susceptibility). The selected candidate alloys are benchmarked against CM247 during DED-based additive manufacturing. The candidate alloy feedstocks are prepared by blending elemental and alloy powders to achieve the target composition. A portion of this report is dedicated to demonstrating the challenges (e.g., un-melted powder) and their remediation with this approach to AM feedstock production during materials design. In addition to measuring the as-printed crack density, hardness is also evaluated and compared with CM247 samples printed under the same conditions.
To support the thermodynamics-driven framework, the CALPHAD calculations, data mining, and visualizations were built on the Scoperta Rapid Alloy Design (RAD) platform (Vecchio and Cheney, 2019). Thermodynamic models from Thermo-Calc’s TCNI8 database (Andersson et al., 2002) are used to generate data for discrete alloy compositions. The thermodynamic data generated is a prediction of a discrete alloy’s microstructure (e.g., phase fractions), which can be linked to expected performance characteristics. As the number of discrete compositions becomes increasingly large, the ability to effectively evaluate each individual composition change becomes impossible. This is where big data processing becomes a key aspect of the RAD process.
The data calculation step involves defining the alloying elements, compositional ranges for each element, and step sizes. The following elements were considered in the development of a printable high gamma prime superalloy with Ni as the balance: Al, Co, Cr, Fe, Hf, Mo, Nb, Re, Ta, Ti, W, and Zr. In general, the elements Al, Nb, Ta, and Ti were considered for gamma prime formation, Al and Cr for oxidation resistance, and Co, Cr, Fe, and W for solid solution strengthening. Table 1 details the elements modeled, the minimum and maximum allowed, and the step size for each. All chemistry information is presented in wt% throughout this work.
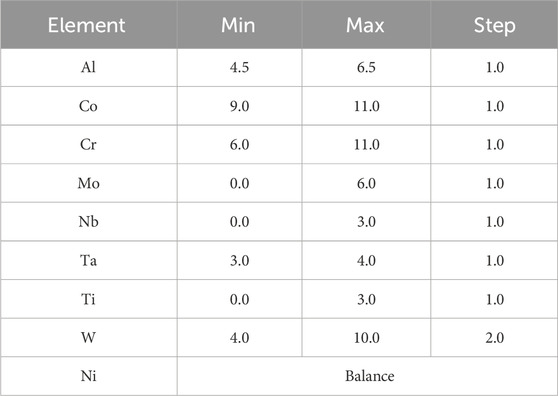
Table 1. Data calculation input for high gamma prime superalloy development (wt%).
In the data calculation (Table 1), each element is independently varied, and every possible combination, based in the calculation input with Ni as the balance element, will be calculated. For example, if we consider Al, alloys will be calculated with 4.5, 5.5, and 6.5 wt% Al. In this calculation there are 48,384 unique alloys. This highlights the importance of integrating big data processing with computational materials simulations. Having the ability to calculate large, complex compositional spaces increases design freedoms, allowing the material scientist to evaluate the effect of minor chemistry changes and consider possible solutions beyond conventional alloys developed via purely experimental methods.
The next step in the RAD process is data mining key pieces of information from the thermodynamic calculations and composition-based criteria (e.g., solidus temperature and density, respectively). The goal is to extract information from the raw data that accurately predicts the alloy’s microstructure and performance. In the RAD process, the mined data are referred to as criteria. Generally, these criteria will be unique to an alloy family and processing condition. As an example, the criteria used to develop a Ni-based alloy for AM will differ from those used to develop an Fe-based alloy for thermal spray.
The primary criteria developed and used in designing a printable high gamma prime superalloy are detailed below. Considering cracking as the primary challenge to overcome when developing an alloy for AM, the first few criteria are related to predicting an alloy’s crack susceptibility.
A hot cracking index criteria (HCI) as defined by Clyne and Davies (1981), Clyne et al. (1982) is used to evaluate an alloy’s susceptibility to hot cracking. The HCI uses the Scheil-Gulliver calculation results for each unique composition (Gulliver, 1913) and specifically looks at solidification behavior of the alloy. The HCI is calculated using the following equation:
Where T99 is the temperature at which 99% solid phase is present during solidification, T90 is the temperature at which 90% solid phase is present during solidification, and T40 is the temperature at which 40% solid phase is present during solidification. These three temperatures are extracted from the calculated data to calculate the HCI as shown in Figure 1A. Lower HCI values correspond to alloys with higher hot cracking resistance. It is therefore desirable to consider alloys with relatively low HCI values.
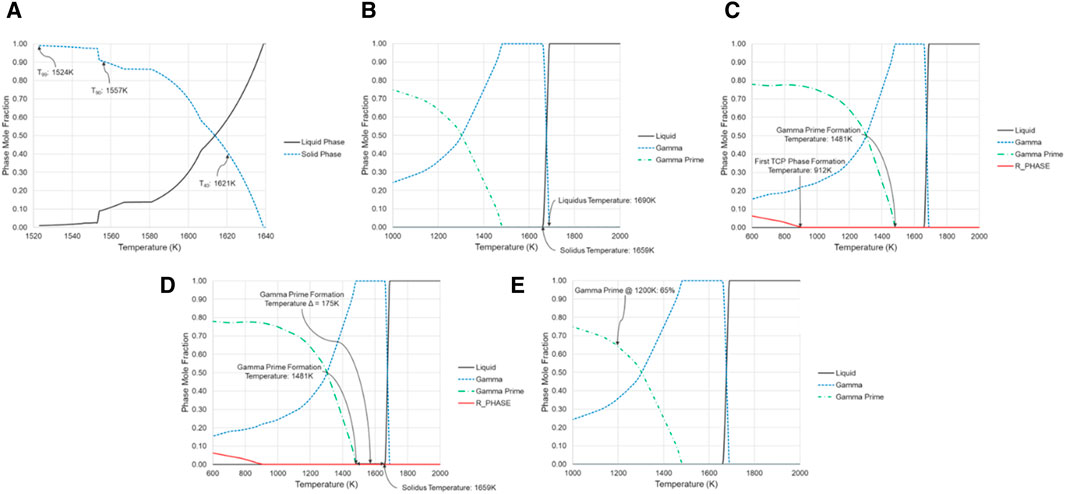
Figure 1. Calculated thermodynamic data of (A) Scheil calculated phase diagram showing the T99, T90, and T40 temperatures used to calculate the HCI criteria. (B) Equilibrium phase diagram showing the liquidus and solidus temperatures used to calculate mushy zone, (C) gamma prime and TCP phase formation temperatures, (D) gamma prime formation temperature delta, and (E) gamma prime phase fraction at 1,200 K.
In addition to the HCI, the mushy zone of the alloy can be extracted to predict hot crack susceptibility. The mushy zone is defined as the temperature delta between the liquidus temperature and solidus temperature. Like the HCI, lower mushy zone criteria values indicate more resistance to hot cracking. The mushy zone, demonstrated in Figure 1B, is determined from both equilibrium and Scheil calculations by mining the liquidus and solidus temperature of each alloy calculated.
The strain-age cracking susceptibility can be evaluated by determining the temperature at which gamma prime is predicted to form. Alloys with lower gamma prime formation temperatures will generally be more resistant to strain-age cracking. Figure 1C shows how the gamma prime formation temperature is mined from the data calculation.
Like gamma prime formation, topologically close-packed (TCP) phases are also well known to cause embrittlement in Ni-based superalloys and are generally undesirable. To minimize crack susceptibility, it is desirable to select compositions with low TCP formation temperatures as the TCP phases will be less likely to form during the printing process. Figure 1C show an example of how the TCP phase formation temperature is mined from the phase evolution diagram.
A third criteria used in the prediction of strain-age cracking is the temperature delta between the formation temperature of gamma prime and solidus temperature (Figure 1D). This criteria is another method used to understand how likely gamma prime is to form during solidification and subsequent reheating of each build layer. Larger temperature deltas are desirable and suggest gamma prime formation will be suppressed.
Crack resistance is an important aspect of designing a material for AM. However, we also need to consider the other important properties required from a Ni-bases superalloy like strength and oxidation resistance. Gamma prime precipitation is the primary mechanism providing high temperature strength and stability to gamma prime superalloys. High temperature aging heat treatments in the range of about 800°C–1,200°C (1,073–1,473 K) are commonly used to precipitate the gamma prime phase (Huang and Koo, 2004; Boswell et al., 2019; Alhuzaim et al., 2021). It is important the alloy form enough gamma prime to achieve the desired mechanical properties. From equilibrium calculations, the phase fraction of gamma prime at 1,200 K is utilized as a predictor of the amount of gamma prime that will form experimentally after aging (Figure 1E). Generally, the target herein is to match the phase fraction of gamma prime predicted to form in current high gamma prime superalloys (∼50–70%).
A second, more general, method for predicting strength of an alloy is evaluating the effect of solid solution strengthening (SSS). In Ni-based superalloys SSS affects the gamma phase, which can be considered as the matrix phase of the alloy. For this criteria, only substitutional solid solutions strengthening is considered. From the calculation results, the composition of the gamma phase is extracted at 1,200 K and used to compute a SSS coefficient (σ) using a theoretical model based on elemental atomic sizes and fractions. The higher the SSS coefficient, the stronger the alloy is expected to be. The following equation is used to calculate the SSS coefficient of gamma:
Where Xi is the atomic fraction of the ith element in gamma, Ri is the atomic radius of the ith element, and Rbal is the atomic radius of the balance element in gamma, in this case Ni.
The final criteria addresses oxidation resistance, another important property of Ni-based superalloys. The oxidation resistance criteria is based on the Wagner model (Sato et al., 2011), which proposes the rate of oxidation is proportional to the valence state and formation energy of oxide phases. The study conducted by Sato et al. concluded oxidation resistance calculations using the composition of gamma matrix provided better accuracy than considering the mean composition of the alloy. It is also assumed the gamma prime phase is inherently oxidation resistant, thus it is important to maximize the oxidation resistance of the matrix phase. Therefore, the oxidation resistance criteria is calculated using the gamma phase composition extracted at 1,200 K. Higher oxidation resistance values predict alloys with higher oxidation resistances. The oxidation resistance criteria is calculated using the following equation:
Where
Where Xi is the atomic composition in the oxide phase, Zi is the valence of cations i in the oxide phase, and ΔGf is the formation energy of alumina at 1,200 K that is calculated from the equilibrium model.
Plotting tools in the RAD platform allow for easy visualization of the mined data and selection of alloys which meet the design criteria. The RAD platform also allows for filtering of the mined data and is used to exclude alloys which are unlikely to meet the design criteria. Through an iterative process of setting limits on specific criteria and re-plotting the data, the large data set is refined to a smaller number of alloys that are expected to meet all design criteria.
After the first round of the often iterative RAD process is completed and candidate alloys are selected using the design criteria, the next step is to fabricate physical samples of the alloys to characterize. To understand if any of the new RAD selected alloys show improved printability, CM247LC was included in the experimental evaluation work as a benchmark material. CM247LC is considered a high gamma prime superalloy and is known to be difficult to print crack free. Inert gas atomized −45 + 15 µm CM247LC powder [Carpenter Additive (United States) LLC] was used to fabricate the CM247LC samples (Supplementary Table S1).
Blends of elemental powders and prealloyed powders were used to create the feedstock for printing the 5 RAD selected alloys, as demonstrated by Vecchio et al. (2021) as part of a high-throughput method for screening bulk alloys. This facilitates a rapid and cost-effective method for evaluating new compositions when compared to gas atomization possibly requiring a spheroidization step to produce spherical feedstock for each candidate composition. Several different prealloyed powder feedstocks and pure elemental powders were used to create the powder blends. Feedstock powders included pure Co, Cr, Mo, Nb, Ni, and Ta (Advanced Engineering Materials Limited). Prealloyed feedstocks included Ni-20Al, Ni-52Ti, Ni-45W, and alloy C-276 [Oerlikon Metco (United States) Inc.]. The elemental and prealloyed powders used were spherical, with a size range of −75 + 45 μm, and blended using a Turbula T2F mixer. The powders were printed on a customized L221 powder-fed direct energy deposition machine (FormAlloy Technologies Inc.) equipped with a 650 W AO-650 blue (450 nm) laser with a 1 mm spot size (Nuburu). The AM chamber of the Formalloy L221 unit is an inert argon environment with oxygen content maintained below 1 ppm. The laser and associated optics are mounted on a panel with z-axis movement. The substrate is affixed to a water-cooled X-Y positioning stage. Samples were printed onto a 0.125 inch thick 625 nickel build plate and built as 10 mm × 10 mm × 10 mm cubes. The parameters used to print each sample are shown in Table 2.

Table 2. DED printing parameters.
Alloy X3 was inert gas atomized into a powder with a particle size range of −53 + 20 µm by Oerlikon Metco (United States) Inc. for LPBF testing. Composition of the gas atomized X3 powder was confirmed to match the nominal composition of alloy X3 before and after printing. The X3 powder was printed on an EOS M290 LPBF printer by Oerlikon AM using a 165°C build plate preheat temperature. A series of LPBF samples were printed each with varying parameters: laser power 180–300 W, scanning speed 1,000–3,400 mm/s, hatch spacing 0.03–0.10 mm, and layer thickness 0.02–0.04 mm (Supplementary Table S2). Energy density varied from 43–217 J/mm3 and surface energy from 1.2–5.0 J/mm2.
The built samples were cut from the build plate using a ProtoMAX waterjet cutter (OMAX) and subsequently cut in half using a Struers Minitom diamond saw for microstructural analysis of the cross-section perpendicular to the build direction. Metallographic preparation was performed using a Struers CitoPress-30 mounting press and Tegramin-25 polisher. All samples were polished to 0.05 µm colloidal silica. Microstructure evaluation was performed using a Tescan Vega 3 SEM with an Oxford INCAx-act EDS detector and Zeiss Axio Observer.D1m optical microscope. Crack measurements were performed using ImageJ software. Hardness measurements of the samples were performed using a Mitutoyo MVK-H1 microhardness tester.
As a first step in the design of a high gamma prime superalloy for AM the TCP formation temperature and mushy zone criteria are considered. The plot shown in Figure 2A contains 48,384 discrete alloys. Each data point in the plot represents a unique composition (data points may be overlapping). Given the design criteria, alloys with a low TCP formation temperature and low mushy zone are desirable for maximizing crack resistance. The alloy predicted to have the highest crack resistance according to these two criteria is highlighted with an arrow in Figure 2A. Setting limits on these two primary criteria, shown as a green shaded box in (A), will eliminate alloy candidates which do not meet these two criteria (Figure 2B). As mentioned, the data visualization step is an iterative process in which multiple design criteria must be considered to down select to a small subset of optimized alloys. In Figure 2C, the plot containing the remaining 4,827 alloys and now displays the SSS coefficient of gamma vs. the gamma prime phase fraction at 1,200 K. To optimize strength of the alloy, maximizing the SSS coefficient and forming ≥50% gamma prime phase ≤70% is desirable. Applying these filters reduces the number of remaining alloys to 565. Continuing the data visualization process, the remaining alloys are plotted to show gamma prime formation temperature vs. oxidation resistance (Figure 2D). As per the design goals, gamma prime formation temperature should be minimized, and oxidation resistance maximized. The alloys of interest are shown in the green shaded box. From these candidates, 5 compositions are selected for further experimental characterization. Table 3 show the compositions for the respective alloys selected based on the design criteria. Table 4 shows the calculated criteria results for each selected alloy compared to CM247LC, a nonprintable high gamma prime superalloy.
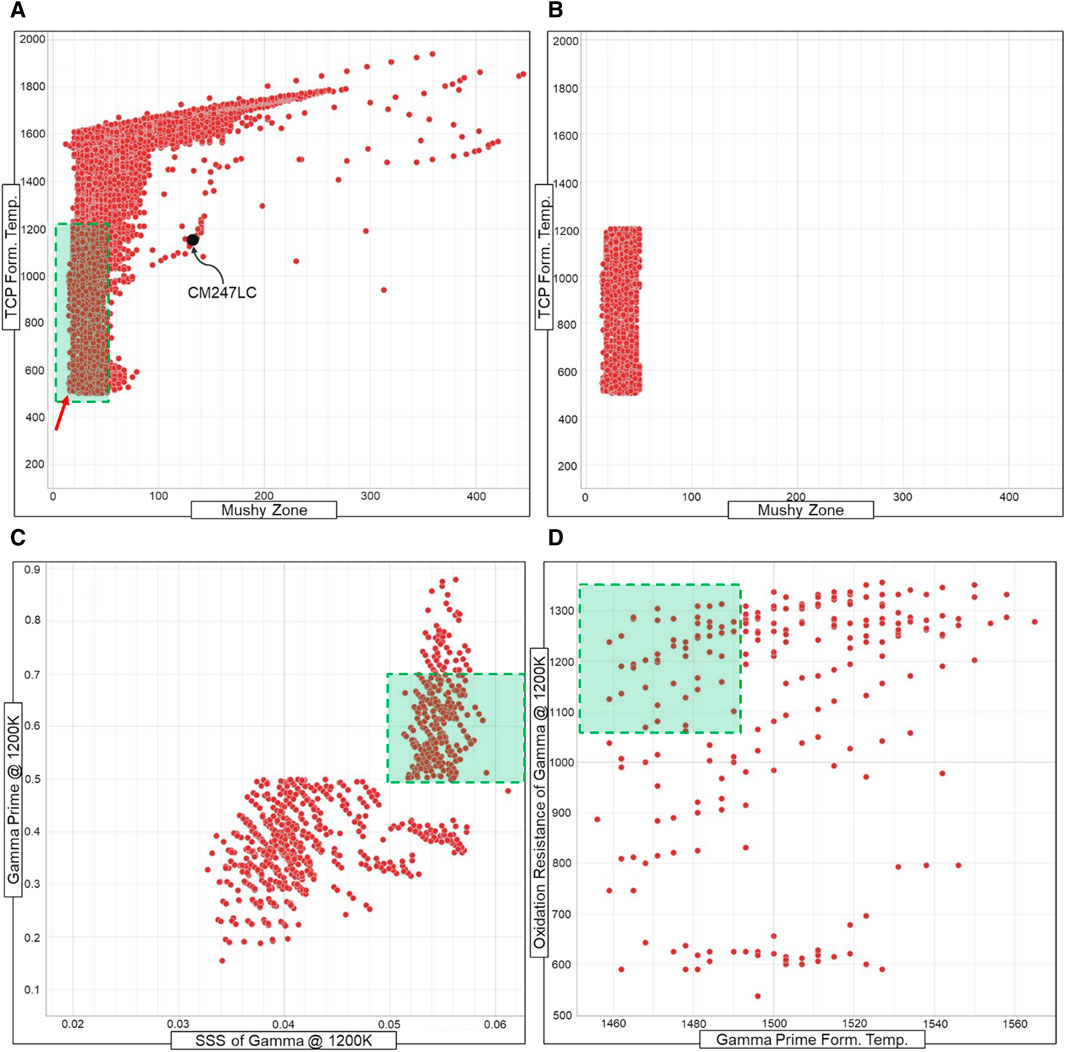
Figure 2. Data plots of (A) 48,384 alloys showing mushy zone vs. TCP formation temperature. The area highlighted in green represent alloys maximizing crack resistance. The alloy expected to have the highest crack resistance is indicated by the red arrow. CM247 is also annotated before being eliminated for failing to meet the first screening criteria. (B) Plot of mushy zone vs. TCP formation temperature after sorting step (4,827 alloys remain). (C) Data plot after first sorting step showing SSS of gamma vs. gamma prime fraction. Green highlighted area represents alloys maximizing strength. (D) Data plot of 565 alloys after second sorting step showing gamma prime formation temperature vs. oxidation resistance. Area highlighted in green shows alloys of interest.
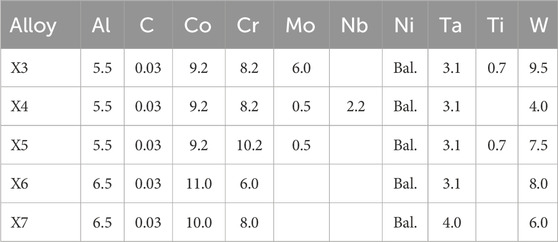
Table 3. Chemical Composition in wt% of Candidate Alloys Selected from the RAD Modeling.

Table 4. Calculated criteria results for the RAD selected alloys.
A series of experiments were conducted to optimize the powder blends used as feedstock to print the RAD selected candidate alloys. The goal was to optimize the powder blends to achieve the target composition for each DED printed sample. Examples of the DED-printed samples printed under equivalent conditions are shown in Figure 3. EDS was used to measure the chemical composition of each build in the as-built condition to compare to the target composition and provide insight into adjustments to the blended feedstock to reach the target compositions. Supplementary Table S3 shows the EDS results versus the target composition for the initial builds only employing elemental additive powders.
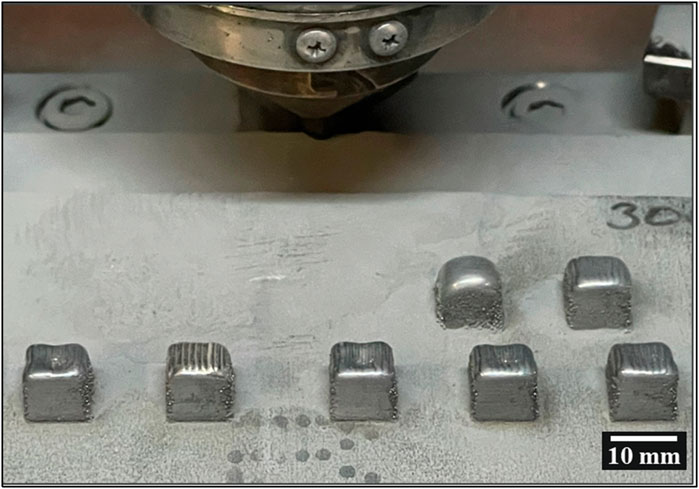
Figure 3. Example of the 10 mm cubes built onto the 625 nickel build plate.
The initial powder blending experiments showed the lighter elements, Al, and Ti, could not reliably be added into the blends in their elemental form. The relatively low density of Al and Ti made it difficult to control the composition of the blended powder, likely due at least in part to segregation. It is hypothesized that some of the low melting temperature Al is vaporized during the printing process (Matthews et al., 2017). EDS measurements in trial builds (Supplementary Table S3) show the Al content in the as-built DED samples were approximately 2.5 wt% lower compared to the starting Al content in the blended powder. Thus, the composition of Al in the next iteration of blended powders had to be set 2.5 wt% higher than the target composition of the alloy to achieve the correct Al content in the DED sample. A similar issue was observed when using elemental Ta and W powders in that they settled to the bottom of the powder feeder and were too concentrated in the builds. The Mo, Ta, and W powders having significantly higher melting temperatures compared to the other feedstock powders was also found to result in partially melted particles being present in the builds (Supplementary Figure S1). To mitigate these issues, Al, Ti, and W were added in the form of Ni binary alloys. The densities and melting temperatures of the Ni binary alloy powders more closely match the other feedstock powders and allowed for more homogenous powder blends. Using alloy C-276 proved to be a better solution for incorporating Mo into X3, which contains 12 times the amount of Mo compared to the other Mo containing alloys in this work. Table 5 shows the optimized powder blend recipes and subsequent blended powder compositions for each candidate alloy. Supplementary Table S4 shows the measured EDS compositions of the as-printed DED samples using the optimized powder blends compared to their respective target composition. Unfortunately, no suitable (i.e., spherical, of an appropriate cut, and without significant undesirable elements) Ta alloy powder was available, requiring the use of elemental Ta powder. The elemental Ta was found to segregate to the bottom of the powder blends. This would cause the DED builds to be approximately 2.0 wt% richer in Ta when the amount of Ta in the powder blends was set at the target values. To mitigate this issue, the Ta target in the powder blends was reduced by 2.0 wt%. This adjustment helped achieve the target Ta in the X3, X5, and X7 prints. However, in the case of X4 and X6, Ta was now lower than the target (Supplementary Table S4). Using the optimized powder blends, the target compositions of all five RAD candidate alloys were achieved in the DED printed samples except for Ta being ∼2.0 wt% low in X4 and X6.

Table 5. Optimized powder blends and blended powder compositions of candidate alloys.
Optical and SEM micrographs of the as-built cross sections were used to evaluate cracking behavior of the candidate alloys compared to standard CM247LC. Figure 4 shows SEM images of the entire DED build cross section of each as-built sample. All six DED samples contain cracks however, alloy X3 shows a significantly lower number of cracks compared to the other samples. A series of optical micrographs were also captured to cover the total cross-sectional area of each sample. Figure 5 shows an example micrograph with arrows highlighting the cracks.
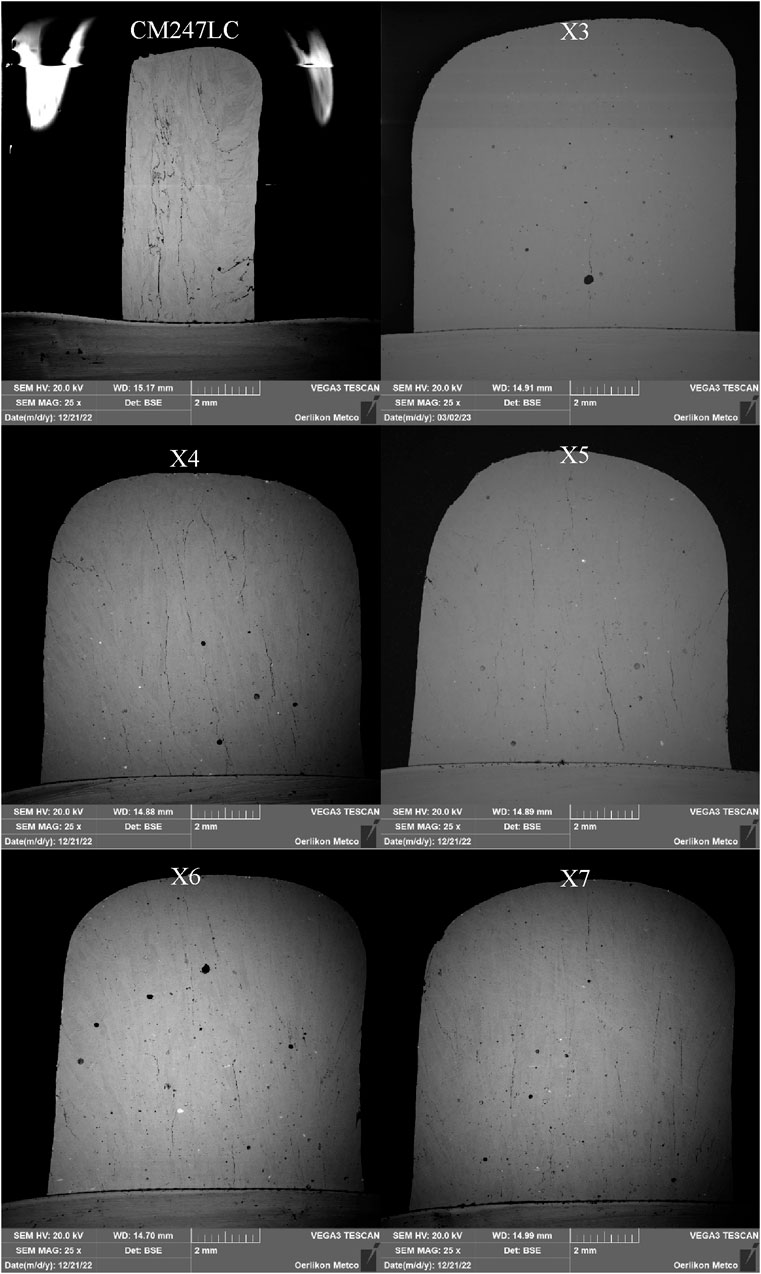
Figure 4. SEM cross section micrographs of the as-built DED samples comparing the five candidate alloys to standard CM247LC. Cracks are observed in all six samples with X3 showing the least number of cracks.
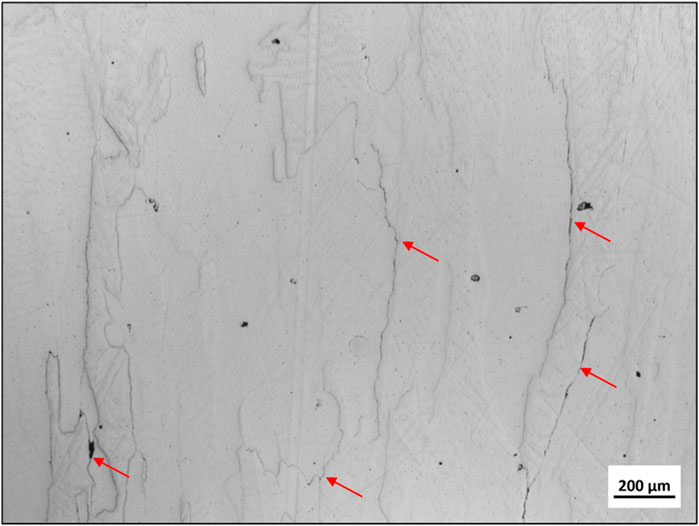
Figure 5. Example optical micrograph of as-built alloy X7 used for crack measurements.
To evaluate the crack resistance of each alloy, the length of each crack and total micrograph area are measured for each optical micrograph (Figure 6). Crack density is then calculated using the summation of all crack lengths and micrograph areas for each sample. Crack measurements show alloy X3 contains the lowest crack density compared to the other five samples. Alloys X4, X5, X6, and X7 show similar cracking behavior, containing a crack density of approximately 1.31–1.46 mm/mm2. All five RAD candidate alloys contain less than half as many cracks compared to the standard CM247LC (4.96 mm/mm2). The reduction in crack density of the five RAD selected compositions compared to standard CM247LC supports the RAD modeling and data analytics used to predict crack resistance of AM alloys. The RAD calculations for the five alloys show at least a 1.5X reduction in HCI, at least a 2.5X reduction in Scheil mushy zone, and at least a 3X reduction in Equilibrium mushy zone versus CM247LC. The RAD modeling suggests alloy X3 will be one of the most crack resistant materials considering it shows the lowest HCI (0.5) and second lowest Scheil mushy zone (120 K) values, a 5.5X reduction in HCI and 3.8X reduction in Scheil mushy zone compared to CM247LC. The modeling results are influenced only by chemical composition’s impact on thermodynamics. In the case of alloy X3, the RAD predictions are directly related to the increased Mo content.
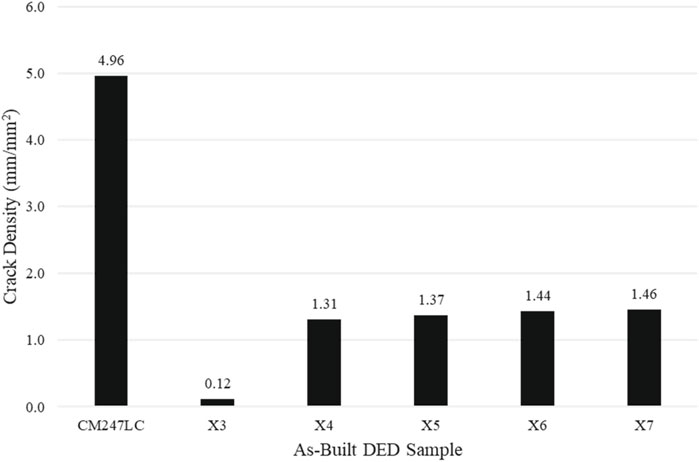
Figure 6. Crack measurement results for all six as-built DED samples.
Microhardness testing was conducted on the as-built DED samples (Figure 7). Alloy X3 shows the highest hardness in the as-built condition of all six samples. CM247LC, alloy X4, and X5 have similar hardness levels, with alloys X6 and X7 being the softest.
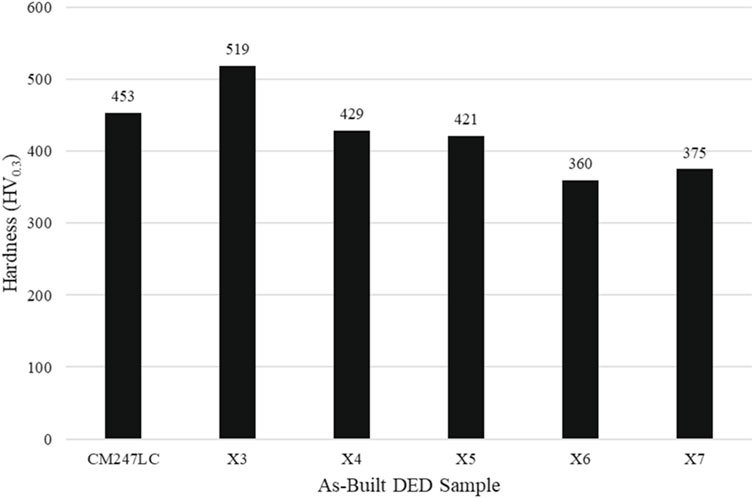
Figure 7. Average microhardness measurement results for all six as-built DED samples.
Alloy X3 was selected for powder bed AM trials owing to the superior performance of X3 compared to CM247LC, and even the other RAD designed alloys. A gas atomized powder of X3 was utilized for all LPBF additive manufacturing. Alloy X3 samples printed on LPBF were evaluated using the same methods used for the DED samples. Examples of the LPBF-samples are show in Figure 8. A 165°C substrate preheat was used and parameters were varied for each sample to evaluate their influence on crack density and hardness (Supplementary Table S2). Results for the LPBF study of alloy X3 are shown in Figure 9. The results indicate crack density and hardness in the as-built condition are influenced by printing parameters. Increasing surface energy tends to reduce crack density and increase as-built hardness. Surface energies of ≥2.6 J/mm2 resulted in the lowest crack density values (≤0.04 mm/mm2). Higher surface energies impart more heat into the sample, lowering the temperature gradient between applied layers. Lowering the temperature gradient between layers reduces the cooling rate and helps to reduce the buildup of internal stresses, resulting in lower crack susceptibility. In addition, the higher temperatures likely cause an aging affect, leading to more gamma prime precipitation, resulting in a higher hardness as surface energy increases. The effect of surface energy on hardness can be observed when comparing the hardness of the X3 DED sample (519 HV0.3) to the X3 LPBF samples (421–490 HV0.3). The increased hardness of the DED sample compared to the LPBF samples is a result of a higher surface energy parameter, 30 J/mm2 for our DED parameters vs. 1.2–5.0 J/mm2 for LPBF. Some of the lowest crack density results achieved for X3 in LPBF were between 0.02 and 0.03 mm/mm2. Hu et al. reports 1.33 mm/mm2 as the lowest crack density measurements achieved for standard CM247LC using LPBF (Hu et al., 2024). These results indicate alloy X3 is 66X more crack resistant than standard CM247LC when printed with LPBF.
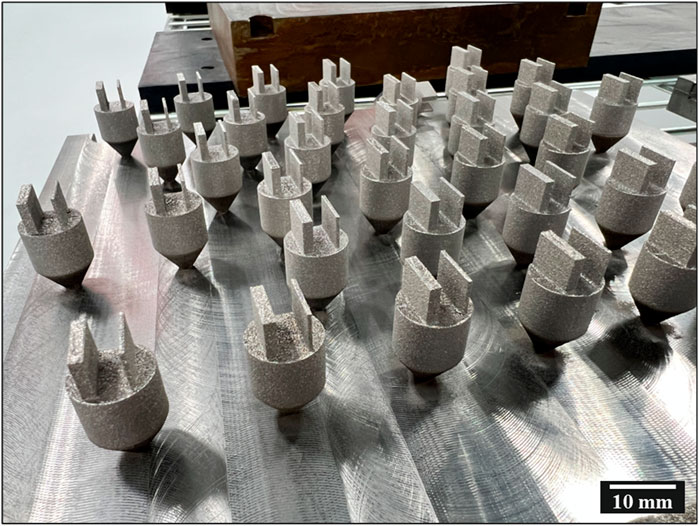
Figure 8. Alloy X3 LPBF samples printed on EOS M290.
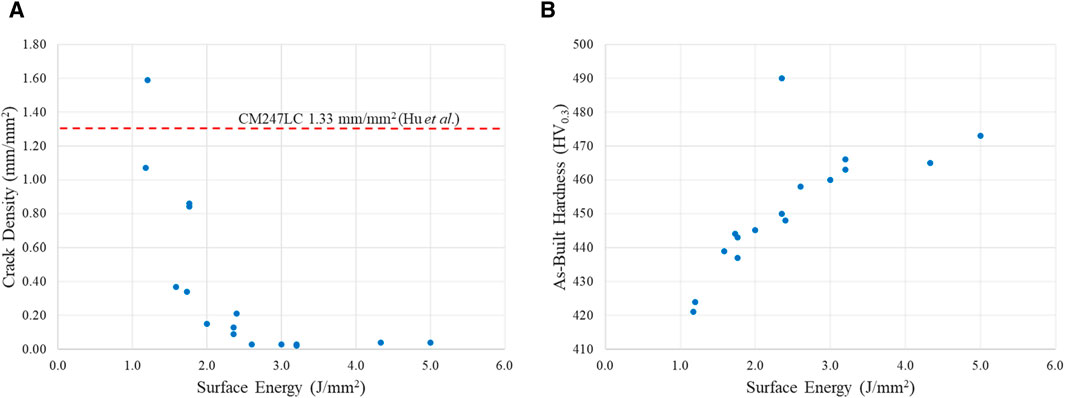
Figure 9. LPBF results for alloy X3 (A) surface energy vs. crack density and (B) surface energy vs. as-built hardness.
This work demonstrates the application of computational modeling using CALPHAD and big data mining in the clean sheet development of a nickel-based superalloy with improved printability for AM. Using the established design criteria and data visualization, 5 candidate alloys were selected from the 48,384 discrete alloys modeled. Experimental validation of the 5 candidate alloys using DED posed some challenges which eventually were overcome by optimizing the powder feedstocks and powder blend recipes used to print the new compositions. Improved printability was confirmed through microstructure evaluation of the as-built DED samples. When compared to CM247LC, the 5 candidate alloys show improved crack resistance. Alloy X3 showed the best printability of all alloys testing, having a 41x reduction in crack density compared to CM247LC. LPBF testing of alloy X3 shows good agreement with the DED results and further confirms the improved crack resistance compared to CM247LC. Ongoing evaluation of alloy X3 compared with standard CM247LC using LPBF, heat treatment response, and mechanical property testing is planned. This work focused on Ni-based alloys, but the alloy development approach used herein is applicable to any alloy system so long as sufficient thermodynamic data is available for CALPHAD modeling.
The original contributions presented in the study are included in the article/Supplementary Material, further inquiries can be directed to the corresponding author.
JB: Conceptualization, Formal Analysis, Investigation, Methodology, Project administration, Supervision, Validation, Visualization, Writing–original draft, Writing–review and editing. KK: Formal Analysis, Investigation, Methodology, Validation, Writing–review and editing, Writing–original draft. JS: Investigation, Validation, Writing–review and editing. JV: Investigation, Supervision, Writing–review and editing. NZ: Data curation, Methodology, Software, Writing–review and editing. SJ: Software, Writing–review and editing. KV: Formal Analysis, Investigation, Methodology, Resources, Supervision, Writing–review and editing. JC: Conceptualization, Supervision, Writing–review and editing.
The author(s) declare that no financial support was received for the research, authorship, and/or publication of this article.
This work was partially supported through access and utilization of the UC San Diego, Department of Nanoengineering’s Materials Research Center (NEMRC).
JB, KK, JS, JV, NZ, SJ, KV and JC were employed by Materials R&D, Oerlikon Metco (United States) Inc.
All claims expressed in this article are solely those of the authors and do not necessarily represent those of their affiliated organizations, or those of the publisher, the editors and the reviewers. Any product that may be evaluated in this article, or claim that may be made by its manufacturer, is not guaranteed or endorsed by the publisher.
The Supplementary Material for this article can be found online at: https://www.frontiersin.org/articles/10.3389/ftmal.2024.1397636/full#supplementary-material
Alhuzaim, A., Imbrogno, S., and Attallah, M. M. (2021). Direct laser deposition of crack-free CM247LC thin walls: mechanical properties and microstructural effects of heat treatment. Mater Des. 211, 110123. doi:10.1016/j.matdes.2021.110123
Andersson, J. O., Helander, T., Höglund, L., Shi, P., and Sundman, B. (2002). Thermo-Calc and DICTRA, computational tools for materials science. Calphad 26, 273–312. doi:10.1016/S0364-5916(02)00037-8
Bandyopadhyay, A., Traxel, K. D., Lang, M., Juhasz, M., Eliaz, N., and Bose, S. (2022). Alloy design via additive manufacturing: advantages, challenges, applications and perspectives. Mater. Today 52, 207–224. doi:10.1016/J.MATTOD.2021.11.026
Blakey-Milner, B., Gradl, P., Snedden, G., Brooks, M., Pitot, J., Lopez, E., et al. (2021). Metal additive manufacturing in aerospace: a review. Mater Des. 209, 110008. doi:10.1016/J.MATDES.2021.110008
Boswell, J. H., Clark, D., Li, W., and Attallah, M. M. (2019). Cracking during thermal post-processing of laser powder bed fabricated CM247LC Ni-superalloy. Mater Des. 174, 107793. doi:10.1016/j.matdes.2019.107793
Cheney, J. (2018). “Utilizing big data informatics for thermal spray materials design,” in Proceedings of the International Thermal Spray Conference, 430–435.
Cheney, J., and Kusinski, G. (2012). Utilizing computational metallurgy to design amorphous and nanocrystalline coatings for wear and corrosion resistance. in Proceedings of the international thermal spray conference, 556–561.
Clyne, T. W., Wolf, M., and Kurz, W. (1982). The effect of melt composition on solidification cracking of steel, with particular reference to continuous casting. Metall. Trans. B 13, 259–266. doi:10.1007/bf02664583
Dass, A., and Moridi, A. (2019). State of the art in directed energy deposition: from additive manufacturing to materials design. Coatings 9, 418. doi:10.3390/coatings9070418
Divya, V. D., Muñoz-Moreno, R., Messé, O. M. D. M., Barnard, J. S., Baker, S., Illston, T., et al. (2016). Microstructure of selective laser melted CM247LC nickel-based superalloy and its evolution through heat treatment. Mater Charact. 114, 62–74. doi:10.1016/j.matchar.2016.02.004
Dreano, A., Favre, J., Desrayaud, C., Chanin-Lambert, P., Wimmer, A., and Zaeh, M. F. (2022). Computational design of a crack-free aluminum alloy for additive manufacturing. Addit. Manuf. 55, 102876. doi:10.1016/J.ADDMA.2022.102876
Elsayed, M., Ghazy, M., Youssef, Y., and Essa, K. (2019). Optimization of SLM process parameters for Ti6Al4V medical implants. Rapid Prototyp. J. 25, 433–447. doi:10.1108/RPJ-05-2018-0112
Gulliver, G. H. (1913). The quantitative effect of rapid cooling upon the constitution of binary alloys. J. Inst. Metals 9, 120–157.
Hu, P., Liu, Z., Chen, M., Li, Y., Qi, X., and Xie, J. (2024). Reducing cracking sensitivity of CM247LC processed via laser powder bed fusion through composition modification. J. Mater. Res. Technol. 29, 3074–3088. doi:10.1016/j.jmrt.2024.02.082
Huang, H.-E., and Koo, C.-H. (2004). Characteristics and mechanical properties of polycrystalline CM 247 LC superalloy casting. Mater. Trans. 45, 562–568. doi:10.2320/matertrans.45.562
Jena, A., Atabay, S. E., Gontcharov, A., Lowden, P., and Brochu, M. (2021). Laser powder bed fusion of a new high gamma prime Ni-based superalloy with improved weldability. Mater Des. 208, 109895. doi:10.1016/J.MATDES.2021.109895
Kattner, U. R. (1997). The thermodynamic modeling of multicomponent phase equilibria. JOM 49, 14–19. doi:10.1007/S11837-997-0024-5
Kruth, J. P., Leu, M. C., and Nakagawa, T. (1998). Progress in additive manufacturing and rapid prototyping. CIRP Ann. 47, 525–540. doi:10.1016/S0007-8506(07)63240-5
Leary, M., Downing, D., Lozanovski, B., and Harris, J. (2021). Fundamentals of laser powder bed fusion of metals. Design principles, 119–154. doi:10.1016/B978-0-12-824090-8.00013-5
Liu, Z. K. (2020). Computational thermodynamics and its applications. Acta Mater 200, 745–792. doi:10.1016/J.ACTAMAT.2020.08.008
Martin, J. H., Yahata, B. D., Hundley, J. M., Mayer, J. A., Schaedler, T. A., and Pollock, T. M. (2017). 3D printing of high-strength aluminium alloys. Nature 549, 365–369. doi:10.1038/nature23894
Matthews, M. J., Guss, G., Khairallah, S. A., Rubenchik, A. M., Depond, P. J., and King, W. E. (2017). Denudation of metal powder layers in laser powder-bed fusion processes. Addit. Manuf. Handb., 677–692. doi:10.1201/9781315119106-35
Park, J. U., Jun, S. Y., Lee, B. H., Jang, J. H., Lee, B. S., Lee, H. J., et al. (2022). Alloy design of Ni-based superalloy with high γ′ volume fraction suitable for additive manufacturing and its deformation behavior. Addit. Manuf. 52, 102680. doi:10.1016/J.ADDMA.2022.102680
Qian, M., and Gu, D. (2022). Laser additive manufacturing of metallic materials and components. Laser Addit. Manuf. Metallic Mater. Components, 1–804. doi:10.1016/C2020-0-00538-4
Santos, E. C., Shiomi, M., Osakada, K., and Laoui, T. (2006). Rapid manufacturing of metal components by laser forming. Int. J. Mach. Tools Manuf. 46, 1459–1468. doi:10.1016/J.IJMACHTOOLS.2005.09.005
Sato, A., Chiu, Y. L., and Reed, R. C. (2011). Oxidation of nickel-based single-crystal superalloys for industrial gas turbine applications. Acta Mater 59, 225–240. doi:10.1016/J.ACTAMAT.2010.09.027
Svetlizky, D., Das, M., Zheng, B., Vyatskikh, A. L., Bose, S., Bandyopadhyay, A., et al. (2021). Directed energy deposition (DED) additive manufacturing: physical characteristics, defects, challenges and applications. Mater. Today 49, 271–295. doi:10.1016/J.MATTOD.2021.03.020
Vecchio, K., and Cheney, J. L. (2019). Methods of selecting material compositions and designing materials having a target property.
Vecchio, K. S., Dippo, O. F., Kaufmann, K. R., and Liu, X. (2021). High-throughput rapid experimental alloy development (HT-READ). Acta Mater 221, 117352. doi:10.1016/J.ACTAMAT.2021.117352
Yadroitsev, I., Du Plessis, A., and Yadroitsava, I. (2021). Basics of laser powder bed fusion. Fundam. Laser Powder Bed Fusion Metals, 15–38. doi:10.1016/B978-0-12-824090-8.00024-X
Yadroitsev, I., and Yadroitsava, I. (2021). A step-by-step guide to the L-PBF process. Fundam. Laser Powder Bed Fusion Metals, 39–77. doi:10.1016/B978-0-12-824090-8.00026-3
Yi Wang, W., Li, J., Liu, W., and Liu, Z. K. (2019). Integrated computational materials engineering for advanced materials: a brief review. Comput. Mater Sci. 158, 42–48. doi:10.1016/J.COMMATSCI.2018.11.001
Zhang, J., and Singer, R. F. (2002). Hot tearing of nickel-based superalloys during directional solidification. Acta Mater 50, 1869–1879. doi:10.1016/S1359-6454(02)00042-3
Keywords: additive manufacturing, nickel-based superalloys, calculation of phase diagrams, computational materials engineering, gamma prime
Citation: Bracci J, Kaufmann K, Schlatter J, Vecchio J, Zhou N, Jiang S, Vecchio KS and Cheney J (2024) Utilizing computational materials modeling and big data to develop printable high gamma prime superalloys for additive manufacturing. Front. Met. Alloy 3:1397636. doi: 10.3389/ftmal.2024.1397636
Received: 07 March 2024; Accepted: 26 June 2024;
Published: 19 July 2024.
Edited by:
Qiyang Tan, The University of Queensland, AustraliaReviewed by:
Xiaowei Lei, Northwestern Polytechnical University, ChinaCopyright © 2024 Bracci, Kaufmann, Schlatter, Vecchio, Zhou, Jiang, Vecchio and Cheney. This is an open-access article distributed under the terms of the Creative Commons Attribution License (CC BY). The use, distribution or reproduction in other forums is permitted, provided the original author(s) and the copyright owner(s) are credited and that the original publication in this journal is cited, in accordance with accepted academic practice. No use, distribution or reproduction is permitted which does not comply with these terms.
*Correspondence: Jonathon Bracci, am9uYXRob24uYnJhY2NpQG9lcmxpa29uLmNvbQ==
Disclaimer: All claims expressed in this article are solely those of the authors and do not necessarily represent those of their affiliated organizations, or those of the publisher, the editors and the reviewers. Any product that may be evaluated in this article or claim that may be made by its manufacturer is not guaranteed or endorsed by the publisher.
Research integrity at Frontiers
Learn more about the work of our research integrity team to safeguard the quality of each article we publish.