- 1Department of Biotechnology, Center for Microbial Ecology and Technology (CMET), Ghent University, Ghent, Belgium
- 2Centre for Advanced Process Technology for Urban Resource Recovery (CAPTURE), Ghent, Belgium
- 3Umicore, Group Research and Development, Competence Area Recycling and Extraction Technologies, Olen, Belgium
This work characterized different cation- and anion-exchange membranes to improve the efficiency for the electrochemical conversion of Li2SO4 into LiOH and simultaneously recover H2SO4 as a byproduct, an essential process for sustainable alternatives for lithium−ion battery recycling. The membrane’s ability to block H+ and OH− migration over the membrane to the feed stream of the electrolyzer was investigated. Simultaneously, the membrane resistance was measured to assess its impact on the cell voltage and overall energy consumption. The best CEM, Sx-2301-Wn, enabled to concentrate LiOH up to 1.7M with a current efficiency (CE) of 77.3%, while Fumasep FAB-130-PK, the best AEM, was able to concentrate H2SO4 up to 0.6M with a CE of 74.6%. The recirculation of LiOH into the middle compartment to maintain a constant pH was also investigated and showed to improve both Li+ (4.2%–8%) and SO42- (5.1%) migration, but pH higher than 3 led to an increased membrane resistance. The results of this work contributed to the selection of a suited membrane and ideal operational conditions for producing LiOH and H2SO4 through a three-compartment membrane electrolysis cell.
1 Introduction
Lithium demand for lithium−ion battery (LIB) production is soaring and is projected to more than quadruple by 2030 compared to 2022 (McKinsey and Company, 2023). Its lightweight and high energy density make it ideal for batteries in mobile applications, but also hard to substitute. This led to its classification as a critical raw material by the European Union in 2020 (European Commission, 2020). The average lifespan of these LIBs is 5–10 years and researchers estimate that between 1.4 and 11 million tons of end-of-life (EoL) batteries will be ready for recycling by 2030 (Jarraya et al., 2019; Makuza et al., 2021; Miao et al., 2022). LIB recycling typically includes a series of a) pyro/hydrometallurgical or b) fully hydrometallurgical process steps, followed by chemical precipitation, solvent extraction or electro-metallurgical steps(Or et al., 2020; Jung et al., 2021; Makuza et al., 2021). In the pyro-metallurgical approach, lithium is mostly lost in slag phases, but researchers have made progress in increasing the lithium recovery rate by using e.g., fully hydro-based processes, slag roasting or lithium volatilization from slag phases (Dang et al., 2018; Qu et al., 2022; Wei et al., 2023). If a sulfate based leaching or roasting agent is used and the concentration is increased, one can obtain a Li2SO4 stream, rich in Li+ and low in other impurities (Figure 1) (Or et al., 2020).
These streams can be further purified and converted into battery grade Li2CO3 or LiOH. The most common approach, adopted by the industry, is the addition of chemicals like Na2CO3, NaOH or Ca(OH)2 to obtain Li2CO3 or LiOH (Kim, 2008; Aguilar and Graber, 2018; Grant et al., 2020). This method is responsible for approximately 10% of CO2 emissions of the cathode production process in batteries and, inevitably, by-products are generated e.g., Na2RakibSO4, Ca2SO4, Ca2CO3 of which some require further processing to meet discharge limits (Grant et al., 2020). The electrochemical conversion of Li2SO4 into LiOH is a good candidate to replace the traditional method as a more sustainable alternative. It eliminates the addition of chemicals and byproducts like H2SO4, H2 and O2 are recovered, of which some can be reused in prior recycling or mining steps (Or et al., 2020; Jung et al., 2021).
Recent works have been focusing on the development of the electrochemical production of LiOH from Li2SO4 solutions, in particular with bipolar membrane (BPM) electrodialysis (Jiang et al., 2014; Chen et al., 2021; González et al., 2021). Under an electric field, BPMs dissociate water into H+ and OH−without the generation of O2 and H2, leading to a lower overall energy consumption (Pärnamäe et al., 2021). BPMs suffer however from two major drawbacks in LiOH production. 1) They are prone to ion-leakage, by which SO42– migrates over the BPM from the acidic compartment into the LiOH, especially at higher concentrations (>1M) in the feed or product streams (Wilhelm, 2001; Pärnamäe et al., 2021). This leads to a reduced LiOH purity of up to 95 wt% and requires additional purification steps with e.g., Ba(OH)2 to reach the required 0.01 wt% (Parsa et al., 2015; Livent, 2018; González et al., 2021). High acid and base concentrations are however desired, because they reduce concentrating steps of both LiOH and H2SO4. Vice versa, Li+ can also leak to the acidic stream. 2) Chemical stability at high pH ranges is another drawback for the implementation of most BPMs due to the instability of the AEM layer in elevated pH ranges (Blommaert et al., 2021; Pärnamäe et al., 2021).
Regardless if BPMs are used, the choice of CEM and/or AEM is very important as its performance largely contributes to the overall efficiency and cost of an electrolyzer (Zhao et al., 2021). CEMs for concentrated LiOH production require a high blocking ability for hydroxide back migration. Nafion 350, 390 or 424 were used for the production of concentrated NaOH or LiOH (current efficiency (CE): 65% at 30°C and 800A/m2) and consist of a highly chemically stable perfluorinated backbone with sulfonated functional groups (Jörissen and Simmrock, 1991; Turan et al., 2016; Rakib et al., 1999). Other membranes like Neosepta CMX/CMB or Selemion CMV/CMTE mostly consist of a polystyrene-divinylbenzene (Sty-DVB) polymer with sulfonic acid functional groups (Sata, 2007; Chen et al., 2020; Gangrade et al., 2022). CEs ranged from 77% to 59% and vary mainly due to the concentration in the catholyte (Turan et al., 2016; Grageda et al., 2020). The differences in performances can be attributed to the density, type and distribution of polymers and ion-exchange groups and in hydrophilic properties of the membrane (Lee et al., 2021). Bilayered membranes are used in the chlor-alkali industry and possess excellent hydroxide blocking ability and low membrane resistance due to the carboxylic layer that is added on top of the sulfonic layer (Li et al., 2021). The high efficiency is owed to the large dehydration of the membrane at high catholyte and anolyte concentrations, as the water to ion ratio is sharply reduced. This reduces the proton tunneling mechanism, and thus the hydroxide back migration over the membrane. This makes it possible to concentrate NaOH up to 32 wt% with a CE of 97% (Gronowski and Yeager, 1991; Li et al., 2021).
The production of concentrated H2SO4 requires membranes that efficiently block protons (Jaroszek et al., 2017). This is challenging due to the high proton mobility and strong affinity with water, described by the Grothuss and vehicle mechanism (Erdey-Grúz, 1974; Kreuer et al., 1982; Agmon, 1995). Different strategies are used to improve the proton rejection: 1) decreasing water content by increasing the degree of polymer cross-linking, introducing weakly basic anion exchange groups or hydrophobic groups into the membrane, 2) increasing electrostatic repulsion by increasing the amount of functional groups in the membrane (Pourcelly et al., 1994). Researchers typically have to make a trade-off between both, as too much cross-linking increases membrane resistance drastically and a too high ion-exchange capacity increases the water content of the membrane and thus the proton leakage (Cherif et al., 1988; Yu et al., 2022). Most AEMs consist of a Sty-DVB polymer with quaternary or tertiary ammonium functional groups (Gangrade et al., 2022; Yu et al., 2022). Aemion+ (Ionomr Inc., Canada) is a more recently developed type of AEMs based on hexamethyl-p-terphenylpoly (bibenzimidazolium) (HMT-PMBI) polymers. These membranes have their positively charged cationic groups directly located on the polymeric backbone, unlike most other membranes, where functional groups are attached on the polymeric backbone (Gangrade et al., 2022; Britton and Moreno, 2023; Chen et al., 2023). The poly-imidazolium functional groups enable the membrane to withstand higher pH ranges, compared to quaternary ammonium based membranes as these degrade due to OH− attacks (Favero et al., 2024).
In this study, the performance of three CEMs and four AEMs were evaluated for the production of LiOH and H2SO4 in a three-compartment membrane electrolysis. Their performance was investigated at low and high acid/base concentrations to their blocking ability towards hydroxides and protons. The concentration changes were analyzed throughout the experiments. The membrane resistance was also measured to investigate the resistance (and energy consumption) and chemical stability in the working conditions. The effect of catholyte recirculation was also investigated in order to optimize the performance of the membranes and LiOH/H2SO4 production efficiency.
2 Materials and methods
2.1 Electrochemical cell
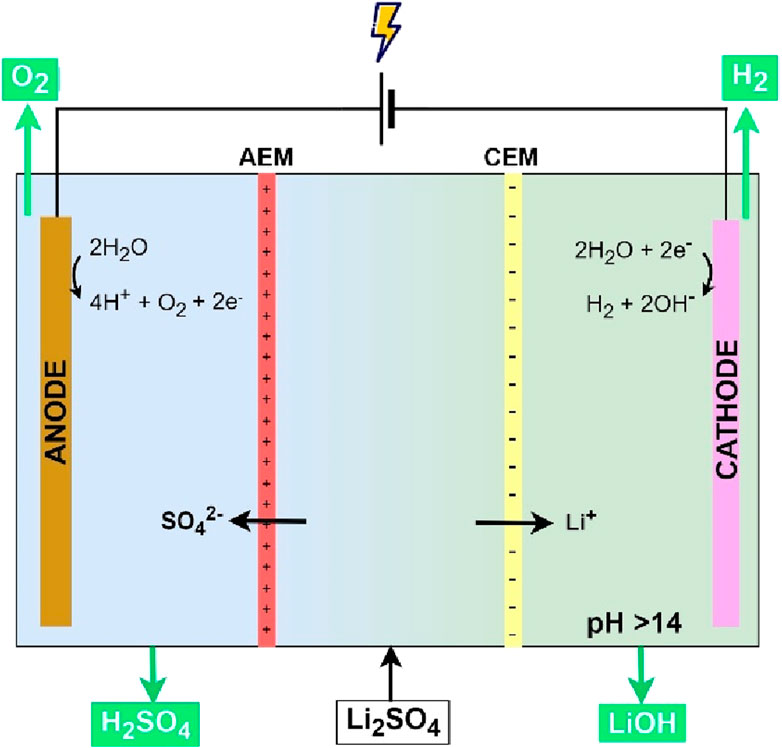
A three-compartment electrochemical cell (EC) was used in all experiments with one CEM and one AEM (Figure 2). 8x8x2 cm perspex frames were used, allowing an internal volume of 128 cm3 for each compartment, in which process solutions were recirculated. An anode, iridium mixed-metal oxide titanium-based (Ti) electrode (Ir MMO) (Magneto Special Anodes (an Evoqua brand), Netherlands) and a cathode, stainless steel thin mesh (Solana, Belgium), were positioned parallel to each other and had an approximate surface of 64 cm2 (distance between electrodes was ∼2 cm). A DC power supply (Velleman ABPS3005 0–30 V, 0–5 A, Belgium) regulated the electrochemical cell galvanostatically in constant current mode and the process solutions were recirculated at a flowrate of 200 mL/min with a peristaltic pump (Watson-Marlow Fluid Technology Solutions 530S, United Kingdom). The high flowrate ensured the constant replenishing of degassed solution and taking the newly formed gasses out of the cell. This reduces the stagnation of gasses at the membrane surface, which can lead to higher cell voltages.
2.2 Membranes
Three CEM and four AEM were evaluated experimentally in the EC (Table 1). The performance of the CEMs was tested by altering the CEM and maintaining the AEM constant (Fumasep FAP-130-PK), to eliminate the effect its on the CEM. The same procedure was done for the AEMs (Flemion F-9010 constant). CEMs were soaked for 48 h in 0.5M Li2SO4 prior to the experiments and quickly rinsed with deionized water before inserting them in the EC. Fumasep and Selemion were soaked in 0.5M H2SO4 for 48h, while both AF3-HWC9-75-X and AF3-HWK9-100-X were first immersed in a 3M KCl solution for 24 h at 50°C and subsequently immersed in a 3M H2SO4 solution (recommendation from manufacturer).
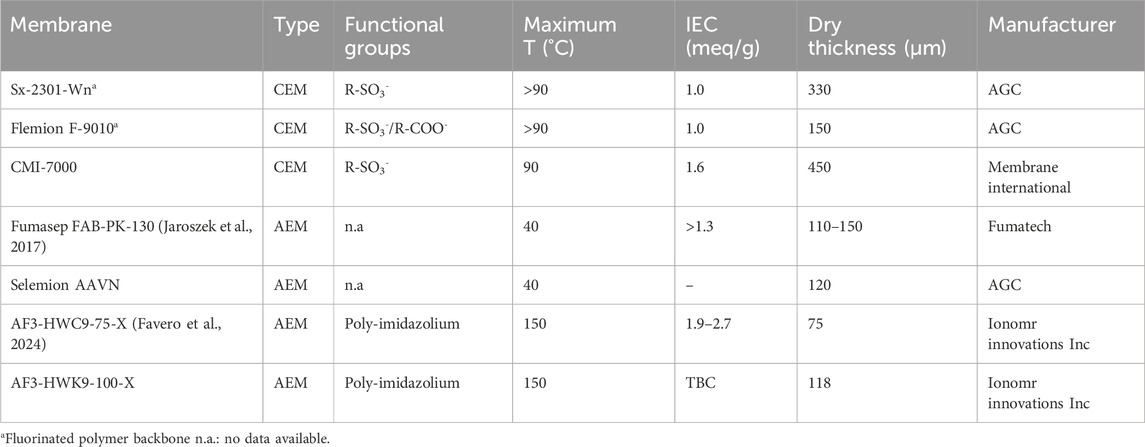
Table 1. Overview of the characteristics of tested membranes. Data were obtained from manufacturer spec sheets if not specified otherwise.
2.3 Membrane resistance
Before and after an experiment, the internal resistance of each membrane was measured by the current interrupt method. The uncompensated resistance (Ru) between the cathode and reference electrode (Ag/AgCl, 3M KCl, ALS, Japan, +0.205 V vs. standard hydrogen electrode at 28°C), and the cell resistance (Rcell)), were measured using the current interrupt (CI) method (Bard et al., 2022). Twenty successive cycles were performed, each consisting of a 50 ms 100 mA current phase followed by a 50 ms open circuit phase. Data was recorded every 0.2 ms. The reference electrode was placed before and after each membrane, after which the membrane resistance is obtained by subtracting both values (Supplementary Figure S1). Two electrolytes, 0.5M Na2SO4 and 1M H2SO4, were used before and after the tests, and for some tests the process solutions were used too.
2.4 Experimental procedure
Experiments were done in batch mode and samples were taken throughout the experiments. The feed used in all experiments is a mixture of 140 g/L Li2SO4 and 3 g/L Na2SO4 (>99%, carl roth) and had an initial pH of 5.1. The anolyte and catholyte were made with H2SO4 (>97%, Chemlab) and LiOH.H2O (>99%, Carl roth). For AEM tests, the concentration and the initial volume of the anolyte was altered, while the catholyte was varied for the CEM. To minimize effects of proton leakage to the middle compartment during tests for the CEM, the volume of the anolyte was three times the volume of the catholyte. The same was done for AEM tests. The initial volumes and concentrations for different experiments can be found in Supplementary Table S1. All experiments were done at room temperature. Different CEMs were tested against a constant AEM (Fumasep FAB-130-PK), to exclude the effect of the AEM on the CEM. For the AEMs, the constant CEM was Flemion F-9010. A constant current (625 A/m2) was applied to the EC until the middle compartment was at maximum 40% depleted. A pH controller (VP-PRO PH/RX, Verderflex) was used to add base to the middle compartment and ensure a constant pH.
2.5 Analytical methods
Samples were taken from the anolyte, catholyte and middle compartment. If the pH of the samples was between 2 and 12, a pH-meter (Labart C11, Consort) and conductivity meter (C3000 series, Consort) were used to measure the pH and conductivity. Acid and base concentrations higher than 0.01M were determined by acid/base titration (848 Titrino plus, Metrohm and manual burette). The concentration of SO42– was measured with a Metrohm 930 Compact Ion Chromatography Flex system (Column: Metrosep A supp 5 150/4.0, Metrohm, Switzerland). Cations (Li+ and Na+) were measured by inductively coupled plasma optical emission spectrometry (ICP-OES, Thermo Scientific iCAP 6,000).
2.6 Data processing
The performance of the membranes was evaluated by calculating the current efficiency (CE). Based on the amount of LiOH/NaOH produced in the catholyte and H2SO4 in the anolyte, the CE was calculated the following equation:
z represents the valence of the ion, C0 and Ct are the concentration (mol/L) and V0 and Vt are the volume (L) of H2SO4 or LiOH in the anolyte/catholyte at time 0 and t, respectively, I is the applied current, t (s) stands for time and F equals the Faraday constant (96,485.33 C).
The specific energy consumption Esec (kWh/kg LiOH or kWh/kg H2SO4) was calculated by:
Ut equals the cell voltage at time t and MMx is the molecular mass of LiOH or H2SO4.
3 Results and discussion
3.1 Cation-exchange membranes (CEM)
Three CEM were tested to evaluate their performance on the production of LiOH. They were tested at low and high concentrations and their resistance was measured to evaluate their stability and effect on the overall energy consumption.
3.1.1 Low LiOH concentration
The highest current efficiency (CE) for all three membranes was in the low LiOH concentration range (0.5M). More specifically, Sx-2301-Wn recorded the highest CE of 89.2% ± 1.1%, while Flemion had a slightly lower efficiency of 88.4% ± 1.0% (Figure 3A). With increasing base concentrations in the catholyte, a trend of decreasing CE was observed with a minimum at 1.7M of 81% ± 2.5% for Sx-2301-Wn and 77.3% ± 2.4% for Flemion. The lower CE is related to the higher OH− back migration over the membrane due to the increased gradient between catholyte and middle compartment. The pH, initially 5.1, gradually decreased over time in the feed compartment and reached at the end of the test 1.7 and 1.83 for Flemion and Sx-2301-Wn respectively. This indicated indicating that proton leakage was dominant over hydroxide back migration, even though the concentration of the anolyte never surpassed 0.5M H2SO4. At pH 1.7, protons start to compete slightly with Na+ and Li+ and decrease the CE.
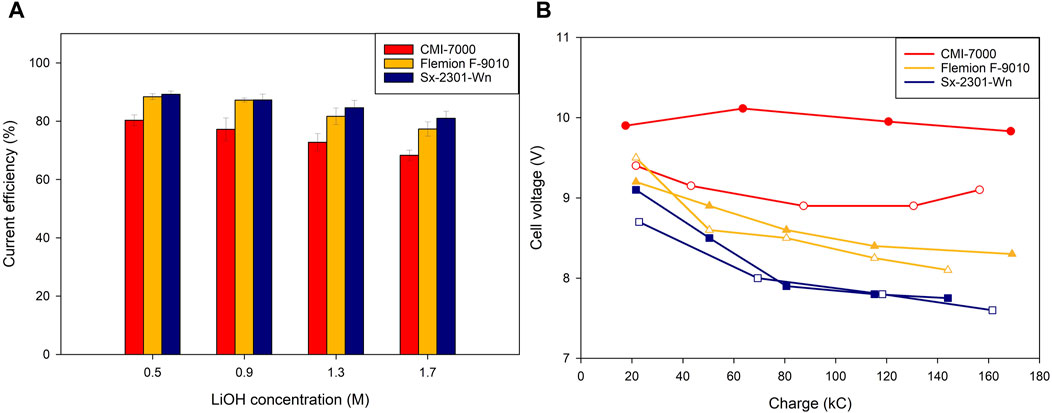
Figure 3. Low catholyte concentration: (A) Current efficiency at different catholyte concentrations throughout the experiment and (B) cell voltage vs. applied charge for three different cation-exchange membranes. Hollow points represent duplicates.
Sx-2301-Wn recorded the lowest cell voltage, especially in the higher concentration ranges/towards the end of the tests (Figure 3B). This is related to the lower membrane resistance, which stayed constant throughout the test (Table 2). Flemion had a slight increase in resistance (0.068 Ω cm2), while Sx-2301-Wn remained constant. This could be attributed to increase in resistance in the carboxylated layer, which is only present in the Flemion membrane. If this layer is contacted with an acidic solution, the carboxylic functional groups become protonated and lose their charge (Balster et al., 2004). This reduces the IEC capacity of the membrane, increases the water content and leads to more hydroxide back migration. This was tested separately by measuring the membrane resistance after soaking the membranes for 72 h in 0.2M H2SO4. Supplementary Table S2 confirms the hypothesis and shows the increased resistance of 13.859 (Ω cm2) for Flemion, while Sx-2301-Wn (0.513 Ω cm2) and CMI-7000 (0.615 Ω cm2) showed a slight decrease in resistance. The lower CE and increased membrane resistance led to a higher energy consumption (Esec) for Flemion (12.49 ± 0.84 kWh/kg LiOH) compared to Sx-2301-Wn (11.87 ± 0.27 kWh/kg LiOH).

Table 2. Cation-exchange membrane resistance (Ω .cm2), measured before and after the low concentration tests in 0.5M Na2SO4.
CMI-7000 had a significantly lower CE, both at high and low concentrations and had a higher standard deviation compared to the other CEMs due to a large difference in CE between both tests. The cell voltage between both tests also varied largely and CI data show a decrease in cell resistance (0.114 Ω cm2) before and after the tests. Therefore, the loss in performance is attributed to a loss in functionality of the membrane, and thus should not be used for concentrating LiOH. The lower chemical stability compared to the other CEM is related to the polymer backbone, which is a polystyrene-divinylbenzene (Sty-DVB) polymer and is non-fluorinated. Besides, it also had the highest internal resistance, partially caused by its higher thickness, cell voltage and thus highest Esec (14.42 ± 1.69 kWh/kg LiOH).
3.1.2 High LiOH concentration
High LiOH concentrations in the catholyte are desired, as they decrease the intensity of the evaporation and crystallization steps. Therefore, Flemion F-9010 and Sx-2301-Wn were selected to be subjected to a more concentrated LiOH solution (3M), while the anolyte volume and concentration was kept constant to minimize the effect of proton leakage. The same membranes were used as in the low concentration tests.
Figure 4A shows that the highest CE recorded was 56.5% ± 0.3% for Sx-2301-Wn at 3.7M LiOH, while Flemion had a slightly lower CE of 53.4% ± 1.4%. Both membranes have however a significantly lower CE compared to the low concentration LiOH tests, and also a slightly higher cell voltage. The water migration for both membranes is also significantly lower for the high concentration tests (Flemion F-9010: −49%, Sx-2301-Wn: −33%, Supplementary Table S2), and is related to the lower Li+ and Na+ migration. The higher catholyte concentration also decreases the water content in the membrane, but did not improve the hydroxide blocking ability of the membranes.
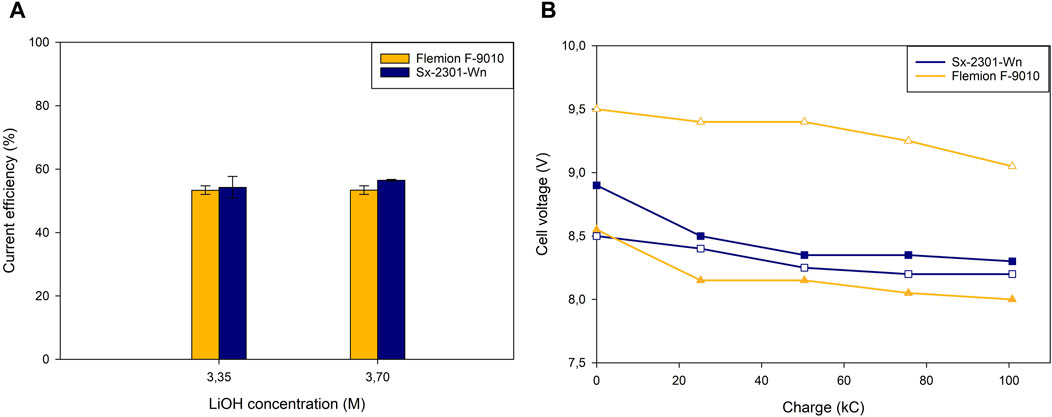
Figure 4. High catholyte concentration: (A) Current efficiency at different catholyte concentrations throughout the experiment and (B) cell voltage vs. applied charge for three different cation-exchange membranes. Hollow points represent duplicates.
The membrane resistance data for Flemion (0.513 Ω cm2) and Sx-2301-Wn (0.477 Ω cm2) show a decrease in resistance compared to the pre-testing measurements (Table 3) and to the low concentration tests in Section 3.1.1 (Table 2). Membranes were soaked in 0.5M Li2SO4 and had therefore a lower cation content than the membranes after the tests with 3M LiOH. This increased the conductivity of the CEM and decreased its resistance. Flemion did not experience an increase in resistance, compared to the low concentration tests, as the pH in the middle compartment was 13.31 ± 0.03 at the end of the test, indicating that the carboxylic layer did not get protonated. Also for Sx-2301-Wn, the pH in the middle compartment was 13.20 ± 0.04, showing that at high catholyte concentrations and low anolyte concentrations, hydroxide back migration is dominant over proton leakage. The cell voltage for Sx-2301-Wn was however approximately 0.4 V higher on average compared to the low concentration tests, while the CEM resistance was lower. The cause for this could be found in the difference in feed concentration and pH and by increased AEM resistance and were further investigated in the experiments described below. The difference in cell voltage for both Flemion tests could be related to an accumulation of impurities inside of the membrane, to which these are very sensitive to (Momose et al., 1991). Further testing is required to confirm this.

Table 3. Cation-exchange membrane resistance (Ω . cm2), measured before and after the high concentration tests in 0.5M Na2SO4.
Overall, Sx-2301-Wn had a lower Esec (16.5 ± 0.1 kWh/kg LiOH) compared to Flemion (18.2 ± 1.4 kWh/kg LiOH), but the Esec increased drastically compared to the low concentration tests. This indicates that the membranes suffer from the increased concentration gradient between catholyte and middle compartment. In the chlor-alkali industry, a maximum efficiency is observed around 7.5M NaOH in the catholyte. At lower catholyte concentrations, the membrane contains too much water, which enables hydroxide back migration through the tunneling mechanism, and above the maximum, the absorbed electrolyte is not fully balanced by the membrane’s counterions, leading to an increased mobility in anions (Gronowski and Yeager, 1991). Increasing the concentration of LiOH in the catholyte could therefore decrease the water content of the membrane even more and increase the CE, but due to the limited solubility of LiOH (5.34M at 20°C), it is not possible to increase the concentration to similar levels as for NaOH. The sulfate content in the LiOH for Sx-2301-Wn was measured and was only 0.41 wt% and 0.44 wt% for low and high concentrations.
3.2 Anion-exchange membranes (AEM)
Four AEMs were tested at low concentration against the same CEM (Flemion) in a similar way as the CEMs. Two proton blocking membranes (Fumasep FAB-130-PK and Selemion AAVN) and two non-fluorinated membranes, stable in high and low pH ranges were evaluated.
3.2.1 Low H2SO4 concentration
Figure 5A shows that Fumasep had the highest CE (85.7% ± 0.5%) at 0.2M H2SO4 compared to Selemion (66.1% ± 2.2%). At 0.6M, Fumasep is still 15% more efficient than Selemion, but seems to be converging towards Selemion. The medium concentration tests were done with a lower anolyte volume (0.5L instead of 1.5L, Supplementary Table S1) and confirmed the converging trend (Figure 5B), with a difference of 13.5% at 0.7M H2SO4 and only 3.5% at 1.3M H2SO4. The water migration was higher for Fumasep compared to Selemion at both low (Fumasep: 70 ± 6 mL, Selemion 20 ± 6 mL) and medium (Fumasep: 0 mL, Selemion −20 mL) acid concentration. This is related to the higher co migration of water in the hydration shell of SO42– over the AEM, but also to the lower proton leakage (and water). However, the water migration with anion migration was significantly lower than the water migration for cation migration (Supplementary Table S3).
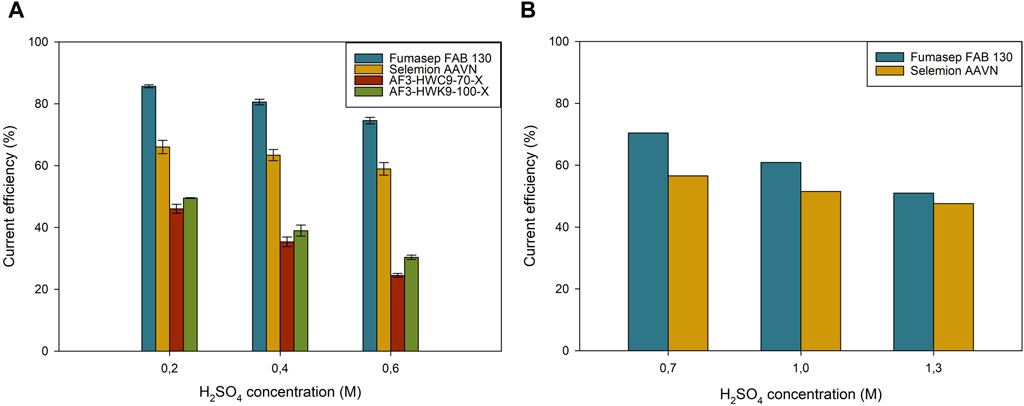
Figure 5. Current efficiency at different catholyte concentrations throughout the experiment for (A) low and (B) medium H2SO4 concentration for different anion-exchange membranes.
The high water migration for Fumasep at low concentrations compared to Selemion can be attributed to the chemistry of the membrane. High ion exchange capacity (IEC) of the membrane tends to increase the water content of the membrane, but also its capacity to migrate anions at low acid concentrations (Jaroszek et al., 2017; Wang et al., 2018). However, at higher acid concentrations, these membranes tend to leak more protons and experience a decrease in CE. The membranes with lower IEC and higher degree of cross-linking or hydrophobicity tend to have better performances at higher acid concentrations (Yu et al., 2022). Based on the CE data from the low and medium concentration tests, one could assume that Fumasep has a higher IEC and water uptake, favoring its performance at low concentrations, while at higher concentrations it gets outperformed by the more hydrophobic Selemion membrane.
Selemion had a slightly lower cell voltage compared to Fumasep at low concentrations (Figure 6A), but were approximately equal at medium concentrations. CI data for both Fumasep and Selemion showed to be very high in neutral environments (5.348 Ω cm2 and 27.48 Ω cm2), but much lower in acidic conditions (1.072 Ω cm2 and 1.113 Ω cm2, Table 4). For this reason, the membrane resistance was measured with the process solutions at the end of the test (Fumasep: 0.64M H2SO4, Selemion: 0.61M) and showed that Selemion had a lower resistance than Fumasep, which can explain the slightly lower cell voltage compared to Fumasep. No significant difference in CEM resistance was measured between different AEM tests. Overall, this resulted in a Esec of 4.99 ± 0.71 kWh/kg H2SO4 for Fumasep, compared to 6.79 ± 0.22 kWh/kg H2SO4 for Selemion to produce 0.6M H2SO4.
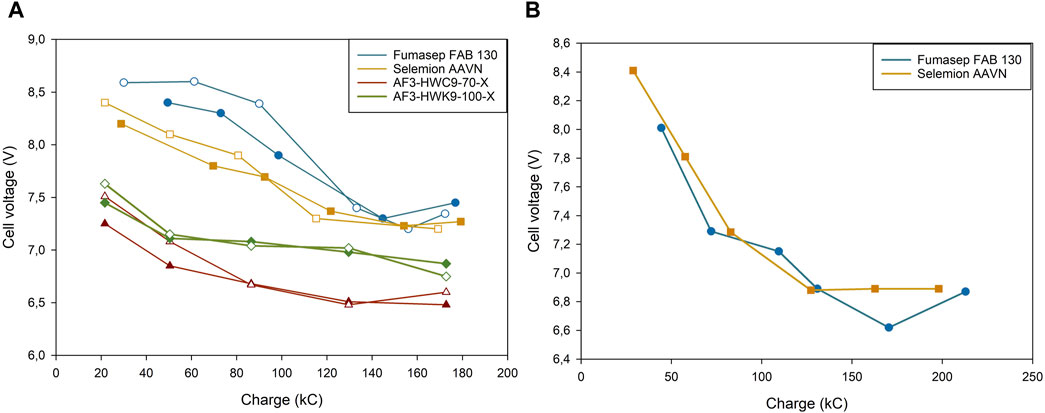
Figure 6. Cell Voltage vs. applied charge of different Anion-exchange membrane tested at (A) low and (B) medium H2SO4 concentrations. Hollow points represent duplicates.

Table 4. Anion-exchange membrane resistance (Ω . cm2), measured before and after the low concentration tests, process solutions are: anolyte: Fumasep: 0.64M H2SO4, Selemion: 0.61M H2SO4, feed: Fumasep: 0.91M Li2SO4, Selemion: 0.92M; catholyte: Fumasep: 2.1M LiOH, Selemion: 2.06M LiOH.
Both Aemion + membranes (AF3-HWC9-70-X and AF3-HWK-100-X) had a significantly lower proton blocking ability, as CEs of 46.1% ± 1.5% and 49.5% ± 0.1% were recorded at 0.2M H2SO4 (Figure 5A). At elevated concentrations, the efficiency dropped even to 21.5% ± 3.7% and 30.4% ± 0.7% respectively. The pH in the middle compartment was, at the end of the test, 1.45 ± 0.02 and 1.61 ± 0.03 respectively, indicating that the membranes had a higher proton leakage to the middle compartment compared to the Fumasep and Selemion membrane at low concentration. On the contrary, the membrane resistance of both membranes from Ionomr Inc. was drastically lower than Fumasep and Selemion, in both neutral and acidic conditions (Table 4). The lower membrane resistance can be related to the higher density in functional groups, which increase the conductivity of the membrane, but also to the poly-imidazolium functional group, which provides a high chemical stability against hydroxide attack and is used in alkaline water electrolysis (Moreno-González et al., 2023). This lower membrane resistance results in a significant lower cell voltage of 0.7–1.0V compared to Fumasep and Selemion. The lower cell voltage could however not compensate the higher proton leakage, and resulted in a higher energy consumption of 9.58 ± 0.27 kWh/kg H2SO4 and 9.53 ± 0.22 kWh/kg H2SO4 for AF3-HWC9-70-X and AF3-HWK-100-X respectively. Due to the low current efficiency at 0.6M H2SO4 for both membranes, these were not tested further in higher H2SO4 anolyte concentrations.
Additionally to the measurements, one could also investigate the lifetime and degradation throughout the harsh conditions of the acids and oxidative species like O2 and Cl2, which can sometimes be present as an impurity (Mei et al., 2018). The reproducibility of the measurements of the AEM do not indicate any degradation of the membranes, but require further and longer testing to confirm this.
3.2.2 High H2SO4 concentration
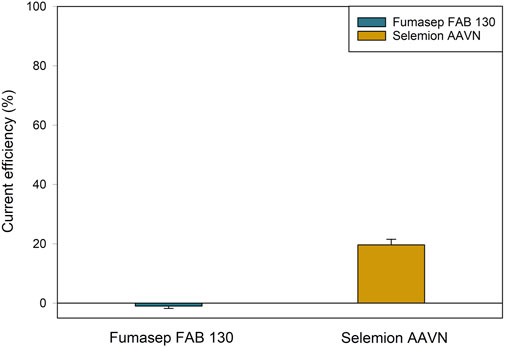
For the reuse of acids in leaching processes, it is desired to have a high acid concentration, as this increases the leaching efficiency of metals from battery scrap (Jung et al., 2021). Therefore, Fumasep and Selemion were tested with an initial anolyte concentration of 3M H2SO4. The CE for both membranes was very low and insufficient for any industrial application (Figure 7). Fumasep even had a negative CE of −1.0%, indicating that more H+ migrated towards the middle compartment than SO42– towards the anolyte. Selemion did better with a CE of 19.6% and final H2SO4 concentration of 3.3M, but is still far from efficiency levels of lower concentrations. The water migration was negative for both Fumasep (−15 ± 2 mL) and Selemion (−5 ± 2 mL) because of the high proton leakage over the AEM. The membrane resistance of Selemion was lower after the tests compared to Fumasep in 0.5M Na2SO4, but did not differ much in 3M H2SO4 (process solutions) (Supplementary Table S4). The lower cell voltage for Selemion can be found in the difference in resistance of the CEM (Flemion), which was less protonated compared to Fumasep because of the lower proton leakage and migration towards the catholyte (CEM Fumasep: 0.599 Ω cm2 vs. CEM Selemion: 0.327 Ω cm2) (Supplementary Figure S2; Supplementary Table S5). Overall, the Esec of Selemion was 10.93 ± 0.79 kWh/kg H2SO4 and is significantly higher than the Esec at low concentrations. No Esec was obtained for Fumasep, as the membrane was not capable of concentrating acid at this anolyte concentration.
3.3 pH controller
Previous tests showed that if the initial volume and concentration of the anolyte and catholyte is equal, proton leakage dominant is over hydroxide back migration, resulting in the acidification of the middle compartment. At a pH < 2, H+ starts to compete with the cation migration and decreases the CE. The H+ competition could be minimized by recirculating a fraction of the catholyte to maintain a constant pH in the middle compartment. This was done in the following experiments by adding an external 2M LiOH solution via a pH controller. Fumasep and Selemion were the selected AEMs while Flemion was the CEM in both tests. The pH control tests were done in duplicate, the uncontrolled EC was not repeated as it showed good similarities to the previous tests.
3.3.1 LiOH production efficiency
The addition of LiOH to the middle compartment improved the CE for OH−production in the catholyte by reducing the H+ competition against Li+ and Na+ (Figure 8). At the end of the test in the uncontrolled EC with Fumasep, the pH was 1.38, resulting in a higher H+ concentration (0.042M). The choice of AEM did not impact the OH−efficiency significantly for the pH controlled tests due to the elimination of the effect of proton leakage, and only a slight difference of 2.3% in CE was measured for the uncontrolled test. For Fumasep, at low LiOH concentration (0.5M), no LiOH is dosed and the CE is very close between both tests (pH control: 81.5 ± 1.3; no pH-control: 79.6). At higher concentrations (1.5M), LiOH addition becomes larger and contributes to a higher CE (75.4% ± 1.9%) compared to the uncontrolled EC (71.2%). Above 2M LiOH, the difference for Fumasep 8%. Selemion showed a similar trend.
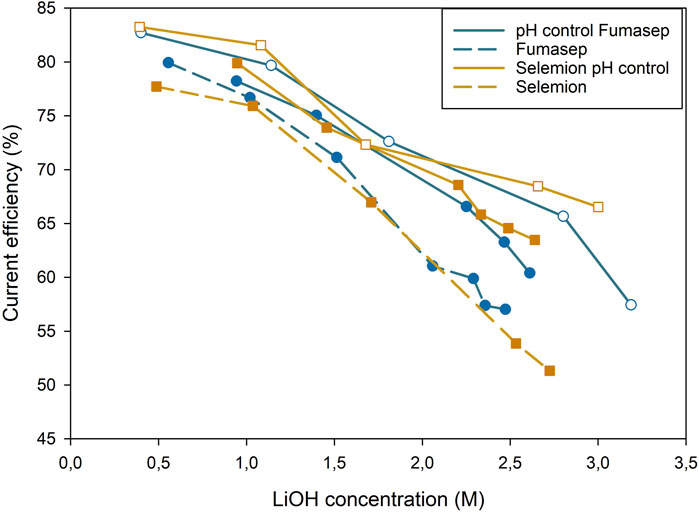
Figure 8. Base production efficiency throughout the test. Full lines represent tests with pH control of middle compartment, dashed lines had no pH control. Hollow data points are repetitions.
3.3.2 H2SO4 production efficiency
At low acid concentrations (0.3M H2SO4), the CE efficiency of the Fumasep EC with pH control was similar to the uncontrolled EC, as no LiOH was added yet (Figure 9). At higher acid concentrations (0.93M), the pH controlled test clearly outperforms the non-controlled one (63.6% ± 0.7% vs. 57.4%). The difference in CE between both configurations remains 5.1% and 5.0% at 1.3 and 1.6M H2SO4 and slightly converges again above 2M H2SO4 (3.8%). The difference in migration efficiency can be attributed to the speciation of H2SO4 at pH 2 and at pH 1.5 or below. At pH 2, the middle compartment contains a 1:1 ratio of SO42–/HSO4−, while at pH 1.5 the solution has a 1:4 ratio (Supplementary Figure S3). The electric mobility, the ability of charged ions to move through a medium under an electrical field, of SO42– is higher than HSO4− due to its divalent nature (Koter and Kultys, 2008). Based on this principle, one could argue that pH 3 or higher is the optimal pH range because 91% of the anions are HSO4−. Increasing the pH too much in the middle compartment could however lead to an increased membrane resistance and higher cell voltage. This was verified by measuring the membrane resistance after soaking the membanes in 0.5M Li2SO4 pH 5, 3 and 1 (Supplementary Table S6). The membrane soaked in pH 5 had the highest resistance when measured in both Na2SO4 (2.746 ± 0.036 Ω cm2) and H2SO4 (1.226 ± 0.022 Ω cm2), while pH 1 had the lowest resistance when measured in Na2SO4 (1.878 ± 0.043 Ω cm2). When measured in 1M H2SO4, pH 3 (0.882 ± 0.023 Ω cm2) had a slightly lower resistance than pH 1 (0.929 ± 0.008 Ω cm2). Increasing the pH of the feed to alkaline ranges can also decrease the lifetime of the AEM, as some functional groups, especially trimethylammonium-based, are prone to hydroxide attack, irreversibly losing its functionality (Marino and Kreuer, 2015; Ramírez et al., 2018). One can thus conclude that raising the pH in the middle compartment too much would increase the cell voltage, counteract the increased CE and potentially decrease the lifetime of the AEM.
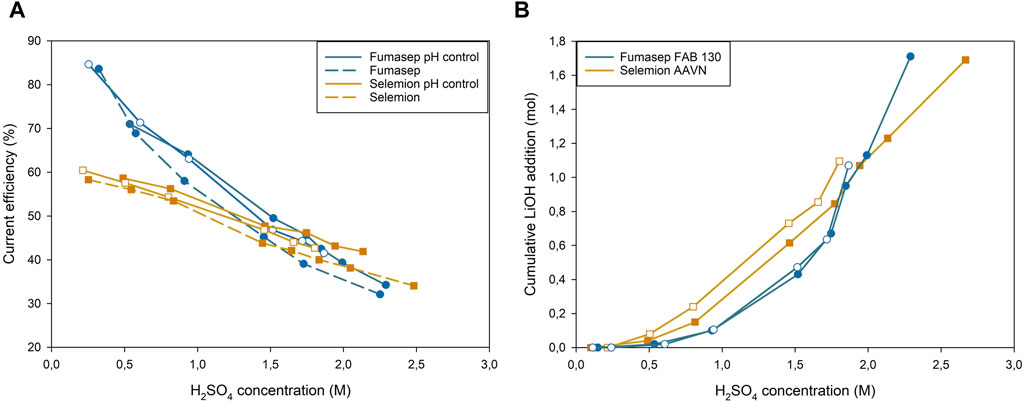
Figure 9. (A) Current efficiency of H+ generation in the anolyte vs. H2SO4 concentration, (B) LiOH addition in the middle compartment vs. H2SO4 concentration in the anolyte.
The increase in CE due to the pH control did not result in a significant decrease in Esec (Fumasep: 9.4 ± 1.1 kWh/kg H2SO4, Selemion: 9.9 ± 1.1 kWh/kg H2SO4) compared to the uncontrolled EC (Fumasep: 9.87 kWh/kg H2SO4, Selemion: 10.15 kWh/kg H2SO4). No large differences were detected in AEM or CEM resistance, but a higher conductivity in the middle compartment was detected for the uncontrolled ECs compared to the pH controlled ECs (Supplementary Figure S4). In the former, the pH decreases to pH 1.4 and has a higher proton concentration (0.042M) compared to the pH controlled EC (0.01M), where the Li+ content is only slightly higher (7%) due to the addition of LiOH. The large difference in conductivity at the end of the tests suggests that the increased proton content results in a lower cell voltage and thus a lower Esec, counterbalancing the gains in CE or increased membrane resistance.
3.3.3 Net OH− production
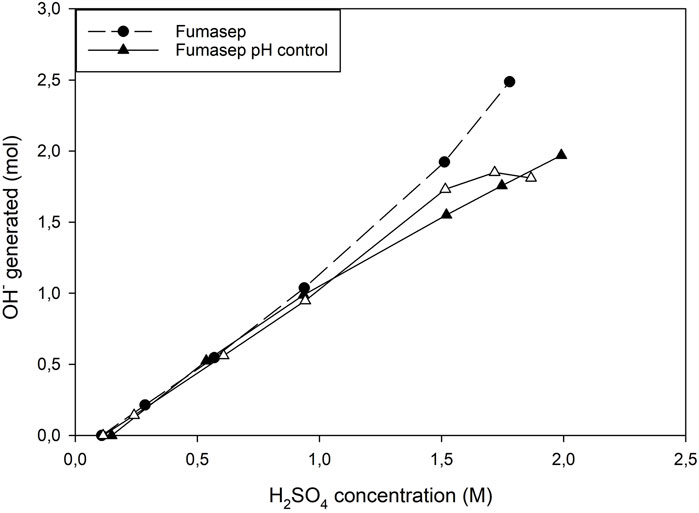
The net OH−production efficiency was calculated for Fumasep and showed that the addition of LiOH to the middle compartment did not result in an increased OH−production (Figure 10). At low concentrations (until 0.6M H2SO4, no LiOH was added and both configurations had similar efficiencies. Above 0.6M, LiOH addition increased the CE of LiOH generation in the catholyte, but a large amount of LiOH needs to be recycled, which leads to a lower overall OH−production efficiency at higher concentrations. Above 1.6M H2SO4, the difference became even more pronounced and results in a slight flattening of the curve of the net OH−production. The Esec was therefore higher (17.3 ± 0.2 kWh/kg LiOH) compared to the uncontrolled (14.98 kWh/kg LiOH) and showed that adding base did not improve the overall Esec. A better approach could be to balance the concentrations of the catholyte and anolyte so that the CE of proton leakage and hydroxide back migration are balanced and the addition of LiOH can be avoided.
4 Conclusion
Three AEM and CEM were tested experimentally to determine their impact on the simultaneous production efficiency of LiOH and H2SO4. Among the main results, the concentration ranges in catholyte and anolyte were established and their resistance and impact on the overall cell voltage was measured. The best CEM was Sx-2301-Wn, which could efficiently concentrate LiOH until 1.7M. At higher concentration ranges, the OH− gradient was too high and resulted in a high OH− back migration. The most efficient AEM was Fumasep FAB-130-PK and was able to concentrate H2SO4 efficiently in low acid concentrations. At higher concentration ranges Selemion AAVN overtook FAB-130-PK in performance, but proton leakage and energy consumption were high for both and require further improvements to efficiently produce concentrated H2SO4.
The recirculation of LiOH to the middle compartment was evaluated to see the effect of a constant pH in the middle compartment. A pH of 2 or higher increased the CE of Li+ by decreasing the competition with H+ and SO42- by increasing the concentration of SO42- over HSO4− at lower pH ranges. A higher pH in the middle compartment on the contrary decreases the conductivity of the electrolyte and increases the resistance of the AEM, resulting in a higher energy consumption for LiOH and H2SO4 combined. Therefore, a trade-off must be made to work at the optimal pH in the middle compartment and the anolyte and catholyte should be balanced so LiOH recirculation can be limited. Increasing the pH too much can also irreversibly damage some of the AEMs because of hydroxide attack.
To achieve concentrated LiOH and H2SO4, it is necessary to improve the hydroxide and proton blocking ability of CEMs and AEMs respectively. Simultaneously, one should keep the membrane resistance as low as possible to minimize energy consumption. The chemical stability of proton blocking membranes should be improved, or electrodes that suppress the evolution of Cl2 could be used to avoid membrane degradation.
Data availability statement
The raw data supporting the conclusions of this article will be made available by the authors, without undue reservation.
Author contributions
GH: Writing–review and editing, Writing–original draft, Visualization, Validation, Supervision, Resources, Methodology, Investigation, Funding acquisition, Formal Analysis, Data curation, Conceptualization. LM: Writing–review and editing, Visualization, Methodology, Investigation, Formal Analysis, Data curation, Conceptualization. WS: Writing–review and editing, Validation, Supervision, Resources, Project administration, Methodology, Funding acquisition, Conceptualization. LB: Writing–review and editing, Validation, Supervision, Resources, Project administration, Methodology, Funding acquisition, Data curation, Conceptualization.
Funding
The author(s) declare that financial support was received for the research, authorship, and/or publication of this article. This research was funded by VLAIO (Flemish Agency for Innovation and Entrepreneurship), grant number HBC.2022.0156 and by the Research and Development Umicore Group. Umicore was not involved in the study design, collection, analysis, interpretation of data, the writing of this article, or the decision to submit it for publication.
Conflict of interest
Author WS was employed by company Umicore.
The remaining authors declare that the research was conducted in the absence of any commercial or financial relationships that could be construed as a potential conflict of interest.
Publisher’s note
All claims expressed in this article are solely those of the authors and do not necessarily represent those of their affiliated organizations, or those of the publisher, the editors and the reviewers. Any product that may be evaluated in this article, or claim that may be made by its manufacturer, is not guaranteed or endorsed by the publisher.
Supplementary material
The Supplementary Material for this article can be found online at: https://www.frontiersin.org/articles/10.3389/frmst.2024.1498810/full#supplementary-material
References
Agmon, N. (1995). The Grotthuss mechanism. Chem. Phys. Lett. 244 (5–6), 456–462. doi:10.1016/0009-2614(95)00905-J
Aguilar, P. G., and Graber, T. A. (2018). Determination of the reaction kinetic parameters for Li 2 CO 3 crystallization from Li 2 SO 4 and Na 2 CO 3 solutions using calorimetric measurements. Industrial and Eng. Chem. Res. 57 (14), 4815–4823. doi:10.1021/acs.iecr.8b00227
Balster, J., Stamatialis, D. F., and Wessling, M. (2004). Electro-catalytic membrane reactors and the development of bipolar membrane technology. Chem. Eng. Process. Process Intensif. 43 (9), 1115–1127. doi:10.1016/j.cep.2003.11.010
Bard, A. J., Faulkner, L. R., and White, H. S. (2022). Electrochemical methods: fundamentals and applications. John Wiley and Sons.
Blommaert, M. A., Aili, D., Tufa, R. A., Li, Q., Smith, W. A., and Vermaas, D. A. (2021). Insights and challenges for applying bipolar membranes in advanced electrochemical energy systems. ACS Energy Lett. 6 (7), 2539–2548. doi:10.1021/acsenergylett.1c00618
Britton, B., and Moreno, M. (2023). (Invited) Aemion+ ® AEM water electrolysis with excellent iridium-free performance and industrially relevant stability in hot, caustic electrolyte. ECS Meet. Abstr. (36), 2031. MA2023-01. doi:10.1149/MA2023-01362031mtgabs
Chen, B., Biancolli, A. L. G., Radford, C. L., and Holdcroft, S. (2023). Stainless steel felt as a combined OER electrocatalyst/porous transport layer for investigating anion-exchange membranes in water electrolysis. ACS Energy Lett. 8 (6), 2661–2667. doi:10.1021/acsenergylett.3c00878
Chen, G. Q., Wei, K., Hassanvand, A., Freeman, B. D., and Kentish, S. E. (2020). Single and binary ion sorption equilibria of monovalent and divalent ions in commercial ion exchange membranes. Water Res. 175, 115681. doi:10.1016/j.watres.2020.115681
Chen, X., Ruan, X., Kentish, S. E., Li, G. K., Xu, T., and Chen, G. Q. (2021). Production of lithium hydroxide by electrodialysis with bipolar membranes. Sep. Purif. Technol. 274, 119026. doi:10.1016/j.seppur.2021.119026
Cherif, A. T., Gavach, C., Cohen, T., Dagard, P., and Albert, L. (1988). Sulfuric acid concentration with an electro-electrodialysis process. Hydrometallurgy 21 (2), 191–201. doi:10.1016/0304-386X(88)90004-7
Dang, H., Wang, B., Chang, Z., Wu, X., Feng, J., Zhou, H., et al. (2018). Recycled lithium from simulated pyrometallurgical slag by chlorination roasting. ACS Sustain. Chem. and Eng. 6 (10), 13160–13167. doi:10.1021/acssuschemeng.8b02713
Erdey-Grúz, T. (1974). Transport phenomena in aqueous solutions. Budapest: Akadémiai Kiadó. Available at: http://opac.mtak.hu/F?func=direct&local_base=MTA01&doc_number=551439 (Accessed March 29, 2024).
European Commission (2020). Communication from the commission to the European parliament, the council, the European economic and social committee and the committee of the regions critical raw materials resilience: charting a path towards greater security and sustainability. Available at: https://eur-lex.europa.eu/legal-content/EN/TXT/?uri=CELEX:52020DC0474 (Accessed March 28, 2024).
Favero, S., Stephens, I. E. L., and Titirci, M. (2024). Anion exchange ionomers: design considerations and recent advances - an electrochemical perspective. Adv. Mater. 36 (8), 2308238. doi:10.1002/adma.202308238
Gangrade, A. S., Cassegrain, S., Chandra Ghosh, P., and Holdcroft, S. (2022). Permselectivity of ionene-based, Aemion® anion exchange membranes. J. Membr. Sci. 641, 119917. doi:10.1016/j.memsci.2021.119917
González, A., Grágeda, M., Quispe, A., Ushak, S., Sistat, P., and Cretin, M. (2021). Application and analysis of bipolar membrane electrodialysis for LiOH production at high electrolyte concentrations: current scope and challenges. Membranes 11 (8), 575. doi:10.3390/membranes11080575
Grageda, M., Gonzalez, A., Quispe, A., and Ushak, S. (2020). Analysis of a process for producing battery grade lithium hydroxide by membrane electrodialysis. Membranes 10 (9), 198. doi:10.3390/membranes10090198
Grant, A., Deak, D., and Pell, R. (2020). The CO2 impact of the 2020s’ battery quality lithium hydroxide supply chain.
Gronowski, A. A., and Yeager, H. L. (1991). Factors which affect the permselectivity of Nafion® membranes in chlor-alkali electrolysis, I. J. Electrochem. Soc. 138 (9), 2690–2697. doi:10.1149/1.2086038
Jaroszek, H., Mikołajczak, W., Nowak, M., and Pisarska, B. (2017). Comparison of the applicability of selected anion-exchange membranes for production of sulfuric acid by electro-electrodialysis. Desalination Water Treat. 64, 223–227. doi:10.5004/dwt.2017.11385
Jarraya, I., Masmoudi, F., Chabchoub, M. H., and Trabelsi, H. (2019). An online state of charge estimation for Lithium-ion and supercapacitor in hybrid electric drive vehicle. J. Energy Storage 26, 100946. doi:10.1016/j.est.2019.100946
Jiang, C., Wang, Y., Wang, Q., Feng, H., and Xu, T. (2014). Production of lithium hydroxide from lake brines through electro–electrodialysis with bipolar membranes (EEDBM). Industrial and Eng. Chem. Res. 53 (14), 6103–6112. doi:10.1021/ie404334s
Jörissen, J., and Simmrock, K. H. (1991). The behaviour of ion exchange membranes in electrolysis and electrodialysis of sodium sulphate. J. Appl. Electrochem. 21 (10), 869–876. doi:10.1007/BF01042453
Jung, J.C.-Y., Sui, P.-C., and Zhang, J. (2021). A review of recycling spent lithium-ion battery cathode materials using hydrometallurgical treatments. J. Energy Storage 35, 102217. doi:10.1016/j.est.2020.102217
Kim, K. (2008). Recovery of lithium hydroxide from spent lithium carbonate using crystallizations. Sep. Sci. Technol. 43 (2), 420–430. doi:10.1080/01496390701784088
Koter, S., and Kultys, M. (2008). Electric transport of sulfuric acid through anion-exchange membranes in aqueous solutions. J. Membr. Sci. 318 (1–2), 467–476. doi:10.1016/j.memsci.2008.03.010
Kreuer, K., Rabenau, A., and Weppner, W. (1982). Vehicle mechanism, A new model for the interpretation of the conductivity of fast proton conductors. Angewandte Chemie Int. Ed. Engl. 21 (3), 208–209. doi:10.1002/anie.198202082
Lee, S., Meng, W., Wang, Y., Wang, D., Zhang, M., Wang, G., et al. (2021). Comparison of the property of homogeneous and heterogeneous ion exchange membranes during electrodialysis process. Ain Shams Eng. J. 12 (1), 159–166. doi:10.1016/j.asej.2020.07.018
Li, K., Fan, Q., Chuai, H., Liu, H., Zhang, S., and Ma, X. (2021). Revisiting chlor-alkali electrolyzers: from materials to devices. Trans. Tianjin Univ. 27 (3), 202–216. doi:10.1007/s12209-021-00285-9
Makuza, B., Tian, Q., Guo, X., Chattopadhyay, K., and Yu, D. (2021). Pyrometallurgical options for recycling spent lithium-ion batteries: a comprehensive review. J. Power Sources 491, 229622. doi:10.1016/j.jpowsour.2021.229622
Marino, M. G., and Kreuer, K. D. (2015). Alkaline stability of quaternary ammonium cations for alkaline fuel cell membranes and ionic liquids. ChemSusChem 8 (3), 513–523. doi:10.1002/cssc.201403022
McKinsey and Company (2023). Lithium-ion battery demand forecast for 2030 | McKinsey. Available at: https://www.mckinsey.com/industries/automotive-and-assembly/our-%20insights/battery-2030-resilient-sustainable-and-circular (Accessed March 28, 2024).
Mei, Y., Yao, Z., Ji, L., Toy, P. H., and Tang, C. Y. (2018). Effects of hypochlorite exposure on the structure and electrochemical performance of ion exchange membranes in reverse electrodialysis. J. Membr. Sci. 549, 295–305. doi:10.1016/j.memsci.2017.12.016
Miao, Y., Liu, L., Zhang, Y., Tan, Q., and Li, J. (2022). An overview of global power lithium-ion batteries and associated critical metal recycling. J. Hazard. Mater. 425, 127900. doi:10.1016/j.jhazmat.2021.127900
Momose, T., Higuchi, N., Arimoto, O., Yamaguchi, K., and Walton, C. W. (1991). Effects of low concentration levels of calcium and magnesium in the feed brine on the performance of a membrane chlor-alkali cell. J. Electrochem. Soc. 138 (3), 735–741. doi:10.1149/1.2085667
Moreno-González, M., Mardle, P., Zhu, S., Gholamkhass, B., Jones, S., Chen, N., et al. (2023). One year operation of an anion exchange membrane water electrolyzer utilizing Aemion+® membrane: minimal degradation, low H2 crossover and high efficiency. J. Power Sources Adv. 19, 100109. doi:10.1016/j.powera.2023.100109
Or, T., Gourley, S. W. D., Kaliyappan, K., Yu, A., and Chen, Z. (2020). Recycling of mixed cathode lithium-ion batteries for electric vehicles: current status and future outlook. Carbon Energy 2 (1), 6–43. doi:10.1002/cey2.29
Pärnamäe, R., Mareev, S., Nikonenko, V., Melnikov, S., Sheldeshov, N., Zabolotskii, V., et al. (2021). Bipolar membranes: a review on principles, latest developments, and applications. J. Membr. Sci. 617, 118538. doi:10.1016/j.memsci.2020.118538
Parsa, N., Moheb, A., Mehrabani-Zeinabad, A., and Masigol, M. A. (2015). Recovery of lithium ions from sodium-contaminated lithium bromide solution by using electrodialysis process. Chem. Eng. Res. Des. 98, 81–88. doi:10.1016/j.cherd.2015.03.025
Pourcelly, G., Tugas, I., and Gavach, C. (1994). Electrotransport of sulphuric acid in special anion exchange membranes for the recovery of acids. J. Membr. Sci. 97, 99–107. doi:10.1016/0376-7388(94)00152-O
Qu, G., Wei, Y., Liu, C., Yao, S., Zhou, S., and Li, B. (2022). Efficient separation and recovery of lithium through volatilization in the recycling process of spent lithium-ion batteries. Waste Manag. 150, 66–74. doi:10.1016/j.wasman.2022.06.039
Rakib, M., Moçotéguy, P., Viers, P., Petit, E., and Durand, G. (1999). Behaviour of Na®onÒ 350 membrane in sodium sulfate electrochemical splitting: continuous process modelling and pilot scale tests.
Ramírez, S. C., and Paz, R. R. (2018). “Hydroxide transport in anion-exchange membranes for alkaline fuel cells,” in New trends in ion exchange studies (IntechOpen), 51–70. Chapter 4 doi:10.5772/intechopen.77148
Sata, T. (2007). Ion exchange membranes: preparation, characterization, modification and application. Royal Society of Chemistry, 135–214. Chapter 5.
Turan, A. Z., Baloglu, H., Ünveren, E., and Bulutcu, A. N. (2016). The behaviour of Nafion® 424 membrane in the electrochemical production of lithium hydroxide. J. Chem. Technol. and Biotechnol. 91 (9), 2529–2538. doi:10.1002/jctb.4853
Wang, L., Li, Z., Xu, Z., Zhang, F., and Efome, J. E. (2018). Proton blockage membrane with tertiary amine groups for concentration of sulfonic acid in electrodialysis. J. Membr. Sci. 555, 78–87. doi:10.1016/j.memsci.2018.03.011
Wei, Q., Wu, Y., Li, S., Chen, R., Ding, J., and Zhang, C. (2023). Spent lithium ion battery (LIB) recycle from electric vehicles: a mini-review. Sci. Total Environ. 866, 161380. doi:10.1016/j.scitotenv.2022.161380
Wilhelm, F. (2001). Optimisation strategies for the preparation of bipolar membranes with reduced salt ion leakage in acid–base electrodialysis. J. Membr. Sci. 182 (1–2), 13–28. doi:10.1016/S0376-7388(00)00519-6
Yu, S., Qian, H., Liao, J., Dong, J., Yu, L., Liu, C., et al. (2022). Proton blockage PVDF-co-HFP-based anion exchange membrane for sulfuric acid recovery in electrodialysis. J. Membr. Sci. 653, 120510. doi:10.1016/j.memsci.2022.120510
Keywords: lithium hydroxide, sulfuric acid, membrane electrolysis, membrane resistance, high concentration
Citation: Henderson G, Martin Diaz L, Schutyser W and Bonin L (2024) Membrane characterization for electrochemical LiOH production from Li2SO4 with simultaneous H2SO4 valorization. Front. Membr. Sci. Technol. 3:1498810. doi: 10.3389/frmst.2024.1498810
Received: 19 September 2024; Accepted: 09 October 2024;
Published: 28 October 2024.
Edited by:
Mohiuddin Md. Taimur Khan, Washington State University Tri-Cities, United StatesReviewed by:
Keith Dana Thomsen, Washington River Protection Solutions, United StatesJoey Chung-Yen Jung, Shanghai University, China
Copyright © 2024 Henderson, Martin Diaz, Schutyser and Bonin. This is an open-access article distributed under the terms of the Creative Commons Attribution License (CC BY). The use, distribution or reproduction in other forums is permitted, provided the original author(s) and the copyright owner(s) are credited and that the original publication in this journal is cited, in accordance with accepted academic practice. No use, distribution or reproduction is permitted which does not comply with these terms.
*Correspondence: Guillaume Henderson, Z3VpbGxhdW1lLmhlbmRlcnNvbkB1Z2VudC5iZQ==
 Guillaume Henderson
 Lara Martin Diaz1,2
 Luiza Bonin
