 Alexander R. Anim-Mensah
- 1African Membrane Society (AMSIC), a Ecole Nationale d’Ingénieurs du Mali Abderhamane Baba Touré, Bamako, Mali
- 2i2i Innovation MegaHub (i2iMegaHub), Accra, Ghana
The demand for polymeric membranes in industries such as fine chemicals, petroleum, and pharmaceuticals underscores the need to optimize organic separation systems. This involves enhancing performance, longevity, and cost-efficiency while tackling chemical and mechanical instabilities. A model is here developed which relates membrane performance, indicated by the permeate solute concentration (Cpi) of species i, to the real-time compressive Young’s modulus (E) during compaction with permeation under a transmembrane pressure (ΔP) or compressive stress. Lower Cpi values indicate better performance. The model integrates solvent densities (ρi), solubility parameters of the membrane (δM), solute (δSo), solvent (δSv), and the extent of membrane constraint (ϕ). It also considers membrane swelling (Ls) and compaction (Lc) with the associated Poisson ratio (γ), providing a comprehensive framework for predicting membrane performance. A key feature is the dimensionless parameter β, defined as ln (Ls/Lc), which describes different operational regimes (β < 1, β = 1, β > 1). This parameter connects membrane affinity characteristics with mechanical properties. The model’s capabilities were demonstrated using three organic separation systems (A, B, and C) which separated isoleucine from DMF, methanol, and hexane solutions, respectively, using nanofiltration (NF) membranes with low, medium, and high E values. The transmembrane pressure ranged from 0.069 to 5.52 MPa (10–800 psi) for β < 1. The performance results indicate that the trend of System B (medium E) > System A (low E) > System C (high E), correlating to decreasing solvent–solute interactions (ΔδSoSv) and compaction levels. Moderate compaction, resulting in moderate membrane resistance and densification, proved beneficial. Cpi–β plots revealed three distinct slopes, corresponding to elastic deformation, plastic deformation, and the densification of membrane polymers, thus guiding optimal ΔP ranges for operation. This model paves the way for advancing polymeric pressure-driven membrane research and offers new insights into membrane selection, testing, design, and operation.
1 Introduction
Polymeric membranes are critical for processes such as delivery, selective transport, discrimination, and separation (Anim-Mensah, et al., 2010). Of these processes, separation is gaining prominence across the chemical, petroleum, and pharmaceutical industries due to its effectiveness, compactness, and cost efficiency (Iulianelli and Drioli, 2020; Jhaveri and Murthy, 2016). Polymeric materials, valued for their flexibility and affordability, have found increasing industrial application, especially in organic solvent environments (Zahid et al., 2018).
However, membranes in such environments face challenges such as excessive swelling and, in extreme cases, dissolution, which compromises performance and longevity (Ebert et al., 2004; Wang et al., 2023). Addressing chemical and mechanical instabilities is crucial to improving operational cost-effectiveness and extending membrane lifespan (Oxley and Livingston, 2024).
Polymeric membranes, especially in pressure-driven systems like ultrafiltration (UF), nanofiltration (NF), reverse osmosis (RO), and gas separation, undergo varying degrees of compaction and densification due to applied transmembrane pressure ΔP (Ng et al., 2019).
Membranes swell upon initial contact with permeating fluids under no pressure, followed by compaction during permeation, leading to densification, reduced porosity, and altered performance (Hung et al., 2022; Sánchez-Arévalo et al., 2023). The compressive stress applied in these systems deforms the polymer structure, causing elastic or plastic deformation and increasing resistance as free volume reduces (Davenport et al., 2020).
Polymeric materials can be categorized based on their stress-strain behavior as soft, medium, or hard, reflecting their resistance to deformation (Rahimidehgolan and Altenhof, 2023). Soft materials, such as polydimethylsiloxane (PDMS) while compressed, exhibit low Young’s modulus and high flexibility, while medium materials like polyvinylidene fluoride (PVDF) and hard materials like polyimide (PI) demonstrate varying degrees of stiffness and strength (Ariati et al., 2021; Overview on PVDF Material, 2024; Overview on PI Material, 2024). Notably, these properties are often measured in the absence of fluids, thus neglecting changes induced by membrane–fluid interactions during operation (Anim-Mensah et al., 2005).
In membrane separation, the interaction between membrane and solvent (ΔδMSv) significantly influences mechanical stability (Anim-Mensah et al., 2005). Strong membrane–solvent affinity can cause excessive swelling, reducing stability, while weaker interactions minimize mechanical impacts (Sánchez-Arévalo et al., 2023). Long-term mechanical stability is essential for reliable performance, yet many existing models fail to incorporate real-time data reflective of actual separation conditions.
To address these limitations, real-time data-driven approaches are needed to better characterize separation systems and enhance membrane performance. Ultrasonic time-domain reflectometry (UTDR) has been identified as a valuable technology for the real-time detection and monitoring of swelling, compaction, and densification, offering flexibility for improving membrane systems (Aghajani et al., 2017). As the demand for advanced polymeric membranes grows, leveraging such technologies will be essential for driving innovation and ensuring sustainable improvements.
Swelling during preparation is inevitable for polymeric pressure-driven membranes due to their constraints and exposure to permeating fluids. During operation, these membranes experience varying degrees of densification caused by compaction under applied transmembrane pressure (ΔP), which significantly influences their performance and stability (Bilad et al., 2022; Chu et al., 2021; Ng et al., 2019).
This model integrates key chemical, mechanical, and thermodynamic parameters into a comprehensive framework for pressure-driven membrane systems. It highlights the relationships between these parameters, offering insights for optimizing membrane design, testing, selection, and operation. The model explains how factors such as membrane constraint, Poisson ratio, swelling, and compaction contribute to densification and membrane resistance, ultimately affecting transport and separation performance. Additionally, it addresses the real-time mechanical behavior of membranes during operation, including variations in Poisson ratio, axial and lateral strains, and Young’s modulus (E), while also accounting for interactions between membrane, solvent, and solution, as well as solvent density, to evaluate impacts on stability and performance.
A key feature of the model is the dimensionless parameter β, defined as β = ln (Ls/Lc), which relates membrane affinity characteristics to mechanical properties by comparing swelling (Ls) and compaction (Lc). This parameter allows the model to describe different swelling and compaction regimes: β > 1 (swelling dominant), β = 1 (swelling and compaction balanced), and β < 1 (compaction dominant).
The model also introduces a novel research direction by rigorously integrating mechanical, chemical, and thermodynamic parameters to improve separation system designs. It emphasizes the importance of incorporating real-time data for accurate membrane characterization and validation, which can help refine existing theories, challenge current models, and develop innovative approaches for better-performing and more reliable membrane systems.
2 Literature review
2.1 Membrane performance: rejection and flux
Membrane performance is commonly assessed based on rejection and flux metrics (Lalia et al., 2013). However, achieving high rejection with near-zero flux may not align with the performance expectations of all users or industries, and vice versa. For some applications, acceptable performance is defined by a balance between rejection and flux, which can vary depending on specific requirements (Scott, 1998).
In practice, different users prioritize performance metrics based on their operational constraints, leading to tradeoffs. Although high rejection and high flux are often desirable, factors such as membrane longevity, stability, and cleaning frequency may require settling for lower or intermediate performance levels. By categorizing rejection and flux into three discrete levels—Low (L), Medium (M), and High (H) —a 3 × 3 performance matrix emerges, presenting nine possible combinations: L-L, L-M, L-H; M-L, M-M, M-H; H-L, H-M, H-H. This framework provides a flexible approach for evaluating and tailoring membrane performance to meet diverse user needs and constraints.
Membrane-observed rejection (Ri) for species “i” is defined as the relationship between the solute concentration in the feed (Cfi) and the solute concentration in the permeate (Cpi) as expressed in Equation 1; this provides a fundamental measure of the separation efficiency of membranes by quantifying the fraction of solute retained by the membrane. It has been widely applied in studies, including Koros et al. (1996) and Anim-Mensah et al. (2008), to evaluate and compare membrane performance under various operating conditions.
Membrane flux (F) is defined as the volume or mass of permeate collected per unit membrane surface area (A) over a given time period (t) (Koros et al., 1996; Anim-Mensah et al., 2008). This metric is a key performance indicator for evaluating the productivity of membrane systems.
Liquid flux (Jw) through a membrane is governed by the relationship between the transmembrane pressure (ΔP), osmotic pressure (Δπ), and the solvent flux mass transfer coefficient (Kw), as expressed in Equation 2a, which captures the driving forces for solvent movement and the resistance offered by the membrane (Zaidi and Saleem, 2021).
The solute flux (Ji) of species “i” across a membrane is described in terms of the solute concentration in the feed (Cfi) and permeate (Cpi), as well as the solute permeability coefficient (Ki). This relationship is mathematically represented in Equation 2b, highlighting the key parameters that govern solute transport through the membrane (Zaidi and Saleem, 2021).
2.2 Behaviors of constrained or unconstrained polymers exposed to stresses
The response of a polymeric membrane, whether constrained or unconstrained, to applied stresses (σ), with or without permeation, can be characterized by its mechanical properties. These include Young’s modulus (E), which quantifies the membrane’s stiffness (Equation 3) and Poisson’s ratio (γ), which describes the relationship between lateral and axial strains (Equation 4) (Anim-Mensah and Govind, 2015).
For most isotropic and elastic materials with unconstrained surfaces under unidirectional pressure, the Poisson ratio (γ) typically ranges between −1 and ½ (i.e., −1 ≤ γ ≤ ½) while the material still remains stable (Ting and Chen, 2005; Greaves et al., 2011). However, scenarios involving constrained surfaces, densification, or anisotropy can result in Poisson ratios beyond this normal range, such as γ > ½ or γ < −1, while still maintaining material stability. Furthermore, materials with different Poisson ratios exhibit distinct mechanical behaviors under stress (Ting and Chen, 2005; Greaves et al., 2011).
Polymeric membranes, whether isotropic or anisotropic, are typically constrained during permeation due to the applied transmembrane pressure (ΔP), leading to densification. This condition is expected to result in Poisson ratios exceeding ½ (i.e., γ > ½) or falling below −1 (i.e., γ < −1) (Ting and Chen, 2005; Greaves et al., 2011). For nanofiltration (NF) membranes, which combine both pore-flow and solution-diffusion mechanisms, the typical operating pressure ranges from 5 to 20 bars (70–290 psi), while reverse osmosis (RO) membranes, governed by solution-diffusion, operate within a range of 7–60 bars (100–870 psi) (Jang et al., 2022). Regardless of the specific membrane process, polymeric pressure-driven membranes are expected to experience varying degrees of densification, occurring simultaneously with swelling and compaction during permeation (Ng et al., 2019).
2.3 Solubility parameter and interactions between species, affinity, and impacts
The interaction between species “i” and “j” is determined by the difference in their individual solubility parameters, Δδij, calculated as Δδij = δi - δj (Alshehri et al., 2021; Anim-Mensah et al., 2007). A closer match in solubility parameters reflects closer cohesive energies and greater affinity between the species (Nehmeh et al., 2023; Miranda-Quintana et al., 2024). Generally, δij ≤ 5 MPa1/2 is associated with high affinity (Soeul National University, 2007).
A higher affinity between a polymeric membrane and solvent could result in excessive swelling, and in extreme cases, degradation of the membrane. Subsequently, excessive swelling could lead to increased membrane compaction, reducing its structural integrity and operational efficiency. Similarly, a high affinity between the membrane and solute can result in persistent fouling or high solute permeation, while a strong affinity between the solvent and solute poses challenges for effective separation. Achieving efficient separations requires a thorough understanding of the interactions among the membrane, solute(s), and solvent(s), which opens up multiple optimization pathways based on solubility parameters and system requirements.
2.4 Membrane swelling (Ls) and compaction (Lc) relationship with Poison Ratio (γ) and compressive Young’s modulus (E)
Figure 1 depicts a portion of a membrane housing containing a membrane with an original thickness Lo and an initial area ABCD, constrained within the housing for operation in crossflow mode. On the high-pressure (HP) side, the membrane is in contact with the fluid to be separated. Under no transmembrane pressure (ΔP = 0), the membrane undergoes swelling, increasing its thickness to Ls and expanding its area to BFEC.
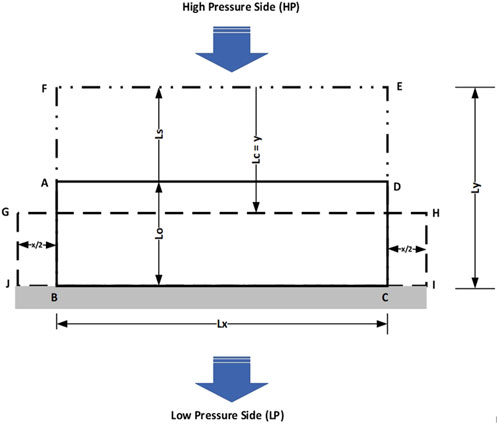
Figure 1. Membrane swelling and compaction for various strains (ε) and Poisson ratio (γ).
When a transmembrane pressure (ΔP = HP − LP) or axial stress (σA) is applied to the swollen membrane BFEC to initiate permeation, the membrane experiences compaction. This reduces the membrane’s thickness by Lc (denoted as “y”) and results in a new compacted area, JGHI. This dynamic adjustment of membrane dimensions reflects the interplay between swelling, compaction, and operational pressure in determining the performance characteristics of the membrane.
The transition from areas BFEC to JGHI corresponds to a thickness change, also referred to as “axial compression thickness” or “compaction”, denoted as “y” (Lc). This compaction is accompanied by total lateral extension “x” (i.e., x/2 + x/2). The axial strain resulting from axial stress (σA) or transmembrane pressure (ΔP) is consistent for both the compressive Young’s modulus (E) and Poisson ratio (γ).
Referring to Figure 1, the axial strain (SA) is mathematically defined as “y/Ly”, while the lateral strain (SL) is defined as “x/Lx”. For a membrane with surface area (A), the compressive Young’s Modulus (E) and Poisson ratio (γ) are expressed mathematically in Equations 5 and 6, respectively.
3 Pressure-driven membrane separation system and considerations for the model
Given a fluid–membrane separation system, a membrane cell houses a well-constrained RO or NF polymeric membrane in contact with a liquid organic feed composed of organic solute (So) and organic solvent (Sv). Under transmembrane pressure ΔP, the solvent permeates through the membrane while the solute is retained.
The extent of affinity between species “i” and “j” is determined by the solubility parameter difference Δij, calculated as the difference between their individual solubility parameters δi and δj. This affinity depends on transmembrane pressure (ΔP) and temperature (T). Specifically, the affinity relationships include the membrane and solvent (δMSv), the membrane and solute (δMSo), and the solute and solvent (δSoSv).
Separation performance, particularly the permeate solute concentration (Cpi), depends on several interconnected factors. One key factor is the extent of membrane swelling (Ls) when the membrane is in contact with the fluid for wetting or preconditioning, which is influenced by the affinity parameter δMSv. Another important aspect is the degree of membrane compaction (Lc) that occurs when membrane is permeated at a given transmembrane pressure and temperature. The material properties of the membrane, solute, and solvent, such as their density (ρi), are also significant and depend on both pressure and temperature. The extent to which the membrane is constrained (ф) in its housing plays a critical role by limiting membrane movement in response to the applied transmembrane pressure and preventing feed bypass during separation.
Additionally, the Poisson ratio (γ) reflects the mechanical response of the membrane when constrained in its housing and compacted under given transmembrane pressure and temperature conditions. The partition or distribution coefficient (Kd) of the solute determines how the solute partitions between the solvent (Cs) and membrane (Cm) at a given pressure and temperature, expressed as Kd = Cs/Cm. The applied transmembrane pressure (ΔP) further influences the separation process, depending on whether the pressure remains within or exceeds the elastic limit of the membrane during compaction. Finally, the membrane design, whether symmetric or asymmetric with varying thicknesses and porosities, affects the compressive Young’s modulus (E) and overall performance.
Each of these parameters exerts a unique level of influence on the membrane’s performance. The permeate solute concentration (Cpi) is mathematically related to the observed rejection (Equation 1). These interconnected factors highlight the complexity of membrane separation systems and the need to consider multiple variables for optimal performance.
4 Features of the Anim-Mensah–Govind model
The parameters discussed in Section 3 were incorporated into the derivation of the model expressed in Equation 7. This model establishes the relationships between critical parameters in a membrane separation system and the specific permeate solute concentration (Cpi). Equation 8 shows the various parameters constraints in Equation 7. The detailed step-by-step derivation and application of this model are presented in Anim-Mensah and Govind (2015). The model serves multiple purposes, including predicting performance trends, enabling system comparisons, aiding characterization, and providing valuable insights into pressure-driven environments where swelling and compaction significantly influence membrane behavior.
The model (Equation 7) excludes the solubility parameter of the membrane (δM); however, ΔδSoSv resultant from the individual solubility parameters of the solvent (δso), membrane (δM), and solute (δso) (Equation 9).
Δδsosv, ΔδMso, and ΔδMsv are the solubility parameter differences between the solute and solvent, membrane and solute, and membrane and solvent, respectively.
In the model expressed by Equation 7, the permeate solute “i” concentration (Cpi) is determined as a function of several key parameters. These include the compressive Young’s modulus (E) measured in N/m2, the solvent density ρso in kg/m3, and the solute partitioning or distribution coefficient (Kd), which is dimensionless and represents the solute distribution between the membrane and solvent. Additionally, the model incorporates the Poisson ratio (γ), which reflects the membrane’s deformation characteristics under compaction during permeation under a transmembrane pressure (ΔP) in N/m2. The solubility parameter difference (ΔδSoSv) in MPa1/2 between the solvent (δSv) and solute (δSo) also plays a role. Furthermore, the model considers the logarithm of the ratio of membrane swelling (Ls) to membrane compaction (Lc), both measured in microns, along the membrane thickness for a constrained membrane (ϕ ≈ 1). A constant value of 1.67e-7 is included for unit conversion purposes.
Inspection of the model (Equation 7) shows that it has two parts, dimensional and dimensionless, with the dimensional part being
Of particular interest is the dimensionless number β, defined as the logarithmic ratio of the membrane’s affinity characteristics to its mechanical characteristics. Simply put, β represents the logarithmic ratio of membrane swelling (Ls) to membrane compaction (Lc), expressed mathematically as β = ln (Ls/Lc). Notably, the axial strain associated with the compressive Young’s modulus (E) at a given transmembrane pressure (ΔP) is equivalent to the axial strain (SA) associated with the Poisson ratio (γ) (Equations 5, 6).
For polymeric pressure-driven membranes constrained in the lateral direction and simultaneously compacted while permeated under a transmembrane pressure in the axial direction, the axial strain (SA) is typically far greater than the lateral strain (SL). This disparity results in high Poisson ratios (γ), as given by γ = −SA/SL for conditions where SA >> SL (Ting and Chen, 2005).
By analyzing Figure 1 and substituting the expressions from Equations 5 and 6 into Equation 10, the equation can be rearranged into Equation 11. This resulting equation is used to predict Cpi based on experimental data and other relevant parameters.
5 Model discussion
From the model (Equation 7), several important relationships can be identified that influence the permeate solute concentration (Cpi) under varying conditions. Membranes with high Young’s modulus (E) are likely to result in higher Cpi values because such materials resist compaction under transmembrane pressure (ΔP), reducing the ability of the membrane to create resistance to solute flux.
An increase in the density of the organic solvent (ρso) is expected to lead to a higher Cpi—that is, low separation performance, particularly as solvent interactions with the membrane intensify. This effect is most evident when moving from non-polar to polar aprotic and polar protic solvents, which can increase solvent–membrane attack. The partition or distribution coefficient (Kd) also plays a crucial role, as higher values indicate stronger solute–solvent than solute–membrane interactions. When the cohesive energies of the solute and solvent are similar, ΔδSoSv approaches zero, where the solvent can pull the solute along, resulting in an increase in Cpi, particularly if the membrane is not optimally selected for the separation task.
Practically, Cpi can either be positive or zero, depending on the values of the Poisson ratio (γ = -SA/SL) and the dimensionless parameter β = ln (Ls/Lc (=y)) (Equation 10). These factors interact to create a range of possible outcomes under varying transmembrane pressures (ΔP) or compressive axial stresses (σA). Exploring these scenarios subsequently provides valuable insights into the behavior and performance of different membrane systems.
5.1 Scenario 1: Ls > Lc, Lc ≈ 0, ΔP = σA= 0
When a membrane constrained in its housing or cell is exposed on the high-pressure side to the fluid to be separated, it undergoes swelling in the absence of any transmembrane pressure (ΔP) or axial stress (σA). Under these conditions, the swelling thickness (Ls) is significantly greater than the compaction thickness (Lc), with Lc ≈ 0. As a result, the dimensionless parameter β = ln (Ls/Lc) approaches infinity (∞), indicating a very high permeate solute concentration (Cpi), as predicted by Equation 7. In this scenario, Cpi may approach the feed solute concentration (Cfi) due to the membrane network opening caused by swelling and the absence of a transmembrane pressure to induce compaction.
Fluid permeation from the high-pressure to the low-pressure side of the membrane occurs through mechanisms such as capillary action, interactions, wetting, and fluid weight. The resulting Cpi value depends on the extent of membrane swelling and the density of the solvent, which directly affects the separation dynamics.
5.2 Scenario 2: Ls > Lc, Lc > 0, ΔP = σA > 0, a very small applied ΔP = σA
When a membrane constrained in its housing or cell is exposed on the high-pressure side to the fluid to be separated, it undergoes swelling in the absence of significant transmembrane pressure (ΔP) or axial stress (σA). When a very small transmembrane pressure or axial stress is applied, it results in minimal to no lateral strain (SL) due to the membrane’s lateral constraint. In this scenario, the swelling thickness (Ls) remains greater than the compaction thickness (Lc), with Lc > 0. The small applied pressure or stress does not fully restore the membrane to its original thickness, leaving the network slightly open due to the swelling effect. Here, the membrane behaves like a cork, exhibiting a Poisson ratio (γ) close to zero (γ ≈ 0).
Since Ls > Lc, the ratio Ls/Lc > 1, and the dimensionless parameter β becomes positive. Under these conditions, the permeate solute concentration (Cpi) is also positive and is described by Equation 12, reflecting the partial closure of the membrane network and its impact on separation performance.
With the membrane network remaining partially open, the Cpi value is expected to be high due to the incomplete closure of the network, allowing more solute to pass through. The extent of Cpi depends on factors outlined in Equation 12, including membrane swelling and compaction, solvent density, and solute–membrane interactions.
5.3 Scenario 3: Ls = Lc, Lc > 0, ΔP = σA > 0, a small applied ΔP = σA
A membrane constrained in its housing or cell is exposed on the high-pressure side to the fluid to be separated and allowed to swell under no transmembrane pressure (ΔP) or axial stress (σA). When a small transmembrane pressure or axial stress (σA) is applied, the membrane experiences some lateral strain despite being constrained in the lateral direction. In this scenario, (Ls = Lc) and Lc > 0, indicating that the small transmembrane pressure or axial stress restores the membrane to its original thickness while maintaining an open network. However, the polymer structure still retains its free volume. The axial strain exceeds the lateral strain, resulting in a Poisson ratio greater than ½ (γ > ½).
When Ls = Lc and γ > ½, the negative value of (1-2γ) becomes irrelevant because β = 0 (i.e., ln (Ls/Lc = 1)). Consequently, Cpi = 0, as it is the product of 1/(1-2γ) and βin Equation 7 or Equation 10; this signifies an expected high to perfect observed rejection, approaching 100%.
5.4 Scenario 4: Ls << Lc, Lc >> 0, ΔP = σA >> 0, applied ΔP = σA in the nanofiltration (NF) range of 5–20 bars (i.e., 70–290 psi)
When a membrane constrained in its housing is exposed on the high-pressure side to the fluid to be separated and allowed to swell under no transmembrane pressure (ΔP) or axial stress (σA), a high transmembrane pressure or axial stress within the nanofiltration range is applied. Despite the membrane being constrained laterally, some lateral strain occurs. In this scenario, Ls << Lc and Lc >> 0, indicating that the applied pressure or stress compresses the membrane significantly beyond its swollen state. This high compaction can lead to reduced free volume (Chu et al., 2021), polymer densification, decreased permeability and selectivity (Hung et al., 2022; Chu et al., 2021), and, over time, shorter membrane lifespan if the membrane is not designed for such conditions.
In this case, the axial strain exceeds the lateral strain, resulting in a Poisson ratio (ɣ) much greater than ½ (ɣ>> ½). For Ls << Lc and ɣ>> ½, (1-2ɣ) is negative, (Ls/Lc < 1), and β = ln (Ls/Lc) is negative. Consequently, Cpi, being the product of 1/(1-2ɣ) and β = ln (Ls/Lc), is positive according to Equations 7 or 10. As a result, the observed rejection associated with Cpi is expected to be less than perfect (i.e., less than 100%). The extent of this imperfection depends on the additional parameters outlined in Equation 12.
5.5 Scenario 5: Ls <<< Lc, Lc >>> 0, ΔP = σA>>> 0, applied ΔP = σA in the reverse osmosis range of 7–60 bars (i.e., 100–870 psi)
A membrane constrained in its housing or cell is exposed on the high-pressure side to the fluid to be separated and is allowed to swell under no transmembrane pressure (ΔP) or axial stress (σA). When a high transmembrane pressure or axial stress within the reverse osmosis range is applied, some lateral strain occurs, even though the membrane is constrained in the lateral direction. In this case, Ls <<< Lc and Lc >>> 0, indicating that the applied pressure or stress compacts the membrane significantly beyond its swollen state. This high level of compaction can result in polymer densification, reduced free volume, and decreased permeability (Hung et al., 2022; Chu et al., 2021). Over time, these effects may lead to a shorter membrane lifespan if the membrane is not appropriately designed for such conditions.
Here, the axial strain exceeds the lateral strain, leading to a Poisson ratio (ɣ) much greater than ½ (ɣ>>> ½). For Ls <<< Lc and ɣ>>>, ½ (1-2ɣ) becomes negative, Ls/Lc < 1, and β = ln (Ls/Lc) is negative. Consequently, Cpi, which is the product of 1/(1-2ɣ) and β, remains positive as per Equations 7 or 10. This implies that the observed rejection associated with Cpi is less than perfect (< 100%) with the extent of imperfection depending on additional parameters in Equation 12.
This behavior highlights how affinity dominates membrane separation mechanisms, as reflected in the model, where ΔδSoSv is squared, emphasizing its influence. For a three-component system involving the membrane, solvent, and solute, their interactions ΔδSoSv, ΔδMSv, ΔδMSo can be categorized into three discrete levels: Low (L), Medium (M), and High (H). These categorizations result in 27 (i.e., 3^3) interaction combinations in a 3D interaction space (Figure 2), providing a simplified framework for evaluating membrane performance.
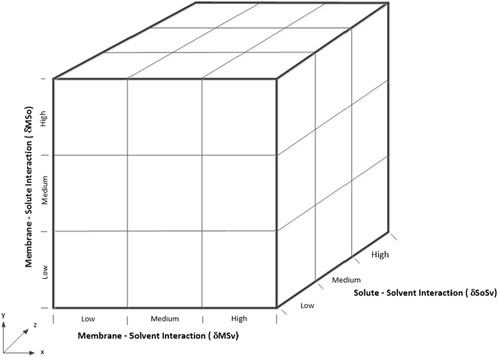
Figure 2. 3D Space membrane - solvent - solvent interaction options deciding membrane performance.
In real-life applications, interactions in membrane systems occur along a continuum, influenced by the complexity of composite or mixed matrix membranes, which are composed of multiple materials, and the diversity of feedstocks containing numerous solutes and solvents. This complexity demands a deep understanding of the interplay between membrane materials, solute–solvent interactions, and operating conditions to design, select, test, and operate membrane systems both maximally and optimally. The present study offers critical insights into effectively addressing these challenges.
The general expectation for polymeric membranes in organic environments is to effectively reject unwanted species in the feed while allowing desired components to permeate at a steady flux. Additionally, these membranes must maintain chemical and mechanical stability to ensure longer operational lifespans, meeting the demands of industrial application (Wang et al., 2023).
6 Model parameter determinations
Real-time measurements of a constrained membrane, whether undergoing permeation or not, including swelling (Ls), compaction (Lc), and lateral movements, can be achieved using the ultrasonic time-domain reflectometry technique (UTDR), with the experimental setup described in Anim-Mensah (2007) and Anim-Mensah and Govind (2015). The compressive Young’s modulus (E) is calculated from the stress-strain relationship obtained from data collected while the membrane is permeated after being wetted by the fluid to be separated. Solvent density (ρso) is typically sourced from published data.
The partition coefficient (Kd) (defined as (Kd = Cs/Cm) can be experimentally determined. In the absence of direct measurements, Kd can be estimated using solubility parameters: solute (δSo), solvent (δSv), and membrane (δM). The solute concentration in the solvent (Cs) is derived from ΔδSoSv (δSo - δSv) and in the membrane (Cm) from ΔδMSo (δM - δSo). If ΔδSoSv < ΔδMSo, the solute will prefer the solvent over the membrane, resulting in Cs > Cm, and thus Kd > 1, and vice versa. Solubility parameters are available in published data or can be calculated from chemical structural formulas (Soeul National University, 2007). Where solubility data is available, it may be used directly in place of Cs and Cm.
7 Model illustrations
Three organic separation systems (A, B, and C) are used to illustrate the model. These systems involve separating solutions of isoleucine in different organic solvents: DMF (polar aprotic) A, methanol (polar protic) B, and hexane (non-polar) C, using low E (A), medium E (B), and high E (C) nanofiltration (NF) membrane materials, respectively. The separations were conducted under transmembrane pressure or compressive stress range of 0.069–5.516 MPa or 10–800 psi. Table 1 provides the relevant data, including published and computed values, which were subsequently used to create Table 2 for further illustration of the systems.

Table 1. Data on membrane separation systems A, B, and C.
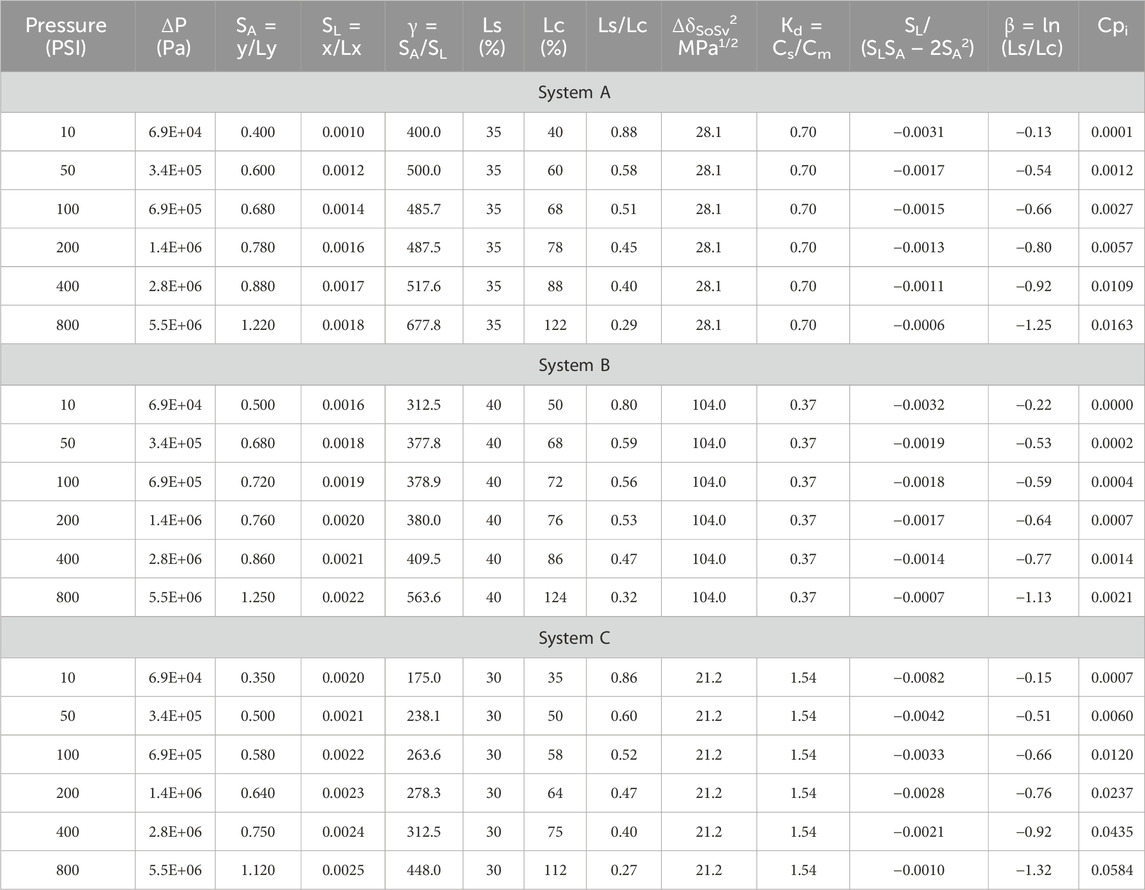
Table 2. Model results for systems A, B, and C using data from Table 1 for illustration.
The data in Table 1, combined with reasonable assumptions and practical experience, were used to create Table 2 for illustration purposes. In real applications, data on swelling, compaction, and membrane lateral strains (SL) are collected in real-time. However, for this illustration and in the absence of direct measurements, it is assumed that all membrane–solvent interactions (ΔδMSv) greater than 5 MPa1/2 do not significantly impact chemical and mechanical stability. Nonetheless, varying levels of swelling (Ls) and compaction (Lc) are expected based on the specific ΔδMSv values. Lower ΔδMSv values close to 5 MPa1/2 from the high side are anticipated to result in more pronounced swelling and compaction than higher ΔδMSv values. Generally, the extent of membrane swelling determines the degree of compaction that is sustained during operation (Anim-Mensah, 2007).
Based on ΔδMSv values in Table 1, the expected trends for both swelling (Ls) and compaction (Lc) during permeation are as follows: System B (ΔδMSv = 6.4 MPa1/2) > System A (ΔδMSv = 9.0 MPa1/2) > System C (ΔδMSv = 11.7MPa1/2), as reflected in Table 2. Steady-state swelling values applied are 40% (ΔδMSv = 6.4 MPa1/2) for System B, 35% for System A (ΔδMSv = 9.1MPa1/2), and 30% for System C (ΔδMSv = 11.7 MPa1/2). Compaction values applied are 50%–124% for System B (ΔδMSv = 6.4 MPa1/2), 40%–122% for System A (ΔδMSv = 9.0 MPa1/2), and 35%–112% for System C (ΔδMSv = 11.7 MPa1/2) for the transmembrane pressure range or compressive stress range of 0.069 MPa–5.516 MPa or 10–800 psi.
Since the membranes in all systems are fully constrained, minor lateral movements occur under the applied ΔP compressive stress to ensure that the membranes seal well in their housing. A high E polymer material, due to its higher resistance to deformation under ΔP, is expected to exhibit greater lateral strain compared to a low E polymer.
Accordingly, the lateral strains used for the systems in Table 2 are as follows: 0.0010–0.0018 for System A (low E), 0.0016–0.0022 for System B (medium E), and 0.0020–0.0025 for System C (high E).
Both Figures 3 and 4 are plotted from data in Table 2. Figure 3 shows the isoleucine separation performance (Cpi) versus the transmembrane pressure ΔPor compressive stress for Systems A, B, and C, while Figure 4 shows the variation of isoleucine separation performance (Cpi) with β for Systems A, B, and C.
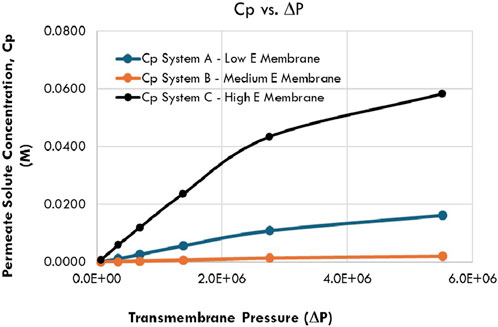
Figure 3. Variation in the permeate solute concentration, Cp with transmembrane pressure (ΔP) or compressive stress for systems A, B, and C.
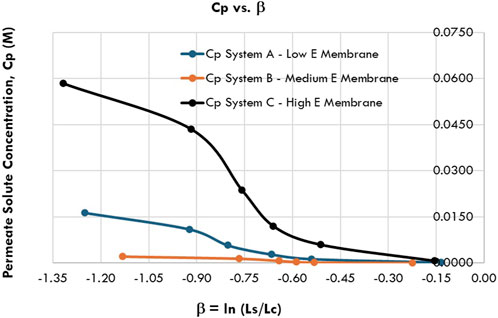
Figure 4. Variation in the permeate solute concentration, Cp versus β for systems A, Bm, and C.
8 Discussion of model illustration results
The behavior of polymeric membranes under increasing transmembrane pressure (ΔP), particularly when constrained and permeated with a liquid feed, involves complex phases and transitions. As pressure increases, these membranes undergo physical and chemical changes that significantly affect their permeability, stability, and overall performance (Hung et al., 2022). These changes include initial plasticization, challenges related to membrane stability, and concentration polarization. At elevated pressures, the concentration polarization layer leads to lower solute rejection rates as solutes accumulate on the membrane surface, potentially causing fouling and clogging. This challenge is especially significant for organic compound separations where selectivity is critical. Collectively, these factors necessitate careful design and application of polymeric membranes for high-pressure conditions (Harman et al., 2014).
From Figure 3, increasing transmembrane pressure (ΔP) or compressive stress generally increases Cpin reducing separation performance for Systems A, B, and C. Without detailed analysis, medium E membrane materials appear preferable, as indicated by the lower Cpi values (Table 2). The performance trend is System B (medium E) > System A (low E) > System C (high E). Medium E materials, which offer compaction levels between that of the low and high Es, performed best, suggesting that both under- and over-compaction are detrimental to performance. Moderate compaction improves outcomes, as confirmed by the calculated Poisson ratio (ɣ) trends: System A (low E) 400–678 > System B (medium E) 313–564 > System C (high E) 175–448. This demonstrates the benefit of reasonable compaction, resistance, and densification.
Table 1 further shows that as ΔδSoSv increases, Cpi decreases, increasing performance, hence, the trend System B (ΔδSoSv = 10.2 MPa1/2) > System A (ΔδSoSv = 5.3 MPa1/2) > System C (ΔδSoSv = 4.6 MPa1/2). ΔδSoSv above 5.0 MPa1/2 indicates reduced solute-solvent interactions and improved performance. Conversely, Cpi increased with increasing ΔδMSv, hence, the trend: System B (ΔδMSv = 6.4 MPa1/2) > System A (ΔδMSv = 9.0 MPa1/2) > System C (ΔδMSv = 11.7 MPa1/2). All ΔδMSv values exceed 5.0 MPa1/2, but the impact of swelling and compaction on System B is minimal due to its optimal membrane–solvent interactions.
Additionally, performance decreased as ΔδMSo values increased, following the trend System A (ΔδMSo = 3.7 MPa1/2 ≈ System B (ΔδMSo = 3.8 MPa1/2) > System C (ΔδMSo = 7.1 MPa1/2). Systems A and B, given ΔδMSo < 5.0 MPa1/2, outperform System C (ΔδMSo > 5.0 MPa1/2). Close cohesive energies between the membrane and solute improve partitioning, with solutes in Systems A and B favoring the membrane over the solvent, compared to System C.
Comparing the values of ΔδMSo and ΔδSoSv explains the performance difference between Systems A and B. For System A, ΔδMSo = 3.7 MPa1/2 versus ΔδSoSv = 5.3 MPa1/2 shows a slight solute preference for the membrane over the solvent while, for System B, ΔδMSo = 3.8 MPa1/2 versus ΔδSoSv = 10.2 MPa1/2 shows a much stronger solute preference for the membrane, resulting in less solute transport and better performance.
The behavior of polymeric membranes under pressure also depends on their structural characteristics, the presence of voids, and polymer–fluid interactions (Kadirkhan et al., 2022). Figure 4 illustrates Cpi versus β for Systems A, B, and C across the applied pressure range of 0.069 MPa–5.52 MPa (10 psi–800 psi). The plots reveal three distinct slopes, likely corresponding to system transitions. As pressure increases, polymeric membranes may transition from a glassy to a rubbery state, characterized by increased chain mobility (Shoghl et al., 2021). This transition, crucial for accommodating permeating liquids, suggests that the first slope corresponds to an optimal operating pressure approximately 0.69 MPa (100 psi).
Polymers under compaction undergo five phases: elastic deformation, plastic deformation, densification, formation of a glassy state, and a compact state (Hoy and Robbins, 2006; Kadirkhan et al., 2022). The three slopes identified in the Cpi-β plots likely correspond to elastic deformation, plastic deformation, and densification phases, given the pressure range of 0.069 MPa–5.52 MPa.
9 Conclusion
In the absence of experimental data, several conclusions can be drawn. First, a membrane system’s performance is influenced by numerous factors, making it essential to identify their individual and combined impacts to effectively optimize and maximize membrane operations. The model successfully relates key parameters in a membrane system, demonstrating their significance in optimally testing, selecting, designing, and operating membrane systems. The dimensionless parameter β serves as a critical indicator, amplifying the distinct phases of polymeric membranes when constrained, permeated, and compacted, helping to identify efficient operating conditions. Moderate E materials, characterized by moderate swelling and compaction, exhibit balanced membrane resistance and densification, potentially enhancing performance. Furthermore, swelling and compaction emerge as crucial parameters that must be carefully considered in membrane system design. A membrane’s performance is dependent on the application as well as the system in which it finds itself. Understanding the chemical, mechanical, and thermodynamic affinities or interactions within a system is vital for achieving desired performance, longevity, and economic efficiency. Finally, this model provides a foundational concept for a new area of research, offering valuable insights to advance the field of membrane science and technology.
Data availability statement
The original contributions presented in the study are included in the article/supplementary material, further inquiries can be directed to the corresponding author.
Author contributions
AA-M: conceptualization, data curation, formal analysis, funding acquisition, investigation, methodology, project administration, resources, software, supervision, validation, visualization, writing–original draft, and writing–review and editing.
Funding
The author declares that no financial support was received for the research, authorship, and/or publication of this article.
Conflict of interest
The author declares that the research was conducted in the absence of any commercial or financial relationships that could be construed as a potential conflict of interest.
Publisher’s note
All claims expressed in this article are solely those of the authors and do not necessarily represent those of their affiliated organizations, or those of the publisher, the editors and the reviewers. Any product that may be evaluated in this article, or claim that may be made by its manufacturer, is not guaranteed or endorsed by the publisher.
References
Aghajani, M., Maruf, S. H., Wang, M., Yoshimura, J., Pichorim, G., Greenberg, A., et al. (2017). Relationship between permeation and deformation for porous membranes. J. Membr. Sci. 526, 293–300. doi:10.1016/j.memsci.2016.12.048
Alshehri, S., Hussain, A., Ahsan, M. N., Ali, R., and Siddique, M. U. M. (2021). Thermodynamic, computational solubility parameters in organic solvents and in silico GastroPlus based prediction of ketoconazole. ACS Omega 6 (7), 5033–5045. doi:10.1021/acsomega.0c06234
Anim-Mensah, A., and Govind, R. (2015). “Prediction of polymeric membrane separation and purification performances,” in A combined mechanical, chemical and thermodynamic model for organic systems (Springer). doi:10.1007/978-3-319-12409-4
Anim-Mensah, A., Mark, J., Mast, D., Krantz, W. B., and Kumar, A. (2005). “A novel evaluation and characterization technique for solvent resistant nanofiltration (SRNF) and reverse osmosis (SRRO) membranes,” in Advances in liquid separation membranes and applications: Part II (02D02), 2005 AIChE annual meeting (accession No. 298d). Available at: https://aiche.confex.com/aiche/2005/techprogram/S2594.HTM.
Anim-Mensah, A. R. (2007). Evaluation of solvent resistant nano-filtration (SRNF) membranes for small-molecule purification and recovery of polar aprotic solvents for Re-use. [dissertation/Doctorate Theis]. Cincinnati (OH): University of Cincinnati. Available at: http://rave.ohiolink.edu/etdc/view?acc_num=ucin1195148766.
Anim-Mensah, A. R., Franklin, J. E., Palsule, A. S., Salazar, , Widenhouse, L. A., Mast, C. W. D. B., et al. (2010). “Characterization of a biomedical grade silica-filled silicone elastomer using ultrasound,” in Advances in silicone and silicone -modified materials ACS symposium series, 1051 chap. 8. Editors S. J. Clarson, J. J. Fitzgerald, M. J. Owen, S. D. Smith, and M. E. Van Dyke, 85–98. doi:10.1021/bk-2010-1051.ch008
Anim-Mensah, A. R., Krantz, W. B., and Govind, R. (2008). Studies on polymeric nanofiltration-based water softening and the effect of anion properties on the softening process. Euro. Polym. J. 44 (7), 2244–2252. doi:10.1016/j.eurpolymj.2008.04.036
Anim-Mensah, A. R., Mark, J. E., and Krantz, W. B. (2007). “Use of solubility parameters for predicting the separation characteristics of poly (dimethylsiloxane) and siloxane-containing membranes,” in Science and technology of silicones and silicone-modified materials. ACS symposium series. Editors S. J. Clarson, J. J. Fitzgerald, M. J Owen, S. D Smith, and M. E Van Dyke (American Chemical Society), 964, 203–219. doi:10.1021/bk-2007-0964.ch014
Ariati, R., Sales, F., Souza, A., Lima, R. A., and Ribeiro, J. (2021). Polydimethylsiloxane composites characterization and its applications: a review. Polym. (Basel) 13 (23), 4258. doi:10.3390/polym13234258
Bilad, M. R., Junaeda, S. R., Khery, Y., Nufida, B. A., Shamsuddin, N., Usman, A., et al. (2022). Compaction of a polymeric membrane in ultra-low-pressure water filtration. Polymers 14, 3254. doi:10.3390/polym14163254
Chu, K. H., Mang, J. S., Lim, J., Hong, S., and Hwang, M.-H. (2021). Variation of free volume and thickness by high pressure applied on thin film composite reverse osmosis membrane. Desalination 520, 115365. doi:10.1016/j.desal.2021.115365
Davenport, D. M., Ritt, C. L., Verbeke, R., Dickmann, M., Egger, W., Vankelecom, I. F. J., et al. (2020). Thin film composite membrane compaction in high-pressure reverse osmosis. J. Membr. Sci. 610, 118268. doi:10.1016/j.memsci.2020.118268
Ebert, K., Fritsch, D., Koll, J., and Tjahjawiguna, C. (2004). Influence of inorganic fillers on the compaction behaviour of porous polymer-based membranes. J. Membr. Sci. 233, 71–78. doi:10.1016/j.memsci.2003.12.012
Greaves, G. N., Greer, A. L., Lakes, R. S., and Rouxel, T. (2011). Poisson’s ratio and modern materials. Nat. Mater. 10, 823–837. doi:10.1038/nmat3134
Harman, B. I., Koseoglu, H., Yigit, N. O., Kabay, N., Akyuz, A., and Kitis, M. (2014). Ceramic membranes in removing boron from processed geothermal waters. Int. J. Environ. Prot. Policy 2 (5), 190–194. doi:10.11648/j.ijepp.20140205.18
Hoy, R. S., and Robbins, M. O. (2006). Strain hardening of polymer glasses: effect of entanglement density, temperature, and rate. Wiley InterScience. doi:10.1002/polb.21012
Hung, T. S., Bilad, M. R., Shamsuddin, N., Suhaimi, H., Ismail, N. M., Jaafar, J., et al. (2022). Confounding effect of wetting, compaction, and fouling in an ultra-low-pressure membrane filtration: a review. A Rev. Polym. 14 (10), 2073. doi:10.3390/polym14102073
Iulianelli, A., and Drioli, E. (2020). Membrane engineering: latest advancements in gas separation and pre-treatment processes, petrochemical industry and refinery, and future perspectives in emerging applications. Fuel Proc. Tech. 206, 106464. doi:10.1016/j.fuproc.2020.106464
Jang, J., Kang, Y., Jang, K., Kim, S., Chee, S.-S., and Kim, I. S. (2022). Ti3C2TX-Ethylenediamine nanofiltration membrane for high rejection of heavy metals. Chem. Eng. J. 437 (1), 135297. doi:10.1016/j.cej.2022.135297
Jhaveri, J. H., and Murthy, Z. V. P. (2016). A comprehensive review on anti-fouling nanocomposite membranes for pressure driven membrane separation processes. Desalination 379, 137–154. doi:10.1016/j.desal.2015.11.009
Kadirkhan, F., Goh, P. S., Ismail, A. F., Wan, M. W. N. F., Halim, M. H. M., Soh, W. K., et al. (2022). Recent advances of polymeric membranes in tackling plasticization and aging for practical industrial CO2/CH4 applications-A review. Membr. (Basel) 12 (1), 71. doi:10.3390/membranes12010071
Koros, W. J., Ma, Y. H., and Shimidzu, T. (1996). Terminology for membranes and membranes processes. J. Membr. Sci. 120, 149–159. doi:10.1351/pac199668071479
Lalia, B. S., Kochkodan, V., Hashaikeh, R., and Hila, N. (2013). A review on membrane fabrication: structure, properties and performance relationship. Desalination 326, 77–95. doi:10.1016/j.desal.2013.06.016
Miranda-Quintana, A. R., Chen, L., and Smiatek, J. (2024). Insights into hildebrand solubility parameters – contributions from cohesive energies or electrophilicity densities? ChemPhysChem 25, e202300566. doi:10.1002/cphc.202300566
Nehmeh, M., Rodriguez-Donis, I., Gerbaud, V., and Thiebaud-Roux, S. (2023). Substitution of hexane in vegetable oil extraction using Computer Aided Molecular Design. Comput. Aided Chem. Eng. 52, 1939–1944. doi:10.1016/B978-0-443-15274-0.50308-5
Ng, D. Y. F., Chen, Y., Dong, Z., and Wang, R. (2019). Membrane compaction in forward osmosis process. Desal 468, 114067. doi:10.1016/j.desal.2019.07.007
Overview on PI Material (2024). MatWeb material property data. Available at: https://www.matweb.com/search/DataSheet.aspx?MatGUID=ab35b368ab9c40848f545c35bdf1a672&ckck=1 (Accessed October 28, 2023).
Overview on PVDF Material (2024). MatWeb material property data. Available at: https://www.matweb.com/search/DataSheet.aspx?MatGUID=a011f8ccf4b448a19246773a32085094&ckck=1 (Accessed November 2, 2023).
Oxley, A., and Livingston, A. G. (2024). Effect of polymer molecular weight on the long-term process stability of crosslinked polybenzimidazole organic solvent nanofiltration (OSN) membranes. Sci. 689, 122149. doi:10.1016/j.memsci.2023.122149
Rahimidehgolan, F., and Altenhof, W. (2023). Compressive behavior and deformation mechanisms of rigid polymeric foams: a review. Compos. Part B Eng. 253, 110513. doi:10.1016/j.compositesb.2023.110513
Sánchez-Arévalo, C. M., Vincent-Vela, M. C., Luján-Facundo, M.-J., and Álvarez-Blanco, S. (2023). Ultrafiltration with organic solvents: a review on achieved results, membrane materials and challenges to face. Proc. Saf. Environ. Prot. 177, 118–137. doi:10.1016/j.psep.2023.06.073
Scott, K. (1998) “Handbook of industrial membranes,” in Technology and engineering. 1st Edition. Elsevier Advanced Technology. doi:10.1016/B978-1-85617-233-2.X5000-4
Shoghl, S., Pazuki, G., and Raisi, A. (2021). A model to predict the solubility and permeability of gaseous penetrant in the glassy polymeric membrane at high pressure. J. Appl. Polym. Sci. 138 (23). doi:10.1002/app.50548
Soeul National University (SNU) (2007). Thermodynamic properties of polymers. Available at: https://ocw.snu.ac.kr/sites/default/files/NOTE/3745.pdf (Accessed June 8, 2024).
Ting, T. C. T., and Chen, T. (2005). Poisson's ratio for anisotropic elastic materials can have No bounds. Q. J. Mech. Appl. Math. 58 (1), 73–82. doi:10.1093/qjmamj/hbh021
Wang, Z., Luo, X., Zhang, J., Zhang, F., Fang, W., and Jin, J. (2023). Polymer membranes for organic solvent nanofiltration: recent progress, challenges and perspectives. Adv. Membr. 3, 100063. doi:10.1016/j.advmem.2023.100063
Zahid, M., Rashid, A., Akram, S., Rehan, Z. A., and Razzaq, W. (2018). A comprehensive review on polymeric nano-composite membranes for water treatment. J. Membr. Sci. and Tech. 8, 179. doi:10.4172/2155-9589.1000179
Zaidi, S. J., and Saleem, H. (2021). Reverse osmosis systems: design, optimization and troubleshooting guide. 1st Ed. Elsevier. Available at: https://shop.elsevier.com/books/reverse-osmosis-systems/zaidi/978-0-12-823965-0.
Nomenclature
Cpi (M) permeate solute concentration for species “i”
E (N/m2) compressive Young’s modulus
ρso(kg/m3) solvent density
Cm (M) membrane solute concentration
Cs (M) membrane solvent concentration
Kd(dimensionless) solute partitioning or distribution coefficient between the membrane (Cm) and solvent (Cs)
γ (dimensionless) Poisson ratio is the ratio of membrane strain in the direction of the transmembrane pressure to the lateral strain
ΔP (N/m2) transmembrane pressure
δSv(MPa½) solubility parameter of the solvent
δSo(MPa½) solubility parameter of the solute
δM(MPa½) solubility parameter of the membrane
ΔδSoSv(MPa1/2) solute (δSo)–solvent (δSv) solubility parameter difference or interactions
ΔδMSv(MPa1/2) membrane (δM)–solvent (δSo) solubility parameter difference or interactions
ΔδMSo(MPa1/2) membrane (δM)–solute solubility parameter difference or interactions
Lc (microns) membrane compaction along the membrane thicknesses
β dimensionless number relating membrane swelling (Ls) to compaction (Lc) as the logarithm of the ratio of membrane swelling (Ls) to compaction (Lc)
ϕ (dimensionless) membrane constraint taking value of 0 (unconstrained)–1 (fully constrained)
1.67 × 10⁻⁷ unit conversion factor
Ri observed membrane rejection of species “i”
Cfi(M) feed solute concentration for species “i”
Jw (m3/m2s) liquid membrane flux
Δπ osmotic pressure
Kw solvent flux mass transfer coefficient
Ji solute flux of species “i”
Ki solute “i” permeability coefficient
Keywords: membrane model, dimensionless number, membrane swelling, membrane compaction, membrane separation
Citation: Anim-Mensah AR (2025) Pressure-driven polymeric membrane performance prediction, new membrane dimensionless number, and considerations for effective membrane design, selection, testing, and operation. Front. Membr. Sci. Technol. 3:1454589. doi: 10.3389/frmst.2024.1454589
Received: 25 June 2024; Accepted: 31 December 2024;
Published: 07 February 2025.
Edited by:
Nadjib Drouiche, Independent Researcher, Algiers, AlgeriaReviewed by:
Sarah Farrukh, University of Edinburgh, United KingdomAli Alshami, University of North Dakota, United States
Copyright © 2025 Anim-Mensah. This is an open-access article distributed under the terms of the Creative Commons Attribution License (CC BY). The use, distribution or reproduction in other forums is permitted, provided the original author(s) and the copyright owner(s) are credited and that the original publication in this journal is cited, in accordance with accepted academic practice. No use, distribution or reproduction is permitted which does not comply with these terms.
*Correspondence: Alexander R. Anim-Mensah, aTJpbWVnYWh1YkBnbWFpbC5jb20=