 Sacide Alsoy Altinkaya
- Department of Chemical Engineering, Izmir Institute of Technology, Izmir, Türkiye
Microfiltration is a commonly used pressure-driven membrane separation process for various applications. Depending on the manufacturing method, either tortuous or capillary pore structures are obtained. The structure plays an important role in controlling flux, selectivity, but most importantly, the fouling tendency of the membrane. This review attempts to cover past and current developments in physical morphology and fouling characterization methods, along with the manufacturing methods for microfiltration membranes. The limitations and advantages of direct microscopic techniques and gas-liquid displacement as an indirect method are discussed for physical characterization. Additionally, the current state of the art and technical challenges for various in-situ and ex-situ fouling characterization techniques are also discussed. Finally, some directions for future research are outlined.
1 Introduction
Microfiltration (MF) is a commonly used pressure-driven separation process with various applications, including particle removal, clarification, water treatment, and biological separation (Anis et al., 2019). Several studies have highlighted the strong and complex relationship between the morphology and fouling behavior of MF membranes (Ho and Zydney, 1996b; Ho and Zydney, 1999a; Hwang and Liao, 2012; Xiao et al., 2014), which remains a significant challenge in their application. Thus, characterizing parameters such as pore size, pore size distribution, pore connectivity, tortuosity, and pore shape is crucial for guiding membrane fabrication to achieve the desired structure for optimal performance. In addition to morphology, characterizing fouling is essential for developing strategies to minimize its impact and for creating predictive models that anticipate when fouling is likely to occur. This review aims to focus on physical morphology and fouling characterization methods for MF membranes.
Over the past three decades, reviews have explored the morphological characterization of porous polymeric membranes, employing various direct microscopic and indirect porosimetric techniques (Nakao, 1994; Sakai, 1994; Khulbe and Matsuura, 2000; Zhao et al., 2000; Chen V. et al., 2004; Yin et al., 2005; Morison, 2008; Jena and Gupta, 2010; Tung et al., 2014; Khulbe and Matsuura, 2017; Johnson et al., 2018; Tanis-Kanbur et al., 2021; Widakdo et al., 2023; Rudolph-Schöpping et al., 2024). Among these techniques, gas liquid porometry is the most frequently used one for characterizing MF membrane morphology owing to its speed and affordability. However, there exists no review covering mathematical models for processing raw data based on the structural features of membranes. Only one review, conducted by Morison (2008) has examined equations for evaluating liquid-liquid porosimetry data. MF membranes exhibit distinct structural features due to alternative manufacturing methods beyond phase inversion. Neglecting these structural features in mathematical models can result in significant errors in determining porosity, pore size, and pore size distribution (PSD) (Islam and Ulbricht, 2019). Thus, the review of the models for the analysis of gas liquid displacement data deserves special attention. Regarding fouling characterization techniques for MF membranes, only a few reviews have addressed this topic comprehensively (Chen V. et al., 2004; Ding et al., 2017; Tummons et al., 2020; Tanudjaja et al., 2022; Huisman et al., 2024), and none have thoroughly covered MF membrane fabrication techniques. This review stands out by bridging these gaps in the literature. It not only provides an in-depth exploration of physical morphology and fouling characterization techniques but also offers insights into fabrication methods for MF membranes. By comparing equations for evaluating gas-liquid porometry data, it contributes to the existing literature.
The review is organized into four sections: 1) fabrication techniques, 2) physical characterization, 3) fouling characterization techniques for MF membranes, and 4) future directions and concluding remarks. The physical characterization section places particular emphasis on the gas-liquid displacement (GLD) method, accompanied by an in-depth review of the mathematical models employed to determine the pore size distribution (PSD) from GLD data.
2 Preparation techniques
Polymeric MF membranes are classified into two categories: “tortuous-pore” structure, where the pores are interconnected through a torturous path, and “capillary-pore” structure, where the pores follow a straight-through path (Baker, 2012). Different preparation techniques including stretching, track etching and phase inversion, are used in the manufacture of MF membranes.
2.1 Stretching
The stretching method involves temperature-controlled uniaxial deformation of the crystalline structure and is thus limited to semicrystalline polymers such as polyethylene (PE), polypropylene (PP) and polytetrafluoroethylene (PTFE). The process begins by creating a precursor film with the desired lamellar morphology through melt extrusion. The film is then annealed at high temperatures to enhance its crystalline structure. Following this, cold-stretching, either uniaxially or biaxially, is performed, usually at room temperature, to induce pore formation through the separation of lamellae. Finally, hot-stretching is conducted at elevated temperatures to further enlarge the pores (Wang et al., 2017). The method controls the porosity, pore size, and mechanical strength of the membranes by adjusting the stretching rate and temperature, as well as by incorporating lubricant during stretching. In the 1980s, Asahi Kasei Corporation introduced the wet process, involving the mixing of ultrahigh molecular weight polyethylene with a hydrocarbon liquid. The mixture is then extruded into a sheet, biaxially oriented, and finally, the liquid is extracted using a solvent (Doi et al., 1975; Doi et al., 1977). Because the wet process involves the use of a solvent and requires post-extraction procedures, leading to higher operating costs, the dry process emerges as a more technologically convenient alternative. Figure 1 demonstrates the morphological changes in the wet and dry processed membranes following biaxial and uniaxial stretching. The dry cast film, resulting from the extrusion of polypropylene (PP) melt with a high draw ratio and rapid cooling, exhibited shish-kebab crystals (Figure 1A). Subsequently, after annealing and uniaxial stretching, continuous slit-like pores developed throughout the bulk structure due to the tearing of lamellar interfaces during stretching (Figure 1B). Figure 1C shows the structure of the ultra high molecular weight polyethylene (UHMWPE) film obtained through extrusion after mixing with plasticizer oil, then cooled within the range from 20 to 40 °C, facilitating solid liquid separation. Consequently, the structure contains UHMWPE crystals and uniformly distributed oil droplets within the cast film.
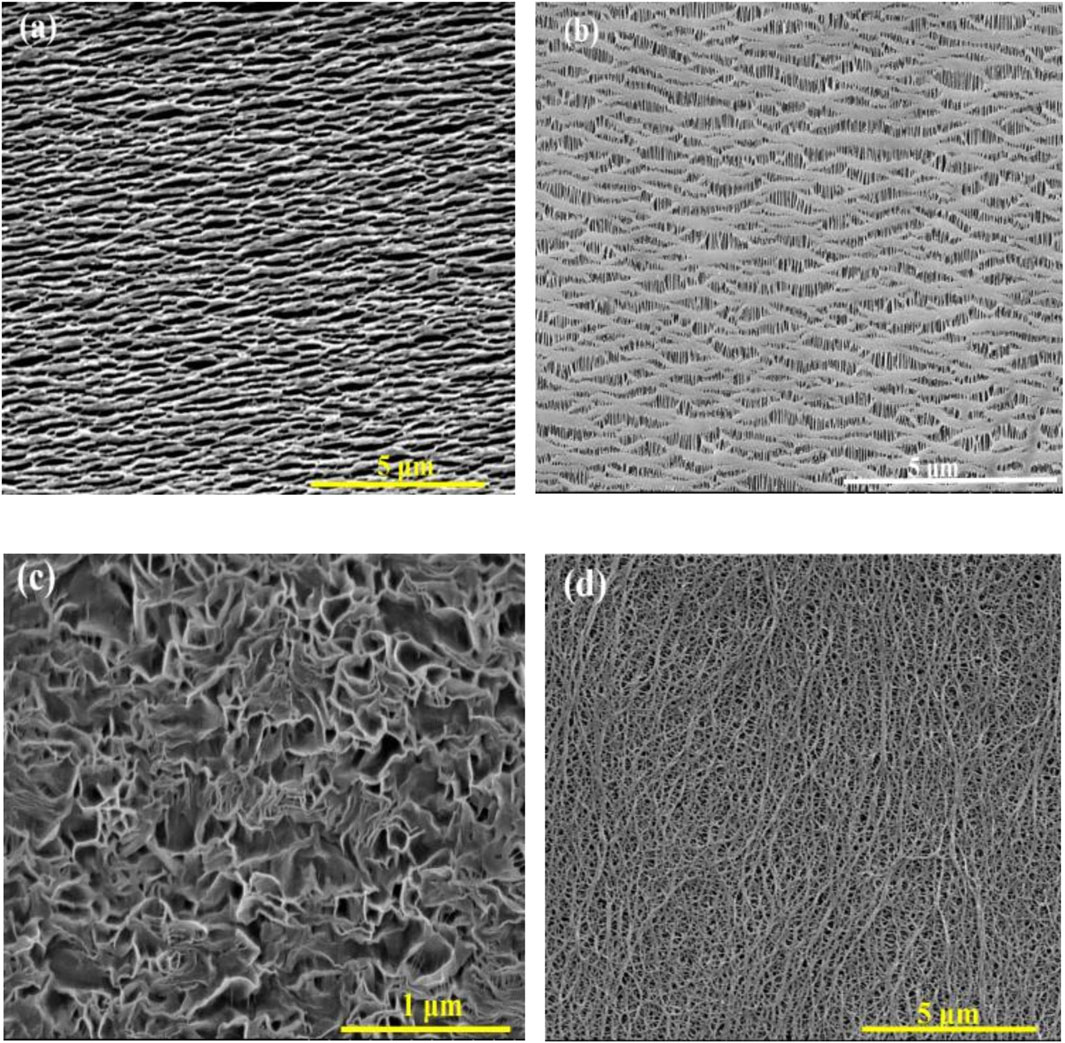
Figure 1. SEM images of (A) dry cast film after etched, (B) dry cast film after uniaxial stretching, (C) cross sectional morphology of wet process cast film, (D) the wet process cast film after biaxial stretching. Copyright (2019) Wiley. Used with permission from Wu et al. (2019), Progresses in Manufacturing Techniques of Lithium-Ion Battery Separators in China, Chin. J. Chem.
2.2 Track-etching
In the track etching method, the polymer film is exposed to highly energetic particles to damage its structure. Subsequently, the damaged film is immersed in an etching solution, which dissolves the damaged molecules, thus forming pores in the structure. This method is capable of producing membranes with a very narrow pore size distribution and low porosity. However, it is restricted to polymers with high thermal stability, such as polycarbonate (PC), PP, polyvinylidene fluoride (PVDF) and polyimide (PI) (Apel, 2001). The distinctive feature of the trach etching method is the possibility of adjusting the pore size and number of pores independently. The pore diameter can change from 100 to 1,000 nm’s (Podgolin et al., 2021) (Figure 2). The pore diameter can be adjusted by changing the etchant concentration, temperature, etching time, addition of surfactants and different solvents in the etching solution to enhance the homogeneity and etching rate (Apel, 2001; Kiy et al., 2021; Froehlich et al., 2022).
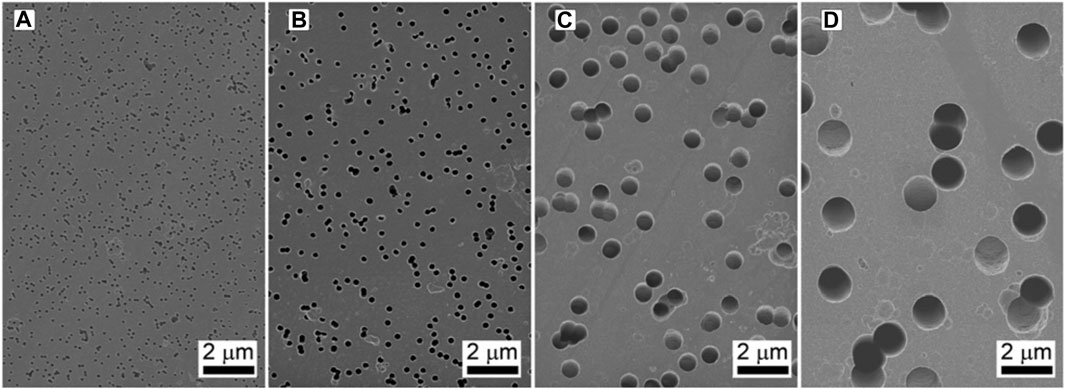
Figure 2. SEM images of track-etched polymeric membrane. (A) 100 nm (B) 200 nm (C) 700 nm (D) 1,500 nm. Adapted from Podgolin et al. (2021) with permission from the Royal Society of Chemistry.
For track etched membranes fouling was reported to be inverse function of porosity. To enhance the surface porosity and average pore area of track etched membranes while decreasing fouling tendency, a combination of two methods was employed. Essentially, the track etched membrane undergoes uniaxial stretching (Hanks et al., 2007; Worrel et al., 2007).
2.3 Phase inversion
Phase inversion stands as the most commonly utilized technique in the preparation of MF membranes. In this technique, an initially homogeneous polymer solution is forced to separate into polymer lean and polymer-rich phases. Phase inversion can be induced by 4 factors: 1) Coagulation in a nonsolvent bath (NIPS) 2) Evaporation (EIPI) 3) Coagulation in vapor phase (VIPS) and 4) Cooling or heating below/above the critical temperature of polymer solution (TIPS) (Mulder, 1996). Among these methods, in EIPS, polymer precipitation is initiated by solvent evaporation, which delays the polymer solidification process.
Different morphologies are produced by varying the demixing rate. In the case of instantaneous demixing during NIPS process, the polymer precipitates and a solid film is formed very rapidly after immersion in the nonsolvent bath. Instantaneous demixing results in a highly porous substructure characterized by fingerlike macrovoids and finely porous, thin skin layers (Figure 3). When demixing is delayed, the membrane structure becomes spongy. The choice of solvent and nonsolvent significantly influences the morphology of the resulting membranes. Higher miscibility between solvent and nonsolvent leads to instantaneous demixing and a more porous membrane. Additionally, adding solvent to the coagulation bath prevents instantaneous demixing. Furthermore, variations in the composition of the casting solution and coagulation bath temperature can be varied to control the demixing rate and morphology of the membrane.
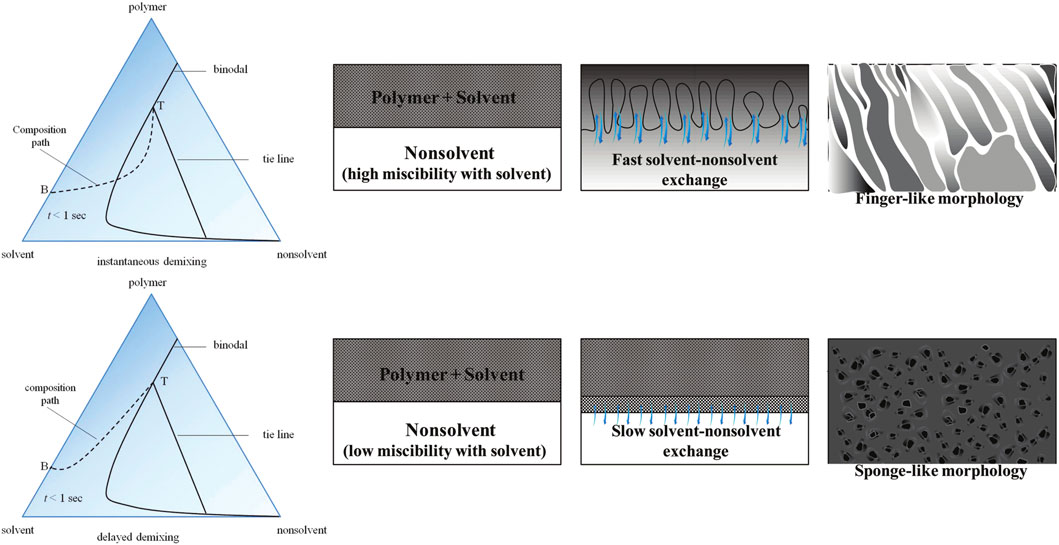
Figure 3. The effect of demixing rate on the morphology of the membranes formed by nonsolvent induced phase inversion technique. Reprinted with permission from Guillen et al. (2011). Copyright 2011 American Chemical Society.
In the VIPS method, the casted membrane is first exposed to nonsolvent vapor and the diffusion of nonsolvent into the membrane and simultaneous evaporation of solvent induces phase separation. In the following step, the membrane is immersed into a coagulation bath to form the final membrane structure. The most important advantage of VIPS method is the slow phase separation allowing to achieve desirable cellular-like or bicontinuous, uniform pore structure. Evaporation temperature and exposure time to vapor phase are two important parameters affecting the morphology. Figure 4 shows that the asymmetric structure of the PVDF membrane changes from the long fingerlike porous to macrovoid-like structure when the evaporation temperature was increased from 50 C to 80 C. Further increase to 110 C resulted in cellular-like porous structure. All the membranes have large open pores at the top surface and cellularlike porous structure adjacent to the bottom surface with the pore size increasing with the increased evaporation temperature. Increasing vapor exposure time changes the cross section morphology from long fingerlike porous structure to the graded density cellularlike porous structure (Figure 5).
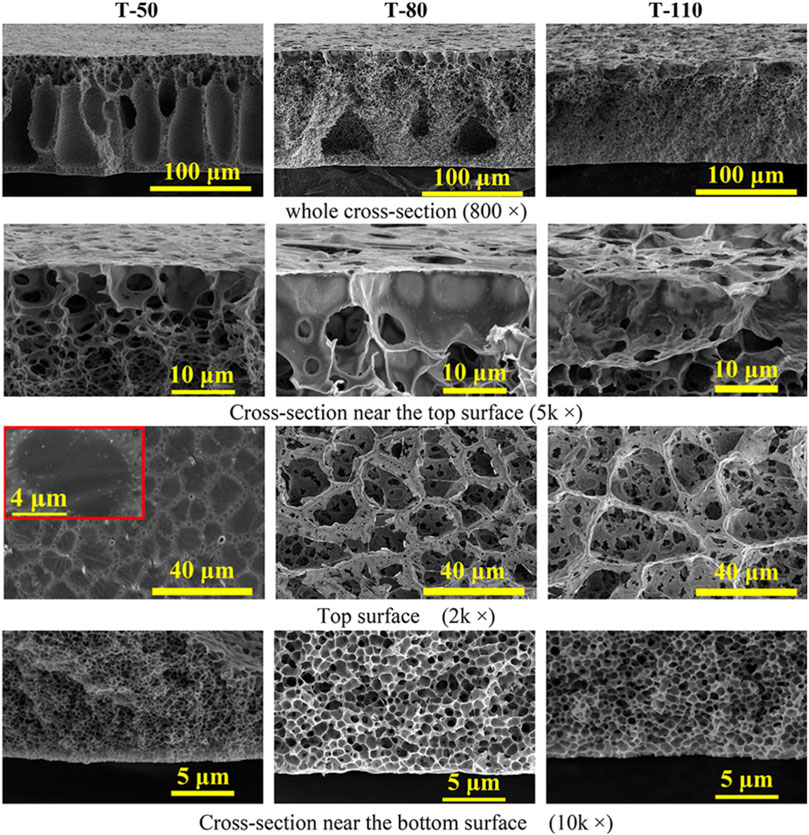
Figure 4. SEM images of cross-section and top surface of the PVDF membranes prepared at different evaporation temperatures. Reprinted with permission from Chen et al. (2020). Copyright 2020 American Chemical Society.
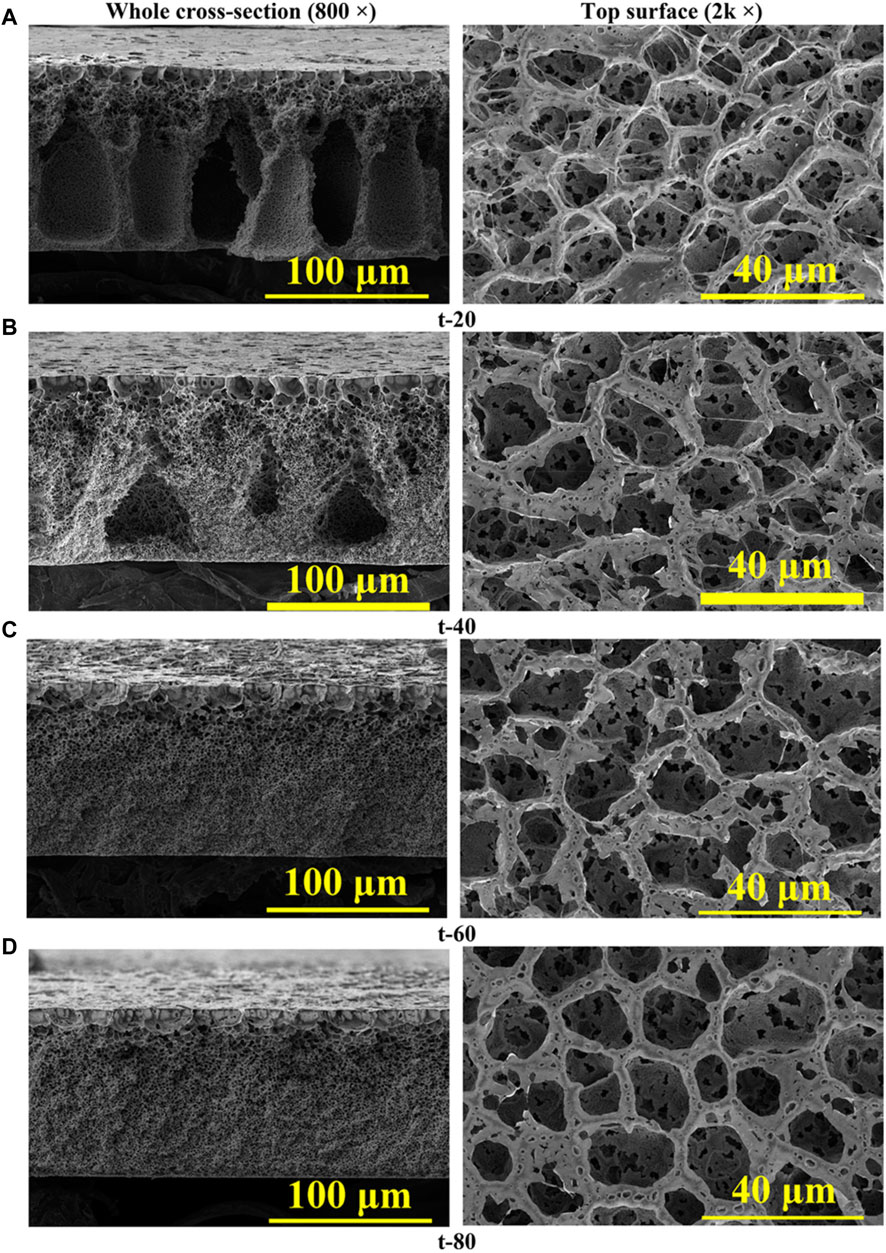
Figure 5. SEM images of cross-section and top surfaces of the PVDF membranes fabricated at different vapor exposure time: (A) 20, (B) 40, (C) 60, and (D) 80 s. Reprinted with permission from Chen et al. (2020). Copyright 2020 American Chemical Society.
Most polymers, such as polypropylene, polyethylene, and PVDF, processed via TIPS, exhibit a semicrystalline nature. Once a stable dope solution is formed, as indicated by the starting point in Figure 6, the temperature is gradually lowered at a controlled rate, leading to either solid-liquid or liquid-liquid phase separation. At high polymer concentrations, phase separation occurs predominantly through solid-liquid (S-L) separation, wherein the polymer crystallizes directly from the casting solution. In contrast, at lower polymer concentrations, liquid-liquid (L-L) demixing occurs after passing through a metastable region. As depicted in Figure 6, L-L demixing yields a cellular morphology, while spherulitic morphology is attained at the conclusion of S-L demixing.
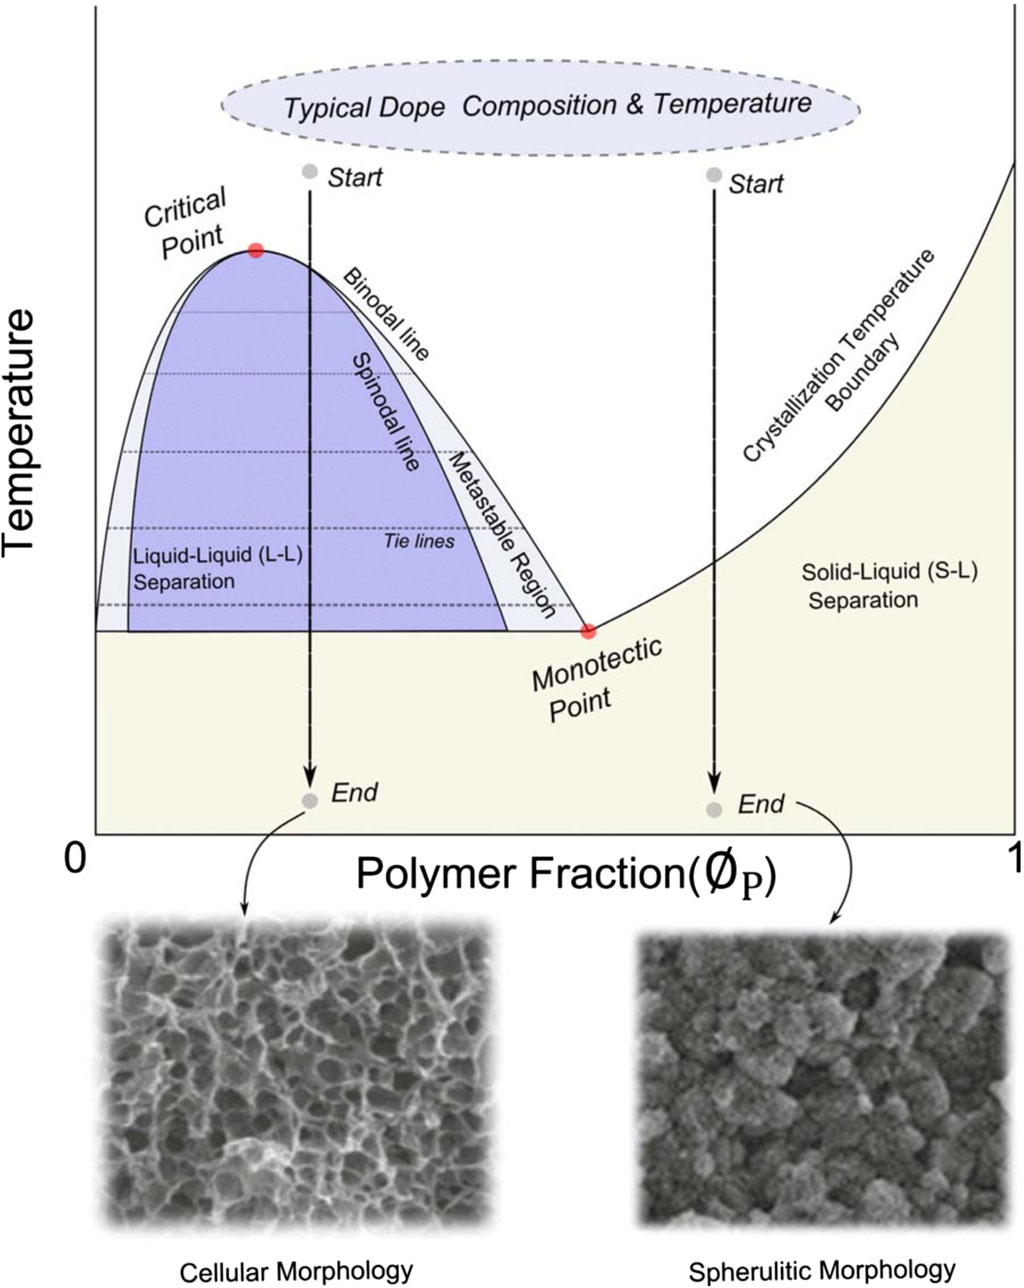
Figure 6. Phase diagram of TIPS process. Copyright (2019) American Institute of Chemical Engineers. Used with permission from Kim et al. (2016), Thermally Induced Phase Separation and Electrospinning Methods for Emerging Membrane Applications: A Review. AIChE Journal.
While phase inversion followed by track etching and stretching methods dominate the production of MF membranes, there are also other methods such as aperture array lithography (Han et al., 2005), selective-etching from the polymer blend (Ilyin et al., 2020; Remanan et al., 2021), phase inversion microfabrication (Gençal et al., 2015), a combination of dip-coating and breath figure approach (Mansouri, et al., 2013) and sacrificial-layer approach (Ji et al., 2010). Table 1 summarizes the methods used for manufacturing MF membranes, while Table 2 lists the polymers utilized in MF membrane preparation via phase inversion, track etching and stretching methods.
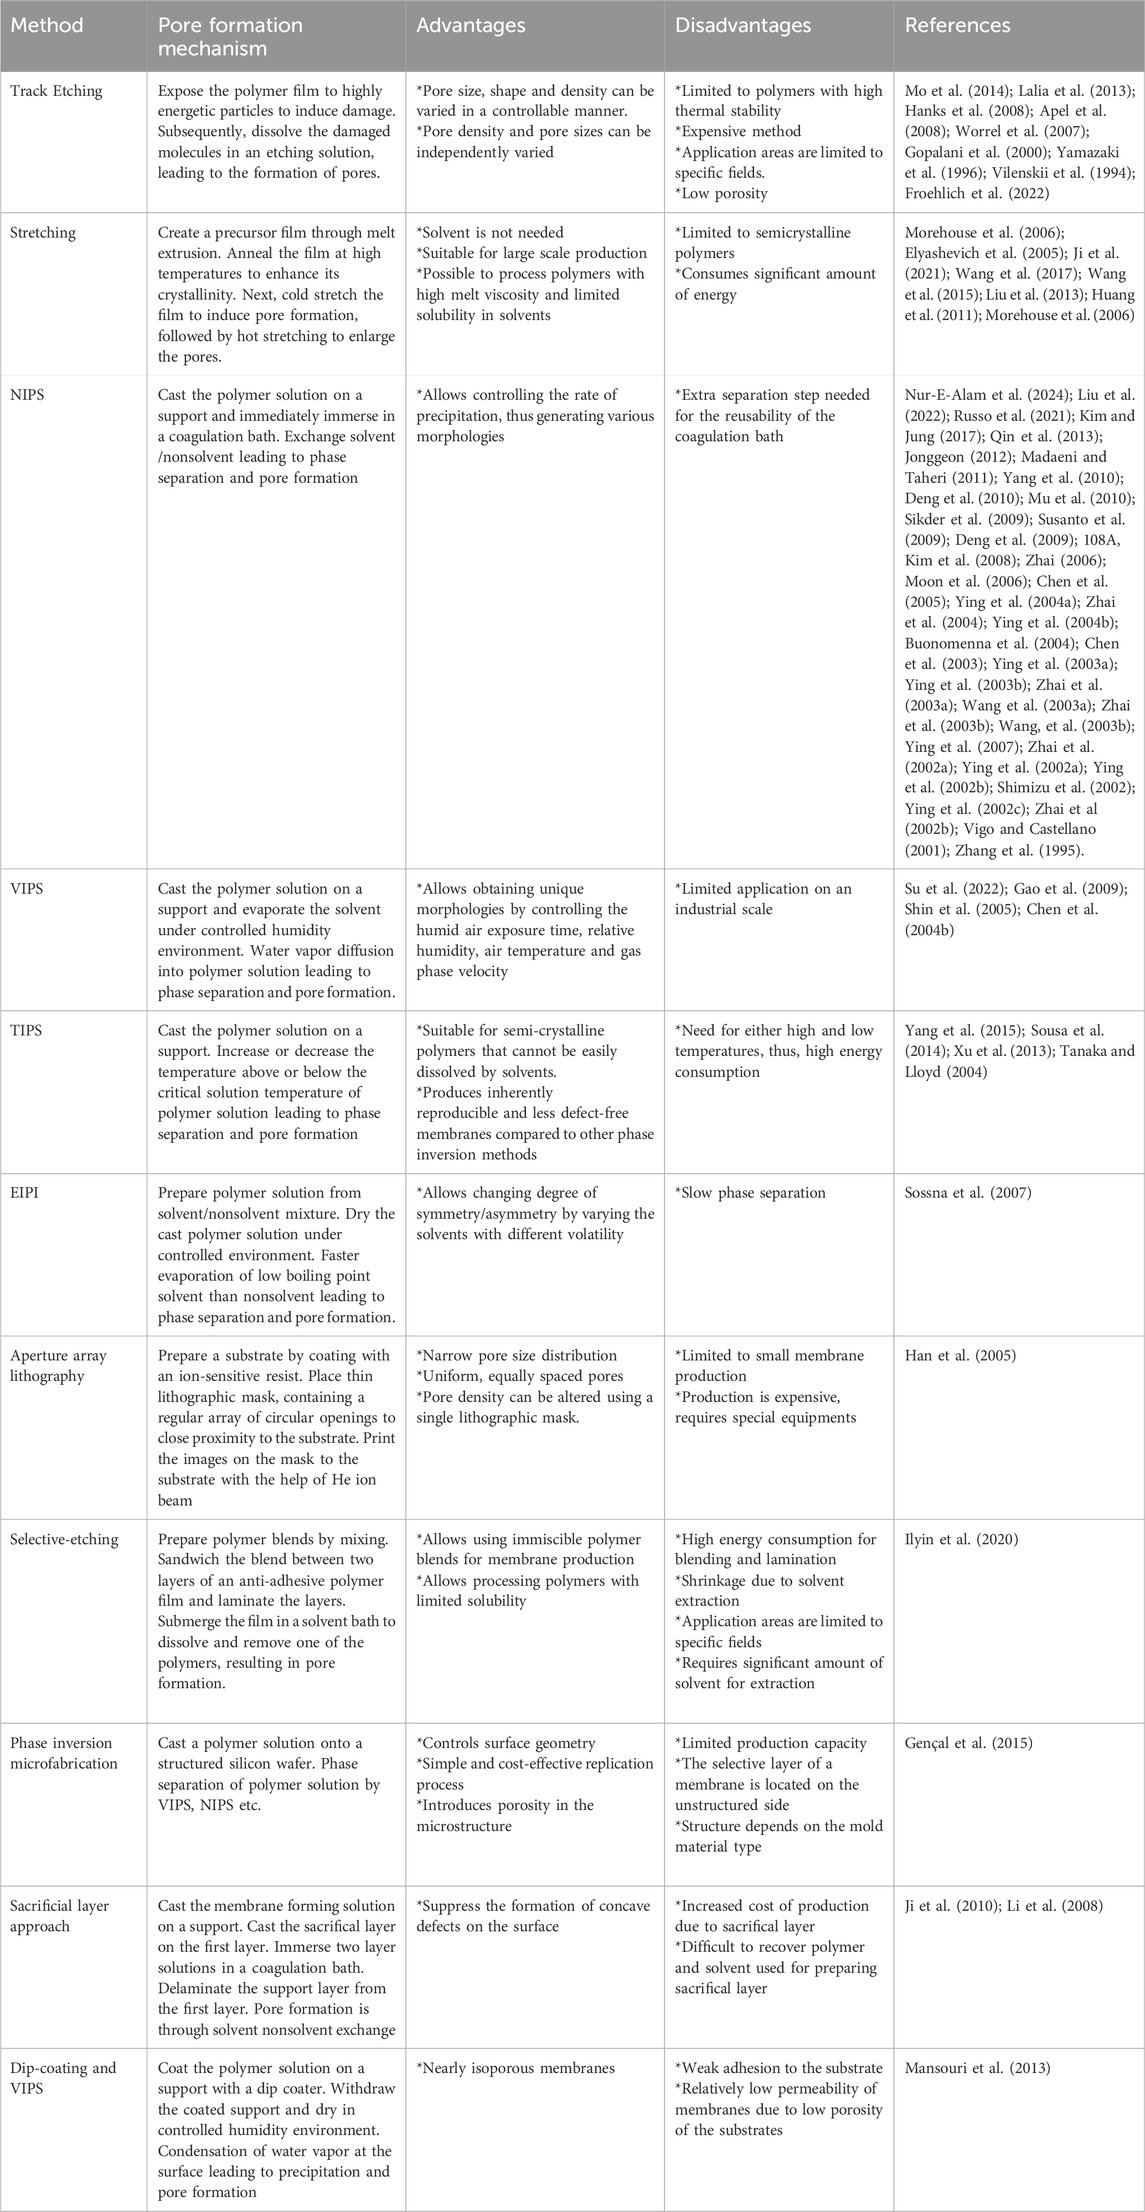
Table 1. Different methods used for microfiltration membrane preparation.
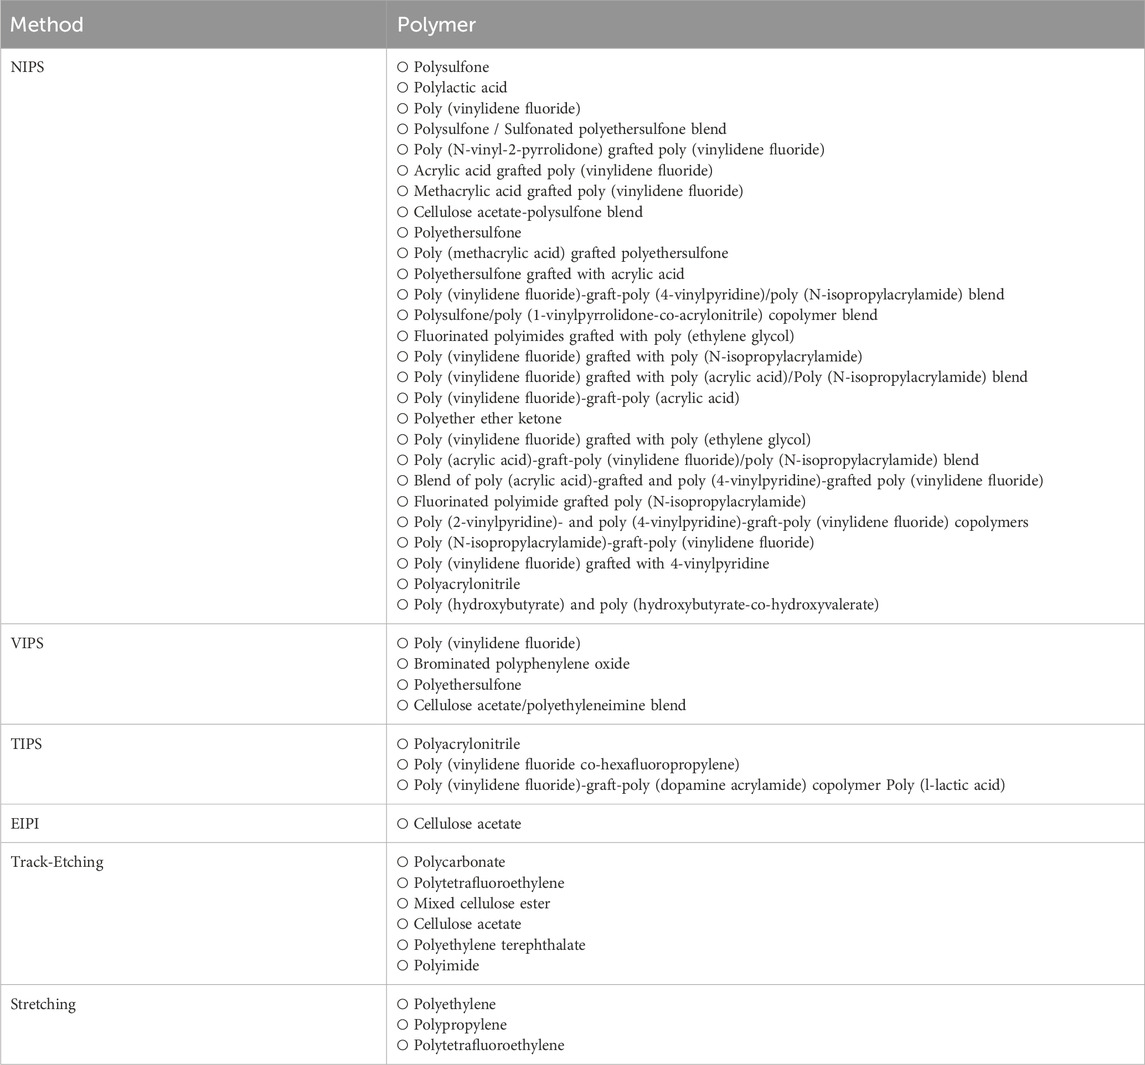
Table 2. Polymers used in the preparation of mf membranes by phase inversion, stretching and track-etching techniques.
3 Physical characterization techniques
Several physical characterization methods have been utilized to determine morphology-related parameters of MF membranes, including pore size, PSD, membrane thickness, and porosity (Zeman and Zydney, 1996). These methods can be classified into two categories: direct and indirect methods. Direct methods include microscopy techniques ranging from SEM, field emission scanning electron microscopy (FESEM), atomic force microscopy (AFM), to transmission electron microscopy (TEM) (Johnson et al., 2018). While direct methods offer advantages like real-time observation, they also come with limitations such as restricted observation area or the need for coating with a conductive material, particularly in the case of SEM and FESEM (Tung et al., 2014). To address these limitations, indirect characterization methods, which rely on theoretical principles to convert measurements into PSDs (Tanis-Kanbur et al., 2021) are widely utilized for membrane characterization. Table 3 summarizes polymeric MF membranes analyzed using indirect physical methods.
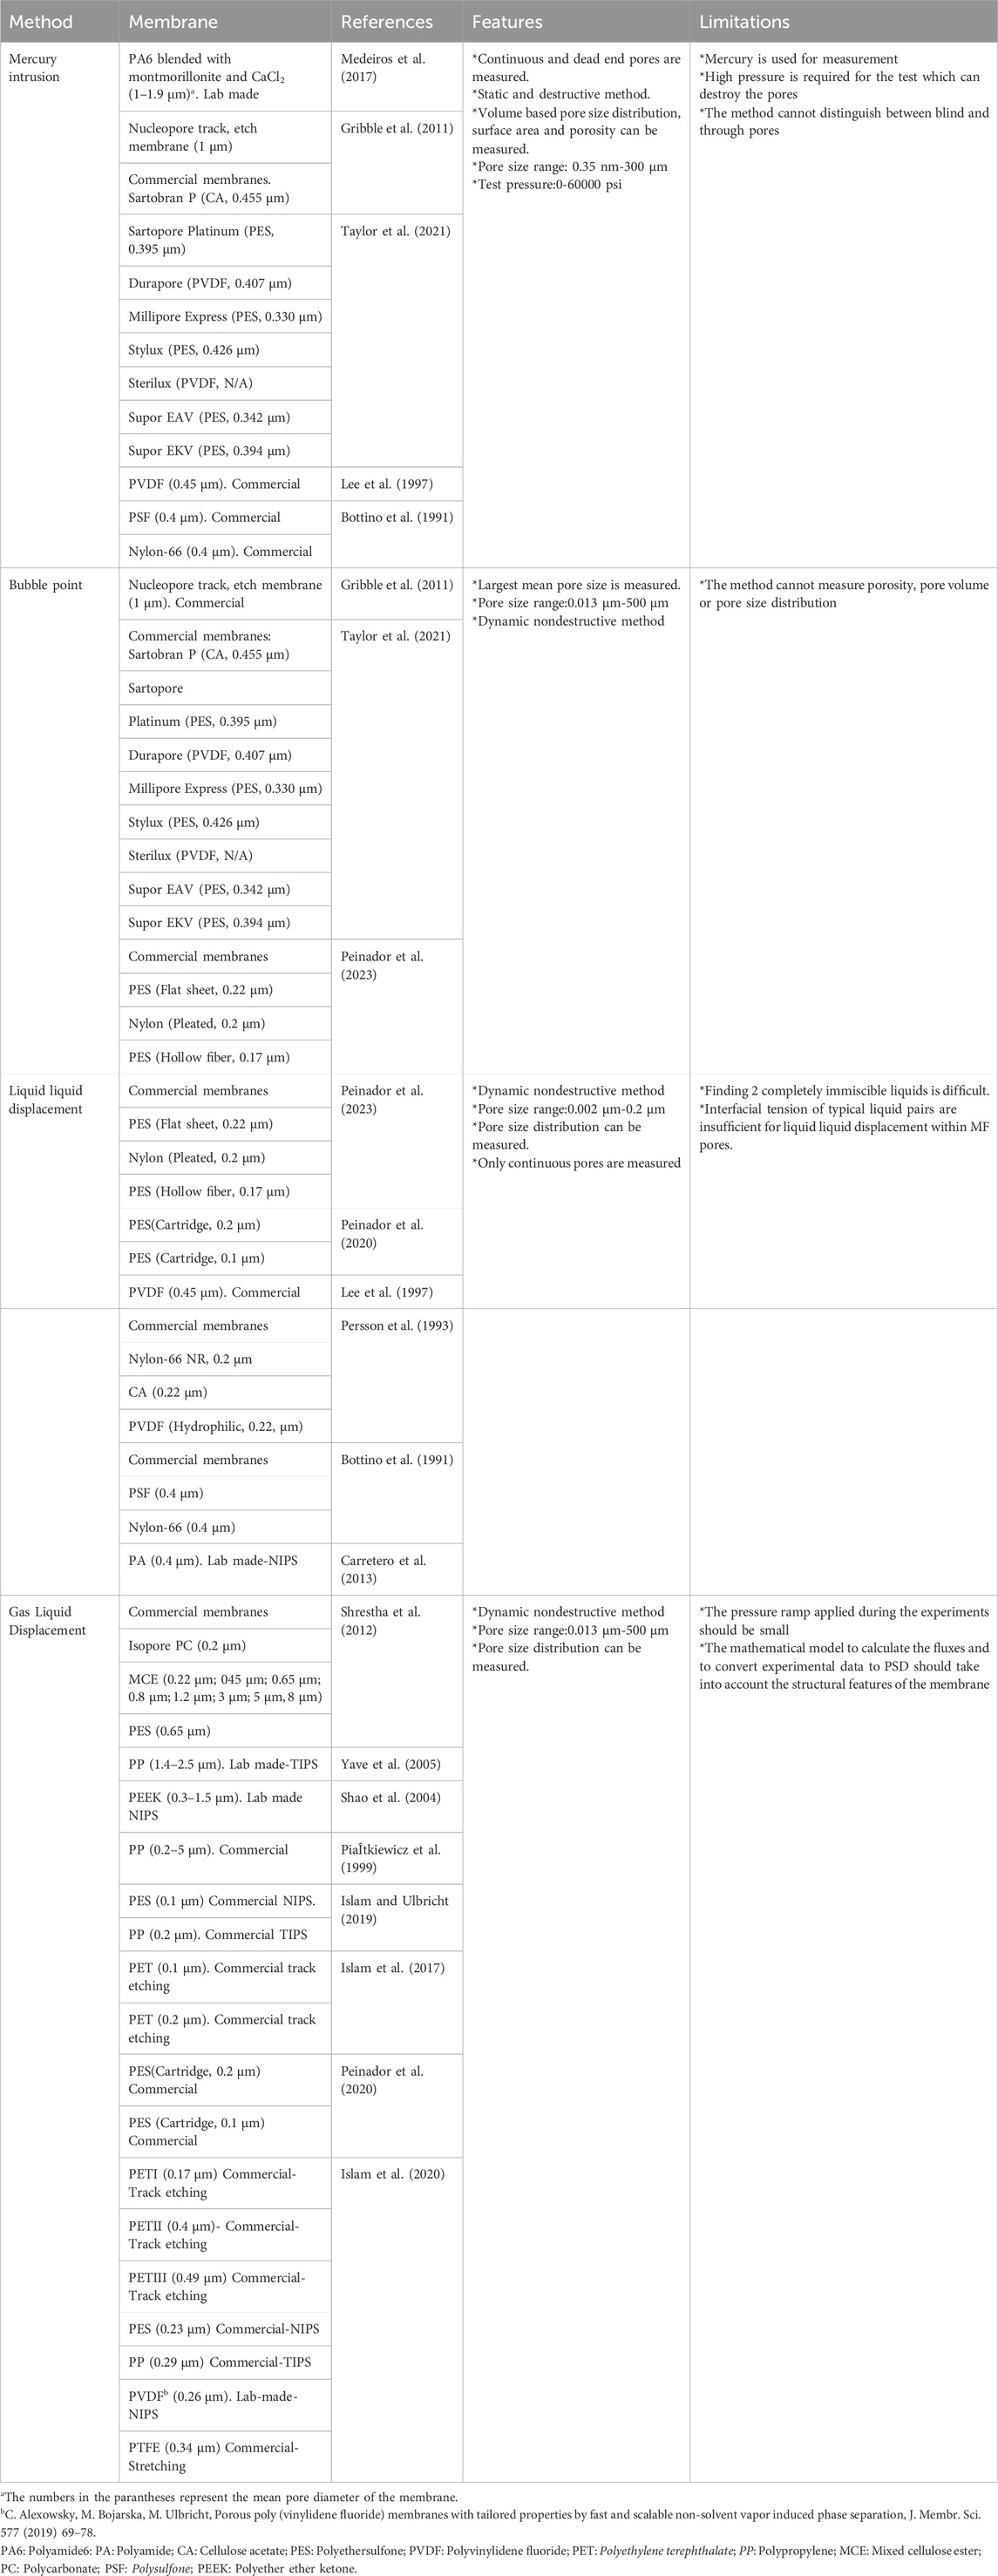
Table 3. Polymeric MF membranes characterized using indirect physical characterization methods.
Among various indirect techniques, Mercury intrusion is commonly used to identify porous materials like catalyst supports and adsorbents, providing details such as specific pore volume and specific internal surface area. However, since Mercury intrusion typically requires very high pressures (Honold and Skau, 1954; Lowell and Shields, 1987), it is not a suitable method for evaluating MF membranes. Capillary condensation, based on the Kelvin equation, provides another means for pore characterization. The method relies on the significant condensation of inert gases like N2 and He, which predominantly occurs within pores with very fine diameters (Dollimore and Heal, 1964). Thus, the primary application of the method is limited to evaluating the PSD of ultrafiltration and nanofiltration membranes. It is important to note that both Mercury intrusion and capillary condensation methods are based on equilibrium and they do not distinguish between through-pores and dead-end pores. Dead-end pores do not contribute to the transport properties of membranes. Consequently, both Mercury intrusion and capillary condensation methods cannot provide precise information about the PSD of membranes. Based on this fact, Jakobs and Koros (1997) suggest using dynamic methods for determining PSD of membranes.
Liquid-liquid displacement (LLD) is one of the dynamic techniques for membrane pore characterization. Initially, all the pores in the membrane under examination are filled with a wetting liquid, facilitated by capillary forces (Kamide and Manabe, 1980; Kesting, 1985). Subsequently, another liquid is introduced into the pores to gradually displace the initial one. By monitoring the dependence of transmembrane pressure on the flux of the displacing liquid, the PSD can be determined. Peinador et al. (2020) analyzed six commercial cartridges made from PES along with the small membrane coupons detached from these cartridges using LLD and GLD, respectively. The results for the mean pore size obtained from both methods was found satisfactory. However, the LLD and GLD methods yielded different results for the number-based PSD. Implementing LLD presents significant challenges, particularly in selecting two appropriate completely immiscible liquids or liquid compositions to replace each other under incremental pressure increase for a given membrane. Water and butanol are commonly used as a liquid pair in LLD. The interfacial tension between water and butanol is 1.7 mJ/m2, making it suitable for characterizing mesopores ranging from 2 to 50 nm in size. However, in the case of MF membranes with pore sizes exceeding 50 nm, typical liquid pairs exhibit insufficient interfacial tensions to generate the wide range of bursting pressures necessary for progressive liquid-liquid displacement within the pores. The surface tensions of gas-liquid systems (17–73 mJ/m2) significantly exceed the typical interfacial tensions of liquid-liquid systems (1–3 mJ/m2). Utilizing an inert gas, such as nitrogen or air, for displacing the liquid within membrane pores can effectively overcome the limitation for LLD method. Over the past few decades, the GLD has become the standard protocol, appearing in various versions of the ASTM standard methodology (ASTM F 3 16-86) and has been utilized to characterize numerous commercial MF membranes (Reichelt, 1991; Zeman, 1996; Jakobs and Koros, 1997). The upcoming sections will first exclusively focus on reviewing the GLD method as the only indirect characterization method, due to its wide acceptance within industry standards. Following this, direct microscopic techniques will be discussed.
3.1 Gas/liquid displacement (GLD) permporometry
GLD method measures the Laplace pressure required to force a wetting liquid out of a capillary and relates this pressure to the pore size corresponding to the largest pore. During a typical measurement, liquid A is allowed to swell the membrane and gas pressure on one side of the membrane is incrementally increased until the first bubble or measurable gas flow on the opposite side is observed. A pressure differential, ∆P=P1-P2, develops at the interface and Young–Laplace equation relates this pressure difference to surface tension of the liquid filling the pores (
Equation 1 is derived from the mechanical force balance at the curved surface, assuming that a) a single hemispherical meniscus exists at the discharge of liquid/gas from the membrane b) the pore shape is circular c) the contact angle corresponds to the static contact angle b) kinetic effects during discharging of liquid from the pores are negligible. However, the validity of these assumptions has been criticized in various studies. For instance, Adamson (1976) explored a more complex scenario involving a non-spherical meniscus. Chatterjee (2008) showed that relying on a single meniscus to estimate the capillary radius from the measured liquid extrusion pressure can result in significant errors, thus, a correction factor is necessary to account for two menisci. GLD is a dynamic process (Blake and Haynes, 1969), and Lavi et al. (2008) demonstrated that neglecting inertia and dynamic contact angle effects could result in significantly inaccurate estimation for the capillary radius. In many real membranes, pores are not always circular and can be better approximated by other geometries. Zeman (1996) demonstrated that kinetic effects are far from negligible and should be taken into account in the analysis of GLD porosimetry data. He rederived the expression for bubble point pressure to take into account kinetic effects as follows:
Equation 2 was initially proposed by Bechhold et al. (1931) and considers the effects of commonly ignored parameters, the membrane thickness (L), presure ramp
Commercial capillary porometers measure gas fluxes through both dry and wet membranes. The software within the porometer estimates various parameters, including mean flow pore pressure and pore diameter, bubble point pressure and bubble point pore diameter, and illustrates integral and differential flow distribution versus pore diameter curves. However, it is unable to provide the PSD of the membrane due to the requirement for reliable mathematical models. The GLD method is an indirect method that relies on combining the raw data with a mathematical model, typically containing adjustable parameters. Due to various pore structures found in MF membranes, ranging from capillary pores with straight-through paths to capillaries of different length, diameter, shape, roughness and regularity, interpreting the data accurately poses significant challenges. If the model lacks sufficient information about the critical characteristics of the pore structure, it may fail to yield meaningful and precise insights into the material’s morphology.
The subsequent section provides a review of the models utilized for determining PSD from GLD porometer data.
3.1.1 Hagen-Poiseuille model
The Hagen-Poiseuille model, shown by Eq. 3, is commonly used to predict flux (J) through porous membranes. The main assumptions utilized in deriving this equation are as follows: 1) All pores are cylindrical and parallel to each other, following a straight path. 2) Fluid is Newtonian and flow is in Laminar regime. 3) There is no slipping at the pore wall, i.e., the fluid velocity at the pore wall is zero.
where ni is the pore-number density of the ith class of pores with diameter di. In the case of non-parallel pores, the equation is modified by multiplying the L with the tortuosity (τ) of the membrane (
Zeman (1996) justified the assumption of laminar flow for modeling flow through MF membrane pores. For a capillary with a diameter of 0.7 µm and a length of 370 μm, he determined the flow velocity to be 0.6 cm/s and the corresponding Reynolds numbers for the flow of isopropanol (η = 2.43 × 10⁻² P) and air (η = 1.8 × 10⁻⁴ P) to be 7 × 10⁻⁴ and 1.4 × 10⁻⁴, respectively. These values are typical for GLD experiments and for MF membranes. For the fastest, dry membrane air flow, the Reynolds number is on the order of 5 × 10⁻², which is still low and flow is Laminar (Zeman, 1996).
3.1.2 Mixed Poisseuille Knudsen flow model
Gas transport through a capillary depends on the ratio of the pore size to the mean free path of the gas used as the displacing fluid in GLD experiments. When the mean free path of the gas molecules is greater than the pore diameter, the Hagen-Poiseuille equation loses its validity. In this scenario, it is not reasonable to assume zero velocity at the capillary wall. The flow under this condition is known as Knudsen flow and is governed by the collisions of the gas molecules with the wall (Mulder, 1996).
According to gas kinetic theory (Shao et al., 2004), the mean free path of a gas,
where p and p0 are gas pressures indicated by gauge and the atmospheric pressure, respectively; k is the Boltzmann constant. The extent of Knudsen diffusion is influenced by the surface tension of the pore-filling liquid. When water (with a surface tension of 72.8 mJ/m2 at 20°C) is employed as the pore-filling liquid and nitrogen as the displacing gas, the contribution of Knudsen diffusion was estimated to be approximately 5%. This percentage rises to about 15% when wetting liquids with a surface tension value of around 18 mJ/m2 are utilized (Shao et al., 2004). The calculations demonstrate that pure Knudsen diffusion alone cannot control gas flow through MF membranes. Instead, both Hagen Poiseille flow and Knudsen diffusion contribute to the gas transport. For this mixed flow regime, a correction term was added to the Hagen Poiseille equation, as utilized in the study of Islam et al. (2020):
where
where
Hernández and his group (Hernández et al., 1996) determined the pore size distribution of track-etched PC MF membranes using a combination of Poiseuille and Knudsen flow, assuming an S value of unity in Eq. 5. To validate the accuracy of the model, they calculated the pure water permeabilities based on the determined PSD as follows:
They found that the PSD determined using the mixed Poiseuille and Knudsen flow accurately predicted permeability values that closely matched the experimental data.
Islam et al. (2020) rearranged Eq. 5 as
and defined gas permeability as
They tested the validity of the mixed Poiseuille and Knudsen flow model by first fitting the gas permeability data for PES, PP, PVDF, and PTFE membranes to the model to adjust the Savg value in Eq. 7. The mixed Poiseuille Knudsen flow model accurately predicted the permeability data of the PTFE membrane, while its predictions deviated from the experimental data for the other three membranes. The deviation was attributed to the assuming a constant average S value. Given the known Savg value and the PSD, flux through dry and wet membranes were predicted using 2 approaches. In the first approach, the viscosity, η, was replaced by air viscosity, ηa, and the corresponding value of KD;g was estimated
3.1.3 Klinkenberg model
Klinkenberg model describes the gas flux through a dry membrane, Jd, with one adjustable parameter, A, and constant viscosity as follows:
The first term in Eq. 8 represents viscous contribution while the second term accounts for the slippage effect. The parameter A is determined by minimizing the difference between experimental and predicted gas permeabilities
3.1.4 Forchmeier model
The Forchheimer model considers local turbulence effects and gas compressibility, with viscosity assumed to be constant. The steady-state gas flux through a dry membrane is described by the following equations:
Like Klinkerberg model, the Forchheimer model also contains one adjustable parameter,
The Forchheimer model provided a better fit of the gas flux data for all three PET membranes compared to the Klinkenberg model (Islam et al., 2017). However, the predicted dry flux curve deviated from the experimental data.
3.1.5 Variable viscosity Poiseuille (VVPM) model
In purely viscous or mixed flow models, fluid is assumed to be Newtonian., i.e., the viscosity is constant. This assumption is valid at low pressures (Bird et al., 2001), however, during transport in confined spaces such as capillaries, the viscosity becomes pressure dependent even if the pressure is low (Creutz, 1974). Islam et al. (2017) proposed following equation for steady dry gas flow with a pressure dependent viscosity.
where ηApp represents the apperant viscosity at the applied pressure. They determined the pressure dependence of viscosity by evaluating the value of KD/ηApp for all the applied pressure during flow through dry membrane. Assuming that apparent viscosity is the same for both the dry and wet flow at any pressure, the gas flux through wet membrane, Jw, is given by the following relation:
The viscous flow modified with variable viscosity accurately predicted the experimental dry and wet flux data of track-etched PET membrane without any deviation (Islam et al., 2017). The VVPM model also accurately reproduced wet and dry fluxes of PES and PP membranes produced by phase inversion technique. However, the estimated porosities exceeded unity (Islam and Ulbricht, 2019). To resolve this issue, the VVPM model was modified by including 2 additional parameters, non-uniformity and tortuosity coefficient into the definition of KD as shown below (Islam and Ulbricht, 2019).
The term
3.2 Microscopic characterization techniques
Microscopy techniques provide direct visual information about membrane morphology, including surface pore shape and size, their distributions, pore density, surface porosity, and cross-sectional structure through image processing of micrographs.
3.2.1 The scanning electron microscopy
The SEM easily scans the membrane surface, enabling imaging of wide areas within a magnification range of up to 100,000. The resolution limit is about 0.1 μm for regular SEM instruments and 2.5 nm for the most advanced high-resolution instruments employing a field-emission gun (field-emission scanning electron microscopy, FESEM). The main limitation of the SEM is the requirement for membranes to be conductive since nonconductive samples cause charge accumulation, leading to scanning faults and image artifacts. To prevent overcharging effect, the membrane should be coated with an ultrathin layer of an electrically conductive material. However, this coating can hide fine sample features when observed at very high magnifications (Zhang et al., 2014). Except the usage of environmental SEM, which allows imaging in wet conditions, the SEM requires dry samples. Both coating and drying of the samples can change the pore size and PSD. Image processing software allows quantification of parameters such as membrane thickness, and selective layer thickness in two dimensions (2D) (Masselin et al., 2001; She et al., 2008). However, 2D imaging cannot quantify blind and closed pores, nor can it determine parameters such as inner specific surface area, 3-D pore size distributions, tortuosity, spatial pore arrangement, and connectivity of pores which can only be accurately assessed using 3D data.
3.2.2 Focused ion beam-scanning electron microscopy (FIB-SEM)
Uchic et al. (2011) highlighted the benefits of automated serial sectioning instruments to obtain 3-D data from SEM images. The first step in the analysis is to perform sectioning by a variety and/or combination of methods, such as cutting, grinding, polishing, laser ablation, and ion sputtering. In the second step, microstructural data from each section is collected and finally in the last step, computer software programs are used to reconstruct a 3-D data from the image analysis. Up to now, only two studies have utilized this technique for characterizing MF membranes. The primary challenge in the FIB-SEM method is the presence of the shine-through artifact in 3D reconstructions. To evaluate the impact of this artifact, Roberge et al. (2022) conducted the analysis using both an empty membrane and an embedded membrane, the latter prepared by filling the empty pores of the membrane with a resin. 3D data for the PES membrane with an average nominal pore diameter of 0.1 µm (Koch membrane systems, United States) were generated by first obtaining 8 large volumes and then extracting three smaller volumes of identical sizes, referred to as triplicates, from each volume, focusing on areas near the surface. Pore sizes, volume porosity, pore tortuosity and connectivity of the membrane as a function of depth were determined by analyzing triplicates. Each triplicate was subdivided into smaller volume layers, with their top and bottom surfaces parallel to the membrane surface. Each layer had a thickness of 300 nm chosen to be at least three times larger than the nominal pore size provided by the manufacturer (100 nm). The layers overlapped with the next by 50%, ensuring full coverage of the entire membrane structure and the measurements spaced apart by 150 nm. Finally, the mean pore diameter, tortuosity and connectivity of the pores were determined from automatic pore segmentation. The mean pore sizes and porosities for the embedded PES membrane (dp = 105 ± 20 nm and
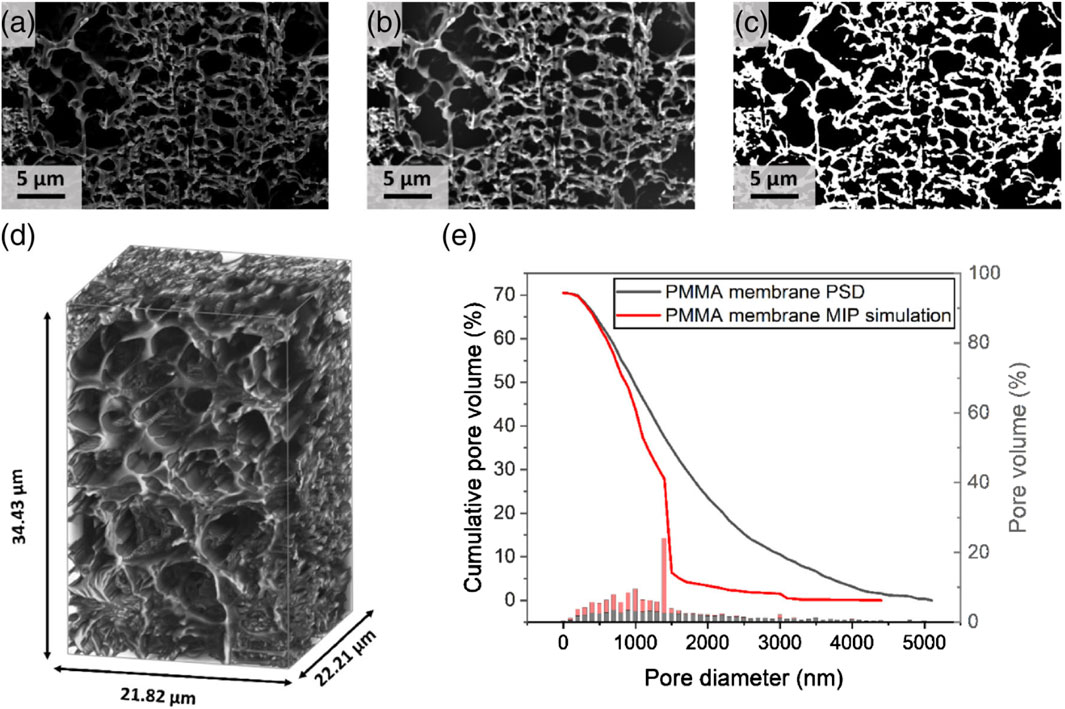
Figure 7. Image processing applied to image stack after FIB milling and SEM recording. (A) Initial SEM image of PMMA membrane. (B) FFT bandpass-filtered image. (C) Binarised image (D) 3D volume representation of a bandpass FFT-filtered sample. (E) Continuous pore size distribution and MIP simulation on the image. Copyright (2024) The Authors. Used with permission from Prochukhan et al. (2024).
3.2.3 Transmission electron microscopy (TEM)
Transmission electron microscopy scans the surface in 2D with a resolution higher than SEM. However, the sample thickness cannot exceed 100 nm, thus, before the analysis, membrane should be embedded in a crosslinked resin to prepare thin cross sections (Sai et al., 2013). The choice of embedding medium is critical as it should have no influence on the membrane structure. Transmission electron microscopy tomography can provide 3D images, but the procedure is tedious and time-consuming (She et al., 2010). Moreover, it is not necessary since the resolution of the FIB-SEM method is sufficient for 3D imaging of MF membranes.
3.2.4 Atomic force microscopy (AFM)
Scanning probe techniques, such as atomic force microscopy (AFM), enable the examination of sample topology and surface porosity (Bowen et al., 1996; Hilal and Johnson, 2010; Kochkodan et al., 2014). One of the key advantages of AFM is its ability to operate without the need for vacuum conditions or sample coating. Additionally, measurements can be conducted in both air and liquid environments. By scanning the surface of a porous polymer membrane, the dimensions of individual pores can be measured, enabling the calculation of the mean pore size (Bessieres et al., 1996). If a sufficient number of pores are present, the pore size distribution can also be determined (Bowen et al., 1996). Otherwise, the method can yield erroneous results. Another limitation of AFM for the physical characterization of MF membranes is its inability to access underlying layers of the sample.
3.2.5 Confocal laser scanning microscopy (CLSM)
Confocal laser scanning microscopy (CLSM), frequently utilized in biological sciences, has also been used for membrane characterization (Charcosset and Bernengo, 2000a; 2000b; Charcosset et al., 2000; 2002; Marroquin et al., 2011). Images are obtained through optical sectioning from the bulk of the sample. Thus, compared to SEM and TEM which require mechanical sectioning, CLSM is a less invasive technique and provides reliable information about the internal morphology without introducing artifacts from sample sectioning. 3-D imaging requires staining the membrane with a dye, however, sample preparation is still simpler than SEM and TEM since staining is done only once for each membrane. The technical limitation of the CLSM is its resolution. In optimal conditions, CSLM can resolve features as small as 180 nm in the focal plane (x, y), and approximately 500–800 nm along the optic axis (z) (Hell, 2003). However, this resolution is enough for characterizing surface porosity of MF membranes. Green et al. (2006) used CLSM and 3D image reconstruction to visualize the connectivity of pores resulting from the bi-axial stretching of CaCO3/polyolefin composite membranes and investigated the effect of low and overstretching on the structural features.
3.2.6 Tomographic X-ray imaging
Tomographic X-ray imaging is viewed as a promising microscopic characterization technique, offering insights in 2D/3D or 4D, on membranes, membrane modules, and membrane processes on a scale ranging from micro-to nanometers (Remigy et al., 2007; Schöpping et al., 2024). In tomographic imaging, the membrane sample is rotated over 180 or 360◦, with respect to the X-ray beam propagation direction. Then, a 3D volume of the sample is reconstructed from the projection images (Figure 8).
Figure 8. Schematic of X-ray computed tomography imaging process (A) and triple phase segmentation (B). Reprinted with permission from Johnson et al. (2021). Copyright The Authors.
The technique is non-invasive and non-destructive and gives a chance to image 3D internal structure of porous membranes in high resolution to evaluate important geometrical features such as porosity, tortuosity and pore size without need for physical sectioning. A major challenge in utilizing tomographic methods is the availability of X-ray sources for conducting tomographic experiments, whether in a laboratory setting or at a synchrotron light source. Additionally, after conducting the experiment, the projection images must undergo post-processing and reconstruction. Subsequently, the reconstructed tomographic slices of the sample require processing, analysis, quantification, and visualization. A recent review discusses opportunities, challenges, and limitations of tomographic X-ray imaging techniques for membrane characterization (Schöpping et al., 2024). A summary of literature findings regarding the characterization of MF membranes using microscopic techniques is provided in Table 4.
Table 4. Polymeric MF membranes characterized using microscopic methods.
4 Fouling characterization techniques
In early studies, membrane fouling was monitored through following permeate flux, feed channel pressure drop, and hydraulic resistance during filtration (Velasco et al., 2003; Buetehorn et al., 2010; Wu et al., 2019; Hube et al., 2021). However, these approaches cannot provide insights into the structural and mechanical properties of fouling layer and how these properties impact operational performance.
4.1 Scanning electron microscopy
Over the years, numerous ex-situ and in-situ invasive and non-invasive techniques have been developed for characterizing fouling in MF membranes. The SEM has been utilized for visualizing fouling and the technique can help determining fouling mechanism through measurements of porosity, thickness and pore size before and after filtration. The primary limitations of the technique include extensive sample preparation, which may risk damaging the foulant layer, and the small imaged area, which cannot offer an accurate representation of the fouling scenario.
4.2 Atomic force microscopy (AFM)
AFM can be operated noninvasively with the noncontact mode, its limited image size, similar to SEM imaging, restricts the amount of information that can be obtained from this technique. The roughness measurement for the clean and fouled membrane gives a quantitative measure of degree of fouling (Hilal et al., 2009). In addition, the pore size, surface porosity, and PSD of both clean and fouled membranes can be determined from a 3D map of the surface topography (Woo et al., 2017). A recent review discussed the in situ measurement capability of AFM for membrane fouling (Wei et al., 2024). Evapoporometry (EP) was used as another ex-situ technique to determine extent of fouling by characterizing the PSD of fouled membranes (Han et al., 2020).
4.3 The streaming potential
The streaming potential is a simple yet powerful method for in-situ monitoring of deposition on the membrane surface (He et al., 2017; Nakamura et al., 2012a; 2012b; Le Bolay and Ricard, 1995; Jia et al., 2015). Fouling alters the streaming potential of the membrane, enabling sensitive monitoring of membrane fouling. However, for the technique to effectively characterize fouling, there must be a substantial difference between the charges of the foulants and the membrane. Nakamura et al. (2012a) found that the change in the responses of zeta potential of membrane during filtration can indicate the location of pressure drop and differentiate between the cake filtration and the pore blocking filtration. Jia et al. (2015) monitored flux and zeta potential of the PVDF hollow fiber membrane during yeast filtration. They observed a rapid decline in zeta potential during the pore blocking process, followed by a gradual and linear decrease during cake formation. Conversely, it remained relatively stable during cake compression.
4.4 Electrical impedance spectroscopy (EIS)
Electrical impedance spectroscopy (EIS) is another noninvasive and in-situ technique used for monitoring fouling in MF membranes. The main disadvantage of the technique is the requirement to bond a metal film onto the membrane surface, which may alter the membrane structure. In addition, the method is limited to monitoring fouling at early stage (Jørgensen et al., 2023). Bannwarth et al. (2016) recorded electrical impedance during filtration of silica particles through flat sheet and hollow fiber polypropylene MF membranes. They determined the filter cake height and filter cake porosity by combining the measured impedance data with an equivalent circuit model.
4.5 The ultrasonic time domain reflectometry (UTDR)
The ultrasonic time domain reflectometry (UTDR) technique has also been utilized as an in-situ, non-invasive and real-time technique to observe fouling in/on MF membranes (Li et al., 2002; Li and Sanderson, 2002; Sikder et al., 2006; Silalahi et al., 2009; Xu et al., 2009; Kujundzic et al., 2010; Li et al., 2012; Lin et al., 2013; Li et al., 2014a; Li et al., 2014b; Jørgensen et al., 2016). The UTDR technique offers a unique advantage as one of the few feasible techniques for optimizing commercial-scale membrane modules and processes to mitigate membrane fouling. Furthermore, unlike optical techniques, it is capable of being used with opaque mediums (Rudolph et al., 2019). However, if the density of the fouling layer is comparable to or lower than that of the membrane, separating the fouling layer from the membrane becomes challenging. Morever, the propagation of acoustic waves in multilayer membrane structures should be understood to enhance the accuracy and utility of the complex ultrasonic spectra. Li et al. (2002) demonstrated the capability of the UTDR technique in distinguishing individual modes of fouling layer growth on nylon MF membranes. Silalahi et al. (2009) reported that it is possible to distinguish fouling due to cake layer formation, adsorption and compaction using the UTDR technique. Xu et al. (2009) transformed ultrasonic spectra into two dimensional (2D) color contour diagrams to obtain fouling layer thickness and amount of oil deposited at three different parts of the PES hollow fiber MF membrane.
4.6 The direct observation (DO) technique
The direct observation (DO) technique is another noninvasive method used for in-situ observation of foulant deposition under a microscope. To successfully apply this method, the membrane or feed solution should be sufficiently clear (Chen V. et al., 2004). The DO techniques are straightforward, affordable, and readily available for monitoring membrane fouling. However, they suffer from low resolution and therefore cannot detect small-sized foulants. Foulant deposition on the membrane surface can be detected by positioning the observation window on the permeate side of the membrane module, given that there is significant contrast between the deposition and the membrane. However, fluorescent labeling can enhance this contrast. With the use of DOTM, only the initial stages of deposition can be observed since the view becomes obstructed when a monolayer of particles on the membrane surface is formed (Ngene et al., 2010). The DO method can facilitate estimating cake height and investigating the effects of hydraulic conditions (Ye et al., 2011) chemical environment (Xu et al., 2015), particle surface charge (Lorenzen et al., 2016), and membrane structures (Çulfaz et al., 2011) on foulant layer growth, structure, and compression/relaxation.
4.7 Optical coherence tomography (OCT)
In recent years, optical coherence tomography (OCT) has received significant attention as an in-situ nondestructive technique for monitoring fouling (Hube et al., 2021; Lay et al., 2022). The technique has the capability to generate 2D and 3D scans rapidly, enabling observation of fouling on the milimeter scale without the need for staining. The OCT technique was initially used for in-situ monitoring of biofilm formation in a capillary cell (Haisch and Niessner, 2007; Derlon et al., 2012). Biofouling represents a significant form of fouling, particularly widespread on microfiltration (MF) membranes, especially within membrane bioreactors (MBRs). The process of biofilm formation begins with the accumulation of individual cells, which then aggregate to form initial cell clusters. These microscopic clusters further coalesce to form mesoscopic structures, ultimately leading to the development of macroscopic biofilm structures. Figure 9 illustrates various scales of biofilm formation along with corresponding techniques utilized for analyzing biofilm structure. Morgenroth and Milferstedt (2009) emphasized the significance of mesoscale structural properties in capturing ecological mechanisms within biofilm formation. In this regard, compared to CLSM, OCT offers greater advantages in understanding the structure-function relationship, as it provides detailed visualization of the mesoscale. OCT has been applied to characterize fouling of different commercial MF membranes (Hube et al., 2021; Lay et al., 2022). Trinh et al. (2018) developed an algorithm to use OCT for in-situ monitoring of internal fouling by oil emulsions non-invasively during the filtration process. Han et al. (2020) applied the OCT to compare the internal fouling behavior of 3 MF membranes, PVDF, PTFE and mixed cellulose ester (MCE) membranes, with the same average pore sizes. Although they were able to monitor internal fouling in real-time, the quantitative determination of fouling extent for the 3 membranes was not possible due to differences in membrane material and the complex boundaries between the liquid-foulant and membrane. Ranieri et al. (2024) monitored in-situ biofilm formation during 20 days of seawater filtration through PVDF MF membrane. They quantified the biofilm’s amount and evaluated its impact on hydraulic resistance using OCT scans. In the second phase of the treatment, filtration was stopped for 6 h to facilitate the back transport of foulants from the membrane surface, allowing biofilm relaxation. Additionally, in the absence of permeation, shear stress was applied through air scouring for 15 min to enhance biofilm removal. 2D OCT scans were obtained before and after relaxation and air scouring to determine changes in biofilm thickness and the extent of relaxation necessary for cleaning. Zhang et al. (2024) collected OCT scans at 5-s intervals to characterize fouling layer growth on the PVDF MF membrane. They determined the fouling layer thickness and estimated foulant adsorption and desorption by comparing digitalized cake layers sampled by OCT at two consecutive times. Lay et al. (2022) used OCT to investigate the effect of foulant shape on the fouling characteristics of PC membranes. Han et al. (2018) employed 3D OCT image analysis to investigate the impact of the surface charge of monodisperse latex particles on cake formation. They determined the fractions of fouled voxels for each layer and topology of the fouling layer by analyzing the number of adjacent fouled layers. A recent review presents a detailed discussion on the application of OCT for noninvasive monitoring of fouling in membrane processes (Huisman et al., 2024).
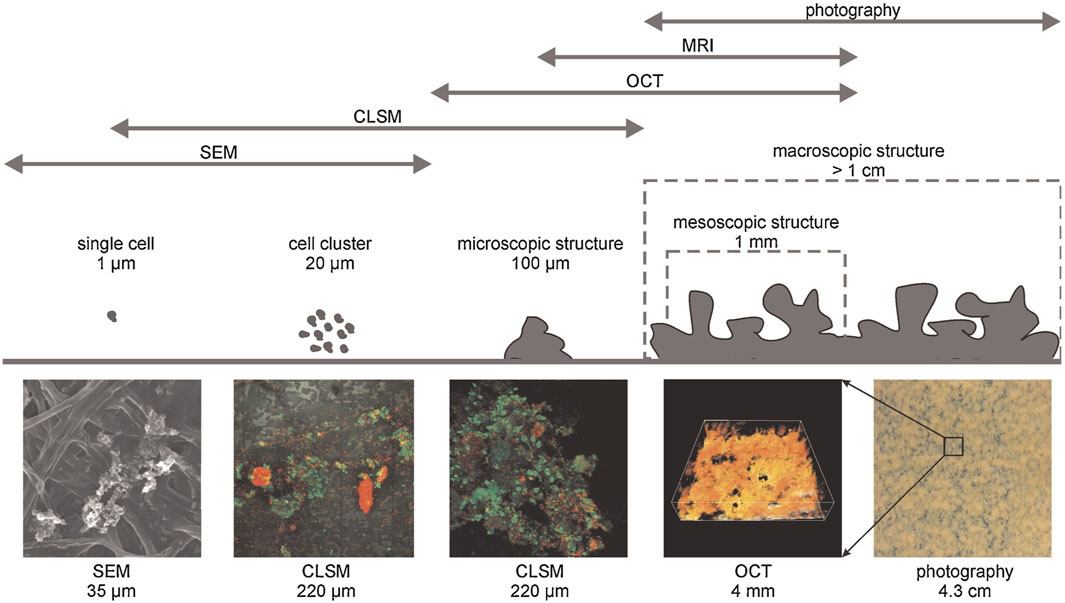
Figure 9. Techniques used to investigate biofouling at different scales. Copyright (2010) Wiley. Used with permission from Wagner et al. (2010), Investigation of the Mesoscale Structure and Volumetric Features of Biofilms Using Optical Coherence Tomography, Biotechnology and Bioengineering.
4.8 Confocal scanning laser microscopy
Confocal scanning laser microscopy has primarily been utilized for characterizing biofouling of MF membranes (Wu et al., 2019). The main advantage of this technique is its ability to distinguish between different species and visualize, in real-time, the adsorption-desorption processes occurring at various depths within the membrane (Ferrando et al., 2005). The technique can also enable the visualization of cake formation on the membrane’s surface and/or pore constriction resulting from the deposition or adsorption of foulant agents. Tow et al. (2022) illustrated the in-situ formation of biofilm within large pores beneath the membrane surface, a finding supported by ex situ SEM images. They observed distinct biofilm conformations through in situ and ex situ CLSM analysis, underscoring the significance of the analytical approach. Despite the capability of the CLSM for wet state imaging and locating and identifying the foulants within the sample, its primary limitation is the short penetration depth (Rudolph et al., 2019). Marroquin et al. (2014) addressed this limitation by developing a cross-sectional CLSM imaging protocol capable of generating defect-free images across the entire thickness of membranes. Using this approach, they were able to determine the individual foulant deposition throughout the cross section. CLSM was utilized under both in situ and ex situ conditions. Ferrando et al. (2005) obtained 20 images via optical sectioning of the PC MF membrane after filtration of BSA and ovalbumin mixture. Through this process, they determined protein penetration of up to 25% of the total thickness and locations of adsorbed proteins. Additionally, they provided quantitative data on the pore surfaces where proteins were detected along with the thickness of cake layer (3 µm) deposited on the identified surface porosity.
4.9 Phase-contrast X-ray imaging (XMI)
Phase-contrast X-ray imaging (XMI) with synchrotron radiation is another powerful in-situ technique for characterizing membrane morphology. Park et al. (2020) utilized this technique to analyze the adsorption of water droplets in oil-water emulsions on hydrophilic membranes and the oil film between oil and water phases based on visualized data. Yeo et al. (2005) observed the deposition of ferric hydroxide particles as a cake inside the lumen of the membrane and also deposition and fouling within the membrane structure. Although, the XMI is a powerful method for characterizing membrane morphology, the equipment required is expensive and evaluating the thickness of the cake presents a challenge. Table 5 lists the studies that utilized in-situ techniques for fouling characterization.
Table 5. Methods utilized for characterizing fouling of polymeric MF membranes.
5 Future directions and conlcusion
MF membranes are utilized in a wide range of applications that demand tunable morphological characteristics such as pore sizes, pore shapes, pore orientations, pore connectivity and surface-to-volume ratios. These structural features are determined by the manufacturing process and significantly influence the membrane’s performance and susceptibility to fouling (Figure 10). Therefore, a thorough characterization of morphology and fouling layer is crucial to guide manufacturing processes and enhance performance for the desired separation. This review focuses on manufacturing techniques, physical and fouling characterization methods for MF membranes.
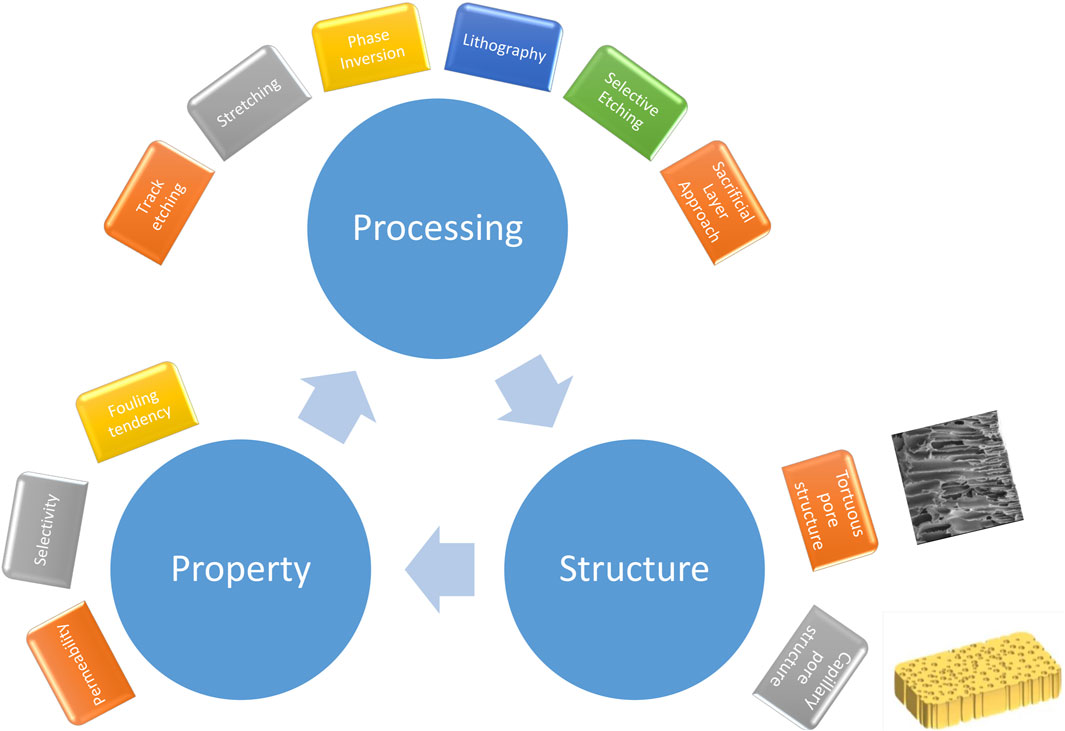
Figure 10. The processing, structure, property relationship for MF membranes.
Many MF applications such as sterilization and clarification, particle removal, cell harvesting require an isoporous structure. This structure is less prone to fouling by particulate plugging and provides enhanced flux through uniformly distributed pores. While the track etching method can produce isoporous membranes, it is expensive, limited to a few polymers with high thermal stability and typically results in low membrane porosity. Phase inversion is a commonly used technique for industrial production, allowing for the processing of various commercially available, affordable polymers. Future research efforts should focus on the combining different phase inversion techniques to produce isoporous membranes with high pore density.
Regarding physical morphology characterization of membranes, GLD method is the most commonly used one for MF membranes. A comprehensive characterization requires combining GLD data with liquid flux data to determine the PSD. The key issue for an accurate PSD estimation is to employ mathematical models that consider the structural features of the membrane, rather than solely relying on classical expressions valid for cylindirical, isolated, parallel pores.
While the ASTM standard outlines the protocol for determining the maximum pore size, there is a need for standardized protocols for PSD calculation to ensure comparability of characterization results across different research groups. In the future, researchers should utilize the benefits offered by machine learning approach for quantitative analysis of porous structures. Real 3D images of MF membranes obtained by direct methods such as high resolution X-ray computer tomography (XCT) can be used in visualizing structural features such as aniostropy, tortuosity, pore shape and pore connectivity. By utilizing experimental data as input, machine learning algorithms can rapidly generate structural models and predict key features. This approach not only accelerates analysis but also facilitates a deeper understanding of membrane morphology. A further step in future efforts for the physical characterization of MF membranes should involve the development of nondestructive methods applicable to large-sized membrane modules.
Various in-situ and ex-situ methods have been developed for characterizing fouling of MF membranes. With the integration of multiple techniques, the characterization of each foulant not only on the surface but also through the cross section of the MF membrane should be done to understand the fouling mechanism in detail. The main challenge in fouling characterization is to switch from research equipment to more robust field use. Therefore, techniques suitable for in-situ fouling observation in commercial modules over the long term, coupled with advanced signal processing algorithms, are necessary. Quick and facile evaluation of large datasets is crucial for long-term online monitoring. In this regard, utilizing deep-learned neural networks to process images allows going beyond traditional image processing for significantly improved results.
Author contributions
SA: Writing–review and editing, Writing–original draft, Visualization, Validation, Supervision, Software, Resources, Project administration, Methodology, Investigation, Funding acquisition, Formal Analysis, Data curation, Conceptualization.
Funding
The author(s) declare that no financial support was received for the research, authorship, and/or publication of this article.
Conflict of interest
The author declares that the research was conducted in the absence of any commercial or financial relationships that could be construed as a potential conflict of interest.
The author(s) declared that they were an editorial board member of Frontiers, at the time of submission. This had no impact on the peer review process and the final decision.
Publisher’s note
All claims expressed in this article are solely those of the authors and do not necessarily represent those of their affiliated organizations, or those of the publisher, the editors and the reviewers. Any product that may be evaluated in this article, or claim that may be made by its manufacturer, is not guaranteed or endorsed by the publisher.
References
Alexowsky, C., Bojarska, M., and Ulbricht, M. (2019). Porous poly (vinylidene fluoride) membranes with tailored properties by fast and scalable non-solvent vapor induced phase separation. J. Membr. Sci. 577, 69–78. doi:10.1016/j.memsci.2019.01.033
AlMarzooqi, F. A., Bilad, M. R., Mansoor, B., and Arafat, H. A. (2016). A comparative study of image analysis and porometry techniques for characterization of porous membranes. J. Mater. Sci. 51, 2017–2032. doi:10.1007/s10853-015-9512-0
Anis, S. F., Hashaikeh, R., and Hilal, N. (2019). Microfiltration membrane processes: a review of research trends over the past decade. J. Water Process Eng. 32, 100941. doi:10.1016/j.jwpe.2019.100941
Apel, P. (2001). Tracketching technique in membrane technology. Radiat. Meas. 34, 559–566. doi:10.1016/s1350-4487(01)00228-1
Apel, P. Y., Blonskaya, I. V., Didyk, A. Y., Dmitriev, S. N., Orelovitch, O. L., Root, D., et al. (2001). Surfactant-enhanced control of track-etch pore morphology. Nucl. Instrum. Methods Phys. Res. B 179, 55–62. doi:10.1016/s0168-583x(00)00691-1
Apel, P. Y., Blonskaya, I. V., Dmitriev, S. N., Mamonova, T. I., Orelovitch, O. L., Sartowska, B., et al. (2008). Surfactant-controlled etching of ion track nanopores and its practical applications in membrane technology. Radiat. Meas. 43, S552–S559. doi:10.1016/j.radmeas.2008.04.057
ASTM F 316-86 (1990). Standard test method for pore size characterization of membrane filters by bubble point and mean flow pore test. Annu. Book ASTM Stand. 10 (05). (Originally published as F 316-70, last previous edition F 316-80.
Bannwarth, S., Trieu, T., Oberschelp, C., and Wessling, M. (2016). On-line monitoring of cake layer structure during fouling on porous membranes by in situ electrical impedance analysis. J. Membr. Sci. 503, 188–198. doi:10.1016/j.memsci.2016.01.009
Bechhold, H., Schlesinger, M., and Silbereisen, K. (1931). Pore size of ultrafilters. Kolloid-Zeitschrift 55, 172–198. (in German). doi:10.1007/bf01428072
Bessieres, A., Meireles, M., Coratger, R., Beauvillain, J., and Sanchez, V. (1996). Investigations of surface properties of polymeric membranes by near field microscopy. J. Membr. Sci. 109, 271–284. doi:10.1016/0376-7388(95)00209-x
Bird, R. B., Stewart, W. E., and Lightfoot, E. N. (2001). Transport phenomena. 2nd ed. John Wiley & Sons, Inc.
Blake, T., and Haynes, J. (1969). Kinetics of displacement. J. Colloid Interface Sci. 30, 421–423. doi:10.1016/0021-9797(69)90411-1
Bottino, A., Capannelli, G., Petit-Bon, P., Cao, N., Pegoraro, M., and Zoia, G. (1991). Pore size and pore-size distribution in microfiltration membranes. Sep. Sci. Technol. 26 (10 & 11), 1315–1327. doi:10.1080/01496399108050534
Bowen, W. R., Hilal, N., Lovitt, R., and Williams, P. (1996). Atomic force microscope studies of membranes: surface pore structures of Cyclopore and Anopore membranes. J. Membr. Sci. 110, 233–238. doi:10.1016/0376-7388(95)00263-4
Buetehorn, S., Carstensen, F., Wintgens, T., Melin, T., Volmering, D., and Vossenkaul, K. (2010). Permeate flux decline in cross-flow microfiltration at constant pressure. Desalination 250, 985–990. doi:10.1016/j.desal.2009.09.087
Buonomenna, M. G., Figoli, A., Jansen, J. C., and Drioli, E. (2004). Preparation of asymmetric PEEKWC flat membranes with different microstructures by wet phase inversion. J. Appl. Polym. Sci. 92, 576–591. doi:10.1002/app.20042
Calvo, J., Hernández, A., Prádanos, P., Martinez, L., and Bowen, W. (1995). Pore size distributions in microporous membranes II. Bulk characterization of track-etched filters by air porometry and mercury porosimetry. J. Colloid Interface Sci. 176, 467–478. doi:10.1006/jcis.1995.9944
Carretero, P., Molina, S., Lozano, A., de Abajo, J., Calvo, J. I., Prádanos, P., et al. (2013). Liquid–liquid displacement porosimetry applied to several MF and UF membranes. Desalination 327, 14–23. doi:10.1016/j.desal.2013.08.001
Chamani, H., Rabbani, A., Russell, K. P., Zydney, A. L., Gomez, E. D., Hattrick-Simpers, J., et al. (2023). Data-science-based reconstruction of 3-D membrane pore structure using a single 2-D micrograph. J. Membr. Sci. 678, 121673. doi:10.1016/j.memsci.2023.121673
Charcosset, C., and Bernengo, J.-C. (2000a). Characterization of microporous membranes using confocal scanning laser microscopy in fluorescence mode. Eur. Phys. J. Appl. Phys. 12, 195–199. doi:10.1051/epjap:2000188
Charcosset, C., and Bernengo, J.-C. (2000b). Comparison of microporous membrane morphologies using confocal scanning laser microscopy. J. Membr. Sci. 168, 53–62. doi:10.1016/s0376-7388(99)00299-9
Charcosset, C., Cher, A., and Bernengo, J.-C. (2000). Characterization of microporous membrane morphology using confocal scanning laser microscopy. Chem. Eng. Sci. 55, 5351–5358. doi:10.1016/s0009-2509(00)00151-2
Charcosset, C., Yousefian, F., Thovert, J.-F., and Adler, P. M. (2002). Calculation of flow and solute deposition through three-dimensional reconstructed model of microporous membranes. Desalination 145, 133–138. doi:10.1016/s0011-9164(02)00398-3
Chatterjee, J. (2008). Estimation of size from capillary pressure—a correction factor for a two menisci capillary. Colloids Surfaces A Physicochem. Eng. Aspects 317, 421–430. doi:10.1016/j.colsurfa.2007.11.015
Chen, V., Li, H., and Fane, A. G. (2004a). Non-invasive observation of synthetic membrane processes - a review of methods. J. Membr. Sci. 241, 23–44. doi:10.1016/j.memsci.2004.04.029
Chen, W., Long, N., Xiao, T., and Yang, X. (2020). Tuning the pore structure of poly(vinylidene fluoride) membrane for efficient oil/water separation: a novel vapor-induced phase separation method based on a lower critical solution temperature system. Ind. Eng. Chem. Res. 59, 14947–14959. doi:10.1021/acs.iecr.0c02462
Chen, Y. W., Chen, L., Nie, H. R., Kang, E. T., and Vora, R. H. (2005). Fluorinated polyimides grafted with poly(ethylene glycol) side chains by the RAFT-mediated process and their membranes. Mater. Chem. Phys. 94, 195–201. doi:10.1016/j.matchemphys.2005.04.017
Chen, Y. W., Ying, L., Yu, W. H., Kang, E. T., and Neoh, K. G. (2003). Poly(vinylidene fluoride) with grafted poly(ethylene glycol) side chains via the RAFT-mediated process and pore size control of the copolymer membranes. Macromolecules 36, 9451–9457. doi:10.1021/ma035194s
Chen, Z., Deng, M., Chen, Y., He, G., Wu, M., and Wang, J. (2004b). Preparation and performance of cellulose acetate/polyethyleneimine blend microfiltration membranes and their applications. J. Membr. Sci. 235, 73–86. doi:10.1016/j.memsci.2004.01.024
Creutz, E. (1974). The permeability minimum and the viscosity of gases at low pressure. Nucl. Sci. Eng. 53, 107–109. doi:10.13182/nse74-a23333
Çulfaz, P. Z., Haddad, M., Wessling, M., and Lammertink, R. G. H. (2011). Fouling behavior of microstructured hollow fibers in cross-flow filtrations: critical flux determination and direct visual observation of particle deposition. J. Membr. Sci. 372, 210–218. doi:10.1016/j.memsci.2011.02.002
de Lara, R., and Benavente, J. (2009). Use of hydrodynamic and electrical measurements to determine protein fouling mechanisms for microfiltration membranes with different structures and materials. Sep. Purif. Technol. 66, 517–524. doi:10.1016/j.seppur.2009.02.003
Deng, B., Yang, X., Xie, L., Li, J., Hou, Z., Yao, S., et al. (2009). Microfiltration membranes with pH-dependent property prepared from poly(methacrylic acid) grafted polyethersulfone powder. J. Membr. Sci. 330, 363–368. doi:10.1016/j.memsci.2009.01.010
Deng, B., Yu, M., Yang, X., Zhang, B., Li, L., Xie, L., et al. (2010). Antifouling microfiltration membranes prepared from acrylic acid or methacrylic acid grafted poly(vinylidene fluoride) powder synthesized via pre-irradiation induced graft polymerization. J. Membr. Sci. 350, 252–258. doi:10.1016/j.memsci.2009.12.035
Derlon, N., Peter-Varbanets, M., Scheidegger, A., Pronk, W., and Morgenroth, E. (2012). Predation influences the structure of biofilm developed on ultrafiltration membranes. Water Res. 46 (10), 3323–3333. doi:10.1016/j.watres.2012.03.031
Ding, Y. F., Maruf, S., Aghajani, M., and Greenberg, A. R. (2017). Surface patterning of polymeric membranes and its effect on antifouling characteristics. Sep. Sci. Technol. 52, 240–257. doi:10.1080/01496395.2016.1201115
Doi, Y., Kaneko, S., Hanamura, T., Fujii, O., Yoshitake, K., Hirata, T., et al. (1975). Microporous film, particularly battery separator, and method of making. US4335193.
Dollimore, D., and Heal, G. R. (1964). An improved method for the calculation of pore size distribution from adsorption data. J. Appl. Chem. 14, 109–114. doi:10.1002/jctb.5010140302
Elyashevich, G. K., Olifirenko, A. S., and Pimenov, A. (2005). Micro- and nanofiltration membranes on the base of porous polyethylene films. Desalination 184, 273–279. doi:10.1016/j.desal.2005.03.055
Fan, H., Xiao, K., Mu, S., Zhou, Y., Ma, J., Wang, X., et al. (2018). Impact of membrane pore morphology on multi-cycle fouling and cleaning of hydrophobic and hydrophilic membranes during MBR operation. J. Membr. Sci. 556, 312–320. doi:10.1016/j.memsci.2018.04.014
Ferrando, M., Różek, A., Zator, M., López, F., and Güell, C. (2005). An approach to membrane fouling characterization by confocal scanning laser microscopy. J. Membr. Sci. 250, 283–293. doi:10.1016/j.memsci.2004.10.043
Froehlich, K., Scheuerlein, M. C., Ali, M., Nasir, S., and Ensinger, W. (2022). Enhancement of heavy ion track-etching in polyimide membranes with organic solvents. Nanotechnology 33, 045301. doi:10.1088/1361-6528/ac2f5a
Gao, L., Tang, B., and Wu, P. (2009). An experimental investigation of evaporation time and the relative humidity on a novel positively charged ultrafiltration membrane via dry-wet phase inversion. J. Membr. Sci. 326, 168–177. doi:10.1016/j.memsci.2008.09.048
Gençal, Y., Durmaz, E. N., and Çulfaz-Emecen, P. Z. (2015). Preparation of patterned microfiltration membranes and their performance in crossflow yeast filtration. J. Membr. Sci. 476, 224–233. doi:10.1016/j.memsci.2014.11.041
Gopalani, D., Kumar, S., and Gopal, R. (2000). A novel method for production of polyester films-based nuclear track microfilters. J. Membr. Sci. 178, 93–98. doi:10.1016/s0376-7388(00)00482-8
Green, D. L., McAmish, L., and McCormick, A. V. (2006). Three-dimensional pore connectivity in bi-axially stretched microporous composite membranes. J. Membr. Sci. 279, 100–110. doi:10.1016/j.memsci.2005.11.051
Gribble, C. M., Matthews, G. P., Laudone, G. M., Turner, A., Ridgway, C. J., Schoelkopf, J., et al. (2011). Porometry, porosimetry, image analysis and void network modelling in the study of the pore-level properties of filters. Chem. Eng. Sci. 66, 3701–3709. doi:10.1016/j.ces.2011.05.013
Guillen, G. R., Pan, Y., Li, M., and Hoek, E. M. V. (2011). Preparation and characterization of membranes formed by nonsolvent induced phase separation: a review. Ind. Eng. Chem. Res. 50, 3798–3817. doi:10.1021/ie101928r
Haisch, C., and Niessner, R. (2007). Visualisation of transient processes in biofilms by optical coherence tomography. Water Res. 41 (11), 2467–2472. doi:10.1016/j.watres.2007.03.017
Han, K., Xu, W., Ruiz, A., Ruchhoeft, P., and Chellam, S. (2005). Fabrication and characterization of polymeric microfiltration membranes using aperture array lithography. J. Membr. Sci. 249, 193–206. doi:10.1016/j.memsci.2004.09.044
Han, Q., Huang, T. L., Li, W., and Chew, J. W. (2021). Effect of initial particle deposition rate on cake formation during dead-end microfiltration. J. Membr. Sci. 618, 118672. doi:10.1016/j.memsci.2020.118672
Han, Q., Li, W., Trinh, T. A., Fane, A. G., and Chew, J. W. (2018). Effect of the surface charge of monodisperse particulate foulants on cake formation. J. Membr. Sci. 548, 108–116. doi:10.1016/j.memsci.2017.11.017
Han, Q., Trinh, T. A., and Chew, J. W. (2019). Cake formation of bidisperse suspensions in dead-end microfiltration. J. Membr. Sci. 577, 31–40. doi:10.1016/j.memsci.2019.01.048
Han, Q., Trinh, T. A., Tanis-Kanbur, M. B., Li, W., and Chew, J. W. (2020). Assessing internal fouling during microfiltration using optical coherence tomography and evapoporometry. J. Membr. Sci. 595, 117588. doi:10.1016/j.memsci.2019.117588
Hanks, P. L., Forschner, C. A., and Lloyd, D. R. (2008). Sieve mechanism estimations for microfiltration membranes with elliptical pores. J. Membr. Sci. 322, 91–97. doi:10.1016/j.memsci.2008.05.031
Hanks, P. L., Kaczorowski, K. J., Becker, E. B., and Lloyd, D. R. (2007). Modeling of uni-axial stretching of track-etch membranes. J. Membr. Sci. 305, 196–202. doi:10.1016/j.memsci.2007.08.003
He, Z., Kasemset, S., Kirschner, A. Y., Cheng, Y.-H., Paul, D. R., and Freeman, B. D. (2017). The effects of salt concentration and foulant surface charge on hydrocarbon fouling of a poly(vinylidene fluoride) microfiltration membrane. Water Res. 117, 230–241. doi:10.1016/j.watres.2017.03.051
Hell, S. W. (2003). Toward fluorescence nanoscopy. Nat. Biotechnol. 21, 1347–1355. doi:10.1038/nbt895
Hernández, A., Calvo, J., Prádanos, P., and Tejerina, F. (1996). Pore size distributions in microporous membranes: a critical analysis of the bubble point extended method. J. Membr. Sci. 112, 1–12. doi:10.1016/0376-7388(95)00025-9
Hilal, N., Bowen, W. R., Johnson, D., and Yin, H. (2009). Atomic force microscopy in process engineering. Butterworth Heinemann Publications: Elsevier, 139.
Hilal, N., and Johnson, D. J. (2010). “The use of atomic force microscopy in membrane characterisation,” in Comprehensive membrane science and engineering. Editors E. Drioli, and L. Giorno, 521–538.
Hilal, N., Kochkodan, V., Al-Khatib, L., and Busca, G. (2002). Characterization of molecularly imprinted composite membranes using an atomic force microscope. Surf. Interface Analysis 33, 672–675. doi:10.1002/sia.1434
Ho, C.-C., and Zydney, A. L. (1999a). Effect of membrane morphology on the initial rate of protein fouling during microfiltration. J. Membr. Sci. 155, 261–275. doi:10.1016/s0376-7388(98)00324-x
Ho, C.-C., and Zydney, A. L. (1999b). Theoretical analysis of the effect of membrane morphology on fouling during microfiltration. Sep. Sci. Technol. 34 (13), 2461–2483. doi:10.1081/ss-100100785
Honold, E., and Skau, E. L. (1954). Application of mercury-intrusion method for determination of pore-size distribution to membrane filters. Science 120, 805–806. doi:10.1126/science.120.3124.805
Huang, Q. L., Xiao, C. F., Hu, X. Y., and An, S. L. (2011). Fabrication and properties of poly(tetrafluoroethylene-co-hexafluoropropylene) hollow fiber membranes. J. Mater. Chem. 21 (42), 16510–16516. doi:10.1039/c1jm12618k
Huang, T. L., Wang, R., and Chew, J. W. (2021b). Membrane fouling by mixtures of oppositely charged particles. J. Membr. Sci. 625, 119093. doi:10.1016/j.memsci.2021.119093
Huang, T. L., Wang, R., and Chew, J. W. (2022). Influence of foulant particle shape on membrane fouling in dead-end microfiltration. J. Membr. Sci. 647, 120265. doi:10.1016/j.memsci.2022.120265
Huang, T. L., Yeow, R. J. E., Ma, Y., Zydney, A. L., Wang, R., and Chew, J. W. (2021a). Internal membrane fouling by proteins during microfiltration. J. Membr. Sci. 637, 119589. doi:10.1016/j.memsci.2021.119589
Hube, S., Wang, J., Sim, L. N., Ólafsdóttir, D., Chong, T. H., and Wu, B. (2021). Fouling and mitigation mechanisms during direct microfiltration and ultrafiltration of primary wastewater. J. Water Process Eng. 44, 102331. doi:10.1016/j.jwpe.2021.102331
Huisman, K. T., Blankert, B., Horn, H., Wagner, M., Vrouwenvelder, J. S., Bucs, S., et al. (2024). Noninvasive monitoring of fouling in membrane processes by optical coherence tomography: a review. J. Membr. Sci. 692, 122291. doi:10.1016/j.memsci.2023.122291
Hwang, K.-J., and Liao, C.-Y. (2012). Effects of membrane morphology and operating conditions on microfiltration particle fouling. J. Taiwan Inst. Chem. Eng. 43 (1), 46–52. doi:10.1016/j.jtice.2011.07.001
Ilyin, S., Ignatenko, V., Anokhina, T., Bakhtin, D., Kostyuk, A., Dmitrieva, E., et al. (2020). Formation of microfiltration membranes from PMP/PIB blends: effect of PIB molecular weight on membrane properties. Membranes 10 (1), 9. doi:10.3390/membranes10010009
Islam, M. A., Hossain, M. S., Garcia-Payo, C., Khayet, M., and Ulbricht, M. (2020). Mixed Poiseuille-Knudsen flow model for Gas Liquid Displacement porometry data treatment. J. Membr. Sci. 612, 118422. doi:10.1016/j.memsci.2020.118422
Islam, M. A., Hossain, M. S., and Ulbricht, M. (2017). Model-dependent analysis of gas flow/pore dewetting data for microfiltration membranes. J. Membr. Sci. 533, 351–363. doi:10.1016/j.memsci.2017.03.012
Islam, M. A., and Ulbricht, M. (2019). Microfiltration membrane characterization by gas-liquid displacement porometry: matching experimental pore number distribution with liquid permeability and bulk porosity. J. Membr. Sci. 569, 104–116. doi:10.1016/j.memsci.2018.09.030
Jakobs, E., and Koros, W. J. (1997). Ceramic membrane characterization via the bubble point technique. J. Membr. Sci. 124, 149–159. doi:10.1016/s0376-7388(96)00203-7
Jena, A., and Gupta, K. (2010). Advances in pore structure evaluation by porometry. Chem. Eng. Technol. 33, 1241–1250. doi:10.1002/ceat.201000119
Ji, D. W., Xiao, C. F., Chen, K. K., Zhou, F., Gao, Y. F., Zhang, T., et al. (2021). Solvent-free green fabrication of PVDF hollow fiber MF membranes with controlled pore structure via melt-spinning and stretching. J. Membr. Sci. 621, 118953. doi:10.1016/j.memsci.2020.118953
Ji, Y., Li, X. M., Yin, Y., Zhang, Y. Y., Wang, Z. W., and He, T. (2010). Morphological control and cross-flow filtration of microfiltration membranes prepared via a sacrificial-layer approach. J. Membr. Sci. 353, 159–168. doi:10.1016/j.memsci.2010.02.041
Jia, H., Zhang, H., Wang, J., Zhang, H., and Zhang, X. (2015). Response of zeta potential to different types of local membrane fouling in dead-end membrane filtration with yeast suspension. RSC Adv. 5, 78738–78744. doi:10.1039/c5ra12668a
Johnson, D. J., Oatley-Radcliffe, D. L., and Hilal, N. (2018). State of the art review on membrane surface characterisation: visualisation, verification and quantification of membrane properties. Desalination 434, 12–36. doi:10.1016/j.desal.2017.03.023
Johnson, T. F., Iacoviello, F., Welsh, J. H., Shearing, P. R., and Bracewell, D. G. (2021). High-resolution imaging of depth filter structures using X-ray computed tomography. J. Mater Sci. 56, 15313–15326. doi:10.1007/s10853-021-06238-w
Jonggeon, J. (2012). Preparation and characterization of chemically stable PVDF-HFP asymmetric microfiltration (MF) membranes. Membr. J. 22, 104–112.
Jørgensen, M. K., Kujundzic, E., and Greenberg, A. R. (2016). Effect of pressure on fouling of microfiltration membranes by activated sludge. Desalination Water Treat. 57, 6159–6171. doi:10.1080/19443994.2015.1005695
Jørgensen, M. K., Paulsen, F. K., Bentien, A., Kjul, A. R., Poulsen, M., Mikkelsen, L. M., et al. (2023). Membrane fouling monitoring by 3ω sensing. Sci. Rep. 13, 15237. doi:10.1038/s41598-023-42337-1
Kamide, K., and Manabe, S. (1980). “Characterization technique of straight-through porous membranes,” in Ultrafiltration membranes and applications. Editor A. R. Cooper (New York: Plenum).
Kang, S.-T., Subramani, A., Hoek, E. M. V., Deshusses, M. A., and Matsumoto, M. R. (2004). Direct observation of biofouling in cross-flow microfiltration: mechanisms of deposition and release. J. Membr. Sci. 244, 151–165. doi:10.1016/j.memsci.2004.07.011
Kawashima, K., Shirzadi, M., Fukasawa, T., Fukui, K., Tsuru, T., and Ishigami, T. (2022). Numerical modeling for particulate flow through realistic microporous structure of microfiltration membrane: direct numerical simulation coordinated with focused ion beam scanning electron microscopy. Powder Technol. 410, 117872. doi:10.1016/j.powtec.2022.117872
Kesting, R. E. (1985). “Synthetic polymeric membranes,” in A structural perspective. 2nd ed. (New York: Wiley).
Khulbe, K. C., and Matsuura, T. (2000a). Characterization of synthetic membranes by Raman spectroscopy, electron spin resonance, and atomic force microscopy: a review. Polymer 41, 1917–1935. doi:10.1016/s0032-3861(99)00359-6
Khulbe, K. C., Matsuura, T., and Feng, C. (2017b). Synthetic membrane characterisation – a review: part II. Membr. Technol. 7, 7–12. doi:10.1016/s0958-2118(17)30171-4
Khulbe, K. C., Matsuura, T., and Feng, C. Y. (2017b). Synthetic membrane characterization – a review: part II. Membr. Technol. 8, 7–12.
Kim, J. F., Kim, J. H., and Drioli, E. (2016). Thermally induced phase separation and electrospinning methods for emerging membrane applications: a review. AIChE J. 62, 461–490. doi:10.1002/aic.15076
Kim, N., and Jung, B. (2017). Preparation of polysulfone microfiltration membranes by a sulfonated polyethersulfone additive. Membr. J. 27, 273–283. doi:10.14579/membrane_journal.2017.27.3.273
Kim, N., Kim, C. S., and Lee, Y. T. (2008). Preparation and characterization of polyethersulfone membranes with p-toluenesulfonic acid and polyvinylpyrrolidone additives. Desalination 233, 218–226. doi:10.1016/j.desal.2007.09.046
Kiy, A., Notthoff, C., Dutt, S., Grigg, M., Hadley, A., Mota-Santiago, P., et al. (2021). Ion track etching of polycarbonate membranes monitored by in situ small angle X-ray scattering. Phys. Chem. Chem. Phys. 23, 14231–14241. doi:10.1039/d1cp02063c
Kochkodan, V., Johnson, D. J., and Hilal, N. (2014). Polymeric membranes: surface modification for minimizing (bio)colloidal fouling. Adv. Colloid Interface Sci. 206, 116–140. doi:10.1016/j.cis.2013.05.005
Kücük, S., Hejase, C. A., Kolesnyk, I. S., Chew, J. W., and Tarabara, V. V. (2021). Microfiltration of saline crude oil emulsions: effects of dispersant and salinity. J. Hazard. Mater. 412, 124747. doi:10.1016/j.jhazmat.2020.124747
Kujundzic, E., Greenberg, A. R., Fong, R., Moore, B., Kujundzic, D., and Hernandez, M. (2010). Biofouling potential of industrial fermentation broth components during microfiltration. J. Membr. Sci. 349, 44–55. doi:10.1016/j.memsci.2009.11.054
Lalia, B. S., Kochkodan, V., Hashaikeh, R., and Hilal, N. (2013). A review on membrane fabrication: structure, properties and performance relationship. Desalination 326, 77–95. doi:10.1016/j.desal.2013.06.016
Lavi, B., Marmur, A., and Bachmann, J. (2008). Porous media characterization by the two-liquid method: effect of dynamic contact angle and inertia. Langmuir 24, 1918–1923. doi:10.1021/la702090x
Lay, H. T., Wang, R., and Chew, J. W. (2022). Influence of foulant particle shape on membrane fouling in dead-end microfiltration. J. Membr. Sci. 647, 120265. doi:10.1016/j.memsci.2022.120265
Le Bolay, N., and Ricard, A. (1995). Streaming potential in membrane processes: microfiltration of egg proteins. J. Colloid Interface Sci. 170, 154–160. doi:10.1006/jcis.1995.1083
Lee, Y., Jeong, J., Youn, I. J., and Lee, W. H. (1997). Modified liquid displacement method for determination of pore size distribution in porous membranes. J. Membr. Sci. 130, 149–156. doi:10.1016/s0376-7388(97)00017-3
Li, D., Frey, M. W., and Joo, Y. L. (2006). Characterization of nanofibrous membranes with capillary flow porometry. J. Membr. Sci. 286, 104–114. doi:10.1016/j.memsci.2006.09.020
Li, J., and Sanderson, R. D. (2002). In situ measurement of particle deposition and its removal in microfiltration by ultrasonic time-domain reflectometry. Desalination 146, 169–175. doi:10.1016/s0011-9164(02)00521-0
Li, J., Sanderson, R. D., and Jacobs, E. P. (2002). Non-invasive visualization of the fouling of microfiltration membranes by ultrasonic time-domain reflectometry. J. Membr. Sci. 201, 17–29. doi:10.1016/s0376-7388(01)00664-0
Li, X., Li, J., Wang, J., Wang, H., Cui, C., He, B., et al. (2014b). Direct monitoring of sub-critical flux fouling in a horizontal double-end submerged hollow fiber membrane module using ultrasonic time domain reflectometry. J. Membr. Sci. 451, 226–233. doi:10.1016/j.memsci.2013.09.060
Li, X., Li, J., Wang, J., Wang, H., He, B., Zhang, H., et al. (2014a). Experimental investigation of local flux distribution and fouling behavior in double-end and dead-end submerged hollow fiber membrane modules. J. Membr. Sci. 453, 18–26. doi:10.1016/j.memsci.2013.10.052
Li, X., Li, J., Wang, J., Zhang, H., and Pan, Y. (2012). In situ investigation of fouling behavior in submerged hollow fiber membrane module under sub-critical flux operation via ultrasonic time domain reflectometry. J. Membr. Sci. 411–412, 137–145. doi:10.1016/j.memsci.2012.04.024
Li, X.-M., Jia, Y., He, T., and Wessling, M. (2008). A sacrificial-layer approach to prepare microfiltration membranes. J. Membr. Sci. 320, 1–7. doi:10.1016/j.memsci.2008.03.059
Lin, Y.-H., Tung, K.-L., Wang, S.-H., Zhou, Q., and Shung, K. K. (2013). Distribution and deposition of organic fouling on the microfiltration membrane evaluated by high-frequency ultrasound. J. Membr. Sci. 433, 100–111. doi:10.1016/j.memsci.2013.01.020
Liu, F., Li, B., Sun, D., Li, F., and Pei, X. (2022). The effect of chitosan (CS) coagulation bath on structure and performance of polylactic acid (PLA) microfiltration membrane. Korean J. Chem. Eng. 39 (4), 1307–1315. doi:10.1007/s11814-021-0992-0
Liu, H. L., Xiao, C. F., Hu, X. Y., and Liu, M. T. (2013). Post-treatment effect on morphology and performance of polyurethane-based hollow fiber membranes through melt-spinning method. J. Membr. Sci. 427, 326–335. doi:10.1016/j.memsci.2012.10.002
Lorenzen, S., Ye, Y., Chen, V., and Christensen, M. L. (2016). Direct observation of fouling phenomena during cross-flow filtration: influence of particle surface charge. J. Membr. Sci. 510, 546–558. doi:10.1016/j.memsci.2016.01.046
Lowell, S., and Shields, J. E. (1987). “Powder surface area and porosity,” in Powder Technology series. Editor B. Scarlett (New York: Wiley).
Madaeni, S. S., and Taheri, A. H. (2011). Effect of casting solution on morphology and performance of PVDF microfiltration membranes. Chem. Eng. Technol. 34 (8), 1328–1334. doi:10.1002/ceat.201000177
Mansouri, J., Yapit, E., and Chen, V. (2013). Polysulfone filtration membranes with isoporous structures prepared by a combination of dip-coating and breath figure approach. J. Membr. Sci. 444, 237–251. doi:10.1016/j.memsci.2013.05.022
Marroquin, M., Bruce, T., Pellegrino, J., Wickramasingh, S. R., and Husson, S. M. (2011). Characterization of asymmetry in microporous membranes by cross-sectional confocal laser scanning microscopy. J. Membr. Sci. 379, 504–515. doi:10.1016/j.memsci.2011.06.024
Marroquin, M., Vu, A., Bruce, T., Wickramasinghe, S. R., Zhao, L., and Husson, S. M. (2014). Evaluation of fouling mechanisms in asymmetric microfiltration membranes using advanced imaging. J. Membr. Sci. 465, 1–13. doi:10.1016/j.memsci.2014.03.077
Masselin, I., Durand-Bourlier, L., Laine, J., Sizaret, P., Chasseray, X., and Lemordant, D. (2001). Membrane characterization using microscopic image analysis. J. Membr. Sci. 186, 85–96. doi:10.1016/s0376-7388(00)00657-8
Medeiros, K. M. de, Araújo, E. M., Lira, H. de L., Lima, D. de F., and Lima, C. A. P. de. (2017). Hybrid membranes of Polyamide applied in treatment of waste water. Mater. Res. 20 (2), 308–316. doi:10.1590/1980-5373-mr-2016-0242
Miller, B., and Tyomkin, I. (1994). Liquid porosimetry: new methodology and applications. J. Colloid Interface Sci. 162, 163–170. doi:10.1006/jcis.1994.1021
Mo, D., Liu, J. D., Duan, J. L., Yao, H. J., Latif, H., Cao, D. L., et al. (2014). Fabrication of different pore shapes by multi-step etching technique in ion-irradiated PET membranes. Nucl. Instrum. Methods Phys. Res. B 333, 58–63. doi:10.1016/j.nimb.2014.04.011
Moon, E. J., Kim, J. W., and Kim, C. K. (2006). Fabrication of membranes for liquid separation Part 2: microfiltration membranes prepared from immiscible blends containing polysulfone and poly(1-vinylpyrrolidone-co-acrylonitrile) copolymers. J. Membr. Sci. 274, 244–251. doi:10.1016/j.memsci.2005.08.017
Morehouse, J. A., Taylor, D. L., Lloyd, D. R., Lawler, D. F., Freeman, B. D., and Worrel, L. S. (2006). The effect of uni-axial stretching on the roughness of microfiltration membranes. J. Membr. Sci. 280, 712–719. doi:10.1016/j.memsci.2006.02.027
Mores, W. D., and Davis, R. H. (2001). Direct visual observation of yeast deposition and removal during microfiltration. J. Membr. Sci. 189, 217–230. doi:10.1016/s0376-7388(01)00409-4
Mores, W. D., and Davis, R. H. (2003). Yeast-fouling effects in cross-flow microfiltration with periodic reverse filtration. Industrial Eng. Chem. Res. 42 (1), 130–139. doi:10.1021/ie020421k
Morgenroth, E., and Milferstedt, K. (2009). Biofilm engineering: linking biofilm development at different length and time scales. Rev. Environ. Sci. Biotechnol. 8 (3), 203–208. doi:10.1007/s11157-009-9163-1
Morison, K. R. (2008). A comparison of liquid-liquid porosimetry equations for evaluation of pore size distribution. J. Membr. Sci. 325, 301–310. doi:10.1016/j.memsci.2008.07.042
Mu, C., Su, Y., Sun, M., Chen, W., and Jiang, Z. (2010). Remarkable improvement of the performance of poly(vinylidene fluoride) microfiltration membranes by the additive of cellulose acetate. J. Membr. Sci. 350, 293–300. doi:10.1016/j.memsci.2010.01.004
Mulder, M. (1996). Basic principles of membrane Technology. 2nd Edition. Springer: Kluwer Academic Publisher.
Nakamura, K., Orime, T., and Matsumoto, K. (2012a). Response of zeta potential to cake formation and pore blocking during the microfiltration of latex particles. J. Membr. Sci. 401–402, 274–281. doi:10.1016/j.memsci.2012.02.013
Nakamura, K., Orime, T., and Matsumoto, K. (2012b). Zeta potential monitoring during microfiltration of humic acid. J. Chem. Eng. Jpn. 45 (8), 583–589. doi:10.1252/jcej.12we109
Nakao, S. (1994). Determination of pore size and pore size distribution: 3. Filtration membranes. J. Membr. Sci. 96, 131–165. doi:10.1016/0376-7388(94)00128-6
Ngene, I. S., Lammertink, R. G. H., Wessling, M., and van der Meer, W. (2010). A microfluidic membrane chip for in situ fouling characterization. J. Membr. Sci. 346, 202–207. doi:10.1016/j.memsci.2009.09.035
Nur-E-Alam, M., Deowan, S. A., Hossain, E., Hossain, K. S., Miah, M. Y., and Nurnabi, M. (2024). Fabrication of polysulfone-based microfiltration membranes and their performance analysis. Water, Air, Soil Pollut. 235 (2), 75. doi:10.1007/s11270-023-06872-x
Park, K., Kim, J. H., Kim, B. J., Cho, S. J., Hong, J., and Lim, G. (2020). Direct visualization of microscale dynamics of water droplets on under-oil-hydrophilic membranes by using synchrotron white-beam X-ray microimaging techniques. Langmuir 36, 10548–10554. doi:10.1021/acs.langmuir.0c01867
Park, P.-K., Lee, C.-H., and Lee, S. (2007). Determination of cake porosity using image analysis in a coagulation–microfiltration system. J. Membr. Sci. 293, 66–72. doi:10.1016/j.memsci.2007.01.035
Peinador, R. I., Calvo, J. I., and Roger Ben Aim, R. B. (2020). Comparison of capillary flow porometry (CFP) and liquid extrusion porometry (LEP) techniques for the characterization of porous and face mask membranes. Appl. Sci. 10, 5703. doi:10.3390/app10165703
Persson, K. M., Capannelli, G., Bottino, A., and Trägårdh, G. (1993). Porosity and protein adsorption of four polymeric microfiltration membranes. J. Membr. Sci. 76, 61–71. doi:10.1016/0376-7388(93)87005-v
Piałtkiewicz, W., Rosiński, S., Lewińska, D., Bukowski, J., and Judycki, W. (1999). Determination of pore size distribution in hollow fibre membranes. J. Membr. Sci. 153, 91–102. doi:10.1016/s0376-7388(98)00243-9
Podgolin, S. K., Petukhov, D. I., Loimer, T., and Eliseev, A. A. (2021). Mass flow and momentum flux in nanoporous membranes in the transitional flow region. Phys. Chem. Chem. Phys. 23, 17134–17141. doi:10.1039/d1cp02797b
Pongpairoj, P., Field, R., Cui, Z., Wicaksana, F., and Fane, A. G. (2011). Transmission of and fouling by long chain molecules during crossflow microfiltration of algal suspensions: influence of shear. Desalination Water Treat. 35, 138–149. doi:10.5004/dwt.2011.3138
Prochukhan, N., Rafferty, A., Canavan, M., Daly, D., Selkirk, A., Rameshkumar, S., et al. (2024). Development and application of a 3D image analysis strategy for focused ion beam – scanning electron microscopy tomography of porous soft materials. Microsc. Res. Tech. 87, 1335–1347. doi:10.1002/jemt.24514
Qin, Q., Hou, Z., Lu, X., Bian, X., Chen, L., Shen, L., et al. (2013). Microfiltration membranes prepared from poly(N-vinyl-2-pyrrolidone) grafted poly(vinylidene fluoride) synthesized by simultaneous irradiation. J. Membr. Sci. 427, 303–310. doi:10.1016/j.memsci.2012.09.059
Ranieri, L., Esposito, R., Nunes, S. P., Vrouwenvelder, J. S., and Fortunato, L. (2024). Biofilm rigidity, mechanics and composition in seawater desalination pretreatment employing ultrafiltration and microfiltration membranes. Water Res. 253, 121282. doi:10.1016/j.watres.2024.121282
Rebenfeld, L., and Miller, B. (1995). Using liquid flow to quantify the pore structure of fibrous materials. J. Text. Inst. 86, 241–251. doi:10.1080/00405009508631330
Reichelt, G. (1991). Bubble point measurements on large areas of microporous membranes. J. Membr. Sci. 60, 253–259. doi:10.1016/s0376-7388(00)81538-0
Reingruber, H., Zankel, A., Mayrhofer, C., and Poelt, P. (2011). Quantitative characterization of microfiltration membranes by 3D reconstruction. J. Membr. Sci. 372, 66–74. doi:10.1016/j.memsci.2011.01.037
Reingruber, H., Zankel, A., Mayrhofer, C., and Poelt, P. (2012). A new in situ method for the characterization of membranes in a wet state in the environmental scanning electron microscope. J. Membr. Sci. 399–400, 86–94. doi:10.1016/j.memsci.2012.01.031
Remanan, S., Samantaray, P. K., Bose, S., and Das, N. C. (2021). Phase transited lysozyme particles and MoS2 nanosheets modified elastomer-like antibacterial and antifouling microfiltration membrane derived from poly(ethylene-co-methyl acrylate)/poly(vinylidene fluoride) (EMA/PVDF) blend for water purification application. Microporous Mesoporous Mater. 316, 110945. doi:10.1016/j.micromeso.2021.110945
Remigy, J. C., Meireles, M., and Thibault, X. (2007). Morphological characterization of a polymeric microfiltration membrane by synchrotron radiation computed microtomography. J. Membr. Sci. 305, 27–35. doi:10.1016/j.memsci.2007.06.059
Roberge, H., Moreau, P., Couallier, E., and Abellan, P. (2022). Determination of the key structural factors affecting permeability and selectivity of PAN and PES polymeric filtration membranes using 3D FIB/SEM. J. Membr. Sci. 653, 120530. doi:10.1016/j.memsci.2022.120530
Rudolph, G., Virtanen, T., Ferrando, M., Güell, C., Lipnizki, F., and Kallioinen, M. (2019). A review of in situ real-time monitoring techniques for membrane fouling in the biotechnology, biorefinery and food sectors. J. Membr. Sci. 588, 117221. doi:10.1016/j.memsci.2019.117221
Rudolph-Schöpping, G., Larsson, E., Pingel, T. N., Guizar-Sicairos, M., Villanueva-Perez, P., Hall, S., et al. (2024). Towards multiscale X-ray tomographic imaging in membrane science — a perspective. J. Membr. Sci. 690, 122245. doi:10.1016/j.memsci.2023.122245
Russo, F., Marino, T., Galiano, F., Gzara, L., Gordano, A., Organji, H., et al. (2021). Tamisolve® NxG as an alternative non-toxic solvent for the preparation of porous poly (vinylidene fluoride) membranes. Polymers 13 (15), 2579. doi:10.3390/polym13152579
Sai, H., Tan, K. W., Hur, K., Asenath-Smith, E., Hovden, R., Jiang, Y., et al. (2013). Hierarchical porous polymer scaffolds from block copolymers. Science 341, 530–534. doi:10.1126/science.1238159
Sakai, K. (1994). Determination of pore size and pore size distribution: 2. Dialysis membranes. J. Membr. Sci. 96, 91–130. doi:10.1016/0376-7388(94)00127-8
Sanz, J. M., Jardines, D., Bottino, A., Capannelli, G., Hernández, A., and Calvo, J. I. (2006). Liquid–liquid porometry for an accurate membrane characterization. Desalination 200, 195–197. doi:10.1016/j.desal.2006.03.293
Shao, P., Huang, R. Y. M., Feng, X., and Anderson, W. (2004). Gas-liquid displacement method for estimating membrane pore-size distributions. AIChE J. 50 (3), 557–565. doi:10.1002/aic.10050
She, F. H., Nihara, K., Gao, W. M., Hodgson, P. D., Jinnai, H., and Kong, L. X. (2010). 3-Dimensional characterization of membrane with nanoporous structure using TEM tomography and image analysis. Desalination 250, 757–761. doi:10.1016/j.desal.2008.11.036
She, F. H., Tung, K. L., and Kong, L. X. (2008). Calculation of effective pore diameters in porous filtration membranes with image analysis. Robotics Computer-Integrated Manuf. 24, 427–434. doi:10.1016/j.rcim.2007.02.023
Shimizu, H., Kawakami, H., and Nagaoka, S. (2002). Membrane formation mechanism and permeation properties of a novel porous polyimide membrane. Polym. Adv. Technol. 13, 370–380. doi:10.1002/pat.201
Shin, S.-J., Kim, J.-P., Kim, H.-J., Jeon, J.-H., and Min, B.-R. (2005). Preparation and characterization of polyethersulfone microfiltration membranes by a 2-methoxyethanol additive. Desalination 186, 1–10. doi:10.1016/j.desal.2005.03.092
Shrestha, A., Pellegrino, J., Husson, S. M., and Wickramasinghe, S. R. (2012). A modified porometry approach towards characterization of MF membranes. J. Membr. Sci. 421-422, 145–153. doi:10.1016/j.memsci.2012.07.005
Sikder, J., Pereira, C., Palchoudhury, S., Vohra, K., Basumatary, D., and Pal, P. (2009). Synthesis and characterization of cellulose acetate-polysulfone blend microfiltration membrane for separation of microbial cells from lactic acid fermentation broth. Desalination 249, 802–808. doi:10.1016/j.desal.2008.11.024
Sikder, S. K., Mbanjwa, M. B., Keuler, D. A., McLachlan, D. S., Reineke, F. J., and Sanderson, R. D. (2006). Visualisation of fouling during microfiltration of natural brown water by using wavelets of ultrasonic spectra. J. Membr. Sci. 271, 125–139. doi:10.1016/j.memsci.2005.07.018
Silalahi, S. H. D., Leiknes, T. O., Ali, J., and Sanderson, R. (2009). Ultrasonic time domain reflectometry for investigation of particle size effect in oil emulsion separation with crossflow microfiltration. Desalination 236, 143–151. doi:10.1016/j.desal.2007.10.061
Sossna, M., Hollas, M., Schaper, J., and Scheper, T. (2007). Structural development of asymmetric cellulose acetate microfiltration membranes prepared by a single-layer dry-casting method. J. Membr. Sci. 289, 7–14. doi:10.1016/j.memsci.2006.11.024
Sousa, R. E., Nunes-Pereira, J., Ferreira, J. C. C., Costa, C. M., Machado, A. V., Silva, M. M., et al. (2014). Microstructural variations of poly(vinylidene fluoride co-hexafluoropropylene) and their influence on the thermal, dielectric and piezoelectric properties. Polym. Test. 40, 245–255. doi:10.1016/j.polymertesting.2014.09.012
Su, J. F., Beltsios, K. G., Li, P. H., and Cheng, L. P. (2022). Facile formation of symmetric microporous PVDF membranes via vapor-induced phase separation of metastable dopes. Colloids Surfaces A Physicochem. Eng. Aspects 634, 128012. doi:10.1016/j.colsurfa.2021.128012
Susanto, H., Stahra, N., and Ulbricht, M. (2009). High-performance polyethersulfone microfiltration membranes having high flux and stable hydrophilic property. J. Membr. Sci. 342, 153–164. doi:10.1016/j.memsci.2009.06.035
Tanaka, T., and Lloyd, D. R. (2004). Formation of poly(l-lactic acid) microfiltration membranes via thermally induced phase separation. J. Membr. Sci. 238, 65–73. doi:10.1016/j.memsci.2004.03.020
Tanis-Kanbur, M. B., Peinador, R. I., Calvo, J. I., Hernández, A., and Chew, J. W. (2021). Porosimetric membrane characterization techniques: a review. J. Membr. Sci. 619, 118750. doi:10.1016/j.memsci.2020.118750
Tanudjaja, H. J., Anantharaman, A., Ng, A. Q. Q., Ma, Y. Q., Tanis-Kanbur, M. B., Zydney, A. L., et al. (2022). A review of membrane fouling by proteins in ultrafiltration and microfiltration. J. Water Process Eng. 50, 103294. doi:10.1016/j.jwpe.2022.103294
Tanudjaja, H. J., and Chew, J. W. (2019). In-situ characterization of cake layer fouling during crossflow microfiltration of oil-in-water emulsion. Sep. Purif. Technol. 218, 51–58. doi:10.1016/j.seppur.2019.02.044
Taylor, N., Ma, W. J., Kristopeit, A., Wang, S. C., and Zydney, A. L. (2021). Retention characteristics of sterile filters – effect of pore size and structure. J. Membr. Sci. 635, 119436. doi:10.1016/j.memsci.2021.119436
Tow, E. W., Rad, B., and Kostecki, R. (2022). Biofouling of filtration membranes in wastewater reuse: in situ visualization with confocal laser scanning microscopy. J. Membr. Sci. 644, 120019. doi:10.1016/j.memsci.2021.120019
Trinh, T. A., Han, Q., Ma, Y., and Chew, J. W. (2019). Microfiltration of oil emulsions stabilized by different surfactants. J. Membr. Sci. 579, 199–209. doi:10.1016/j.memsci.2019.02.068
Trinh, T. A., Li, W., and Chew, J. W. (2020). Internal fouling during microfiltration with foulants of different surface charges. J. Membr. Sci. 602, 117983. doi:10.1016/j.memsci.2020.117983
Trinh, T. A., Li, W., Han, Q., Liu, X., Fane, A. G., and Chew, J. W. (2018). Analyzing external and internal membrane fouling by oil emulsions via 3D optical coherence tomography. J. Membr. Sci. 548, 632–640. doi:10.1016/j.memsci.2017.10.043
Tummons, E., Han, Q., Tanudjaja, H. J., Hejase, C. A., Chew, J. W., and Tarabara, V. V. (2020). Membrane fouling by emulsified oil: a review. Sep. Purif. Technol. 248, 116919. doi:10.1016/j.seppur.2020.116919
Tummons, E. N., Tarabara, V. V., Chew, J. W., and Fane, A. G. (2016). Behavior of oil droplets at the membrane surface during crossflow microfiltration of oil–water emulsions. J. Membr. Sci. 500, 211–224. doi:10.1016/j.memsci.2015.11.005
Tung, K. L., Chang, K. S., Wu, T. T., Lin, N. J., Lee, K. R., and Lai, J. Y. (2014). Recent advances in the characterization of membrane morphology. Curr. Opin. Chem. Eng. 4, 121–127. doi:10.1016/j.coche.2014.03.002
Uchic, M. D., Groeber, M. A., and Rollett, A. D. (2011). Automated serial sectioning methods for rapid collection of 3-D microstructure data. JOM 63, 25–29. doi:10.1007/s11837-011-0041-2
Valencia, A., Le Men, C., Ellero, C., Lafforgue-Baldas, C., Schmitz, P., and Morris, J. F. (2020). Direct observation at the microscale of particle deposition during the first stage of the microfiltration process. J. Membr. Sci. 599, 117823. doi:10.1016/j.memsci.2020.117823
Velasco, C., Ouammou, M., Calvo, J. I., and Hernández, A. (2003). Protein fouling in microfiltration: deposition mechanism as a function of pressure for different pH. J. Colloid Interface Sci. 266, 148–152. doi:10.1016/s0021-9797(03)00613-1
Vigo, F., and Castellano, M. (2001). Poly(ether ether ketone) solutions suitable for microfiltration membrane preparation. J. Appl. Polym. Sci. 81, 2550–2555. doi:10.1002/app.1696
Viguie, J., Savart, T., Duru, P., Rouch, J.-C., and Remigy, J.-C. (2013). Characterisation of 3D porous macrostructure of hollow fibre membranes using X-ray tomography—effects of some spinning process conditions. J. Membr. Sci. 435, 11–20. doi:10.1016/j.memsci.2013.01.062
Vilenskii, A. I., Markov, N. G., Oleinikov, V. A., Kuptsova, I. V., Kushin, V. V., Zagorskii, D., et al. (1994). High-energy ion tracks in polyimide. 2. Track etching - preparation of polyimide track membranes. High. Energy Chem. 28, 59–362.
Wagner, M., Taherzadeh, D., Haisch, C., and Horn, H. (2010). Investigation of the mesoscale structure and volumetric features of biofilms using optical coherence tomography. Biotechnol. Bioeng. 107, 844–853. doi:10.1002/bit.22864
Wang, F., Li, J. M., Zhu, H. L., Zhang, H. P., Tang, H. Y., Chen, J. Y., et al. (2015). Effect of the highly asymmetric structure on the membrane characteristics and microfiltration performance of PTFE wrapped hollow fiber membrane. J. Water Process Eng. 7, 36–45. doi:10.1016/j.jwpe.2015.04.013
Wang, S., Ajji, A., Guo, S. Y., and Xiong, C. X. (2017). Preparation of microporous polypropylene/titanium dioxide composite membranes with enhanced electrolyte uptake capability via melt extruding and stretching. Polymers 9 (3), 110. doi:10.3390/polym9030110
Wang, W. C., Ong, G. T., Lim, S. L., Vora, R. H., Kang, E. T., and Neoh, K. G. (2003a). Synthesis and characterization of fluorinated polyimide with grafted poly(N-isopropylacrylamide) side chains and the temperature-sensitive microfiltration membranes. Industrial Eng. Chem. Res. 42, 3740–3749. doi:10.1021/ie0302342
Wang, W. C., Vora, R. H., Kang, E. T., Neoh, K. G., and Liaw, D. J. (2003b). pH-sensitive fluorinated polyimides with grafted acid and base side chains. Industrial Eng. Chem. Res. 42, 784–794. doi:10.1021/ie020830g
Wei, M., Zhang, Y., Wang, Y., Liu, X., Li, X., and Zheng, X. (2024). Employing atomic force microscopy (AFM) for microscale investigation of interfaces and interactions in membrane fouling processes: new perspectives and prospects. Membranes 14 (2), 35. doi:10.3390/membranes14020035
Widakdo, J., De Guzman, M. R., Ang, M. B. M. Y., Hung, W. S., Huang, S. H., Hu, C. C., et al. (2023). Positron annihilation spectroscopy for the free volume depth profile analysis of multilayer and 2D materials composite membranes: a review. Sep. Purif. Technol. 322, 124366. doi:10.1016/j.seppur.2023.124366
Woo, S. H., Min, B. R., and Lee, J. S. (2017). Change of surface morphology, permeate flux, surface roughness and water contact angle for membranes with similar physicochemical characteristics (except surface roughness) during microfiltration. Sep. Purif. Technol. 187, 274–284. doi:10.1016/j.seppur.2017.06.030
Worrel, L. S., Morehouse, J. A., Shimko, L. A., Lloyd, D. R., Lawler, D. F., and Freeman, B. D. (2007). Enhancement of track-etched membrane performance via stretching. Sep. Purif. Technol. 53, 71–80. doi:10.1016/j.seppur.2006.06.017
Wu, S.-E., Lin, N.-J., Chou, C.-Y., Hu, C.-C., and Tung, K.-L. (2019). Biofouling mechanism of polysaccharide–protein–humic acid mixtures on polyvinylidene fluoride microfiltration membranes. J. Taiwan Inst. Chem. Eng. 94, 2–9. doi:10.1016/j.jtice.2017.08.013
Wu, T., Wang, K., Xiang, M., and Fu, Q. (2019). Progresses in manufacturing techniques of lithium-ion Battery Separators in China. Chin. J. Chem. 37, 1207–1215. doi:10.1002/cjoc.201900280
Xiao, K., Sun, J., Mo, Y., Fang, Z., Liang, P., Huang, X., et al. (2014). Effect of membrane pore morphology on microfiltration organic fouling: PTFE/PVDF blend membranes compared with PVDF membranes. Desalination 343, 217–225. doi:10.1016/j.desal.2013.09.026
Xu, L. Q., Chen, J. C., Wang, R., Neoh, K. G., Kang, E. T., and Fu, G. D. (2013). A poly(vinylidene fluoride)-graft-poly(dopamine acrylamide) copolymer for surface functionalizable membranes. RSC Adv. 3, 25204–25214. doi:10.1039/c3ra42782j
Xu, Q. H., Ye, Y., Chen, V., and Wen, X. H. (2015). Evaluation of fouling formation and evolution on hollow fibre membrane: effects of ageing and chemical exposure on biofoulant. Water Res. 68, 182–193. doi:10.1016/j.watres.2014.10.004
Xu, X., Li, J., Xu, N., Hou, Y., and Lin, J. (2009). Visualization of fouling and diffusion behaviors during hollow fiber microfiltration of oily wastewater by ultrasonic reflectometry and wavelet analysis. J. Membr. Sci. 341, 195–202. doi:10.1016/j.memsci.2009.06.009
Yamazaki, I. M., Paterson, R., and Geraldo, L. P. (1996). A new generation of track etched membranes for microfiltration and ultrafiltration. Part I. Preparation and characterisation. J. Membr. Sci. 118, 239–245. doi:10.1016/0376-7388(96)00098-1
Yan, L., Li, Y. S., and Xiang, C. B. (2005). Preparation of poly(vinylidene fluoride)(PVDF) ultrafiltration membrane modified by nano-sized alumina (Al2O3) and its antifouling research. Polymer 46, 7701–7706. doi:10.1016/j.polymer.2005.05.155
Yang, W., Wang, Z., Zhou, Y., Cheng, L., Zhang, Q., and Zhang, X. (2015). Preparation of porous membrane by combined use of thermally and chemical reaction-introduced nonsolvent-induced phase separations. Desalination Water Treat. 53, 2059–2069. doi:10.1080/19443994.2013.866054
Yang, X., Deng, B., Liu, Z., Shi, L., Bian, X., Yu, M., et al. (2010). Microfiltration membranes prepared from acryl amide grafted poly(vinylidene fluoride) powder and their pH sensitive behaviour. J. Membr. Sci. 362, 298–305. doi:10.1016/j.memsci.2010.06.057
Yave, W., Quijada, R., Ulbricht, M., and Benavente, R. (2005). Syndiotactic polypropylene as potential material for the preparation of porous membranes via thermally induced phase separation (TIPS) process. Polymer 46, 11582–11590. doi:10.1016/j.polymer.2005.10.012
Ye, Y., Chen, V., and Le-Clech, P. (2011). Evolution of fouling deposition and removal on hollow fibre membrane during filtration with periodical backwash. Desalination 283, 198–205. doi:10.1016/j.desal.2011.03.087
Yeo, P., Yang, A. G., Fane, A. G., White, T., and Moser, H. O. (2005). Non-invasive observation of external and internal deposition during membrane filtration by X-ray microimaging (XMI). J. Membr. Sci. 250, 189–193. doi:10.1016/j.memsci.2004.10.035
Yin, H. H., Zejie, Y., Weitao, M., and Daming, Z. (2005). A review of studies of polymeric membranes by positron annihilation lifetime spectroscopy. Plasma Sci. Technol. 7 (5), 3062–3064. doi:10.1088/1009-0630/7/5/020
Ying, L., Kang, E. T., Iwata, H., and Kato, K. (2007). Novel poly(N-isopropylacrylamide)-graft-poly(vinylidene fluoride) copolymers for temperature-sensitive microfiltration membranes. Macromol. Mater. Eng. 292, 1290. doi:10.1002/mame.200700351
Ying, L., Kang, E. T., and Neoh, K. G. (2002a). Covalent immobilization of glucose oxidase on microporous membranes prepared from poly(vinylidene fluoride) with grafted poly(acrylic acid) side chains. J. Membr. Sci. 208, 361–374. doi:10.1016/s0376-7388(02)00325-3
Ying, L., Kang, E. T., and Neoh, K. G. (2002b). Synthesis and characterization of poly(N-isopropylacrylamide)-graft-poly(vinylidene fluoride) copolymers and temperature-sensitive membranes. Langmuir 18, 6416–6423. doi:10.1021/la020241f
Ying, L., Kang, E. T., and Neoh, K. G. (2003a). Characterization of membranes prepared from blends of poly(acrylic acid)-graft-poly(vinylidene fluoride) with poly(N-isopropylacrylamide) and their temperature- and pH-sensitive microfiltration. J. Membr. Sci. 224, 93–106. doi:10.1016/j.memsci.2003.07.002
Ying, L., Kang, E. T., Neoh, K. G., Kato, K., and Iwata, H. (2004a). Drug permeation through temperature-sensitive membranes prepared from poly(vinylidene fluoride) with grafted poly(N-isopropylacrylamide) chains. J. Membr. Sci. 243, 253–262. doi:10.1016/j.memsci.2004.06.028
Ying, L., Wang, P., Kang, E. T., and Neoh, K. G. (2002c). Synthesis and characterization of poly(acrylic acid)-graft-poly(vinylidene fluoride) copolymers and pH-sensitive membranes. Macromolecules 35, 673–679. doi:10.1021/ma0112568
Ying, L., Yu, W. H., and Neoh, K. G. (2004b). Functional and surface-active membranes from poly(vinylidene fluoride)-graft-poly(acrylic acid) prepared via RAFT-mediated graft copolymerization. Langmuir 20, 6032–6040. doi:10.1021/la049383v
Ying, L., Zhai, G., Winata, A. Y., Kang, E. T., and Neoh, K. G. (2003b). pH effect of coagulation bath on the characteristics of poly(acrylic acid)-grafted and poly(4-vinylpyridine)-grafted poly(vinylidene fluoride) microfiltration membranes. J. Colloid Interface Sci. 265, 396–403. doi:10.1016/s0021-9797(03)00507-1
Yu, J., Hu, X., and Huang, Y. (2010). A modification of the bubble-point method to determine the pore-mouth size distribution of porous materials. Sep. Purif. Technol. 70, 314–319. doi:10.1016/j.seppur.2009.10.013
Yu, Y., Yang, Z., and Duan, Y. (2017). Structure and flow calculation of cake layer on microfiltration membranes. J. Environ. Sci. 26, 95–101. doi:10.1016/j.jes.2016.09.005
Yuan, W., and Zydney, A. L. (1999). Humic acid fouling during microfiltration. J. Membr. Sci. 157, 1–12. doi:10.1016/s0376-7388(98)00329-9
Zeman, L. (1992). Characterization of microfiltration membranes by image analysis of electron micrographs. J. Membr. Sci. 71, 233–246. doi:10.1016/0376-7388(92)80208-2
Zeman, L. (1996). Are pore size distributions in microfiltration membranes measurable by two-phase flow porosimetry? J. Membr. Sci. 120, 169–185. doi:10.1016/0376-7388(96)00120-2
Zeman, L. J., and Zydney, A. L. (1996). Microfiltration and ultrafiltration principles and applications. Edition 1st Edition. First Published 1996. eBook Published 25 October 2017.
Zhai, G. Q. (2006). pH- and temperature-sensitive microfiltration membranes from blends of poly(vinylidene fluoride)-graft-poly(4-vinylpyridine) and poly(N-isopropylacrylamide). J. Appl. Polym. Sci. 100, 4089–4097. doi:10.1002/app.23286
Zhai, G. Q., Kang, E. T., and Neoh, K. G. (2003b). Poly(2-vinylpyridine)- and poly(4-vinylpyridine)-graft-poly(vinylidene fluoride) copolymers and their pH-sensitive microfiltration membranes. J. Membr. Sci. 217, 243–259. doi:10.1016/s0376-7388(03)00140-6
Zhai, G. Q., Lei, Y., Kang, E. T., and Neoh, K. G. (2004). Surface and interface characterization of smart membranes. Surf. Interface Analysis 36, 1048–1051. doi:10.1002/sia.1834
Zhai, G. Q., Toh, S. C., Tan, W. L., Kang, E. T., Neoh, K. G., Huang, C. C., et al. (2003a). Poly(vinylidene fluoride) with grafted zwitterionic polymer side chains for electrolyte-responsive microfiltration membranes. Langmuir 19, 7030–7037. doi:10.1021/la034440q
Zhai, G. Q., Ying, L., Kang, E. T., and Neoh, K. G. (2002a). Synthesis and characterization of poly(vinylidene fluoride) with grafted acid/base polymer side chains. Macromolecules 35, 9653–9656. doi:10.1021/ma025566h
Zhai, G. Q., Ying, L., Kang, E. T., and Neoh, K. G. (2002b). Poly(vinylidene fluoride) with grafted 4-vinylpyridine polymer side chains for pH-sensitive microfiltration membranes. J. Mater. Chem. 12, 3508–3515. doi:10.1039/b206486c
Zhang, A., Zhang, Q., Bai, H., Li, L., and Li, J. (2014). Polymeric nanoporous materials fabricated with supercritical CO2 and CO2-expanded liquids. Chem. Soc. Rev. 43, 6938–6953. doi:10.1039/c4cs00100a
Zhang, C., Qu, Y., Liu, J., Chen, Q., Shao, M., Li, W., et al. (2024). Unraveling the role of NaCl on microfiltration fouling: insights from in situ analysis of dynamic interfacial behaviors. J. Membr. Sci. 690, 122223. doi:10.1016/j.memsci.2023.122223
Zhang, H., Lau, W. W. Y., and Sourirajan, S. (1995). Factors influencing the production of polyethersulfone microfiltration membranes by immersion phase inversion process. Sep. Sci. Technol. 30, 33–52. doi:10.1080/01496399508012212
Zhang, S., Chen, Y., Zang, X., and Zhang, X. (2020). Harvesting of Microcystis aeruginosa using membrane filtration: influence of pore structure on fouling kinetics, algogenic organic matter retention and cake formation. Algal Res. 52, 102112. doi:10.1016/j.algal.2020.102112
Zhao, C., Zhou, X., and Yue, Y. (2000). Determination of pore size and pore size distribution on the surface of hollow-fiber filtration membranes: a review of methods. Desalination 129, 107–123. doi:10.1016/s0011-9164(00)00054-0
Zhao, F., Urbance, M., and Skerlos, S. J. (2004). Mechanistic model of coaxial microfiltration for semi-synthetic metalworking fluid microemulsions. J. Manuf. Sci. Eng. 126, 435–444. doi:10.1115/1.1763187
Ziel, R., Haus, A., and Tulke, A. (2008). Quantification of the pore size distribution (porosity profiles) in microfiltration membranes by SEM, TEM, and computer image analysis. J. Membr. Sci. 323, 241–246. doi:10.1016/j.memsci.2008.05.057
Nomenclature
Keywords: microfiltration, physical morphology characterization techniques, fouling characterization techniques, gas liquid displacement porometry, microscopic techniques
Citation: Alsoy Altinkaya S (2024) A review on microfiltration membranes: fabrication, physical morphology, and fouling characterization techniques. Front. Membr. Sci. Technol. 3:1426145. doi: 10.3389/frmst.2024.1426145
Received: 30 April 2024; Accepted: 30 May 2024;
Published: 17 July 2024.
Edited by:
Qusay F. Alsalhy, University of Technology, Iraq, IraqReviewed by:
Dhiyaa Al-Timimi, University of Technology, Iraq, IraqSalam Hussein, University of Technology, Iraq, Iraq
Copyright © 2024 Alsoy Altinkaya. This is an open-access article distributed under the terms of the Creative Commons Attribution License (CC BY). The use, distribution or reproduction in other forums is permitted, provided the original author(s) and the copyright owner(s) are credited and that the original publication in this journal is cited, in accordance with accepted academic practice. No use, distribution or reproduction is permitted which does not comply with these terms.
*Correspondence: Sacide Alsoy Altinkaya, sacidealsoy@iyte.edu.tr