 Akbar Samadi
 Shahla Samadi3
 Gianluca Di Profio
 Enrica Fontananova
- 1National Research Council—Institute on Membrane Technology (CNR-ITM), Rende, Italy
- 2Institute for Frontier Materials, Deakin University, Geelong, VIC, Australia
- 3Department of Chemical Engineering, Sahand University of Technology, Tabriz, Iran
Introduction: Membrane distillation (MD) is a promising technique for desalination, capable of utilizing low-grade heat. However, MD faces some challenges such as temperature polarization. To overcome these issues, direct solar MD with localized heating (LHMD) has emerged as a cost-effective and efficient solution by leveraging solar energy.
Methods: This study focuses on process optimization of LHMD using computational fluid dynamics (CFD) modeling. CFD simulation was applied to investigate the fluid behavior, heat transfer, and mass transfer within the system. Several key factors, including module geometry, process configuration, solar irradiation, feed flow rate, and feed temperature are investigated.
Results: The effects of these parameters on the distillate production rate, thermal behavior, and energy efficiency, are evaluated for optimization. At the optimal conditions, 1 m2 membrane in a module with a length of 50 cm and a channel height of 1.5 mm under a counter-current flow generates 12 L drinking water per day, which meets the basic drinking water demands for 6 people. Over 70% gain output ratio can be achieved when the feed temperature is more than 20°C, the feed velocity is 1–1.5 mm/s, and the feed salinity is less than 1000 mol·m−3. This setup can also produce 6 L of distilled water per day when a water with a salinity six times higher than seawater if the feed velocity is sufficiently low.
Discussions: The main feature of the localized heating is the reverse temperature polarization on the feed side, leading to the increase in energy efficiency and the ease of scale-up.
1 Introduction
With the fast growing population and rapid industrialization, water desalination technologies have been playing a vital role in fresh water supply (Byrne et al., 2015). However, conventional desalination methods, such as multi-stage flash and reverse osmosis, suffer from high energy consumption (Nutakki, 2017). Recently, membrane distillation (MD) has emerged as a promising alternative for desalination due to its relatively low working temperature and potential to utilize low-grade heat or renewable energy (Karanikola et al., 2019; Bamasag et al., 2021; Samadi et al., 2023). However, MD faces some challenges, such as wetting, fouling, low energy efficiency, and temperature polarization (TP) (Martınez-Dıez and Vazquez-Gonzalez, 1999; Politano et al., 2019; Samadi et al., 2023). TP occurs when the temperatures of the bulk fluid differ from the temperatures of the membrane surfaces, leading to reduced efficiency of heat utilization and decreased membrane efficiency in terms of permeate flux (Figure 1) (Shakaib et al., 2012; Politano et al., 2019; Anvari et al., 2020). To enhance the thermal efficiency of MD, solar power has been employed in either indirect form (e.g., brine preheating in a collector) or direct form (e.g., heating brines directly in the desalination module) (Ahmed et al., 2020; Bamasag et al., 2022).
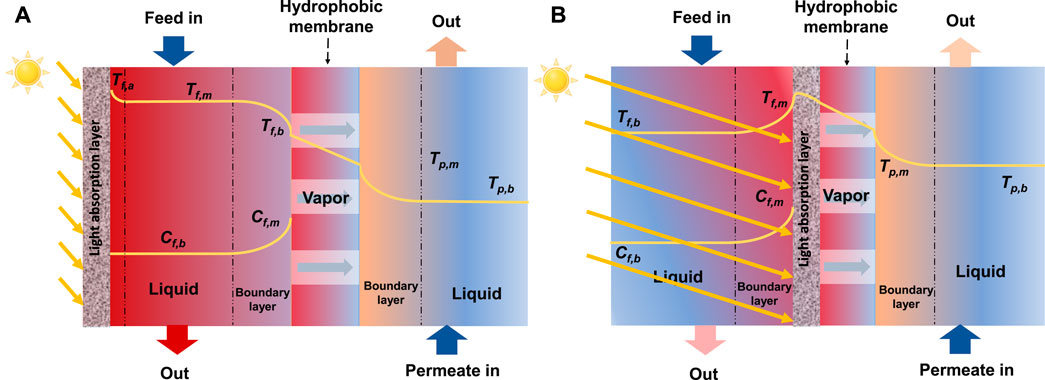
FIGURE 1. Concentration and temperature polarization in direct solar assisted direct contact MD (DCMD), without preheating: (A) absorber layer located above the feed channel, (B) absorber layer located above the membrane.
Direct solar MD (Wu et al., 2017), is an emerging technology that utilizes solar energy to operate the MD process more efficiently (Qtaishat and Banat, 2013; Buonomenna and Bae, 2015; Tufa et al., 2015). Unlike indirect solar powered MD, direct solar MD can be achieved through a single cost-effective collector-desalination system. However, the thermal efficiency of such a system is still relatively low (Dongare et al., 2017; Chen et al., 2021). This is because that the system requires heating of the total feed water and faces cross-membrane temperature difference for heat transfer from the absorber to the membrane surface (Figure 1A) (Said et al., 2019; Bamasag et al., 2020). To solve this problem, direct solar MD with localized heating (LHMD), in which a solar absorber is attached onto the membrane (Figure 1B), is introduced (Summers and Lienhard, 2013; Summers and Lienhard V, 2013; Politano et al., 2017; Wu et al., 2021). LHMD creates a reverse TP, which reduces all three terms of heat loss, i.e., transmembrane heat conduction, dissipation to the environment by radiation and convection, and heat discharge through the brine outlet (Cao et al., 2020; Farid et al., 2021; Li et al., 2021). The reversed TP also favors low feed velocity, which reduces pumping energy consumption (Bamasag et al., 2020). Additionally, the thermal driving force increases with increasing membrane module length, which is contrary to conventional MD systems (Gong et al., 2019; Huang et al., 2020; Mustakeem et al., 2022). Therefore, upscaling the module length can enhance the membrane flux (Dongare et al., 2017; Said et al., 2019; Bamasag et al., 2020).
Researchers have conducted various studies to enhance the performance of LHMD by using new nanomaterial absorbers or developing new membrane modules, such as flat plate or tubular surfaces (Dongare et al., 2017; Bamasag et al., 2022). Tubular solar collectors, such as evacuated tube collectors (ETCs), have also been employed in direct powered MD (Li et al., 2019a; Bamasag et al., 2020; Bamasag et al., 2021; Zhao et al., 2022). Integrating, ETCs with a compound parabolic concentrator may further enhance their performance (Ma et al., 2018; Li et al., 2019a). However, a drawback of, ETCs is the requirement of vacuum (Dongare et al., 2017). Chen applied solar heating for a DCMD with a distillation flux of 4.1 kg m-2·h-1 (Chen and Ho, 2010). Others have studied flat plate surfaces under air gap MD (AGMD) (Summers and Lienhard, 2013) and vacuum MD (VMD) (Ma et al., 2018) configurations (Figure 2). Ma et al. developed a numerical model of small-scale flat sheet VMD and found that MD operating without feed preheating is more efficient in terms of daily water output and energy usage (Ma et al., 2018). LHMD has been successfully used for water desalination without preheating (Dongare et al., 2017; Wu et al., 2021). Dongare et al. used a bilayer membrane, made of a photothermal porous polyvinyl alcohol/carbon black nanoparticle layer deposited on a commercial polyvinylidene fluoride (PVDF) membrane, and achieved a distillate flux of 0.22 kg m-2 h-1 under 0.7 kW m-2 sunlight without feed preheating (Dongare et al., 2017). Wu et al. enhanced the permeate flux to 1.0 kg m-2 h-1 without preheating using a bacterial nanocellulose bilayer membrane (Wu et al., 2021).
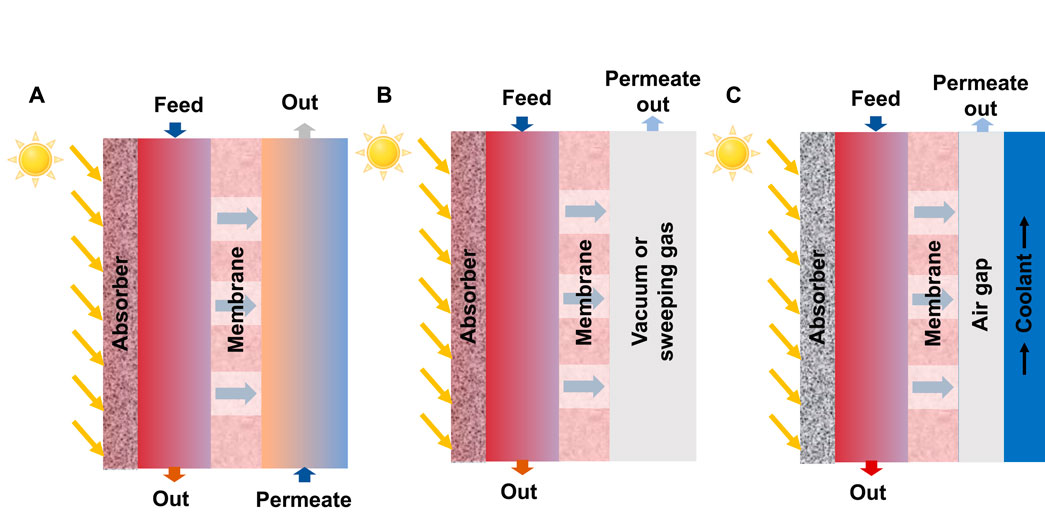
FIGURE 2. Flat plate direct solar powered MD systems with absorber: (A) direct contact MD (DCMD), (B) vacuum MD (VMD) or sweeping gas MD (SGMD), and (C) air gap MD (AGMD) configurations.
While there are successful reports on LHMD, the research gaps must be filled to optimize the system performance based on the operating parameters (e.g., temperature, salinity, and velocity), module geometry (e.g., channel height and length), and process configurations (e.g., absorber location, and counter-current versus co-current flow). Here, we study the performance of LHMD with computational fluid dynamics modeling with simultaneous mass, momentum, and heat transfer across the membrane and throughout the channels under solar absorption on a porous layer. The COMSOL Multiphysics® software package version 6.1 was employed to simulate the system. After solving the model and data validation, the optimal productivity was determined to provide water desalination in remote regions with little access to electrical energy.
2 Methods
2.1 Geometry and governing equations
Figure 3 illustrates the flat plate LHMD system under study state. The sunlight passes through the feed channel and is absorbed by the light-absorbing layer. The heat generated by the light absorption increases the temperature of the feed water, and this localized heat propagates throughout the system via thermal conduction and convection, resulting in water evaporation at the feed-absorber interface. The governing equations, including continuity and Navier-Stokes equations, are outlined in Table 1. The velocity, temperature, and concentration distributions in the feed channel are obtained by simultaneously solving mass, energy, and momentum conservation equations and continuity equation in the systems. The mass conservation equation is coupled with the energy conservation equation in the porous media to determine the water vapor concentration distribution and MD mass flux. Finally, the energy and momentum conservation equations are solved simultaneously in the permeate channel to determine the velocity and temperature profiles.
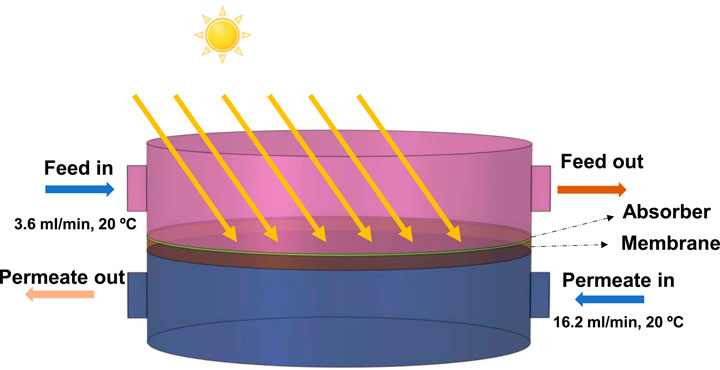
FIGURE 3. The schematic representation of the flat plate LHMD system under study.
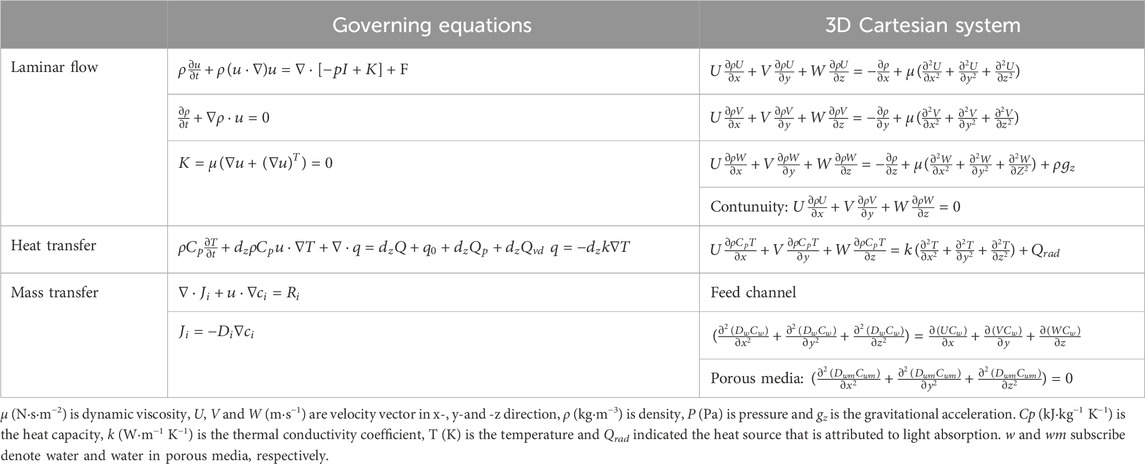
TABLE 1. Governing equations.
The solar assisted system relies solely on localized heating at the absorber domain to drive the vapor flux in the membrane, and therefore, feed preheating is not required. As a result, the velocity profile and water activity have a significant impact on the temperature profile. All fluid properties, including density, dynamic viscosity, diffusion coefficient, thermal conductivity, and specific heat capacity, are temperature-dependent. However, the membrane characteristics, such as porosity, and pore size were assumed to be constant. The model was solved in a steady-state mode with laminar flow in both channels. Heat was transferred through the membrane and fluids, and convective mass transfer was not considered for the porous media since the pore diameter was not in the range of Darcy flow. The mass transfer through the membranes was assumed to be a combination of molecular diffusion and Knudsen diffusion. It was also assumed that the light completely passes through the feed channel and is absorbed only in the absorber domain. Furthermore, it was assumed that no salt diffuses through the membrane, implying that the permeate side is pure water with no concentration distribution.
2.2 Model parameters
2.2.1 Heat transfer
MD involves thermally driven mass transport, and heat transfer in the LHMD module occurs through the following steps: (i) Heat is generated in the illuminated absorber and membrane domains, with power dissipation density exponentially decreasing across the thickness of these layers, as described by (Dongare et al., 2017):
The equation shown above includes the absorption coefficient αi (cm-1) of the absorber and BNC layers in units of cm-1, the light concentration factor (M) (which takes a value of either 1 or 9), the incident solar power intensity (Isun) of 1000 W m-2, and the z-coordinate of the photothermal coating surface (z0). BNC layers can absorb almost 98% of the illuminated light. The heat absorbed by the absorber. As a result of convective heat transfer from the absorber-feed interface to the bulk feed channel, the temperature of the feed channel increases, leading to diverse TP and enhancing the thermal efficiency of the localized heat absorption in the LHMD system, which is a significant advantage over conventional direct solar MD systems. Finally, conductive (qcond) and convective (qconv) heat transfer occur across the porous membrane and absorber (Afsari et al., 2022):
iv) The temperature on the permeate side increases due to the convective transfer of condensed water from the permeate-membrane interface to the bulk permeate channel. The thermal conductivity of the porous media is determined by the porosity and thermal conductivity of the solid matrix, as well as the water vapor and air inside the pores (Afsari et al., 2022). Several models have been proposed to calculate the thermal conductivity of the absorber and membrane based on molecular orientation (see Table 2).
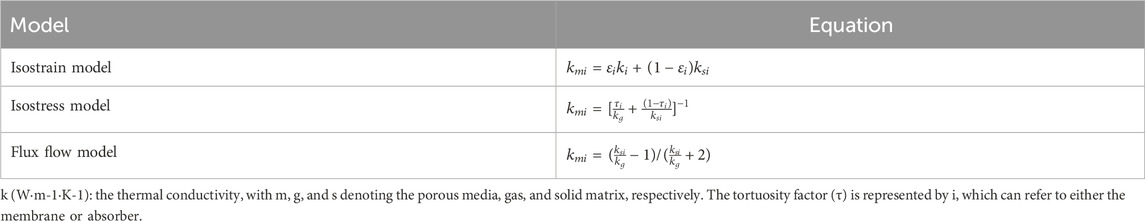
TABLE 2. Models expressed thermal conductivity of porous media (Phattaranawik et al., 2003b).
To determine the most appropriate model, experimental data is used to compare the models and select the one with the lowest error. Since the porous media has a high porosity (0.98), the thermal conductivity model has a minor impact on the overall thermal conductivity of the porous media. Isostrain model provided the best fit with the experimental data. The thermal conductivity of a homopolymer (ks) is influenced by factors such as temperature, crystallites shape, spatial arrangement, and the degree of crystallinity (Afsari et al., 2022). However, due to the high porosity of the system, ks is temperature-independent. The thermal conductivity of the gas (kg) is calculated using the following equation (Huang and Reprogle, 2019; Harandi et al., 2021):
In order to solve the energy conservation equation, the evaporation and condensation heat flux (
The equation shown above includes the membrane distillate flux (J) and the specific latent heat of water, represented by λ(T). The enthalpy of liquid water is not taken into account in this equation, as it is much lower than the latent heat (Esfandiari et al., 2019). The specific latent heat of water, λ(T), is calculated using the correlation (Smith, 1950):
TP coefficient (TPC) is used to evaluate the thermal efficiency of the system by:
where f, p, b and i stand for feed, permeate, bulk and interface, respectively. Gain output ratio (GOR) is another term to measure overall energy efficiency of a system by (Dongare et al., 2017):
2.2.2 Mass transfer
The vapor flux (J) across the membrane is determined by (Schofield et al., 1990):
where
the mean free path (L) of a specie is calculated by the expression:
where
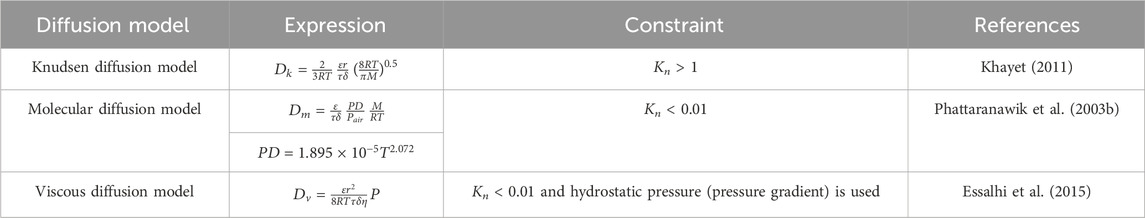
TABLE 3. The dominant diffusion mechanisms in the porous media.
Due to the distribution of pore sizes in the membrane, various mechanisms may occur at the same time (Lawson and Lloyd, 1997). The viscous diffusion model is not significant because there is no hydrostatic pressure applied to the membrane boundaries (Lou et al., 2019). As a result, by considering both the Knudsen (
In the DCMD with salt aqueous feed solution, the mean free path for water vapor at 50 °C under atmospheric pressure is approximately 0.14 μm (Lawson and Lloyd, 1997). Considering the pore size of the membrane used in this study, Kn > 1, and so the Knudsen diffusion model is the only dominant diffusion mechanism which is agreement with the experimental data:
The saturated vapor pressure at the feed-absorber interface and membrane-permeate interface (
where
where, b is NaCl concentration (mol·kg-1). The salt concentration at the membrane surface is higher than the bulk feed channel due to the concentration polarization according to the equation:
where cwif and cwbf are water concentration at feed membrane interface and bulk feed channel, respectively, and kx is the mass transfer coefficient, and ρ is the solution density.
he tortuosity factor (
The correlation in Eq. 20 best fitted with the experimental data in this work. The water-salt binary diffusion coefficient of the saline feed water (Dw-s) is also obtained by the Wilke-Chang correlation (Wilke and Chang, 1955) in order to solve the mass conservation equation in the feed channel:
where
2.3 Meshing and solving methods
2.3.1 Grid independence analysis
A 3D cylindrical system was discretized according to the physics and geometry of the system (Figure 4). After validation of the 3D model using experimental data, a 2D planar CFD system was discretized based on its physics and geometry and used for simulation and optimization (Figure 5). The impact of switching from a 3D to a 2D system was assessed. For both systems, the meshing was done using physic-controlled mesh in COMSOL Multiphysics. To examine the effect of mesh size on the error between the predicted and experimental membrane fluxes, different levels of mesh size ranging from “extra-coarse” to “extra-fine” were used. The results of the mesh independence analysis for different experimental conditions are shown in Tables 4 and 5. The “finer” and “extra-fine” grid size were chosen for 2D and 3D CFD simulations, respectively, because smaller grids do not significantly improve accuracy but increase computation time.
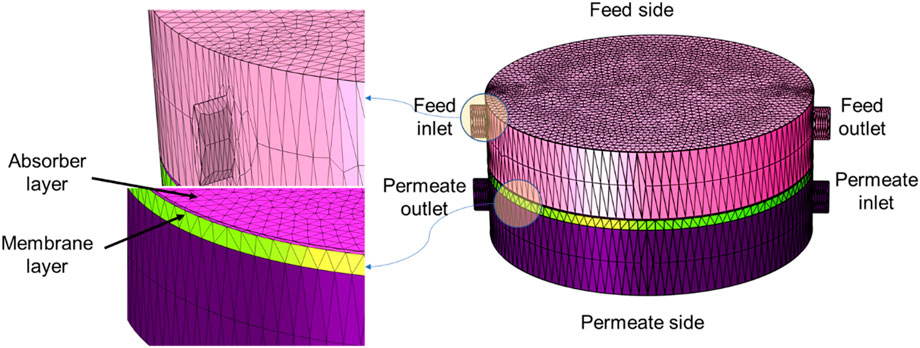
FIGURE 4. Qualitative mesh representation for 3D system according to experimental setup. The right figure is the whole 3D setup used to simulate the experimental verification. The left figure shows meshing in the focused part of the system such as feed entrance and membrane/absorber interface.
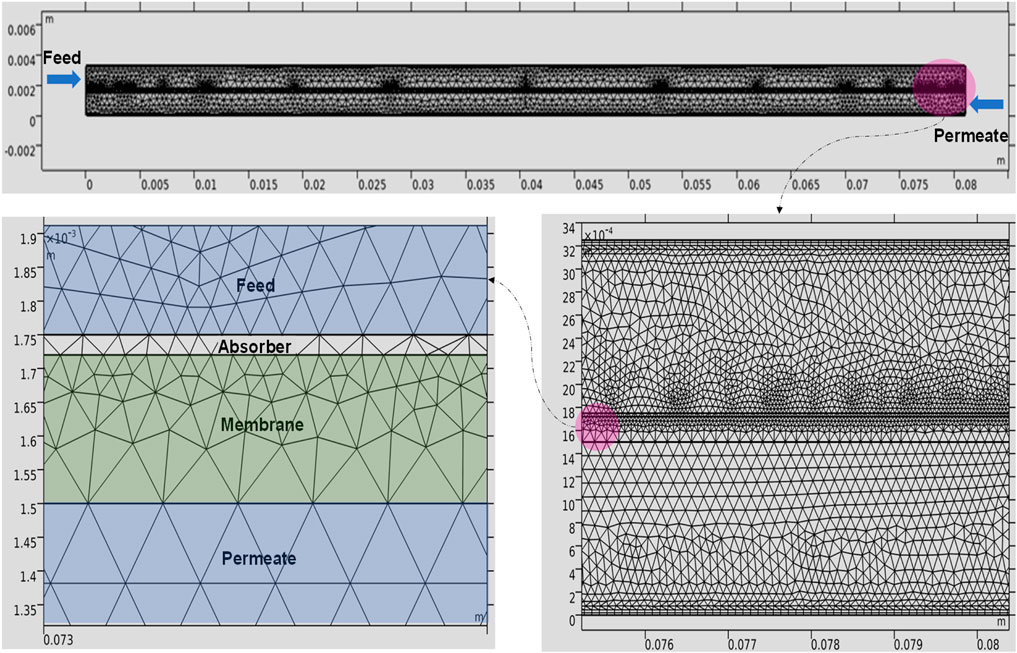
FIGURE 5. Qualitative mesh representation for the 2D system. The upper figure depicts the side view of membrane module. The left and right figures illustrate how the 2D system is meshed for different layers (i.e., feed and permeate channels, membrane, and absorber layer).
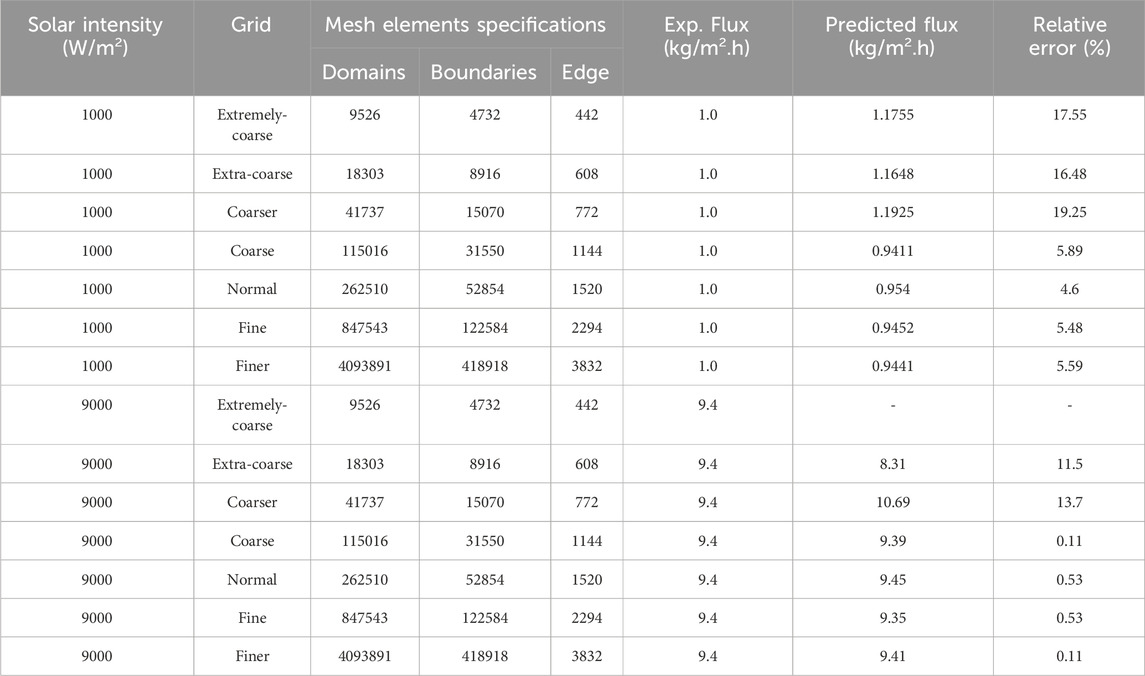
TABLE 4. Results of grid independence analysis and model validation for 3D system.
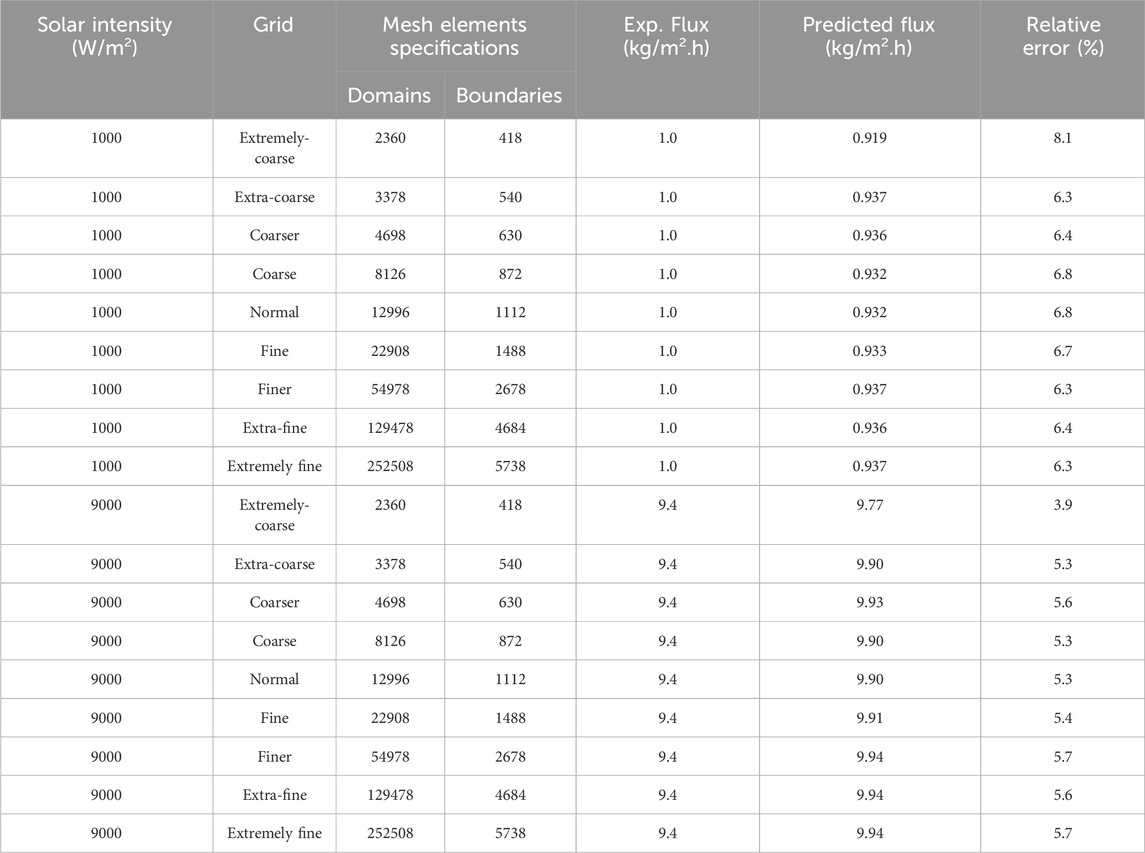
TABLE 5. Results of grid independence analysis and model validation for 2D system.
2.3.2 Solutions of governing equations
The CFD module in COMSOL Multiphysics® software package version 6.1 was used to solve the governing equations for the entire geometry and the corresponding initial and boundary conditions. The Geometrical Optics module with Ray Tracing study and generalized minimal residual (GMRES) algorithms were used to simulate light absorption in the absorber and membrane domains. The steady-state momentum, energy, and mass equations were solved using the parallel sparse direct solver (PARDISO). Convergence criteria in COMSOL Multiphysics, mainly defined by Relative Tolerance, determine the stability, accuracy, and reliability of numerical simulations, indicating that further iterations will not significantly change the results. The convergence criteria were set at 10–5.
3 Results and discussion
3.1 Model validation
The experimental results reported by Wu et al. (Wu et al., 2021) for a cylindrical solar-powered DCMD system with a 5-cm-diameter membrane cell and an absorbing layer above the membrane surface (Figure 3) were compared to the 3D model results at two operating points, i.e., solar intensities of 1000 (M = 1) and 9000 (M = 9) W·m-2. Feed (0.5 M NaCl at 20°C) with a velocity of 3.6 mL˖min-1 enters the top side of the cylinder, while the permeate (DI water at 20°C) flows with a velocity of 3.6 mL min-1 in the bottom side in a counter current direction. The hydrophobic porous membrane consists of a thin BNC hydrogel layer (∼220 µm), deposited by PDA particles to form a PDA photothermal absorber layer (∼30 µm) on the membrane surface. For the 3D system, the relative error for the membrane flux is about 5.5% and 0.53% for solar intensities of 1000 and 9000 W m-2, respectively.
The 2D simulation of a rectangular system with appropriate dimensions is shown in Table 5. Optimization tests and scale-up studies were not possible using the cylindrical geometry of the experimental data. Therefore, a rectangular system was used for simulation studies. This system was studied using 2D CFD as shown in Figure 5. For an average length and width of 4cm, the results of the 2D system were compared to the experimental data. The relative error for the membrane flux is about 6.4% and 5.5% for solar intensities of 1000 and 9000 W m-2, respectively. This indicates that 2D simulation can be used for optimization studies and to determine the preferred operational and module characteristics of LHMD setup.
3.2 Temperature, velocity and concentration profiles
The flux of the LHMD under irradiation condition of 1 kW m-2 and 9 kW m-2 is 0.94 and 9.9, respectively. The temperature profiles of the 3D system are depicted in Figures 6, 7 while the average temperature values at any part of the system are represented in Table 6. The simulation results revealed that the average temperature of the membrane surface is higher than the bulk feed side temperature (Table 6). Consequently, the overall energy efficiency of the system (GOR) is 62% and 73% for membrane under 1 and 9 kW m-2, respectively, which is higher than the efficiencies of co-current process (57.5% and 67% under 1 and 9 kW m-2) and common direct solar powered MD (29% under 1 kW m-2) (Ni et al., 2018; Li et al., 2019b). The reverse TP (Figure 1B) makes low feed velocity more favorable, reducing the pumping energy (discussed later in this paper) (Dongare et al., 2017; Said et al., 2019). Since the energy source is the photothermal layer, which is located inside the membrane module, the heat loss is minimized. In addition, the higher membrane length increases thermal efficiency which is in contradiction with conventional MD systems (discussed later in this paper). As a result, scale-up of this system is easy (Dongare et al., 2017; Said et al., 2019).
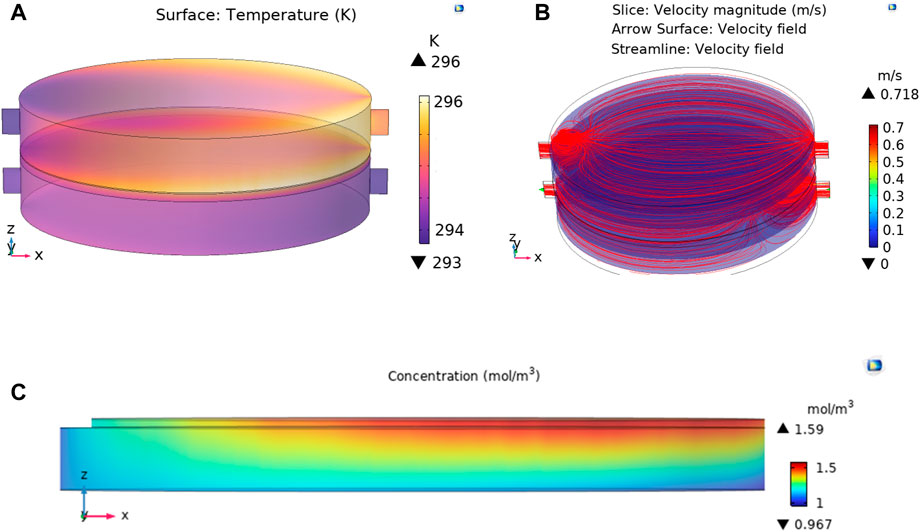
FIGURE 6. The results of MD test with localized heating at 1 kW m-2 illumination, (A) temperature profiles, (B) velocity streamlines, and (C) vapor concentration across the membrane.
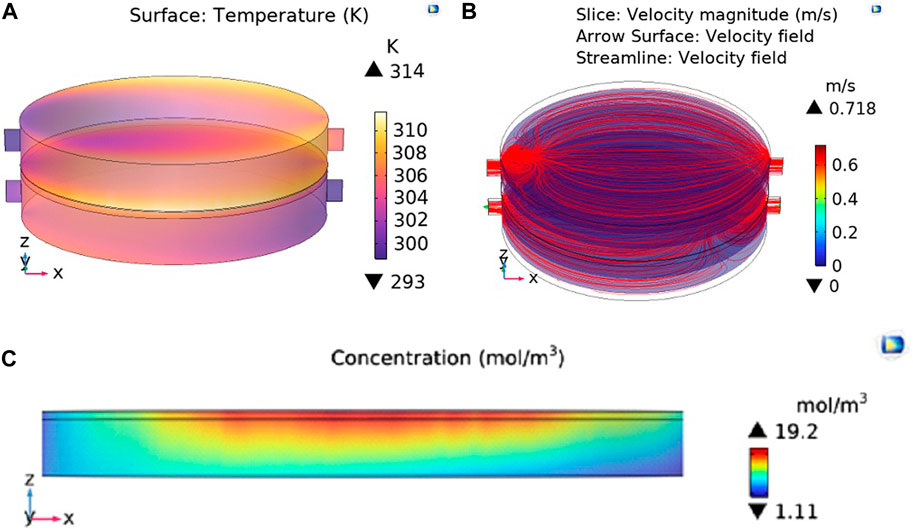
FIGURE 7. The results of MD test with localized heating at 9 kW m-2 illumination, (A) temperature profiles, (B) velocity streamlines, (C), and vapor concentration across the membrane.
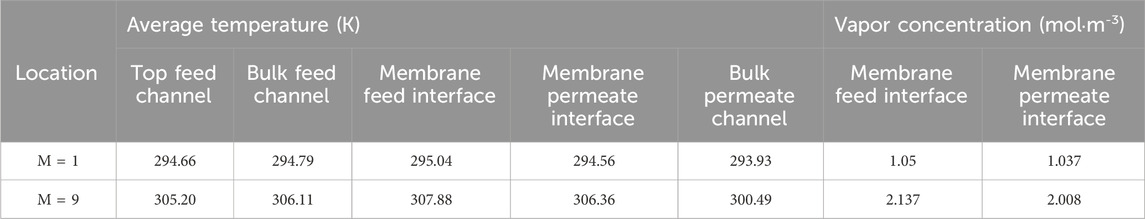
TABLE 6. The average temperature (K) and vapor concentration values (mol·m-3) based on the 2D CFD simulation (Feed salinity is 0.5 M NaCl at 20°C. Feed flowrate is 3.6 mL˖min-1. Channel depth and length are 4 cm. Channel height is 1.5 mm. Irradiation intensity is 1 and 9 kW m-2).
The vapor concentration profiles in the membrane are depicted in Figures 6C, 7C. The lower temperature of the permeate side (Tp,m) versus feed side (Tf,m) overcomes the effect of salt concentration on decreasing saturation pressure according to Eqs 17, 18. Thus, the vapor pressure (i.e., concentration) in the membrane-permeate interface (Cp,m) is lower than the feed side (Cf,m) as seen in Figures 6C, 7C and Table 6. As a result, water vapor passes the hydrophobic membrane and condenses in the permeate side, providing pure distilled water.
The velocity streamlines for feed and permeate side are depicted in Figures 6B, 7B. Velocity profile for 2D simulation is depicted in Figure 8. The parabolic nature of the velocity profile can be easily observed in the velocity profiles of 2D simulation as depicted in Figure 8. The permeate side velocity was higher than the feed side to minimize any temperature profile in the permeate side. The parabolic profiles are due to the boundary conditions applied to solve the CFD model. In the proposed MD system, only water passes through the membrane in the vapor form according to the difference in the water saturation pressure across the membrane.
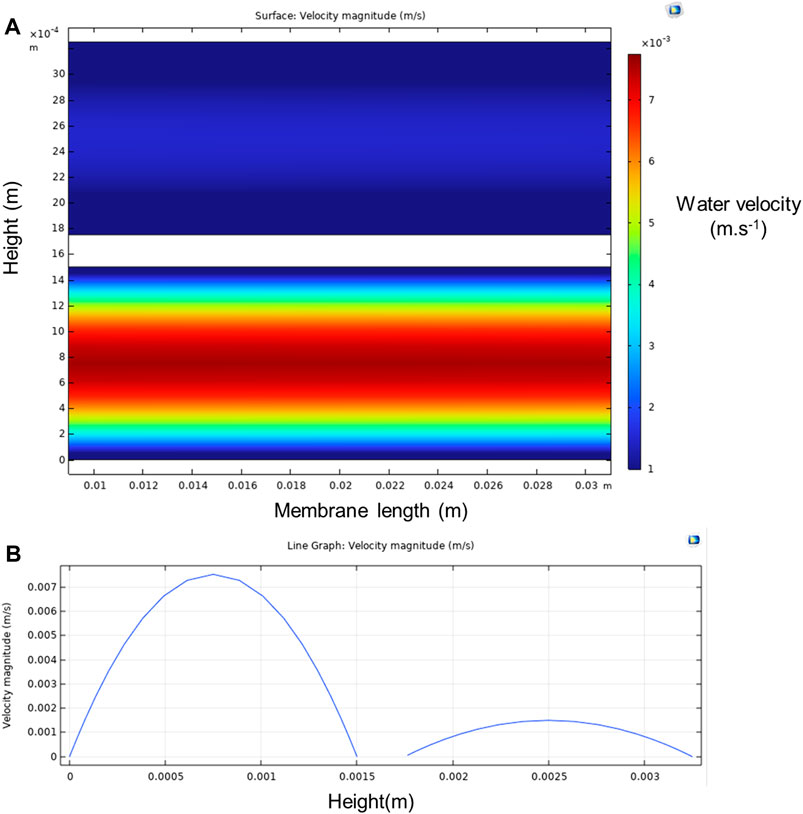
FIGURE 8. (A) Velocity profile in 2D simulation; (B) Cross membrane velocity profile at 2D system.
Permeate flux and GOR of the system of study are among the highest numbers for previously reported membranes treating ambient temperature feed water under similar irradiations and localized heating (Wu et al., 2021). For instance, PTFE membrane modified with photothermal layer exhibited distillate flux of 0.78 kW m-2 and 55% GOR under 1 kW m-2 (Gong et al., 2019). There are 3 reasons for the high permeate flux and GOR of the system of study. Firstly, PDA provides outstanding light absorption and photothermal conversion (Liu et al., 2014). Not to mention that PDA is a biocompatible material (Liu et al., 2013; Liu et al., 2014) with high chemical and mechanical robustness (Lee et al., 2007). Secondly, high porosity (98%) and highly interconnected pore space provides high permeability. Finally, the high porosity reduces thermal conductivity of the membrane. The thermal conductivity of BNC aerogel (0.027 W m-1·K−1) is very close to the thermal conductivity of the air (Jiang et al., 2017).
3.3 The effect of parameters
2D simulation was applied to evaluate the effect of geometric and operating parameters on the performance of MD membranes. For this system the light intensity was selected to be 1 kW m-2 because the higher intensity of Sun is not applicable an easily available in reality and in large-scale applications.
3.3.1 Absorber location
One of the main features of the system of study is the localized heating due to the locating of the absorber below the feed channel. For comparison, a system with the same geometry and operating condition was considered with an absorber layer located at the top of the feed layer. It was considered that the Sun passes a vacuum and is absorbed completely at the absorber before entering the feed layer. The low permeate flux of 0.43 kg m-2 h-1 is observed and reached a maximum value of 0.70 kg m-2 h-1 at 15–20 cm membrane length. The localized heating increased the permeate flux by 119% (0.94 kg m-2 h-1 at 4 cm membrane length). The temperature profile at the feed side is completely different from the same profile for the localized heating system as shown in Figure 9 and Figure 10C. For localized heating system, the maximum temperature is on the membrane-feed interface that decreases in both sides. Thus, the feed-membrane interface has the highest temperature, increasing the driving force for vapor transport through the membrane. Moreover, the thermal losses at the feed top surface are less for localized heating system due to the lower temperature of the feed top surface, as compared with conventional system.
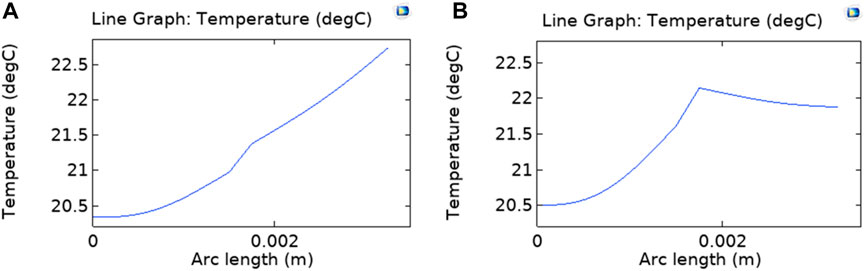
FIGURE 9. The temperature profile across the membrane in direct solar MD, which the absorber is located at (A) Top of the feed channel and (B) Attached to the membrane surface (Feed salinity is 0.5 M NaCl at 20°C. Feed flowrate is 3.6 mL˖min-1. Channel depth and length are 4 cm. Channel height is 1.5 mm. Irradiation intensity is 1 kW m-2).
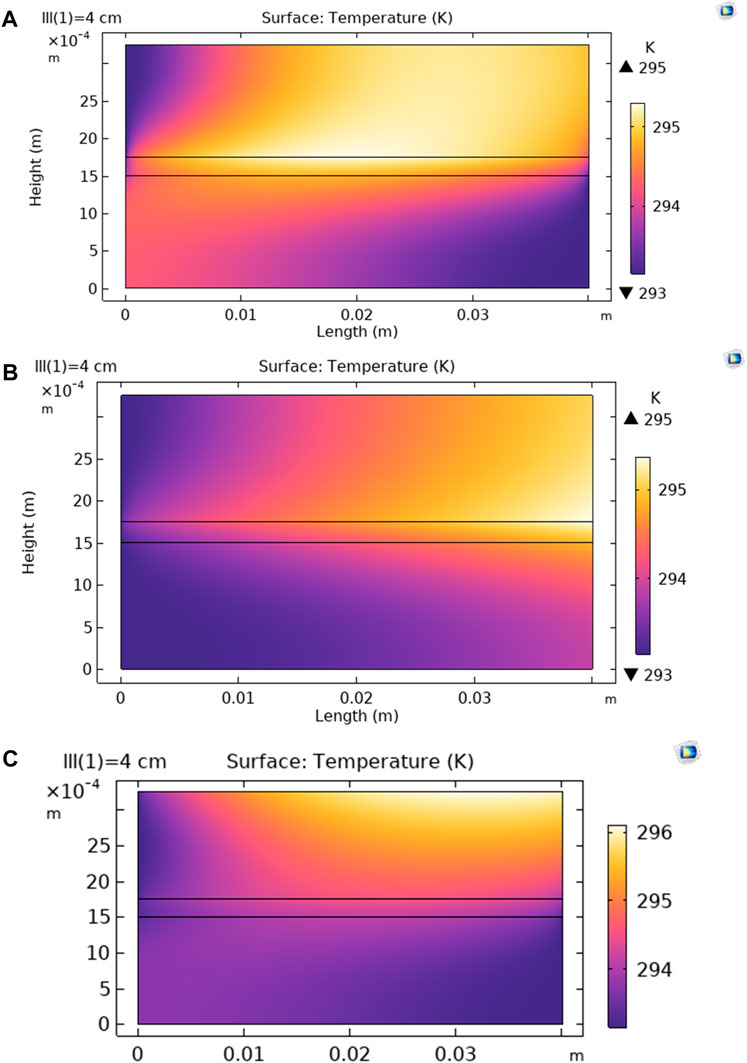
FIGURE 10. Temperature profiles for (A) co-current flow, (B) counter-current flow, and (C) counter-current flow with absorber located on the top.
3.3.2 Co-current versus counter-current configuration
The effect of co-current and counter-current flow modes on the transmembrane heat transfer and vapor pressure difference was studied. As seen in Figure 10, the different temperature difference regimes are obtained which affect vapor flux and membrane performance. The vapor flux for co-current and counter-current flow modes were calculated for the modules with different membranes length from 4 cm to 100 cm. According to Table 7, countercurrent mode is more effective than co-current mode (about 10% higher flux), in most of the membrane lengths and they reach almost to the same value at the 100 cm membrane length. Accordingly, most of the DCMD setups operate at counter-current mode (Dongare et al., 2017; Esfandiari et al., 2019; Gong et al., 2019; Said et al., 2019). The consistent performance observed with an extended membrane length can be attributed to the gradual rise in bulk feed temperature along the membrane, leading to damping of the reverse TP. In conventional DCMD setup, the counter-current mode exhibited higher performance than co-current mode except when the module length is too high which is an inherent problem of conventional DCMD (Ni et al., 2020). As the temperature profiles in localized heating are different from conventional heating model, counter-current is preferred to co-current operation in the recent publications about the localized heated nano-enabled DCMD (Dongare et al., 2017; Gong et al., 2019; Said et al., 2019; Wu et al., 2021). This is verified by the data in Table 7.
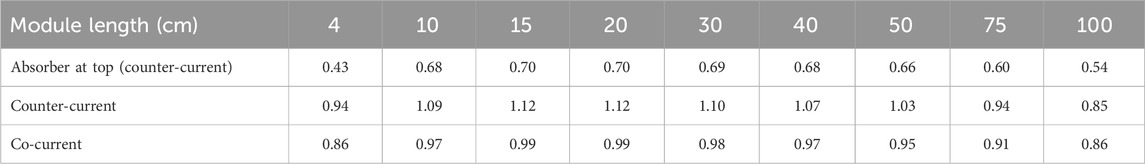
TABLE 7. The distillate flux (kg·m-2·h-1) at different system design (co-current, counter-current, and absorber at top) versus module length (Feed salinity is 0.5 M NaCl at 20°C. Feed flowrate is 3.6 mL˖min-1. Channel depth and length are 4 cm. Channel height is 1.5 mm. Irradiation intensity is 1 kW m-2).
3.3.3 Channel length and height
Channel length has a major effect in the performance of heat transfer-based systems such as MD because it affects the transmembrane heat transfer and the driving force for permeation (Afsari et al., 2022). At the optimum membrane length, the average driving force, i.e., vapor pressure difference across the membrane is the highest. However, the saturated vapor pressure of water has a nonlinear dependence on temperature according to Antoine equation. The heat convection in the feed side increases the feed solution temperature which acts as heat recovery. However, the heat conduction and convection across the membrane and the evaporation/condensation in the membrane sides increases the temperature in the permeate side. Thus, it is required to determine the optimum length where the balance of all the aforementioned heat transfer terms leads to the highest average vapor pressure difference across the membrane.
In conventional MD, the increase of the length decreases the transmembrane temperature difference (Esfandiari et al., 2019). This leads to a zero distillate flux at a high membrane length (Dongare et al., 2017). So, there is an optimum length with the highest distillation flux (Afsari et al., 2022). In contrary, in localized heating system, the high membrane length mostly benefits the MD performance (Dongare et al., 2017; Said et al., 2019). This is mainly attributed to the reverse TP in the localized heating MD. Thus, by increasing the membrane length, only a part of the accumulated heat passes the membrane and increases the permeate side temperature, while the main portion of this heat will transfer upside and warm the heat channel which consequently acts as a preheating and increases the distillation driving force. The result of the 2D simulation (Table 7) shows that by increasing the membrane length, the permeation flux is enhanced or kept constant which until 75 cm membrane length and an slight decrease is observed at 1 m membrane length (Dongare et al., 2017; Said et al., 2019). This is the main feature of localized heating DCMD which enables commercialization of the technology.
The channel height is a parameter that influences TP in the conventional MD process (Rabie et al., 2021). Accordingly, the Rabie et al. decreased the channel height from 2.5 mm to 1.5 mm and reported 21% increase in permeate flux due to the reduced TP (Rabie et al., 2021). The effect of channel heigh on the membrane performance was studied in two modes: (1) fixed channel flow-rate where the fluid velocity decreases with the increase in channel height and (2) fixed channel velocity where the channel flow-rate increases with the increase in channel height. The same approach is observed in this study (Table 8), where any decrease in the channel height leads to higher distilled flux values. Higher cross velocity eliminates fouling, but decrease the hydraulic retention time of the fluid in the membrane, leading to more heat loss and lower thermal efficiency. In determining the ideal channel height, it is essential to consider both the energy required for pumping and the potential for channel blockage. Consequently, higher channel heights are discouraged due to increased fluid pumping energy demands and reduced distilled flux. Conversely, channel heights less than 1 mm are not advisable because they may lead to blockage issues and boundary layer complications. As a result, a channel height of 1.5 mm is recommended for achieving optimal performance.
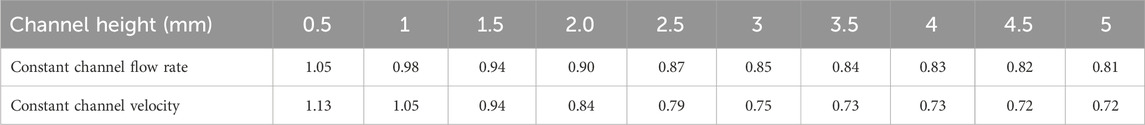
TABLE 8. The distillate flux (kg·m-2·h-1) at different channel heights (Feed salinity is 0.5 M NaCl at 20°C. Feed flowrate (Q) is 3.6 mL˖min-1 for constant channel flow rate test. Channel depth (W) and length are 4 cm. So, the feed flow velocity can be calculated by Q/(W×H), where H is the channel height. Irradiation intensity is 1 kW m-2).
The simultaneous effect of membrane length and channel height on the membrane productivity and GOR is examined by the means of the contour plots as shown in Figure 11. In a constant feed flow, an increase in the channel height decreases the feed velocity. Thus, the effect of channel height was discussed in two modes of constant feed flux and constant feed velocity. The graphs of distillate flux and GOR are exactly the same according to Eq. 9. In constant feed flow, the highest GOR achieved at moderate height (1–2 mm) and slight decrease in flux observed at high membrane length. In contrary, in constant feed velocity, any increase in height enhances GOR and productivity (Figure 11B). However, this requires higher pumping energy since the feed flux increases linearly with the increase in height. Moreover, Figure 11A implies that GOR higher than 60% is available when the channel height is higher than 1 mm in any membrane length, representing the easy scale-up of this technology.
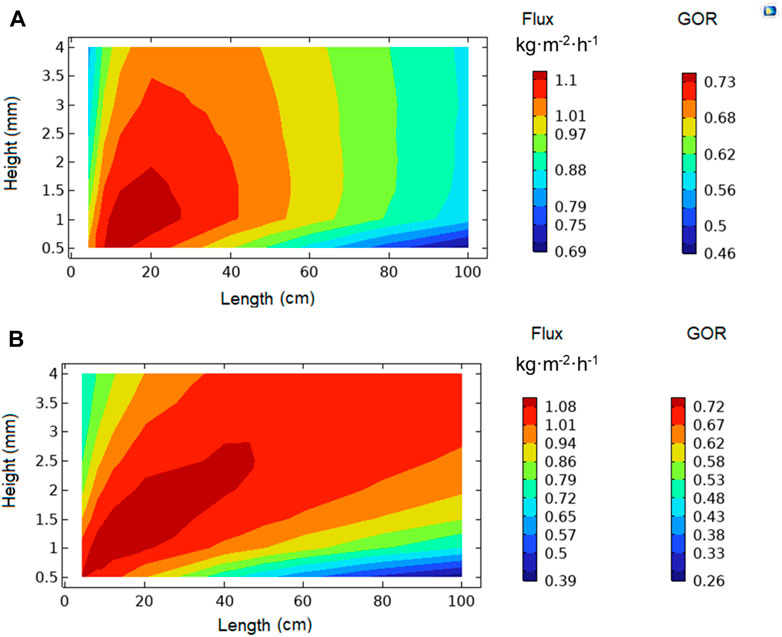
FIGURE 11. The contour plots of distillate flux and gain output ratio (GOR) as a function of membrane length and channel height; (A) constant feed flux and (B) constant feed velocity (Feed salinity is 0.5 M NaCl at 20°C. Feed flowrate (Q) is 3.6 mL˖min-1 for constant channel flow rate test. Channel depth (W) is 4 cm. So, the feed flow velocity can be calculated by Q/(W×H), where H is the channel height. Irradiation intensity is 1 kW m-2).
3.3.4 Feed temperature, velocity, and salinity
In this study, it is assumed that the feed and permeate channels have the same temperature with the ambient. Thus, the change in distilled flux with the ambient temperature in localized heating MD is studied. The feed and permeate side have the same temperature in all cases. However, the membrane performance increases due to the exponential dependence of water vapor concentration on temperature according to the Antoine equation. At the highest temperature of 50°C, the distillate flux is 1.01 kg m-2 h-1 (7% increases compared with 0.94 kg m-2 h-1 at 20°C). In the same way, the distilled flux is reached to 0.87 kg m-2 h-1 when the temperature declined by ten degrees, which exhibits 9% decrease, compared with 0.94 kg m-2 h-1 at 20°C (Table 9).
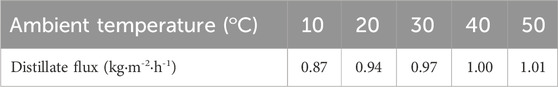
TABLE 9. The distillate flux (kg·m-2·h-1) at different temperatures (Feed salinity is 0.5 M NaCl. Feed flowrate is 3.6 mL˖min-1. Channel depth and length are 4 cm. Channel height is 1.5 mm. Irradiation intensity is 1 kW m-2).
Cross velocity of the feed has a significant effect on the MD performance (Eykens et al., 2016; Dongare et al., 2017; Said et al., 2019; Afsari et al., 2022). In conventional MD, high cross velocity decreases boundary when the Reynolds number increases (Lawson and Lloyd, 1997; Hwang et al., 2011). This leads to reduce the TP and decrease the heat loss in the MD process (Eykens et al., 2016). Consequently, in Conventional DCMD, the distillate flux increases by the feed cross velocity (Hwang et al., 2011; Eykens et al., 2016; Afsari et al., 2022). However, the energy consumption of the pumps increases with the increase in cross velocity. Therefore, the feed cross velocity in conventional MD must be determined regarding both distillate flux and pumping energy. Although both conventional and localized heating MD techniques result in increased distillate flux due to lower membrane thermal conductivity and higher diffusion coefficients arising from greater membrane porosity, their reliance on feed flow velocity exhibits opposing characteristics (Dongare et al., 2017).
At low feed flow rates, localized heating MD exhibits the highest efficiency (Table 10), whereas flux of conventional MD reaches its maximum only at higher flow rates. The reason behind these trends can be explained by the different temperature gradient that exists across the membrane. In the case of localized heating MD, slower feed velocities allow for the creation of a larger temperature gradient between the feed and distillate sides of the membrane, leading to an increased distillate flux. On the other hand, for conventional MD, where the feed is heated before entering the module, higher feed velocities reduce heat loss for the feed flow along the membrane (Dongare et al., 2017; Said et al., 2019; Wu et al., 2021). Operating efficiently at low flow velocities would give localized heating MD a notable edge over MD in off-grid locations, as it would allow the use of solar-powered water pumps (Dongare et al., 2017). As a result, the energy required for brine recirculation, a significant factor in the overall energy consumption of conventional MD processes, would be significantly reduced. Extremely low feed velocities are not advisable as they increase the likelihood of concentration polarization and membrane fouling. Therefore, taking into account factors such as pumping energy, membrane fouling, and distillate flux, a feed flux of 3.6 mL min-1 (with a feed cross velocity of 0.1 cm s-1) was utilized for this simulation.

TABLE 10. The distillate flux (kg·m-2·h-1) at different feed velocities (cm/s) (Feed salinity is 0.5 M NaCl at 20°C. Feed flowrate is 3.6 mL˖min-1. Channel depth and length are 4 cm. Channel height is 1.5 mm. Irradiation intensity is 1 kW m-2).
MD is driven by the difference in saturated vapor pressure of water across the membrane, which is determined by water temperature and salinity, as described in Eqs 15–18. On the permeate side, it is pure water, and only the temperature affects the water vapor pressure. However, on the feed side, salinity (i.e., salt concentration at the membrane-feed interface) also influences water activity, causing a reduction in vapor pressure. In the case of solar-powered MD without preheating, this factor plays a significant role in distillate flux due to the lower temperature gradient across the membrane, as compared to conventional MD with feed preheating. Figure 11 demonstrates an almost a linear correlation between membrane salinity and distillate flux. In the case of a 4 cm membrane length (gray points in Figures 12A, B), the distillate flux declines and ultimately ceases at a salt concentration of 3600 mol m-3. However, since longer modules have a positive impact on membrane performance, they can handle higher salt concentrations (e.g., up to 4800 mol m-3 at 50 cm membrane length) as in Figure 12B. Moreover, Figure 12A implies that the lower feed velocities provide condition to produce distilled water from high saline feed solutions. According to the simulation results, at a feed velocity ten times lower (i.e., 0.01 cm s-1), the membrane productivity is still positive until the feed salinity of 5500 mol m-3.
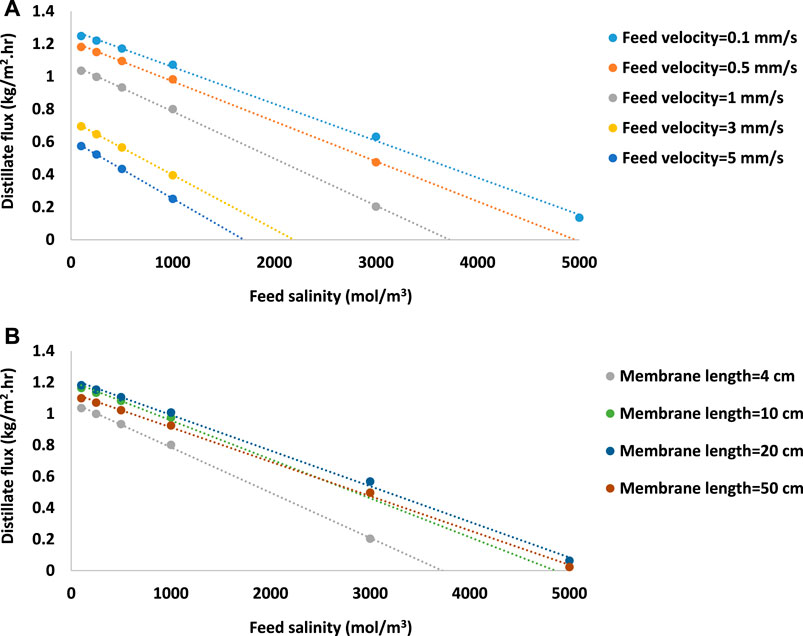
FIGURE 12. The linear relation between distillate flux (kg·m-2·h-1) and feed salinity (mol·m-3) at (A) various feed velocities and (B) membrane lengths (Feed temperature is 20°C. Feed flowrate is 3.6 mL˖min-1. Channel depth is 4 cm. Channel height is 1.5 mm. Irradiation intensity is 1 kW m-2).
Analysis of the effect of operating parameters on the GOR has been investigated in the contour plots of Figure 13. As seen, high temperature (Figure 13A), low feed velocity (Figures 13A, B) and low feed salinity (Figure 13B), enhances the GOR up to 80%. As mentioned before, very low feed velocities may cause blocking or fouling. Thus, a GOR of 70% is practically anticipated when the temperature is more than 20°C, Feed velocity is 1–1.5 mm/s, and feed salinity is less than 1000 mol m-3.
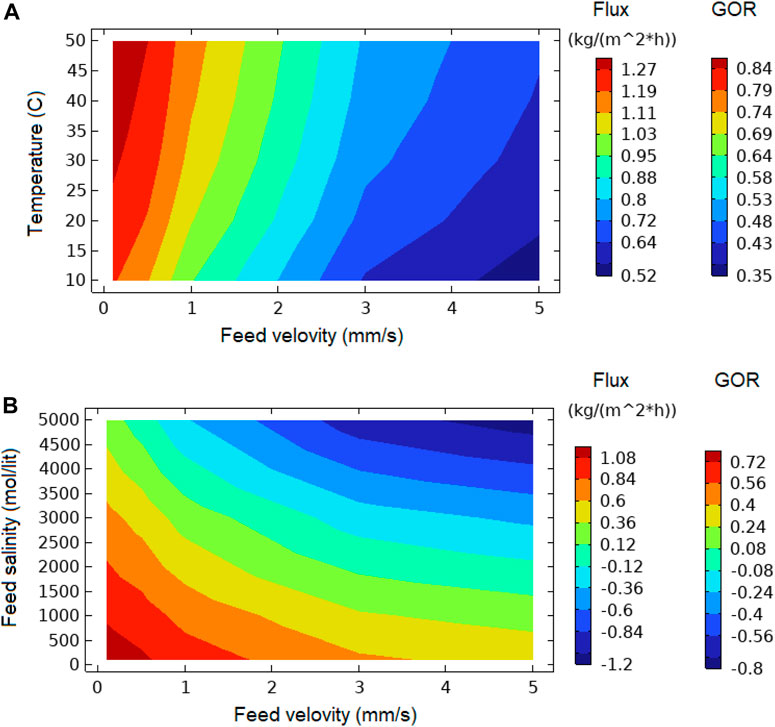
FIGURE 13. The contour plots of distillate flux and gain output ratio (GOR) as a function of feed velocity and (A) temperature and (B) feed salinity. (Channel depth and length are 4 cm. Channel height is 1.5 mm. Irradiation intensity is 1 kW m-2).
4 Conclusion
The results showed that localized heating increased the permeate flux by 119%. The temperature profile on the feed side was completely different from common MD systems, driving vapor transport through the membrane. The reverse temperature polarization resulted in an overall system energy efficiency of 62% and 73% under 1 and 9 kW m-2, respectively. The counter-current mode is more effective than the co-current mode, with ∼10% higher flux in most membrane lengths. Contrary to conventional MD, the high membrane length mostly benefits the LHMD performance. By increasing the membrane length, the permeation flux is enhanced or kept constant until 75 cm membrane length. This is the main feature of LHMD, which enables commercialization of the technology. At the highest temperature of 50°C, the distillate flux is 1.01 kg m-2 h-1, which is a 7% increase compared to 0.94 kg m-2 h-1 at 20°C. At lower feed flow rates, LHMD exhibits higher efficiencies. The simulation results revealed that, at the satisfactory range of operating condition (i.e., a temperature more than 20°C, a feed velocity below 1.5 mm/s, and a feed salinity of less than 1000 mol m-3), a GOR of more than 70% can be obtained. One of the objectives of the study is to determine the operating and geometrical parameters for a one-square-meter-membrane setup for off-grid water distillation for remote families. By choosing 50 cm length it is possible to design a membrane module with 1 m in width and 2 50-cm-length, adjacent to each other to easily fed and operate. Overall, a membrane length of 50 cm and channel height of 1.5 mm in a counter-current flow might be the optimal condition. With this geometry, 1 m2 membrane produces 12 L distilled water per day, which meets the basic drinking water requirements for 6 people.
Data availability statement
The original contributions presented in the study are included in the article/Supplementary material, further inquiries can be directed to the corresponding author.
Author contributions
AS: Conceptualization, Data curation, Formal Analysis, Investigation, Methodology, Validation, Writing–original draft, Writing–review and editing. SS: Conceptualization, Data curation, Formal Analysis, Investigation, Methodology, Validation, Writing–original draft, Writing–review and editing. GD: Conceptualization, Supervision, Writing–review and editing. SZ: Conceptualization, Supervision, Writing–review and editing. EF: Conceptualization, Funding acquisition, Supervision, Writing–review and editing.
Funding
The author(s) declare financial support was received for the research, authorship, and/or publication of this article. This work has received funding from the European Union’s Horizon 2020 research and innovation program within the intelWATT project, under grant agreement no. 958454.
Conflict of interest
The authors declare that the research was conducted in the absence of any commercial or financial relationships that could be construed as a potential conflict of interest.
The author(s) declared that they were an editorial board member of Frontiers, at the time of submission. This had no impact on the peer review process and the final decision.
Publisher’s note
All claims expressed in this article are solely those of the authors and do not necessarily represent those of their affiliated organizations, or those of the publisher, the editors and the reviewers. Any product that may be evaluated in this article, or claim that may be made by its manufacturer, is not guaranteed or endorsed by the publisher.
References
Afsari, M., Ghorbani, A. H., Asghari, M., Shon, H. K., and Tijing, L. D. (2022). Computational fluid dynamics simulation study of hypersaline water desalination via membrane distillation: effect of membrane characteristics and operational parameters. Chemosphere 305, 135294. doi:10.1016/j.chemosphere.2022.135294
Ahmed, F. E., Lalia, B. S., Hashaikeh, R., and Hilal, N. (2020). Alternative heating techniques in membrane distillation: a review. Desalination 496, 114713. doi:10.1016/j.desal.2020.114713
Alawad, S. M., and Khalifa, A. E. (2019). Analysis of water gap membrane distillation process for water desalination. Desalination 470, 114088. doi:10.1016/j.desal.2019.114088
Anvari, A., Yancheshme, A. A., Kekre, K. M., and Ronen, A. (2020). State-of-the-art methods for overcoming temperature polarization in membrane distillation process: a review. J. Membr. Sci. 616, 118413. doi:10.1016/j.memsci.2020.118413
Bamasag, A., Almatrafi, E., Alqahtani, T., Phelan, P., Ullah, M., Mustakeem, M., et al. (2022). Recent advances and future prospects in direct solar desalination systems using membrane distillation technology. J. Clean. Prod. 385, 135737. doi:10.1016/j.jclepro.2022.135737
Bamasag, A., Alqahtani, T., Sinha, S., Ghaffour, N., and Phelan, P. (2020). Experimental investigation of a solar-heated direct contact membrane distillation system using evacuated tube collectors. Desalination 487, 114497. doi:10.1016/j.desal.2020.114497
Bamasag, A., Alqahtani, T., Sinha, S., Ghaffour, N., and Phelan, P. (2021). Solar-heated submerged vacuum membrane distillation system with agitation techniques for desalination. Sep. Purif. Technol. 256, 117855. doi:10.1016/j.seppur.2020.117855
Bruggeman, V. D. (1935). Berechnung verschiedener physikalischer Konstanten von heterogenen Substanzen. I. Dielektrizitätskonstanten und Leitfähigkeiten der Mischkörper aus isotropen Substanzen. Ann. Phys. 416, 665–679. doi:10.1002/andp.19354160802
Buonomenna, M. G., and Bae, J. (2015). Membrane processes and renewable energies. Renew. Sustain. Energy Rev. 43, 1343–1398. doi:10.1016/j.rser.2014.11.091
Byrne, P., Fournaison, L., Delahaye, A., Oumeziane, Y. A., Serres, L., Loulergue, P., et al. (2015). A review on the coupling of cooling, desalination and solar photovoltaic systems. Renew. Sustain. Energy Rev. 47, 703–717. doi:10.1016/j.rser.2015.03.083
Cao, S., Wu, X., Zhu, Y., Gupta, R., Tan, A., Wang, Z., et al. (2020). Polydopamine/hydroxyapatite nanowire-based bilayered membrane for photothermal-driven membrane distillation. J. Mater. Chem. A 8, 5147–5156. doi:10.1039/c9ta12703h
Chen, T.-C., and Ho, C.-D. (2010). Immediate assisted solar direct contact membrane distillation in saline water desalination. J. Membr. Sci. 358, 122–130. doi:10.1016/j.memsci.2010.04.037
Chen, T.-C., Ho, C.-D., and Yeh, H.-M. (2009). Theoretical modeling and experimental analysis of direct contact membrane distillation. J. Membr. Sci. 330, 279–287. doi:10.1016/j.memsci.2008.12.063
Chen, Y.-R., Xin, R., Huang, X., Zuo, K., Tung, K.-L., and Li, Q. (2021). Wetting-resistant photothermal nanocomposite membranes for direct solar membrane distillation. J. Membr. Sci. 620, 118913. doi:10.1016/j.memsci.2020.118913
Dongare, P. D., Alabastri, A., Pedersen, S., Zodrow, K. R., Hogan, N. J., Neumann, O., et al. (2017). Nanophotonics-enabled solar membrane distillation for off-grid water purification. Proc. Natl. Acad. Sci. 114, 6936–6941. doi:10.1073/pnas.1701835114
Esfandiari, A., Monjezi, A. H., Rezakazemi, M., and Younas, M. (2019). Computational fluid dynamic modeling of water desalination using low-energy continuous direct contact membrane distillation process. Appl. Therm. Eng. 163, 114391. doi:10.1016/j.applthermaleng.2019.114391
Essalhi, M., and Khayet, M. (2013). Self-sustained webs of polyvinylidene fluoride electrospun nanofibers at different electrospinning times: 1. Desalination by direct contact membrane distillation. J. Membr. Sci. 433, 167–179. doi:10.1016/j.memsci.2013.01.023
Essalhi, M., and Khayet, M. (2015). “Chapter three - membrane distillation (MD),” in Progress in filtration and separation. Editor S. Tarleton (Oxford: Academic Press), 61–99.
Eykens, L., Hitsov, I., De Sitter, K., Dotremont, C., Pinoy, L., Nopens, I., et al. (2016). Influence of membrane thickness and process conditions on direct contact membrane distillation at different salinities. J. Membr. Sci. 498, 353–364. doi:10.1016/j.memsci.2015.07.037
Farid, M. U., Kharraz, J. A., and An, A. K. (2021). Plasmonic titanium nitride nano-enabled membranes with high structural stability for efficient photothermal desalination. ACS Appl. Mater. Interfaces 13, 3805–3815. doi:10.1021/acsami.0c17154
Gong, B., Yang, H., Wu, S., Yan, J., Cen, K., Bo, Z., et al. (2019). Superstructure-Enabled anti-fouling membrane for efficient photothermal distillation. ACS Sustain. Chem. Eng. 7, 20151–20158. doi:10.1021/acssuschemeng.9b06160
Harandi, H. B., Asadi, A., Fathi, H., and Sui, P.-C. (2021). Combined macroscopic and pore scale modeling of direct contact membrane distillation with micro-porous hydrophobic membranes. Desalination 514, 115171. doi:10.1016/j.desal.2021.115171
He, W., Zou, J., Wang, B., Vilayurganapathy, S., Zhou, M., Lin, X., et al. (2013). Gas transport in porous electrodes of solid oxide fuel cells: a review on diffusion and diffusivity measurement. J. Power Sources 237, 64–73. doi:10.1016/j.jpowsour.2013.02.089
Hitsov, I., Maere, T., De Sitter, K., Dotremont, C., and Nopens, I. (2015). Modelling approaches in membrane distillation: a critical review. Sep. Purif. Technol. 142, 48–64. doi:10.1016/j.seppur.2014.12.026
Huang, F. Y., and Reprogle, R. (2019). Thermal conductivity of polyvinylidene fluoride membranes for direct contact membrane distillation. Environ. Eng. Sci. 36, 420–430. doi:10.1089/ees.2018.0349
Huang, J., Hu, Y., Bai, Y., He, Y., and Zhu, J. (2020). Novel solar membrane distillation enabled by a PDMS/CNT/PVDF membrane with localized heating. Desalination 489, 114529. doi:10.1016/j.desal.2020.114529
Hwang, H. J., He, K., Gray, S., Zhang, J., and Moon, I. S. (2011). Direct contact membrane distillation (DCMD): experimental study on the commercial PTFE membrane and modeling. J. Membr. Sci. 371, 90–98. doi:10.1016/j.memsci.2011.01.020
Iversen, S., Bhatia, V., Dam-Johansen, K., and Jonsson, G. (1997). Characterization of microporous membranes for use in membrane contactors. J. Membr. Sci. 130, 205–217. doi:10.1016/s0376-7388(97)00026-4
Jiang, Q., Derami, H. G., Ghim, D., Cao, S., Jun, Y.-S., and Singamaneni, S. (2017). Polydopamine-filled bacterial nanocellulose as a biodegradable interfacial photothermal evaporator for highly efficient solar steam generation. J. Mater. Chem. A 5, 18397–18402. doi:10.1039/c7ta04834c
Karanikola, V., Moore, S. E., Deshmukh, A., Arnold, R. G., Elimelech, M., and Sáez, A. E. (2019). Economic performance of membrane distillation configurations in optimal solar thermal desalination systems. Desalination, 472. doi:10.1016/j.desal.2019.114164
Khayet, M. (2011). Membranes and theoretical modeling of membrane distillation: a review. Adv. colloid interface Sci. 164, 56–88. doi:10.1016/j.cis.2010.09.005
Lawson, K. W., and Lloyd, D. R. (1997). Membrane distillation. J. Membr. Sci. 124, 1–25. doi:10.1016/s0376-7388(96)00236-0
Lee, H., Dellatore, S. M., Miller, W. M., and Messersmith, P. B. (2007). Mussel-inspired surface chemistry for multifunctional coatings. science 318, 426–430. doi:10.1126/science.1147241
Li, Q., Beier, L.-J., Tan, J., Brown, C., Lian, B., Zhong, W., et al. (2019a). An integrated, solar-driven membrane distillation system for water purification and energy generation. Appl. Energy 237, 534–548. doi:10.1016/j.apenergy.2018.12.069
Li, W., Deng, L., Huang, H., Zhou, J., Liao, Y., Qiu, L., et al. (2021). Janus photothermal membrane as an energy generator and a mass-transfer accelerator for high-efficiency solar-driven membrane distillation. ACS Appl. Mater. Interfaces 13, 26861–26869. doi:10.1021/acsami.1c01072
Li, W., Li, Z., Bertelsmann, K., and Fan, D. E. (2019b). Portable low-pressure solar steaming-collection unisystem with polypyrrole origamis. Adv. Mater. 31, 1900720. doi:10.1002/adma.201900720
Liu, Y., Ai, K., Liu, J., Deng, M., He, Y., and Lu, L. (2013). Dopamine-melanin colloidal nanospheres: an efficient near-infrared photothermal therapeutic agent for in vivo cancer therapy. Adv. Mater. 25, 1353–1359. doi:10.1002/adma.201204683
Liu, Y., Ai, K., and Lu, L. (2014). Polydopamine and its derivative materials: synthesis and promising applications in energy, environmental, and biomedical fields. Chem. Rev. 114, 5057–5115. doi:10.1021/cr400407a
Lou, J., Vanneste, J., DeCaluwe, S. C., Cath, T. Y., and Tilton, N. (2019). Computational fluid dynamics simulations of polarization phenomena in direct contact membrane distillation. J. Membr. Sci. 591, 117150. doi:10.1016/j.memsci.2019.05.074
Ma, Q., Ahmadi, A., and Cabassud, C. (2018). Direct integration of a vacuum membrane distillation module within a solar collector for small-scale units adapted to seawater desalination in remote places: design, modeling and evaluation of a flat-plate equipment. J. Membr. Sci. 564, 617–633. doi:10.1016/j.memsci.2018.07.067
MacGregor, R., and Emery, A. F. (1969). Free convection through vertical plane layers—moderate and high Prandtl number fluids.
Martınez-Dıez, L., and Vazquez-Gonzalez, M. I. (1999). Temperature and concentration polarization in membrane distillation of aqueous salt solutions. J. Membr. Sci. 156, 265–273. doi:10.1016/s0376-7388(98)00349-4
Mustakeem, M., El-Demellawi, J. K., Obaid, M., Ming, F., Alshareef, H. N., and Ghaffour, N. (2022). MXene-coated membranes for autonomous solar-driven desalination. ACS Appl. Mater. Interfaces 14, 5265–5274. doi:10.1021/acsami.1c20653
Ni, G., Zandavi, S. H., Javid, S. M., Boriskina, S. V., Cooper, T. A., and Chen, G. (2018). A salt-rejecting floating solar still for low-cost desalination. Energy and Environ. Sci. 11, 1510–1519. doi:10.1039/c8ee00220g
Ni, W., Li, Y., Zhao, J., Zhang, G., Du, X., and Dong, Y. (2020). Simulation study on direct contact membrane distillation modules for high-concentration NaCl solution. Membranes 10, 179. doi:10.3390/membranes10080179
Nutakki, T. U. K. (2017). Integration of membrane distillation and solar thermal systems for coproduction of purified water and heat. Stockholm: KTH Royal Institute of Technology.
Phattaranawik, J., Jiraratananon, R., and Fane, A. (2003a). Effect of pore size distribution and air flux on mass transport in direct contact membrane distillation. J. Membr. Sci. 215, 75–85. doi:10.1016/s0376-7388(02)00603-8
Phattaranawik, J., Jiraratananon, R., and Fane, A. G. (2003b). Heat transport and membrane distillation coefficients in direct contact membrane distillation. J. Membr. Sci. 212, 177–193. doi:10.1016/s0376-7388(02)00498-2
Politano, A., Argurio, P., Di Profio, G., Sanna, V., Cupolillo, A., Chakraborty, S., et al. (2017). Photothermal membrane distillation for seawater desalination. Adv. Mater. 29, 1603504. doi:10.1002/adma.201603504
Politano, A., Di Profio, G., Fontananova, E., Sanna, V., Cupolillo, A., and Curcio, E. (2019). Overcoming temperature polarization in membrane distillation by thermoplasmonic effects activated by Ag nanofillers in polymeric membranes. Desalination 451, 192–199. doi:10.1016/j.desal.2018.03.006
Qtaishat, M. R., and Banat, F. (2013). Desalination by solar powered membrane distillation systems. Desalination 308, 186–197. doi:10.1016/j.desal.2012.01.021
Rabie, M., Elkady, M., and El-Shazly, A. (2021). Effect of channel height on the overall performance of direct contact membrane distillation. Appl. Therm. Eng. 196, 117262. doi:10.1016/j.applthermaleng.2021.117262
Said, I. A., Wang, S., and Li, Q. (2019). Field demonstration of a nanophotonics-enabled solar membrane distillation reactor for desalination. Industrial Eng. Chem. Res. 58, 18829–18835. doi:10.1021/acs.iecr.9b03246
Samadi, A., Ni, T., Fontananova, E., Tang, G., Shon, H., and Zhao, S. (2023). Engineering antiwetting hydrophobic surfaces for membrane distillation: a review. Desalination 563, 116722. doi:10.1016/j.desal.2023.116722
Schofield, R., Fane, A., and Fell, C. (1990). Gas and vapour transport through microporous membranes. I. Knudsen-Poiseuille transition. J. Membr. Sci. 53, 159–171. doi:10.1016/0376-7388(90)80011-a
Shakaib, M., Hasani, S., Ahmed, I., and Yunus, R. M. (2012). A CFD study on the effect of spacer orientation on temperature polarization in membrane distillation modules. Desalination 284, 332–340. doi:10.1016/j.desal.2011.09.020
Summers, E. K., and Lienhard, J. H. (2013). Experimental study of thermal performance in air gap membrane distillation systems, including the direct solar heating of membranes. Desalination 330, 100–111. doi:10.1016/j.desal.2013.09.023
Summers, E. K., and Lienhard V, J. H. (2013). A novel solar-driven air gap membrane distillation system. Desalination water Treat. 51, 1344–1351. doi:10.1080/19443994.2012.705096
Tufa, R. A., Curcio, E., Brauns, E., van Baak, W., Fontananova, E., and Di Profio, G. (2015). Membrane distillation and reverse electrodialysis for near-zero liquid discharge and low energy seawater desalination. J. Membr. Sci. 496, 325–333. doi:10.1016/j.memsci.2015.09.008
Webb, S. W. (1996). “Gas-phase diffusion in porous media: evaluation of an advective-dispersive formulation and the dusty-gas model including comparison to data for binary mixtures,” in Sandia national lab.(SNL-NM) (Albuquerque, NM (United States)).
Wilke, C., and Chang, P. (1955). Correlation of diffusion coefficients in dilute solutions. AIChE J. 1, 264–270. doi:10.1002/aic.690010222
Wu, J., Zodrow, K. R., Szemraj, P. B., and Li, Q. (2017). Photothermal nanocomposite membranes for direct solar membrane distillation. J. Mater. Chem. A 5, 23712–23719. doi:10.1039/c7ta04555g
Wu, X., Cao, S., Ghim, D., Jiang, Q., Singamaneni, S., and Jun, Y.-S. (2021). A thermally engineered polydopamine and bacterial nanocellulose bilayer membrane for photothermal membrane distillation with bactericidal capability. Nano Energy 79, 105353. doi:10.1016/j.nanoen.2020.105353
Keywords: direct contact membrane distillation, solar energy, desalination, localized heating, CFD simulation, energy efficiency, optimization
Citation: Samadi A, Samadi S, Di Profio G, Zhao S and Fontananova E (2024) Computational fluid dynamics modelling and optimization of solar powered direct contact membrane distillation with localized heating for off-grid desalination. Front. Membr. Sci. Technol. 3:1348874. doi: 10.3389/frmst.2024.1348874
Received: 03 December 2023; Accepted: 10 January 2024;
Published: 31 January 2024.
Edited by:
Zhongyun Liu, Georgia Institute of Technology, United StatesReviewed by:
Xiaochan An, Sichuan Agricultural University, ChinaEhsan Zolghadr, University of Alabama, United States
Copyright © 2024 Samadi, Samadi, Di Profio, Zhao and Fontananova. This is an open-access article distributed under the terms of the Creative Commons Attribution License (CC BY). The use, distribution or reproduction in other forums is permitted, provided the original author(s) and the copyright owner(s) are credited and that the original publication in this journal is cited, in accordance with accepted academic practice. No use, distribution or reproduction is permitted which does not comply with these terms.
*Correspondence: Enrica Fontananova, ZW5yaWNhLmZvbnRhbmFub3ZhQGNuci5pdA==