
94% of researchers rate our articles as excellent or good
Learn more about the work of our research integrity team to safeguard the quality of each article we publish.
Find out more
ORIGINAL RESEARCH article
Front. Med. , 18 March 2025
Sec. Gastroenterology
Volume 12 - 2025 | https://doi.org/10.3389/fmed.2025.1563889
This article is part of the Research Topic Chronic Atrophic Gastritis: Pathogenesis, Diagnostic Challenges, and Gastric Cancer Risk View all 3 articles
 Adriana Botezatu1
 Radu-Alexandru Farcas2*
 Simona Grad2
 Dan-Lucian Dumitrașcu2Nicolae Bodrug1
 Massimo Rugge3
Background: Gastric cancer is still an important public health problem. Efforts have been made to lower its prevalence globally. The Operative Link on Gastritis Assessment (OLGA) and operating link for gastric intestinal metaplasia (OLGIM) histological grading systems have been proposed to identify individuals with types of gastritis that have the potential to become malignant.
Aim of the study: Our study was conducted to assess the value of OLGA and OLGIM systems in the diagnosis of gastric precancerous lesions, in the Moldovan population.
Methods: In a prospective study, 142 consecutive patients with chronic atrophic gastritis (CAG) from a larger group of patients referred to upper gastrointestinal endoscopy for dyspeptic symptoms or gastric cancer screening was investigated. The sample was divided into three groups: (a) CAG without intestinal metaplasia and gastric dysplasia; (b) CAG with intestinal metaplasia; (c) CAG with gastric dysplasia according to the morphological type of the lesion. GastroPanel biomarkers were correlated with OLGA and OLGIM stages.
Results: There was a direct, moderate and statistically significant correlation between types of CAG and OLGA stages (p < 0.001), a direct, weak and statistically significant correlation between forms of chronic atrophic gastritis and OLGIM stages (p < 0.001). A statistically significant reduction in Pepsinogen I and the Pepsinogen-I/Pepsinogen-II ratio was observed alongside an increase in the stages of the OLGA and OLGIM systems.
Conclusion: OLGA and OLGIM systems are useful tools in diagnosing CAG. This is the first study assessing the use of this systems in the Moldovan population.
Chronic atrophic gastritis (CAG) is the elective stomach cancerization field; in gastric atrophic microenvironment, gastric dysplasia (GD) is the major precursor lesion of gastric cancer (GC). The grade (i.e., histological score) and the topography (antral versus oxyntic) of atrophic lesions consistently correlate with the GC risk. The combined endoscopy/histological assessment of these lesions may be confidently applied in clinical strategies for GC secondary prevention (1–3).
In 2005, an international group of gastroenterologists and pathologists developed and proposed a staging system for atrophic gastritis (OLGA - Operative Link on Gastritis Assessment). This system serves as “global” histological measure of the severity/extent of gastric atrophy and consistently correlate with the single patient GC risk (4–6). Based on the same clinico-pathological rationale, the OLGIM (Operative Link on Gastric Intestinal Metaplasia Assessments) system restricts the atrophy score only to intestinal metaplasia (7, 8).
Both the OLGA and OLGIM systems apply a five-tiered staging scale (0, I, II, III, IV) and reliably associate a significantly increased GC risk to stages III and IV (high-risk stages). This risk stratification enables the identification of the patients on whom GC secondary prevention strategies should be applied. By limiting the atrophy assessment only to its IM-component, the OLGIM system potentially exhibits lower sensitivity in detecting individuals at high risk of GC (7, 8).
The GastroPanel (GP) is a non-invasive diagnostic test relying on the combined serological detection of three gastric functional biomarkers (pepsinogen I [Pg I] pepsinogen II [Pg II], gastrin-17 [G17]), along with ELISA (IgG) testing for IgG anti-Hp antibodies. Over the past decade, GP has emerged as a valuable non-invasive test for diagnosing both AG and (current or previous) Helicobacter pylori (Hp) infection. Recent studies have demonstrated its efficacy as both an individual diagnostic tool and as a population screening and surveillance method (9–13).
This prospective study primarily aims to assess the prognostic value of the OLGA and OLGIM systems in a cohort of endoscopy patients recruited in the Republic of Moldova. The secondary aim of this study was to correlate GastroPanel values with the OLGA and OLGIM systems.
This study marks the initial evaluation of risk assessment tools within the Moldovan population.
Between 2018 and 2021, 1,150 patients underwent upper digestive endoscopy at the Department of Internal Medicine of the Nicolae Testemitanu State University of Medicine and Pharmacy of the Moldova Republic.
Eight hundred ninety-four patients were referred for dyspeptic symptoms, 201 for GC screening, and 55 due to a GC family history. One hundred seventy-three out of 894 patients were diagnosed with atrophic gastritis. Of those diagnosed, 142 met the inclusion criteria (described below) for this study. Following confirmation of eligibility, informed consent to be involved in the present study was obtained from all participants.
Inclusion criteria were: informed consent, previously confirmed CAG through morphological assessment, age 18 years or older, the diagnosis history less than 5 years. Exclusion criteria were: individuals under 18 years of age, those with malignant tumors, and those with severe systemic comorbidities impacting the course of the underlying disease such as central nervous system pathology, organic diseases of the endocrine glands, severe heart failure, severe hepatic dysfunction, severe renal dysfunction, severe lung dysfunction, hematological disorders, pregnant, lactating, and breastfeeding women were excluded, along with patients with severe coagulation disorders (INR > 3; platelets <30,000/mm3), active gastrointestinal bleeding, a history of gastric surgery, those who declined participation and did not provide informed consent.
Patients’ data were collected through a structured questionnaire, extraction from medical records, and analysis of results from initial and follow-up visits. A complete physical examination was performed and instrumental, and laboratory investigations were also conducted. The obtained findings were comparatively analyzed across all three study groups.
Blood was collected from the patients in fasting condition, after 12 h of fasting. Blood samples were immediately centrifuged at 4° C, obtaining 5 mL of serum (within 2 h of collection) at −70 ° C until testing (within 6 months). GastroPanel biomarkers (PG-I, PG-II, G-17 and Hp-IgG) were determined with commercial GastroPanel® enzyme immunoassays (Biohit Oyj, Finland) at the Eurolab Laboratory and Medical Center, Chisinau, Republic of Moldova, according to the manufacturer’s instructions, and the PGI:PGII was calculated.
The active Hp infection was assessed by histological evidence of Hp infection by Giemsa staining, (2) urease test and (3) HP-IgG antibodies. For the purpose of diagnosing CAG, upper gastrointestinal endoscopy and histopathological examination of the biopsy samples were performed.
To exclude inter-observer variability, Gastroscopies were performed by a single endoscopist with experience in NBI technique, on the Olympus® Evis Exera III endoscopic system, using a high-performance endoscope model GIF-HQ190 (Olympus Medical SysteCorp, Tokyo, Japan). All EGDs were performed with intravenous anesthetic support and spontaneous breathing (Atropine, Dormicum, and Propofol). In all patients, biopsy specimens were obtained from 12 standardized sites: 4 from the antrum, 4 from the corpus (2 from the lesser curvature and 2 from the greater curvature), 2 from the angulus, and 2 from the cardia. Additional biopsy samples were obtained from any focal lesion. All the biopsy specimens were identified according to their topography and submitted in separated vials (3, 14).
Endoscopic atrophic changes in the gastric body were diagnosed based on the discoloration of the atrophic area with the transparency of blood vessels. Gastric atrophy was endoscopically assessed based on the topography of the Kimura-Takemoto atrophic border. Four “major” endoscopic topographical phenotypes of atrophy have been considered: (a) C0 (i.e.: no atrophy); (b) C1-C2 (i.e.: mild atrophy); (c) C3-O1 (i.e.: moderate atrophy); (d) O2-O3 (i.e.: severe atrophy) (15, 16).
The histological assessment included: (a) lymphomonocytic and polymorphs ([PMN]; i.e.: “activity”) infiltrate in the lamina propria as well within the glandular lumen; (b) mucosal atrophy (OLGA including non-metaplastic and metaplastic components; OLGIM only including IM); (c) gastric dysplasia (low- and high-grade); (d) gastric cancer. The histology assessment grounded on internationally validated criteria (17, 18). Based on the histological score of the histological variables, all case were staged according to the current OLGA and OLGIM criteria; OLGA/OLGIM stages 0-I-II were considered low-risk GC stages; OLGA/OLGIM stages III-IV were considered as high-risk GC stages (1, 3, 14). Helicobacter pylori infection was histologically assessed based on hematoxylin–eosin and Giemsa (modified for H. pylori detection) stains.
All biopsy specimens were histologically assessed by two expert GI-pathologists.
Primary data processing was performed using the functions and modules of SPSS version 16.0 for Windows (SPSS Inc., Belmont, CA, United States, 2008) and Microsoft Office Excel 2019 on the personal computer through descriptive and inferential statistical procedures. To estimate the significant differences between the means of two groups, the t test for independent samples was used, and between the group means - the t test for pair-samples. For multiple comparisons (3 or more) we used the analysis of variance (One-Way ANOVA) with the application of post-hoc tests or the non-parametric Kruskal-Wallis test with the application of Bonferroni correction. Correlations were expressed by the rho Spearman coefficient. The 2 × 2 contingency chi-square χ2 test was used to compare categorical measures. A level of p < 0.05 was considered statistically significant.
The Ethics Committee at the Public Institution Nicolae Testemitanu State University of Medicine and Pharmacy, Chisinau of the Moldova Republic formally approved the study protocol (No. 38, dated June 17, 2019).
Based on the histology, the study sample included three sub-groups: Group 1: 51 cases featuring only non-metaplastic atrophy (i.e., no-IM); Group 2: 51 cases with atrophic IM-positive phenotype; Group 3: 40 cases with CAG and GD. At the time of enrollment, the socio-demographic characteristics (age, living environment, educational level, marital status, socio-professional category) were similar in patients from all three study groups. However, there was a tendency for age to increase as the severity of CAG progressed: the mean age in study group 1 was 54.94 ± 1.9 years, in study group 2 it was 57.39 ± 1.4 years, and in study group 3 it was 59.45 ± 1.7 years (p > 0.05). In all cases, an examination of the mucosa was performed under advanced imaging: HD-Near Focus-WLE-NBI +. Group 3, comprising 40 patients with CAG and GD, consisted of 1 patient with high-grade dysplasia and 39 patients with low-grade dysplasia. In the current cohort of 142 patients with CAG, Hp was positive in 113 (79.57%).
Analysis of the prevalence of OLGA system stages among patients in the study subgroups revealed significant differences. OLGA stage I was notably more common in study group 1 compared to study group 2 (29.4% vs. 13,7%, respectively; p < 0.001), and stage II OLGA was more prevalent in study group 1 (41.2% vs. 7.5%, respectively; p < 0.001) and study group 2 (58.8% vs. 7.5%, respectively; p < 0.01) compared to study group 3. Stage III OLGA was significantly more frequent in study group 3 compared to study group 1 (50.0% vs. 27.5%, respectively; p < 0.001) and study group 2 (50.0% vs. 27.5%, respectively; p < 0.01), while stage IV OLGA was more common in study group 3 compared to study group 1 (17.5% vs. 2.0%, respectively; p < 0.01) and study group 2 (17.5% vs. 0%, respectively; p < 0.01; Table 1).

Table 1. OLGA stages prevalence of in 141 patients with gastric atrophy.
Analysis of the distribution of OLGIM system stages among patients in the study subgroups revealed one statistically significant difference. OLGIM stage I was more prevalent in study group 2 compared to study group 3 (51.0% vs. 10.0%, respectively; p < 0.001; Table 2).
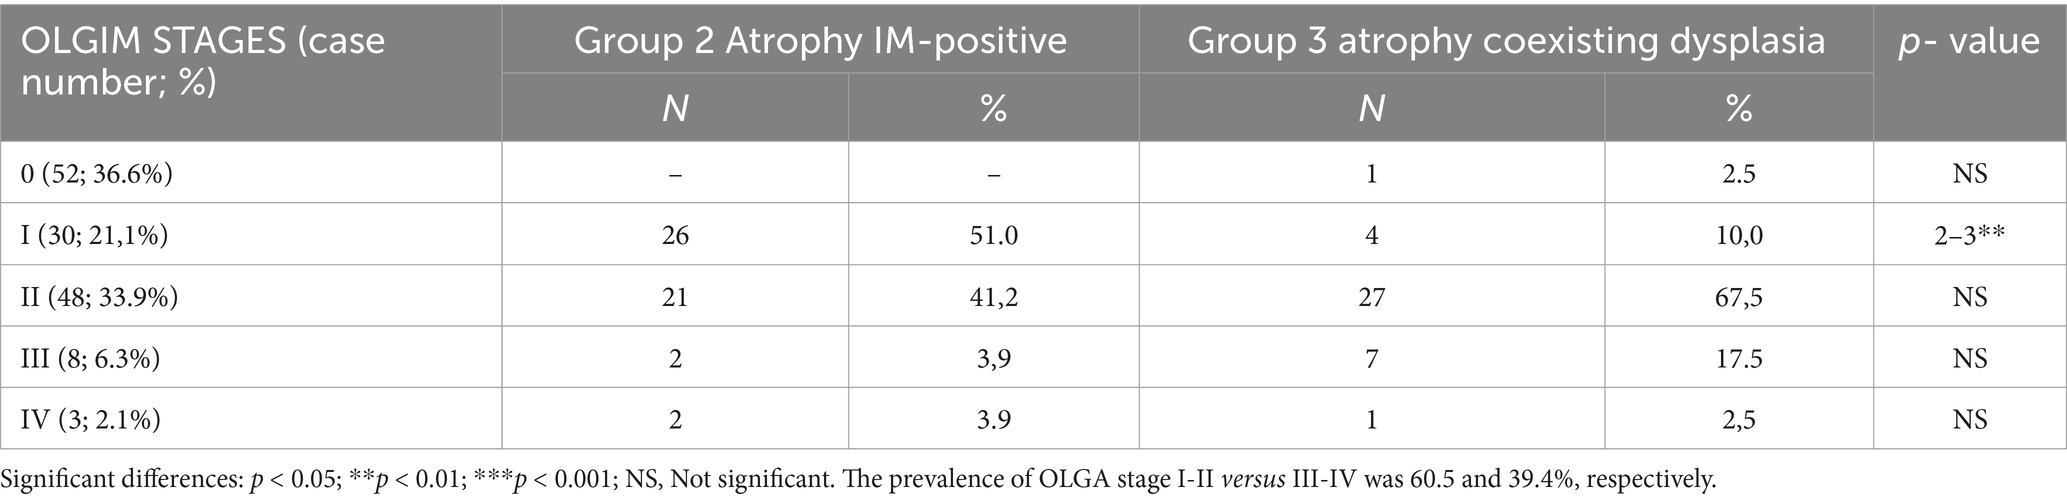
Table 2. Prevalence of OLGIM stages in patients with IM positive gastric atrophy.
The comparative analysis of OLGA stages with OLGIM stages in the general study group found that the vast majority of cases with low risk of developing GC according to the OLGA system (97.7%) coincided with cases with low risk of developing GC according to OLGIM system (Table 3).
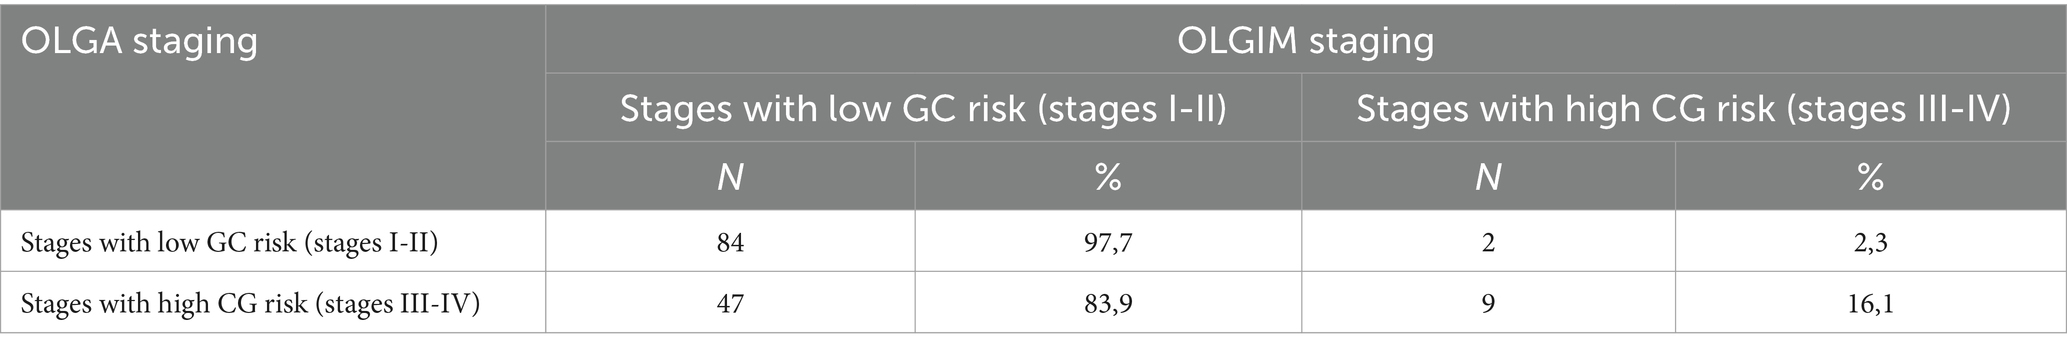
Table 3. Relationship between OLGA and OLGIM system stages in patients in the study group.
The χ2 Mantel–Haenszel test indicates a strong and statistically significant link (χ2 = 25.78, p < 0.001) between the results of the OLGA system and the results of the OLGIM system. The downgrade of high-risk OLGA stages to lower-risk OLGIM stages has been noted in other studies. For this reason, the assessment of gastric mucosal changes should include the assessment of all the phenotypical changes included in the atrophy spectrum of mucosal atrophy, and in patients with low OLGA, IM should be considered as a high-risk marker for GC (3).
Our findings demonstrate a significant decline in PG-I (p < 0.001) and PGI:PGII (p < 0.001) values coinciding with the worsening of CAG according to OLGA and OLGIM stages. Analyzing the serological parameters across the general study group based on OLGA system stages revealed a consistent and statistically significant decrease in PG-I (from 79.48 ± 3.8 μg/L in stage I to 47.39 ± 10.1 μg/L in stage IV) and PGI:PGII (from 6.58 ± 0.7 in stage I to 2.92 ± 0.2 in stage IV; Table 4). Similarly, analysis based on OLGIM system stages showed a successive and statistically significant reduction in PG-I (from 71.65 ± 3.6 μg/L in stage I to 39.88 ± 3.3 μg/L in stage IV) and PGI:PGII (from 5.77 ± 0.4 in stage I to 2.89 ± 0.4 in stage IV; Table 4). A moderate but statistically significant positive correlation was observed between forms of CAG and OLGA stages (ρ = 0.48, p < 0.001). Additionally, a strong and statistically significant direct correlation was found between CAG forms and OLGIM stages (ρ = 0.89; p < 0.001; Tables 5, 6.

Table 4. Serology findings (mean values) by OLGA and OLGIM staging systems.
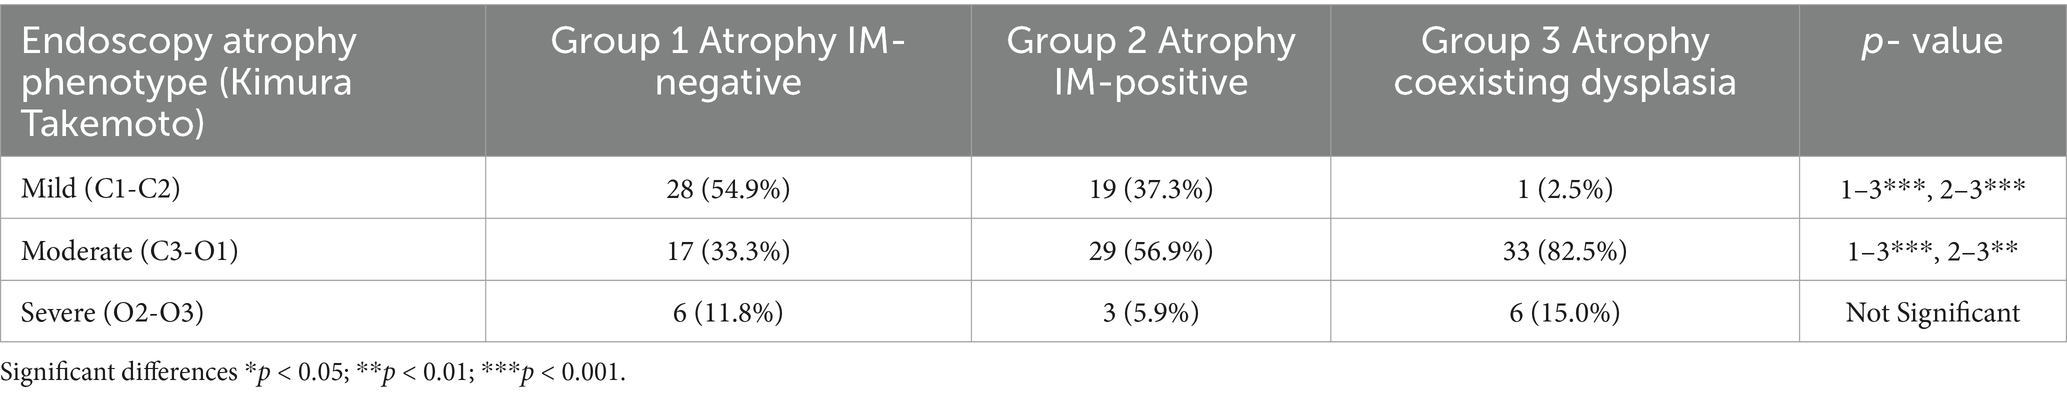
Table 5. Endoscopy atrophy phenotypes (according to Kimura-Takemoto) in the study sub-groups.
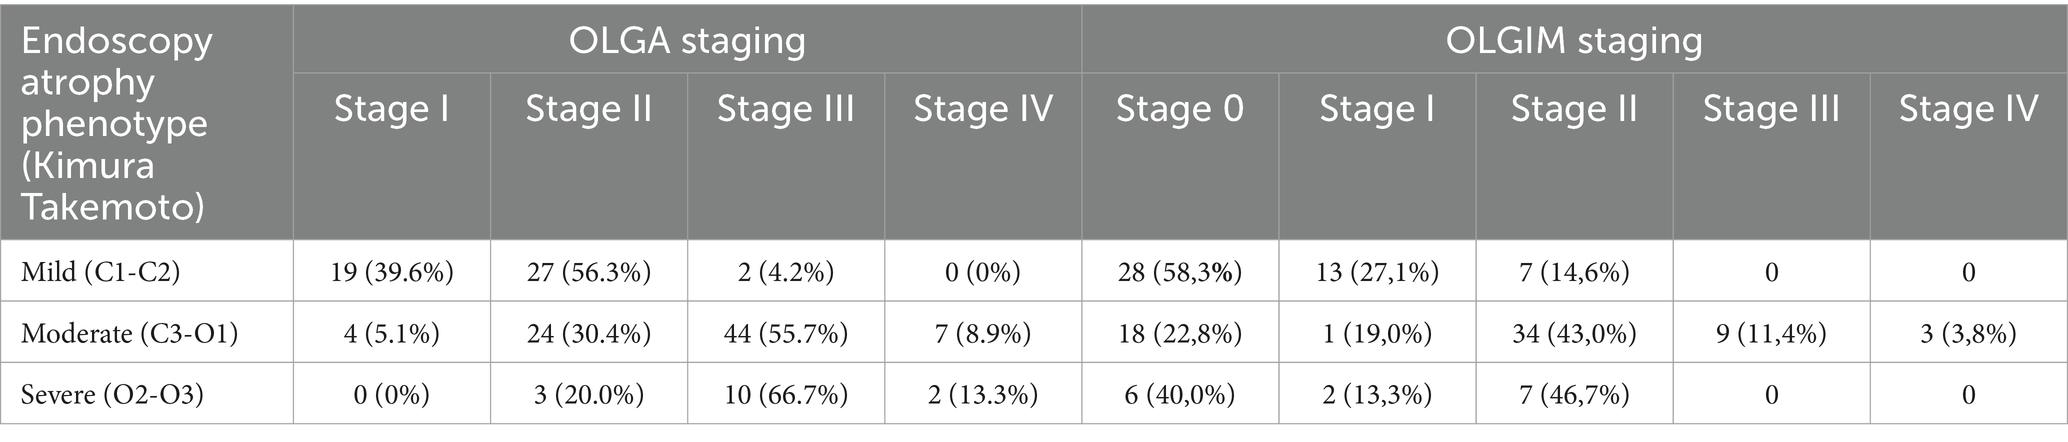
Table 6. Endoscopy findings (according to Kimura-Takemoto) and gastritis OLGA and OLGIM stages.
The analysis of the correlation between the severity of gastric mucosal damage in CAG, determined endoscopically or histologically, and the results of the serological examination, found that simultaneously with the increase in the severity of CAG, the values of PG-I and PGI:PGII decrease and the values of serum NO and NO in gastric juice increase. The aforementioned correlation analysis found an inverse association, of medium intensity and statistically significant, between GCA forms, determined endoscopically according to the Kimura-Takemoto classification, and PG-I values (ρ = −0.46, p < 0.001), an inverse correlation, of medium intensity and statistically significant between CAG forms and PGI:PGII values (ρ = −0.48, p < 0.001), a direct correlation of medium intensity and statistically significant between CAG forms and serum NO values (ρ = 0.32, p < 0.001), a weak and statistically significant direct correlation between CAG forms and gastric juice NO values (ρ = 0.19, p < 0.05).
An association was revealed between the severity of atrophy according to the Kimura-Takemoto classification from C1 to O3 and the values of PG-I (inverse correlation, medium intensity and statistically significant, ρ = −0.34, p < 0.001), PGI:PGII (inverse correlation, of medium intensity and statistically significant, ρ = −0.33, p < 0.001), serum NO (direct correlation, of weak intensity and statistically significant, ρ = 0.23, p < 0.001) and NO in gastric juice (correlation direct, of weak intensity and statistically significant, ρ = 0.13, p < 0.05).
Serum level of PG-I (62.42 ± 2.5 μg/L and 51.33 ± 3.8 μg/L, respectively; p < 0.05) and PGI:PGII (4.61 ± 0.2 and 3, 75 ± 0.4, respectively; p < 0.01) represented statistically significantly higher data in patients with closed type GCA compared to patients with open type CAG, and the difference in serum PG-II level (14.41 ± 0.4 μg/L and 15.41 ± 1.1 μg/L, respectively; p > 0.05) between these two groups did not reach statistical certainty.
A significant inverse association emerged between the 3 phenotypical sub-groups of atrophic gastritis (sub-groups 1, 2, and 3 of the present study) and PG-I values (ρ = −0.52, p < 0.001), an inverse, statistically significant correlation between CAG forms and PGI:PGII values was determined (ρ = −0.64, p < 0.001), a direct, statistically significant correlation between forms of CAG and serum NO values (ρ = 0.85, p < 0.001), a direct, medium intensity and statistically significant correlation between forms CAG and NO values in gastric juice (ρ = 0.65, p < 0.001).
An association was revealed between the atrophy severity classified according to Kimura-Takemoto from C1 to O3, and PG-I values (inverse correlation, moderate intensity, and statistically significant, ρ = −0.34, p < 0.001), as well as PGI:PGII values (inverse correlation, moderate intensity, and statistically significant, ρ = −0.33, p < 0.001; Table 7).
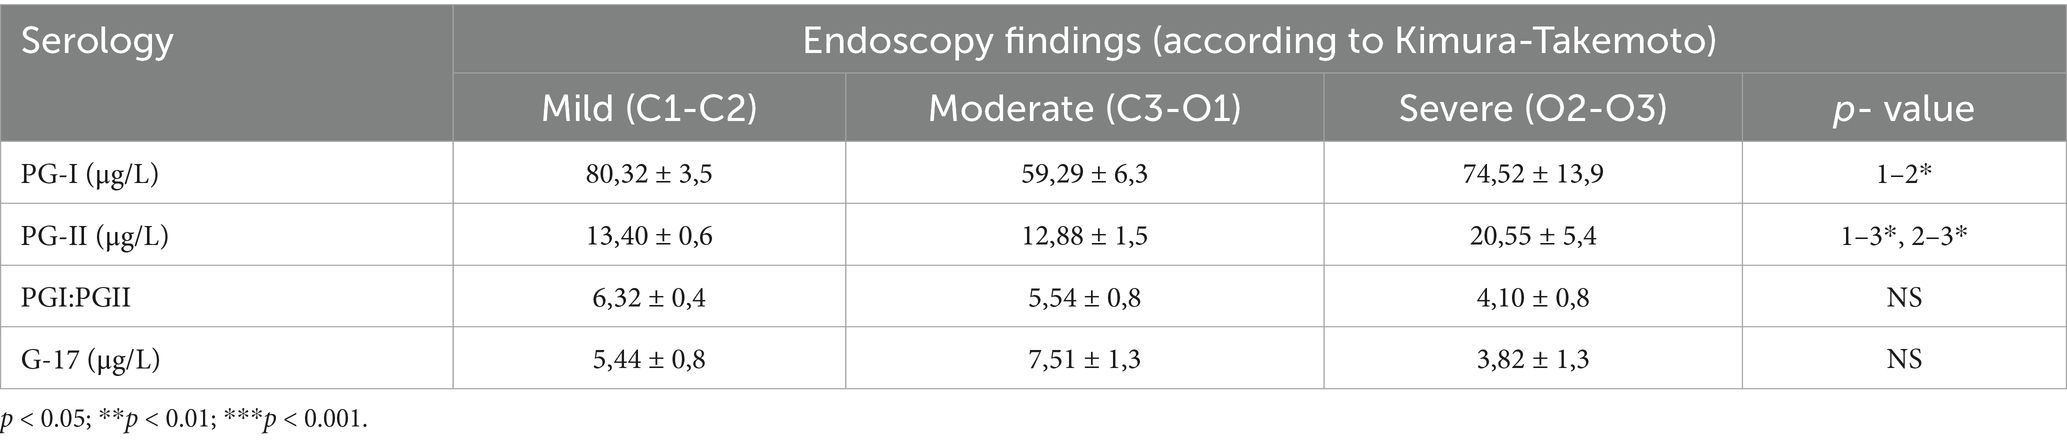
Table 7. Serological examination results based on the forms of gastric mucosal atrophy, according to the Kimura-Takemoto endoscopic classification, in patients from study subgroup 1 (atrophy).
Several studies have reported a consistent correlation between OLGA and OLGIM system stages and levels of PG-I and PGI:PGII. Serum mean PG-I and PGI:PGII values decrease significantly as OLGA and OLGIM stages increase (14, 19–25).
Another study from 2011, involving 269 patients with upper gastrointestinal symptoms and a mean age of 64.6 years, similarly observed a significant decrease in average PG-I values (from 82.1 μg/L in OLGA stage I to 64.3 μg/L in OLGA stage III-IV) and PGI:PGII (from 5.8 in OLGA stage I to 4.3 in OLGA stage III-IV). No correlations were found between PG-II and G-17 values with OLGA system stages (24).
In a 2017 study of 331 patients with upper gastrointestinal symptoms, with an average age of 53.1 years, researchers found a notable decrease in mean PG-I levels as the OLGA stages progressed. Specifically, PG-I levels dropped from 110.9 ± 47.5 μg/L in OLGA stage I to 66.6 ± 24.9 μg/L in OLGA stage IV. The PGI:PGII ratio also declined from 11.9 ± 3.7 in stage I to 5.7 ± 3.0 in stage IV. Our current study found similar trends using the OLGIM staging system, where mean PG-I levels decreased from 112.0 ± 51.2 μg/L in stage I to 92.8 ± 57.2 μg/L in stage IV, and the PGI:PGII ratio fell from 11.6 ± 4.9 to 6.7 ± 2.9 across the same stages (23).
The present study and analysis of serological parameters, based on OLGA system stages, showed a statistically significant decline in PG-I levels (from 79.48 ± 3.8 μg/L in stage I to 47.39 ± 10.1 μg/L in stage IV) and PGI:PGII values (from 6.58 ± 0.7 in stage I to 2.92 ± 0.2 in stage IV).
In the present study, we also performed a comparative analysis of OLGA stages and OLGIM stages. A similar study was recently performed by Lattore and al (26). One particularly that was found in our study group is that one patient was classified by the OLGA system in the low-risk category (stages I-II) and by the OLGIM system in the high-risk category (stages III-IV).
The frequency of diagnosing gastric atrophy based on serological parameters is influenced by the morphological type of gastric lesion. It decreases in patients with CAG without IM and GD but increases with the worsening morphological stages of CAG. A significant reduction in PG-I and PGI:PGII was observed alongside a significant increase in NO levels in blood serum and gastric juice with the advancement of OLGA and OLGIM stages. Serologically determined gastric atrophy is crucial for the non-invasive diagnosis and prognosis of CAG with IM and/or GD, both significant risk factors for gastric cancer development (23).
Although there is relatively good correlation among endoscopic, histological, and serological determinations of CAG, the sensitivity and specificity of these methods are not high, and histological diagnosis has its limitations. Hence, a multifactorial evaluation is necessary to enhance the accuracy of CAG diagnosis (23). For precise prediction of gastric cancer risk in clinical settings, CAG staging, including according to OLGA and OLGIM systems, should be combined with serum PG values (23).
In this study, we observed a notably high prevalence of dysplasia, with 40 out of 142 cases, which likely reflects an increased GC risk in the population studied. This elevated rate may be influenced by the regenerative changes associated with chronic HP infection. A further assessment by dysplasia grading was considered, but was deemed inappropriate due to the low number of patients with high-grade dysplasia (1).
The integration of the Kimura-Takemoto classification with GastroPanel biomarkers presents a promising approach to refining risk stratification for gastric cancer in patients with chronic atrophic gastritis. The Kimura-Takemoto system provides an endoscopic assessment of atrophic progression, distinguishing early (C1-C2) from advanced atrophy (C3-O3), while GastroPanel biomarkers—particularly low PG-I, a reduced PGI:PGII ratio, elevated G-17, and positive Helicobacter pylori serology—offer a complementary, non-invasive biochemical assessment of gastric mucosal health.
Patients classified as C3-O3 or demonstrating abnormal GastroPanel biomarker profiles should be considered high-risk for gastric cancer, aligning with OLGA/OLGIM stage III-IV classifications, which have been strongly associated with progression to intestinal-type gastric carcinoma. This raises a pertinent question regarding the necessity and extent of biopsy sampling in this cohort. Rather than performing extensive random biopsies, which may not significantly enhance diagnostic yield and could lead to unnecessary procedural burden, a targeted biopsy strategy may be more appropriate.
Specifically, biopsies should be directed toward regions with visible mucosal abnormalities, including areas of advanced atrophy, metaplasia, and dysplasia, as well as those showing irregularity in endoscopic texture and coloration. This targeted approach is consistent with the current paradigm shift in gastric cancer screening, which emphasizes precision and efficiency in surveillance. This approach was also described by other authors (27, 28).
Future studies should evaluate the effectiveness of this combined risk stratification model in guiding endoscopic biopsy protocols, optimizing diagnostic accuracy, and improving cost-effectiveness. If validated, this model could reduce unnecessary biopsies while ensuring early detection of high-risk lesions, ultimately contributing to better patient outcomes.
The study should be continued in the future in a longitudinal design, to assess the occurrence of gastric cancer in this cohort.
To our knowledge, this is the first application of OLGA and OLGIM staging in Moldovan patients. It validates the utility of these systems in Republic of Moldova.
Gastric cancer is among the five most lethal epithelial malignancies. The OLGA and OLGIM staging systems categorize gastritis patients into five stages, each associated with significant differences in cancer progression. While both systems are reliable and effective for identifying individuals at higher risk of GC, their widespread use is still limited. Integrating the OLGA and OLGIM systems into real-world clinical practice could improve efforts in the secondary cancer prevention. This strategy may lead to a significant decrease in the incidence of invasive neoplastic disease and related mortality rates. This study applied gastritis staging to Moldovan gastritis patients. In this high-risk population, the study further supported the efficiency of gastritis staging in secondary GC prevention.
The raw data supporting the conclusions of this article will be made available by the authors, without undue reservation.
The studies involving humans were approved by The Ethics Committee at the Public Institution Nicolae Testemitanu State University of Medicine and Pharmacy, Chisinau of the Moldova Republic (No. 38, dated June 17, 2019). The studies were conducted in accordance with the local legislation and institutional requirements. The participants provided their written informed consent to participate in this study.
AB: Conceptualization, Data curation, Formal analysis, Funding acquisition, Investigation, Methodology, Project administration, Writing – original draft, Writing – review & editing. R-AF: Project administration, Software, Supervision, Validation, Writing – original draft, Writing – review & editing. SG: Project administration, Resources, Supervision, Validation, Writing – review & editing. D-LD: Project administration, Resources, Software, Supervision, Validation, Visualization, Writing – review & editing. NB: Conceptualization, Data curation, Formal analysis, Funding acquisition, Investigation, Methodology, Project administration, Writing – original draft. MR: Project administration, Resources, Supervision, Validation, Visualization, Writing – review & editing.
The author(s) declare that no financial support was received for the research and/or publication of this article.
The authors declare that the research was conducted in the absence of any commercial or financial relationships that could be construed as a potential conflict of interest.
The authors declare that no Gen AI was used in the creation of this manuscript.
All claims expressed in this article are solely those of the authors and do not necessarily represent those of their affiliated organizations, or those of the publisher, the editors and the reviewers. Any product that may be evaluated in this article, or claim that may be made by its manufacturer, is not guaranteed or endorsed by the publisher.
1. Rugge, M, Meggio, A, Pennelli, G, Piscioli, F, Giacomelli, L, De Pretis, G, et al. Gastritis staging in clinical practice: the OLGA staging system. Gut. (2007) 56:631–6. doi: 10.1136/gut.2006.106666
2. Pimentel-Nunes, P, Pioche, M, Albeniz, E, Berr, F, Deprez, P, Ebigbo, A, et al. Curriculum for endoscopic submucosal dissection training in Europe: European Society of Gastrointestinal Endoscopy (ESGE) position statement. Endoscopy. (2019) 51:980–92. doi: 10.1055/a-0996-0912
3. Botezatu, A, and Bodrug, N. Chronic atrophic gastritis: an update on diagnosis. Med Pharm Rep. (2021) 94:7–14. doi: 10.15386/mpr-1887.33629042
4. Piciu, A, Gheban, D, and Dumitrașcu, D. Valoarea diagnostică și prognostică a clasificării “OLGA” a gastritelor cronice. Med Intern. (2016) 13:49–54.
5. Lahner, E, Zagari, RM, Zullo, A, Di Sabatino, A, Meggio, A, Cesaro, P, et al. Chronic atrophic gastritis: natural history, diagnosis and therapeutic management. A position paper by the Italian Society of Hospital Gastroenterologists and Digestive Endoscopists [AIGO], the Italian Society of Digestive Endoscopy [SIED], the Italian Society of Gastroenterology [SIGE], and the Italian Society of Internal Medicine [SIMI]. Dig Liver Dis. (2019) 51:1621–32. doi: 10.1016/j.dld.2019.09.016
6. Crafa, P, Russo, M, Miraglia, C, Barchi, A, Moccia, F, Nouvenne, A, et al. From Sidney to OLGA: an overview of atrophic gastritis. Acta Biomed. (2018) 89:93–9. doi: 10.23750/abm.v89i8-S.7946
7. Capelle, LG, de Vries, AC, Haringsma, J, Ter Borg, F, de Vries, RA, Bruno, MJ, et al. The staging of gastritis with the OLGA system by using intestinal metaplasia as an accurate alternative for atrophic gastritis. Gastrointest Endosc. (2010) 71:1150–8. doi: 10.1016/j.gie.2009.12.029
8. Rugge, M, Fassan, M, Pizzi, M, Farinati, F, Sturniolo, GC, Plebani, M, et al. Operative link for gastritis assessment vs operative link on intestinal metaplasia assessment. World J Gastroenterol. (2011) 17:4596–601. doi: 10.3748/wjg.v17.i41.4596
9. Väänänen, H, Vauhkonen, M, Helske, T, Kääriäinen, I, Rasmussen, M, Tunturi-Hihnala, H, et al. Non-endoscopic diagnosis of atrophic gastritis with a blood test. Correlation between gastric histology and serum levels of gastrin-17 and pepsinogen I: a multicentre study. Eur J Gastroenterol Hepatol. (2003) 15:885–91. doi: 10.1097/00042737-200308000-00009
10. McNicholl, AG, Valle, J, and Gisbert, JP. Response to: accuracy of GastroPanel test in detection of atrophic gastritis. Eur J Gastroenterol Hepatol. (2015) 27:105–6. doi: 10.1097/MEG.0000000000000257
11. Syrjänen, K. A panel of serum biomarkers (GastroPanel®) in non-invasive diagnosis of atrophic gastritis. Systematic review and meta-analysis. Anticancer Res. (2016) 36:5133–44. doi: 10.21873/anticanres.11083
12. Grad, C, Pop, A, Gaborean, E, Grad, S, and Dumitrascu, D. Value of GastroPanel in the diagnosis of atrophic gastritis. Exp Ther Med. (2021) 22:1347. doi: 10.3892/etm.2021.10782
13. Loor, A, and Dumitraşcu, DL. Helicobacter pylori infection, gastric Cancer and Gastropanel. Rom J Intern Med. (2016) 54:151–6. doi: 10.1515/rjim-2016-0025
14. Yun, C, Kim, N, Lee, J, Lee, J, Hwang, Y, Lee, H, et al. Usefulness of OLGA and OLGIM system not only for intestinal type but also for diffuse type of gastric cancer, and no interaction among the gastric cancer risk factors. Helicobacter. (2018) 23:e12542. doi: 10.1111/hel.12542
15. Kimura, K, and Takemoto, T. An endoscopic recognition of the atrophic border and its significance in chronic gastritis. Endoscopy. (1969) 1:87–97. doi: 10.1055/s-0028-1098086
16. Take, S, Mizuno, M, Ishiki, K, Kusumoto, C, Imada, T, Hamada, F, et al. Risk of gastric cancer in the second decade of follow-up after Helicobacter pylori eradication. J Gastroenterol. (2020) 55:281–8. doi: 10.1007/s00535-019-01639-w
17. Rugge, M, Pennelli, G, Pilozzi, E, Fassan, M, Ingravallo, G, Russo, VM, et al. Gastritis: the histology report. Dig Liver Dis. (2011) 43:S373–84. doi: 10.1016/S1590-8658(11)60593-8
18. Nagtegaal, ID, Odze, RD, Klimstra, D, Paradis, V, Rugge, M, Schirmacher, P, et al. The 2019 WHO classification of tumours of the digestive system. Histopathology. (2020) 76:182–8. doi: 10.1111/his.13975
19. Dinis-Ribeiro, M, Areia, M, de Vries, A, Marcos-Pinto, R, Monteiro-Soares, M, O’Connor, A, et al. Management of precancerous conditions and lesions in the stomach (MAPS): guideline from the European Society of Gastrointestinal Endoscopy (ESGE), European Helicobacter study group (EHSG), European Society of Pathology (ESP), and the Sociedade Portuguesa de Endoscopia Digestiva (SPED). Endoscopy. (2012) 44:74–94. doi: 10.1055/s-0031-1291491
20. Huang, Y, Yu, J, Kang, W, Ma, Z, Ye, X, Tian, S, et al. Significance of serum pepsinogens as a biomarker for gastric Cancer and atrophic gastritis screening: a systematic review and Meta-analysis. PLoS One. (2015) 10:e0142080. doi: 10.1371/journal.pone.0142080
21. Banks, M, Graham, D, Jansen, M, Gotoda, T, Coda, S, di Pietro, M, et al. British Society of Gastroenterology guidelines on the diagnosis and management of patients at risk of gastric adenocarcinoma. Gut. (2019) 68:1545–75. doi: 10.1136/gutjnl-2018-318126
22. Bang, CS, Lee, JJ, and Baik, GH. Prediction of chronic atrophic gastritis and gastric neoplasms by serum pepsinogen assay: a systematic review and Meta-analysis of diagnostic test accuracy. J Clin Med. (2019) 8:E657. doi: 10.3390/jcm8050657
23. Wang, X, Lu, B, Meng, L, Fan, Y, Zhang, S, and Li, M. The correlation between histological gastritis staging - 'OLGA/OLGIM' and serum pepsinogen test in assessment of gastric atrophy/intestinal metaplasia in China. Scand J Gastroenterol. (2017) 52:822–7. doi: 10.1080/00365521.2017.1315739
24. Daugule, I, Sudraba, A, Chiu, H, Funka, K, Ivanauskas, A, Janciauskas, D, et al. Gastric plasma biomarkers and operative link for gastritis assessment gastritis stage. Eur J Gastroenterol Hepatol. (2011) 23:302–7. doi: 10.1097/MEG.0b013e3283438ac3
25. Mescoli, C, Gallo, LA, Taxa, RL, Jove, OW, Fassan, M, and Rugge, M. Gastritis staging as a clinical priority. Eur J Gastroenterol Hepatol. (2018) 30:125–9. doi: 10.1097/MEG.0000000000001015
26. Latorre, G, Silva, F, Montero, I, Bustamante, M, Dukes, E, Uribe, J, et al. Comparison of OLGA and OLGIM as predictors of gastric cancer in a Latin American population: the ECHOS study. Gut. (2023) 73:e18. doi: 10.1136/gutjnl-2023-331059
27. Quach, DT, Hiyama, T, Le, HM, Nguyen, TS, and Gotoda, T. Use of endoscopic assessment of gastric atrophy for gastric cancer risk stratification to reduce the need for gastric mapping. Scand J Gastroenterol. (2020) 55:402–7. doi: 10.1080/00365521.2020.1740777
Keywords: chronic atrophic gastritis, intestinal metaplasia, OLGA/OLGIM, gastric cancer, gastric dysplasia
Citation: Botezatu A, Farcas R-A, Grad S, Dumitrașcu D-L, Bodrug N and Rugge M (2025) Assessing gastric cancer risk using the OLGA and OLGIM systems in Republic of Moldova. Front. Med. 12:1563889. doi: 10.3389/fmed.2025.1563889
Edited by:
Ciro Celsa, University of Palermo, ItalyReviewed by:
Peiqiang Yan, Harvard Medical School, United StatesCopyright © 2025 Botezatu, Farcas, Grad, Dumitrașcu, Bodrug and Rugge. This is an open-access article distributed under the terms of the Creative Commons Attribution License (CC BY). The use, distribution or reproduction in other forums is permitted, provided the original author(s) and the copyright owner(s) are credited and that the original publication in this journal is cited, in accordance with accepted academic practice. No use, distribution or reproduction is permitted which does not comply with these terms.
*Correspondence: Radu-Alexandru Farcas, cmFkdWZyQGdtYWlsLmNvbQ==
Disclaimer: All claims expressed in this article are solely those of the authors and do not necessarily represent those of their affiliated organizations, or those of the publisher, the editors and the reviewers. Any product that may be evaluated in this article or claim that may be made by its manufacturer is not guaranteed or endorsed by the publisher.
Research integrity at Frontiers
Learn more about the work of our research integrity team to safeguard the quality of each article we publish.