 Caio César Souza Conceição1
 Camila Marinelli Martins2
 Mayck Medeiros Silva1Hugo Caire de Castro Faria Neto3Davide Chiumello4,5,6Patricia Rieken Macedo Rocco1
 Fernanda Ferreira Cruz1
 Pedro Leme Silva1*
- 1Laboratory of Pulmonary Investigation, Institute of Biophysics Carlos Chagas Filho, Federal University of Rio de Janeiro, Rio de Janeiro, Brazil
- 2AAC&T Research Consulting LTDA, Curitiba, Brazil
- 3Laboratory of Immunopharmacology, Oswaldo Cruz Institute (Fiocruz), Rio de Janeiro, Brazil
- 4Department of Health Sciences, University of Milan, Milan, Italy
- 5Anaesthesia and Intensive Care, San Paolo University Hospital, Milan, Italy
- 6Coordinated Research Center on Respiratory Failure, University of Milan, Milan, Italy
Background: Predicting clinical improvement after hospital admission in patients with COVID-19 is crucial for effective resource allocation. Machine-learning tools can help identify patients likely to show clinical improvement based on real-world data. This study used two approaches—least absolute shrinkage and selection operator (LASSO) and CombiROC—to identify predictive variables at hospital admission for detecting clinical improvement after 7 days.
Methods: A secondary analysis was conducted on the modified intention-to-treat placebo group from a previous randomized clinical trial (RCT, NCT04561219) of patients with COVID-19. The analysis assessed clinical, laboratory, and blood markers at admission to predict clinical improvement, defined as a two-point increase on the World Health Organization clinical progression scale after 7 days. LASSO and CombiROC were used to select optimal predictive variables. The Youden criteria identified the best threshold for different variable combinations, which were then compared based on the highest area under the curve (AUC) and accuracy. AUCs were compared using DeLong’s algorithm.
Results: Overall, 203 patients were included in the analysis, and they were divided into two groups; clinical improvement (n = 154) and no clinical improvement (n = 49). The median age was 55 years (interquartile range, 46–66 years); 65% were male. LASSO identified three predictive variables (SaO2, hematocrit, and interleukin [IL]-13) with high sensitivity of 98% (95% confidence interval [CI], 92–100%) but low specificity of 26% (95% CI, 10–48%) for clinical improvement. CombiROC selected a broader set of variables (T cell–attracting chemokine, hemoglobin, hepatocyte growth factor, hematocrit, IL-3, PDGF-BB, RANTES, and SaO2), achieving balanced sensitivity of 82% (95% CI, 69–91%) and specificity of 74% (95% CI, 49–91%). LASSO and CombiROC showed comparable accuracy (82 and 80%, respectively) and similar area under the ROC curves (LASSO: AUC, 0.704; 95% CI, 0.571–0.837; CombiROC: AUC, 0.823; 95% CI, 0.708–0.937; p = 0.185).
Conclusion: For patients hospitalized with COVID-19 pneumonia, predictive variables identified by LASSO and CombiROC analyses demonstrated similar accuracy and AUCs in predicting clinical improvement. LASSO, with fewer variables (SaO2, hematocrit, and IL-13) showed high sensitivity but low specificity, whereas CombiROC’s broader selection of variables provided balanced sensitivity and specificity for predicting clinical improvement.
Clinical trial registration: Brazilian Registry of Clinical Trials (REBEC) number RBR-88bs9x and ClinicalTrials.gov number NCT04561219.
1 Introduction
The COVID-19 pandemic reshaped thinking around prevention and treatment strategies for emerging diseases, as well as approaches to health resource allocation (1). In most cases, the symptoms of COVID-19 are mild and improve within days, but a small subgroup of patients develop severe disease, marked by significant multi-organ dysfunction (2). Predicting whether a patient will progress to clinical improvement or deterioration can help with the allocation of equipment and human resources; however, advances in this field have been modest. Worldwide, clinicians and researchers have been developing prognostic tools, including risk scores, biomarker screening, and machine-learning models, to better predict the clinical course of COVID-19 and the outcomes (3, 4). Despite the promise of artificial intelligence (AI) in this domain, appropriate statistical comparisons between different predictive methods are still lacking (5).
Working with numerous predictive variables is challenging with traditional analyses when seeking robust predictions. In this context, least absolute shrinkage and selection operator (LASSO) regression has emerged as a tool for predicting outcomes in patients with COVID-19 (4, 6–10). A key advantage of LASSO is its capacity to reduce the number of explanatory variables in a model and to address multicollinearity within the data (11). Another approach, CombiROC, offers a flexible method for managing complex data in discriminative analyses (12). A key advantage of CombiROC is the combinatorial analysis and ROC curves. Both methods have been used in medicine and other areas for many decades, but they generally lack an easy-to-use interface that researchers without programming skills can use to analyze data and create plots. With CombiROC, it is possible to select the combinations of optimal markers and obtain immediate visual feedback, such as graphs and ROC curves, through a simple and interactive, yet statistically rigorous, workflow (12). CombiROC was initially developed to refine marker combinations from diverse omics data and has since been applied to other outcomes, such as the detection of lung overload (13), plasma biomarkers (14), and gene markers (15). CombiROC was recently applied in COVID-19 research to improve classification by optimizing biomarker combinations (16). However, to date, no study has used CombiROC to identify the best combinations of variables to predict clinical improvement in COVID-19. Moreover, a direct comparison of CombiROC with machine-learning methods such as LASSO has yet to be performed. Therefore, this study aimed to compare LASSO and CombiROC approaches for selecting predictive variables at hospital admission that detect clinical improvement after 7 days in patients with COVID-19.
2 Methods
2.1 Study design
This study is a secondary cross-sectional analysis of the placebo group in a previous randomized clinical trial (RCT) (17) involving patients with COVID-19. The analysis aimed to identify clinical, laboratory, and blood markers at hospital admission that predict clinical improvement after 7 days. Clinical improvement was defined as a 2-point or greater increase on the World Health Organization (WHO) clinical progression scale. Two methods were used for the analysis: LASSO (11) and CombiROC (12). The study adheres to the Declaration of Helsinki and was approved by the Brazilian National Commission for Research Ethics (CAAE: 30662420.0.1001.0008) and the individual Ethics Committees of all participating sites. This trial is registered with the Brazilian Registry of Clinical Trials (REBEC: RBR-88bs9x) and ClinicalTrials.gov (NCT04561219), registration date April 19, 2020. The study design and reporting follow the STROBE guidelines (18). The data were assessed retrospectively on May 17, 2023, and the authors did not have access to information that could identify individual participants after data collection.
2.2 Patients
The analysis included consecutive patients with COVID-19 pneumonia admitted to 19 hospitals in Brazil from April 20 to October 15, 2020. Inclusion criteria were as follows: adult patients (≥18 years) requiring supplemental oxygen (SpO2 < 93%), admitted with COVID-19 symptoms, chest computed tomography findings suggestive of viral pneumonia, or a positive reverse transcriptase-polymerase chain reaction test for SARS-CoV-2. Available clinical, laboratory, and blood marker data were collected. Exclusion criteria were a history of severe liver disease, chronic kidney disease with estimated glomerular filtration rate <30 ml/min/1.73 m2, severe heart failure (New York Heart Association classes 3 and 4), severe chronic obstructive pulmonary disease (GOLD classes 3 and 4), cancer within the last 5 years, known autoimmune disease, or clinical suspicion of tuberculosis or bacterial pneumonia.
2.3 Data sources/measurements
2.3.1 Demographic, clinical, and laboratory data at hospital admission
Demographic data (age and sex), clinical data (temperature, respiratory rate, heart rate, SpO2), and laboratory markers (hematocrit, hemoglobin, leukocytes, neutrophils, lymphocytes, platelets, C-reactive protein, ferritin, lactate dehydrogenase, troponin, and D-dimer) at admission were collected.
2.3.2 Blood biomarkers at hospital admission
Blood samples were taken at admission, labeled with each patient’s unique identifier, and analyzed in local laboratories. Blood biomarkers were analyzed using a 48-plex cytokine screening panel (Bio-Plex Pro Human Cytokine Screening Panel, 48-Plex). The following mediators were analyzed: basic fibroblast growth factor, eotaxin, granulocyte colony-stimulating factor, granulocyte-macrophage colony-stimulating factor, interferon (IFN)-γ, interleukin (IL)-1β, IL-1ra, IL-1α, IL-2Rα, IL-3, IL-12 (p40), IL-16, IL-2, IL-4, IL-5, IL-6, IL-7, IL-8, IL-9, growth-related oncogene alpha, hepatocyte growth factor (HGF), IFN-α2, leukemia inhibitory factor, monocyte chemotactic protein (MCP)-3, IL-10, IL-12 (p70), IL-13, IL-15, IL-17A, IP-10, MCP-1, monokine induced by IFN-γ, nerve growth factor-β, stem cell factor, stem cell growth factor-β, stromal cell-derived factor-1α, macrophage inflammatory protein-1α and-1β, platelet-derived growth factor (PDGF)-BB, RANTES (regulated upon activation, normal T cell expressed and secreted), tumor necrosis factor (TNF)-α, vascular endothelial growth factor, T cell–attracting chemokine (CTACK), macrophage migration inhibitory factor, TNF-related apoptosis-inducing ligand, IL-18, macrophage colony-stimulating factor, and TNF-β.
2.4 Outcome variable
The outcome variable was clinical improvement at 7 days, defined as an increase of at least two points on the WHO scale (17).
2.5 Statistical analysis
No formal sample size calculation was conducted given the exploratory nature of the study. All data meeting the inclusion criteria were analyzed. Descriptive statistics (mean ± standard deviation or median with interquartile range) were used for clinical, laboratory, and blood biomarker data, classified into groups with and without clinical improvement. The Shapiro–Wilk test assessed normality between groups. Parametric variables were analyzed using Student’s t test, and non-parametric variables were analyzed with the Mann–Whitney test.
Predictor selection for LASSO and CombiROC analysis was based on variables with less than 25% missing data and statistical significance in bivariate analysis. LASSO regression was used to shrink less informative predictors toward zero, enhancing model interpretability and handling multicollinearity (11). The LASSO method penalizes the beta estimation algorithm, pushing parameter estimates toward zero or exactly zero. This results in a simpler model that retains only the most important variables, making interpretation and analysis easier. This technique is particularly useful for reducing the number of explanatory variables in a model and addressing the issue of multicollinearity in data (19, 20). CombiROC (12) was used to evaluate various combinations of receiver operating characteristic (ROC) curves to identify the optimal biomarker combination for predicting clinical improvement. Furthermore, the combi function of the combiroc package calculates marker combinations and counts the positive samples for each class of the dependent variable based on a predefined threshold. A sample is considered positive for a given combination if its value exceeds the threshold for at least a specified number of markers within that combination. The threshold value is determined based on the recommendation of the markers distribution function, which corresponds to the threshold associated with the highest Youden Index (21). The code for the CombiROC and LASSO analysis, written in the R environment, is given in the Supplementary files.
Due to differing distributions among blood markers, data were normalized using the rescale function in the “scales” package (22). The optimal threshold for different biomarker combinations was selected using the Youden Index. ROC areas were compared with DeLong’s algorithm (23), using the roc.test function from the “pROC” package (24). Statistical significance was set at p < 0.05. All analyses were performed in the R 4.0.4 environment (22).
3 Results
A total of 203 patients were included in the analysis (Figure 1), divided into two groups: clinical improvement (n = 154) and no clinical improvement (n = 49). The median age of patients in the intensive care unit was 55 years (interquartile range, 46–66 years); 65% were male. Patients in the clinical improvement group were generally older and had a lower respiratory rate (RR) but a higher level of oxygen saturation (SaO2), hematocrit, hemoglobin, platelets, IL-1ra, IL-13, RANTES, HGF, PDGF-BB, and CTACK compared with the no clinical improvement group (Table 1).
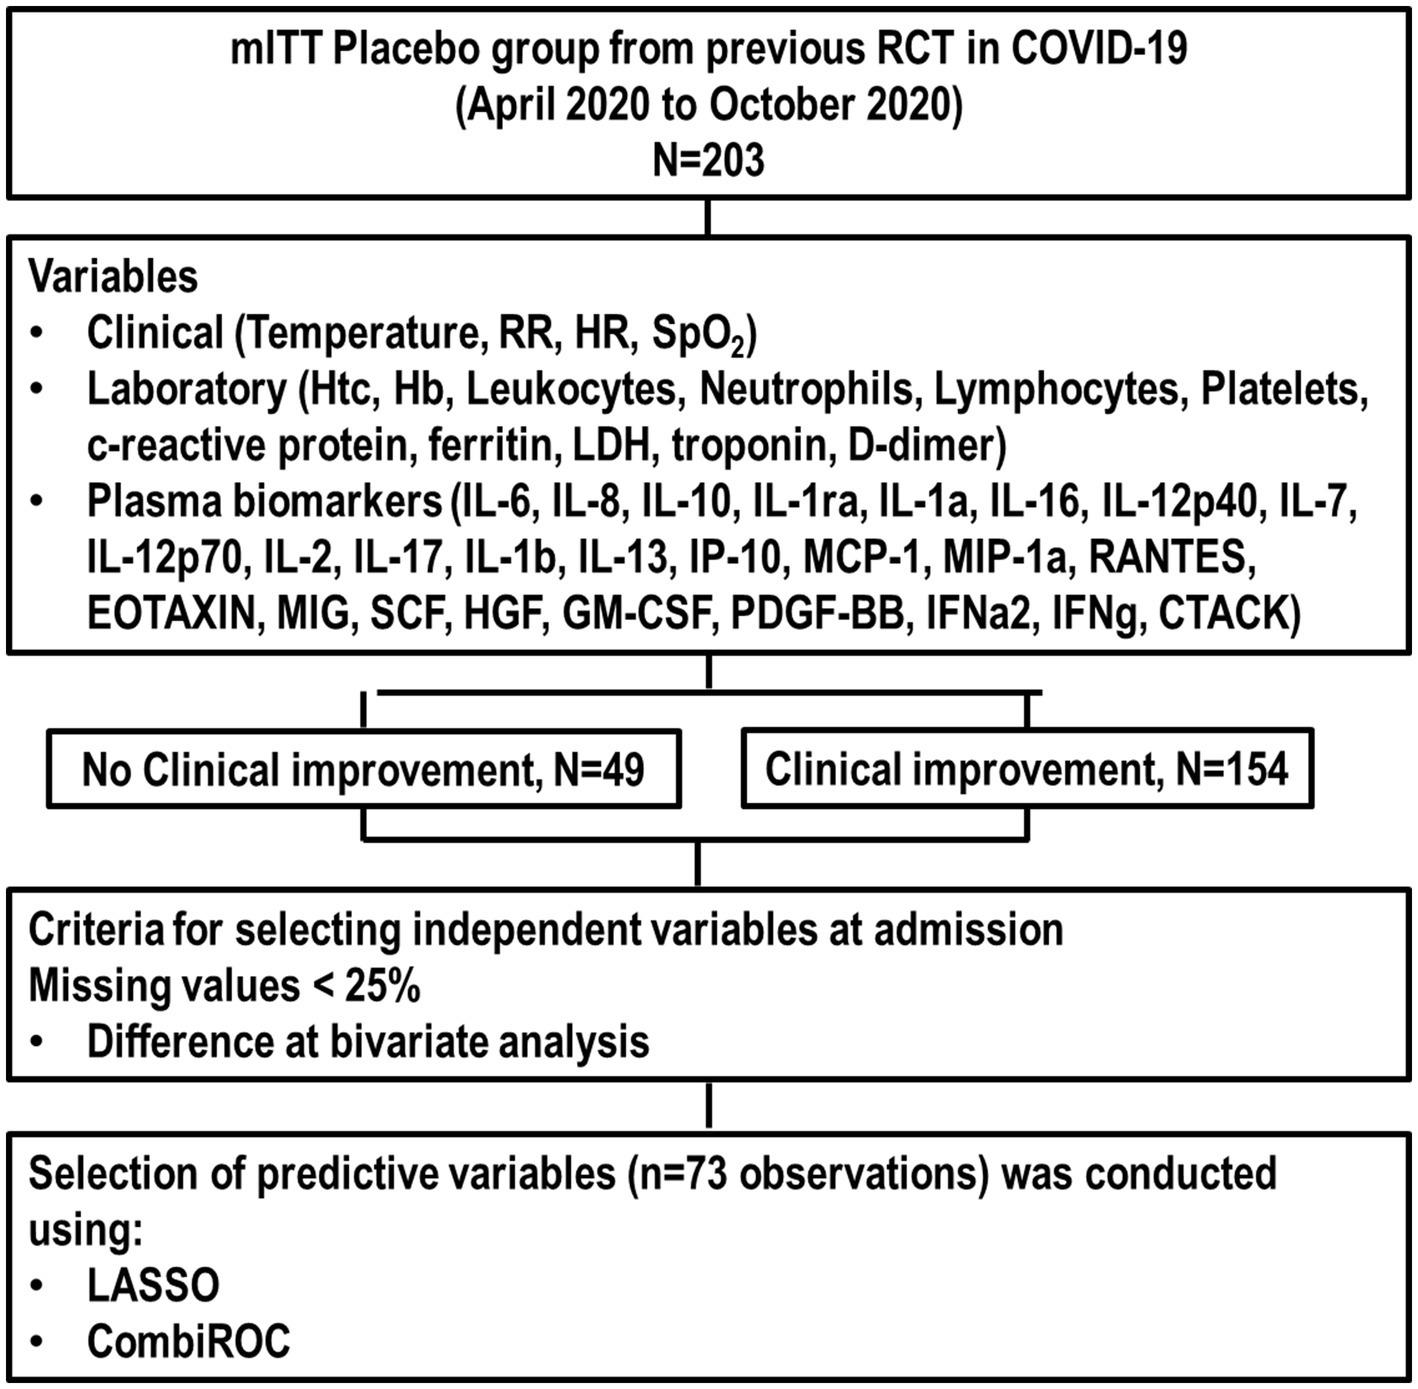
Figure 1. Flowchart of the study. CTACK, T cell–attracting chemokine; GM-CSF, granulocyte-macrophage colony-stimulating factor; Hb, hemoglobin; HGF, hepatocyte growth factor; HR, heart rate; Htc, hematocrit; IFN, interferon; IL, interleukin; LDH, lactate dehydrogenase; MCP, monocyte chemotactic protein; MIG, monokine induced by IFN-γ; MIP, macrophage inflammatory protein; mITT, modified intention-to-treat; PDGF, platelet-derived growth factor; RCT, randomized clinical trial; RR, respiratory rate; SCF, stem cell factor.

Table 1. Characteristics of the population at hospital admission.
After applying the selection criteria (missing values <25% and significant differences in bivariate analysis), predictive variables were age, RR, SaO2, hematocrit, hemoglobin, platelets, IL-1ra, IL-13, RANTES, HGF, PDGF-BB, and CTACK across 73 observations. The individual predictive performance metrics (sensitivity, specificity, accuracy, and odds ratio [OR]) of these variables predicting clinical improvement are presented in Table 2.
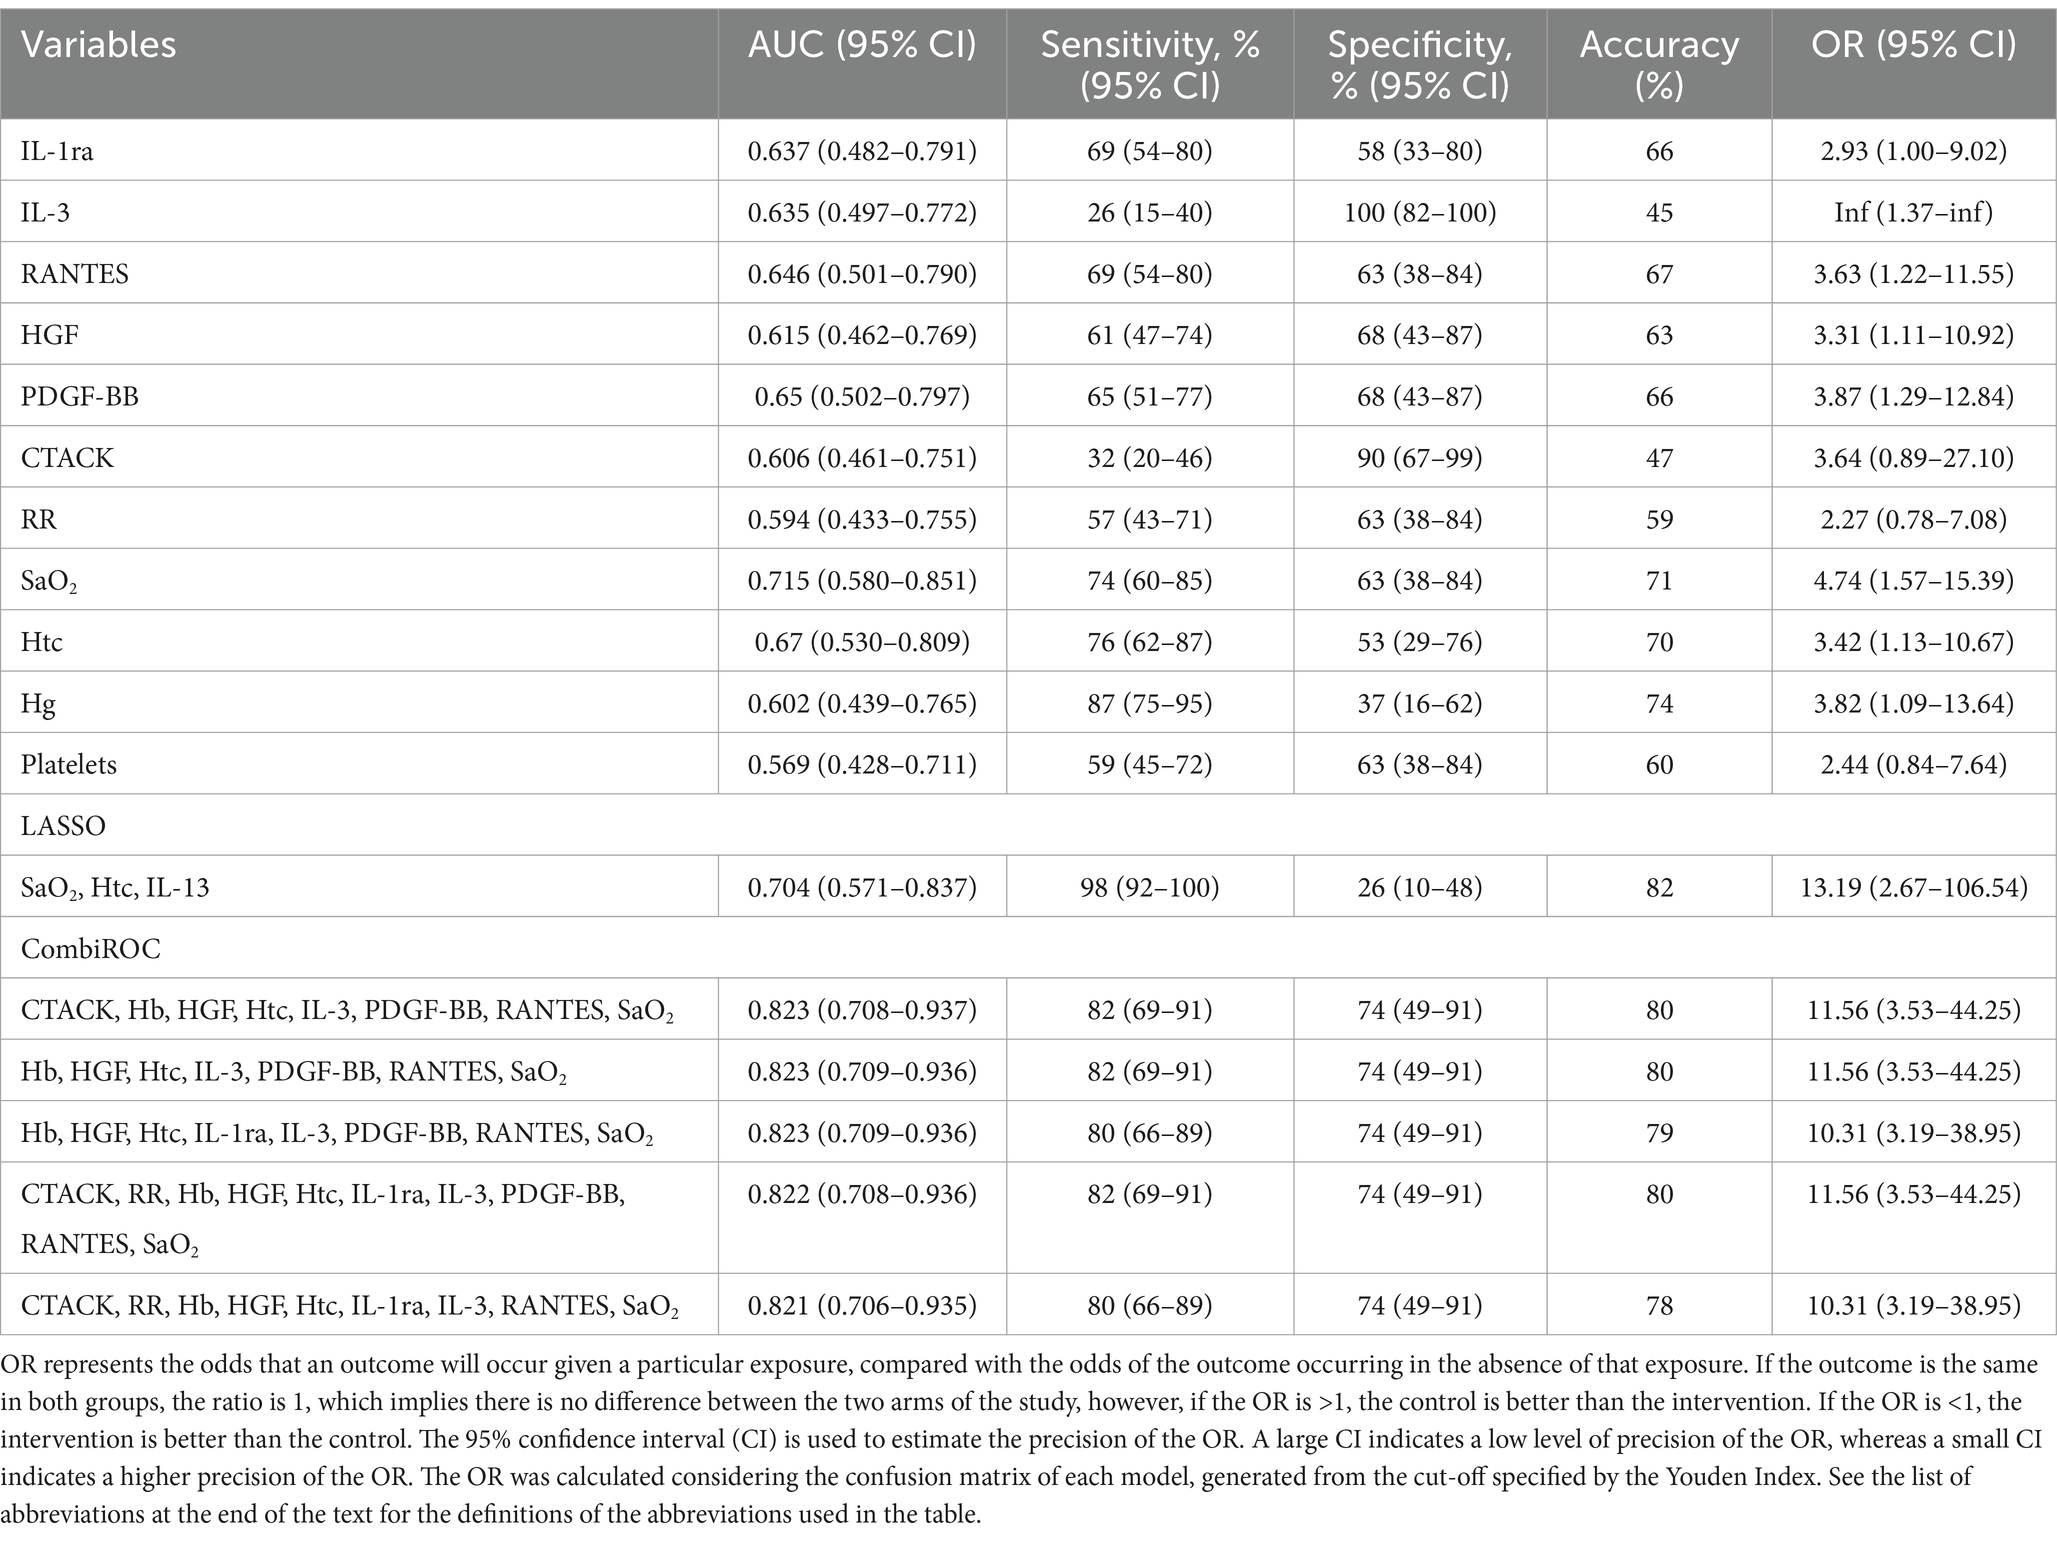
Table 2. Individual performances of the LASSO selected variables and the top five best combination of variables according to the AUC to predict clinical improvement (≥2 points on the WHO scale).
LASSO analysis identified SaO2, hematocrit, and IL-13 as the three key predictive variables, achieving an area under the curve (AUC) of 0.704 (95% CI, 0.571–0.837) (Figure 2A). These variables demonstrated a sensitivity of 98%, specificity of 26%, accuracy of 82%, and OR of 13.19 (Table 2), with a confusion matrix indicating 17 false positives, contributing to low specificity (Figure 2B).
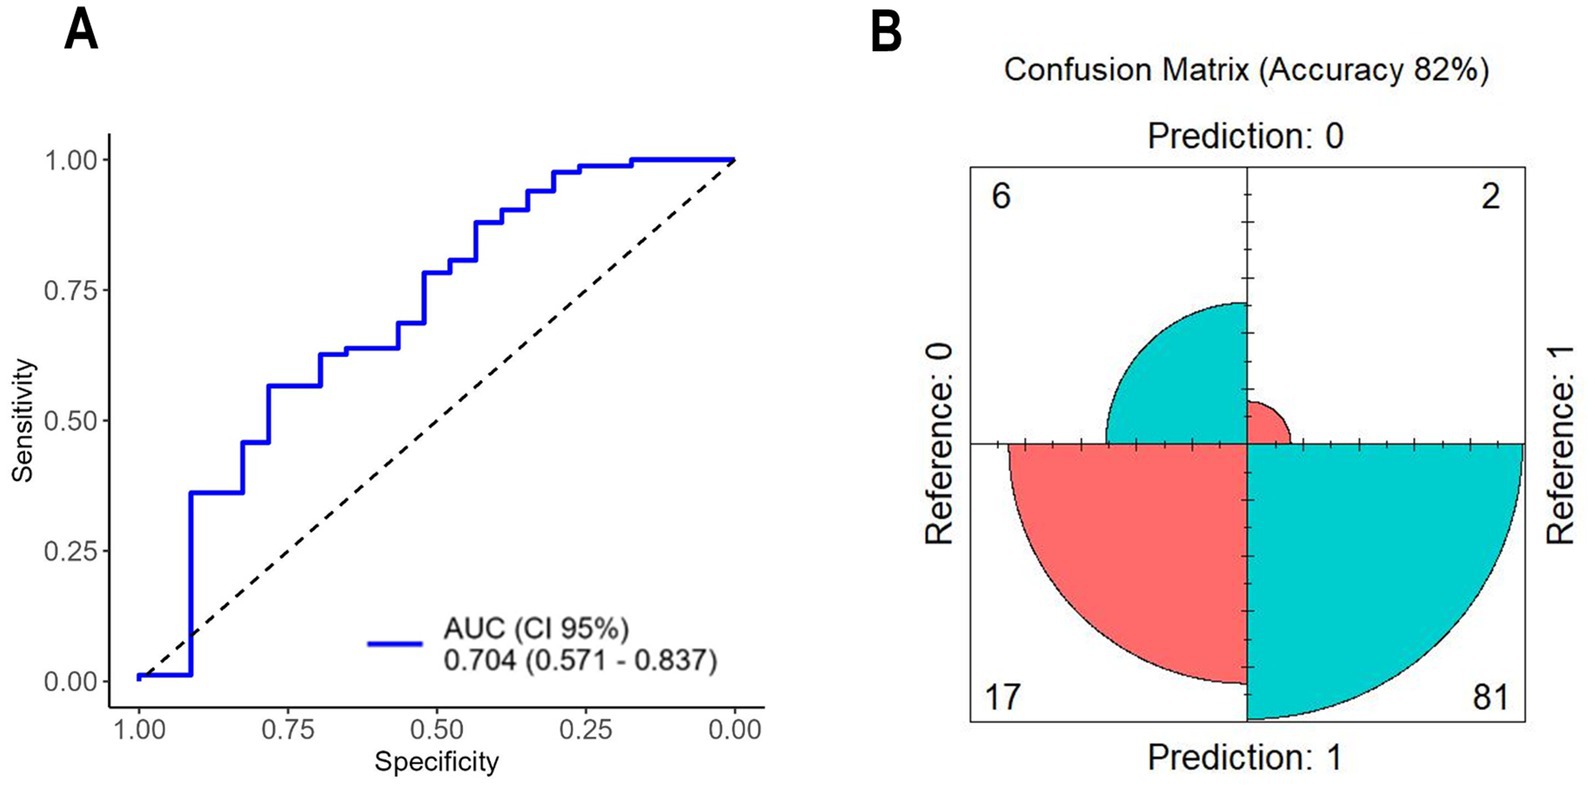
Figure 2. (A) ROC curve of variables selected by LASSO; (B) confusion matrix of variables selected by LASSO. AUC, area under the curve; CI, confidence interval.
A total of 2036 combinations were tested in the CombiROC analysis; the top five performing combinations are highlighted in Table 2. The best CombiROC combination (CTACK, Hb, HGF, Htc, IL-3, PDGF-BB, RANTES, and SaO2) achieved an AUC of 0.823 (95% CI, 0.708–0.937) (Figure 3A) with sensitivity of 82%, specificity of 74%, accuracy of 80%, and OR of 11.56. The confusion matrix showed 10 false positives, yielding moderate specificity (Figure 3B).
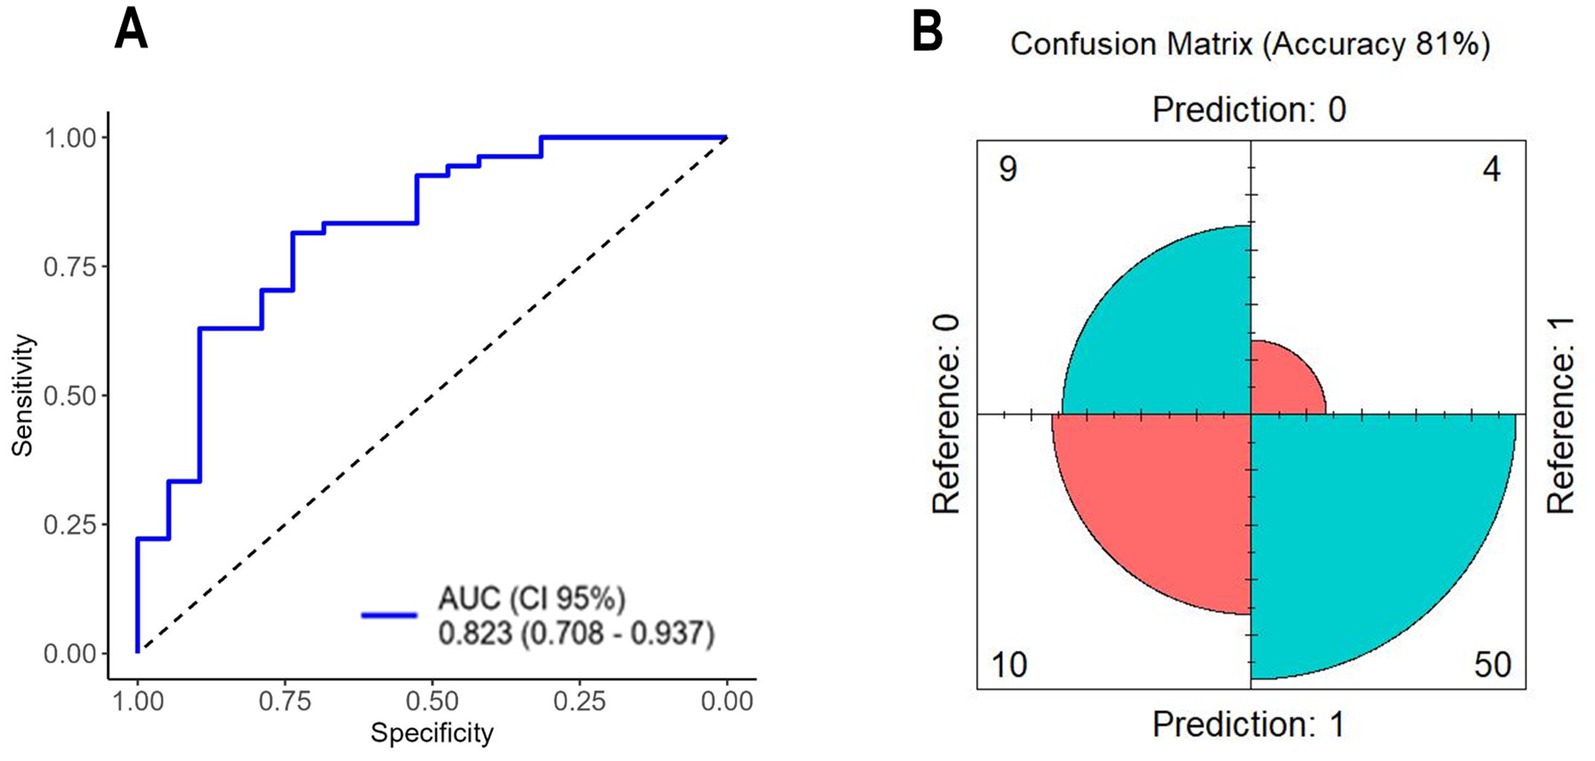
Figure 3. (A) ROC curve of variables selected by CombiROC; (B) confusion matrix of variables selected by CombiROC. AUC, area under the curve; CI, confidence interval.
ROC curves for the variables selected by LASSO and the top five CombiROC combinations are shown in Figure 4. No significant differences were observed between the LASSO model and the top five CombiROC models based on DeLong’s test (p = 0.185, p = 0.187, p = 0.186, p = 0.190, and p = 0.194, respectively).
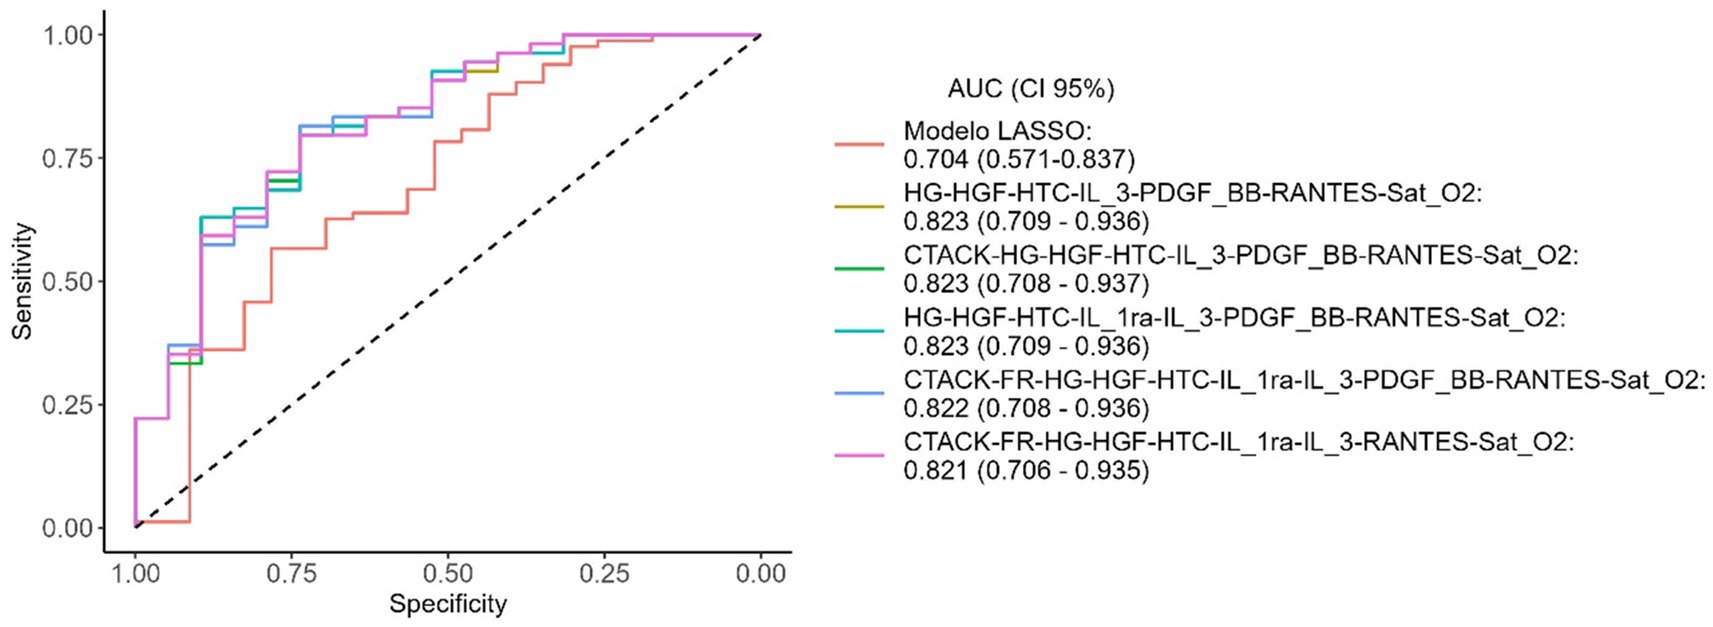
Figure 4. ROC curves of the LASSO model and the top 5 obtained after CombiROC analysis. AUC, area under the curve; CI, confidence interval.
4 Discussion
In patients hospitalized with COVID-19 pneumonia, we found that (1) the three predictive variables by LASSO (SaO2, hematocrit, and IL-13) demonstrated high sensitivity but low specificity in predicting clinical improvement; (2) the best combination of markers selected by CombiROC included more variables (CTACK, Hb, HGF, hematocrit, IL-3, PDGF-BB, RANTES, SaO2) and showed balanced sensitivity and specificity; (3) LASSO and CombiROC analyses yielded similar accuracy, with comparable ROC curves. This method is relevant for predicting clinical improvement or deterioration in non-COVID-19 acute respiratory distress syndrome (25). Nevertheless, there are important challenges to be overcome, such as data availability and the development and deployment of AI models.
We chose to use a modified intention-to-treat placebo group from a previous RCT (17) to better reflect the natural progression of the disease without treatment bias. This approach allowed us to assess the primary outcome at 7 days post hospital admission, capturing a period marked by significant clinical symptoms and lung inflammation due to SARS-CoV-2 infection (26). We used WHO clinical status for improvement as the primary outcome, a widely validated measure (27). Clinical improvement was defined as at least a 2-point increase in WHO clinical status. This outcome has been used in clinical trials dealing with pharmacological treatment for patients with COVID-19 (28). The WHO Clinical Progression Scale has been developed to facilitate data pooling across cohort studies and clinical trials, with the objective of expediting the exchange of knowledge to benefit patients infected with SARS-CoV-2 and to inform optimal resource planning (29). We also selected general clinical and laboratory data commonly used worldwide, ensuring the findings can be externally validated in future studies. Plasma biomarkers were chosen pragmatically from a multiplex kit of 47 cytokine markers, most of which are relevant to early COVID-19 pathophysiology. However, we excluded biomarkers with less than 50% data availability, because this would compromise the predictive analysis.
CombiROC, initially developed as a web-based tool for selecting optimal omics markers (12), has been applied for predicting lung overload in COVID-19 (13). CombiROC enables interactive selection of optimal marker combinations and generates visual feedback such as ROC curves. In our analysis, CombiROC required eight variables (CTACK, Hb, HGF, hematocrit, IL-13, PDGF-BB, RANTES, and SaO2) to achieve a balanced discriminative analysis, yielding 82% accuracy with moderate sensitivity (82%) and specificity (74%). However, these markers are more complex to assess at admission, potentially limiting feasibility in routine hospital settings. Notable biomarkers included in the CombiROC analysis, such as CTACK, HGF, and PDGF-BB, reflect distinct aspects of the immune response. CTACK is associated with T cell homing to lung tissues and may play a role in early inflammatory responses (30). HGF, produced by mesenchymal cells, functions as a regulator of the immune response and tissue repair; it may indicate early lung recovery in patients with COVID-19 (31, 32). IL-13, a central mediator of airway responsiveness, may reduce ACE2 expression on epithelial cells, potentially influencing viral replication dynamics (33, 34). PDGF-BB and RANTES (CCL5) have been associated with milder disease and may serve as markers of early immune responses conducive to recovery (35–37).
From a statistical point of view, both methods, CombiROC and LASSO, showed equivalent performance in predicting clinical improvement. Nevertheless, from a clinical point of view, there are some important insights about the discriminatory capacity of both methods. As observed, although CombiROC selected more variables, it showed good balance in recognizing those patients with COVID-19 who will or will not clinically improve. It can be inferred that if we are dealing with a population of patients with COVID-19 with very little clinical and laboratory information, it might be interesting to use the variables selected by the CombiROC analysis. This could maximize the prediction of clinical improvement or no clinical improvement because both truly positive cases and truly negative cases will be recognized. This can help the decision-making and ultimately improve healthcare for patients (38). On the other hand, if we are dealing with a population of patients with COVID-19 with some clinical information, such as age (39), absence of co-morbidity (40), presence of vaccine (41), we may use fewer and simpler variables selected by the LASSO analysis to identify likely truly positive case for clinical improvement; LASSO variables will detect with good sensitivity (98%). In practice, the process of selecting a discrete threshold value for a given test must carefully weigh the relative importance of a high true positive rate versus a high true negative rate and, by extension, the consequences of false negative and false positive results for the particular test (38).
4.1 Limitations
Our study has several limitations. First, the number of patients with a poor outcome was low, limiting the analysis. Second, as a secondary analysis, the SARS-CoV-2 strain was from the early wave of the pandemic, before widespread vaccination efforts. By 2023, >13 billion vaccine doses had been administered globally, although coverage remains low in some regions, particularly low-income areas where it is estimated to be under 30% (42). We did not assess plasma biomarkers on day 7 due to limited sample size and kit limitations. There are additional classification models, such as gradient boosting, hist gradient boosting, multilayer perceptron, among others that could be used to predict clinical improvement in COVID-19 patients (43).
5 Conclusion
In patients hospitalized with COVID-19 pneumonia, LASSO and CombiROC analyses showed comparable accuracy and ROC curve performance in predicting clinical improvement. LASSO identified three primary variables (SaO2, hematocrit, and IL-13) that yielded high sensitivity but low specificity, whereas CombiROC, with eight variables (CTACK, Hb, HGF, hematocrit, IL-3, PDGF-BB, RANTES, SaO2), provided a balanced sensitivity and specificity for predicting improvement. Thus, in patients with COVID-19, SaO2, hematocrit, and IL-13 may predict clinical improvement.
Data availability statement
The raw data supporting the conclusions of this article will be made available by the authors, without undue reservation.
Ethics statement
The studies involving humans were approved by the study adheres to the Declaration of Helsinki and was approved by the Brazilian National Commission for Research Ethics (CAAE: 30662420.0.1001.0008) and the individual Ethics Committees of all participating sites. This trial is registered with the Brazilian Registry of Clinical Trials (REBEC: RBR-88bs9x) and ClinicalTrials.gov (NCT04561219), registration date April 19th 2020. The studies were conducted in accordance with the local legislation and institutional requirements. The participants provided their written informed consent to participate in this study.
Author contributions
CC: Conceptualization, Formal analysis, Investigation, Methodology, Writing – original draft, Writing – review & editing. CM: Data curation, Formal analysis, Investigation, Methodology, Writing – original draft, Writing – review & editing. MM: Data curation, Investigation, Methodology, Writing – original draft, Writing – review & editing. HN: Data curation, Investigation, Methodology, Writing – original draft, Writing – review & editing. DC: Investigation, Supervision, Visualization, Writing – original draft, Writing – review & editing. PR: Conceptualization, Funding acquisition, Investigation, Methodology, Resources, Supervision, Writing – original draft, Writing – review & editing. FC: Conceptualization, Investigation, Methodology, Project administration, Supervision, Writing – original draft, Writing – review & editing. PS: Conceptualization, Formal analysis, Funding acquisition, Methodology, Project administration, Supervision, Writing – original draft, Writing – review & editing.
Funding
The author(s) declare that financial support was received for the research and/or publication of this article. This work was supported by the Brazilian Council for Scientific and Technological Development (CNPq), Brazil (408124/2021-0) and the Rio de Janeiro State Research Foundation (E-26/210.181/2020 [PRMR]).
Conflict of interest
CM is employed by AAC&T Research Consulting, LTDA.
The remaining authors declare that the research was conducted in the absence of any commercial or financial relationships that could be construed as a potential conflict of interest.
Generative AI statement
The author(s) declare that no Gen AI was used in the creation of this manuscript.
Publisher’s note
All claims expressed in this article are solely those of the authors and do not necessarily represent those of their affiliated organizations, or those of the publisher, the editors and the reviewers. Any product that may be evaluated in this article, or claim that may be made by its manufacturer, is not guaranteed or endorsed by the publisher.
Supplementary material
The Supplementary material for this article can be found online at: https://www.frontiersin.org/articles/10.3389/fmed.2025.1561980/full#supplementary-material
References
1. Emanuel, EJ, Persad, G, Upshur, R, Thome, B, Parker, M, Glickman, A, et al. Fair allocation of scarce medical resources in the time of COVID-19. N Engl J Med. (2020) 382:2049–55. doi: 10.1056/NEJMsb2005114
2. Lopes-Pacheco, M, Silva, PL, Cruz, FF, Battaglini, D, Robba, C, Pelosi, P, et al. Pathogenesis of multiple organ injury in COVID-19 and potential therapeutic strategies. Front Physiol. (2021) 12:593223. doi: 10.3389/fphys.2021.593223
3. Hussain, S, Songhua, X, Aslam, MU, and Hussain, F. Clinical predictions of COVID-19 patients using deep stacking neural networks. J Investig Med. (2024) 72:112–27. doi: 10.1177/10815589231201103
4. Qian, FH, Cao, Y, Liu, YX, Huang, J, and Zhu, RH. A predictive model to explore risk factors for severe COVID-19. Sci Rep. (2024) 14:18197. doi: 10.1038/s41598-024-68946-y
5. Lenharo, M. Ai consciousness: scientists say we urgently need answers. Nature. (2024) 625:226. doi: 10.1038/d41586-023-04047-6
6. Portuondo-Jimenez, J, Barrio, I, Espana, PP, Garcia, J, Villanueva, A, Gascon, M, et al. Clinical prediction rules for adverse evolution in patients with COVID-19 by the omicron variant. Int J Med Inform. (2023) 173:105039. doi: 10.1016/j.ijmedinf.2023.105039
7. Zhang, J, Li, L, Hu, X, Cui, G, Sun, R, Zhang, D, et al. Development of a model by LASSO to predict hospital length of stay (LOS) in patients with the SARS-Cov-2 omicron variant. Virulence. (2023) 14:2196177. doi: 10.1080/21505594.2023.2196177
8. Zhang, S, Huang, S, Liu, J, Dong, X, Meng, M, Chen, L, et al. Identification and validation of prognostic factors in patients with COVID-19: a retrospective study based on artificial intelligence algorithms. J Intensive Med. (2021) 1:103–9. doi: 10.1016/j.jointm.2021.04.001
9. Zhan, N, Guo, Y, Tian, S, Huang, B, Tian, X, Zou, J, et al. Clinical characteristics of COVID-19 complicated with pleural effusion. BMC Infect Dis. (2021) 21:176. doi: 10.1186/s12879-021-05856-8
10. Fu, Y, Zhong, W, Liu, T, Li, J, Xiao, K, Ma, X, et al. Early prediction model for critical illness of hospitalized COVID-19 patients based on machine learning techniques. Front Public Health. (2022) 10:880999. doi: 10.3389/fpubh.2022.880999
12. Mazzara, S, Rossi, RL, Grifantini, R, Donizetti, S, Abrignani, S, and Bombaci, M. CombiROC: an interactive web tool for selecting accurate marker combinations of omics data. Sci Rep. (2017) 7:45477. doi: 10.1038/srep45477
13. Silva, PL, Cruz, FF, Martins, CM, Herrmann, J, Gerard, SE, Xin, Y, et al. A specific combination of laboratory data is associated with overweight lungs in patients with COVID-19 pneumonia at hospital admission: secondary cross-sectional analysis of a randomized clinical trial. Front Med (Lausanne). (2023) 10:1137784. doi: 10.3389/fmed.2023.1137784
14. Sole, C, Moline, T, Vidal, M, Ordi-Ros, J, and Cortes-Hernandez, J. An exosomal urinary miRNA signature for early diagnosis of renal fibrosis in lupus nephritis. Cells. (2019) 8:773. doi: 10.3390/cells8080773
15. Amorim, CF, Novais, FO, Nguyen, BT, Misic, AM, Carvalho, LP, Carvalho, EM, et al. Variable gene expression and parasite load predict treatment outcome in cutaneous leishmaniasis. Sci Transl Med. (2019) 11:4024. doi: 10.1126/scitranslmed.aax4204
16. Kattner, S, Muller, J, Glanz, K, Manoochehri, M, Sylvester, C, Vainshtein, Y, et al. Identification of two early blood biomarkers ACHE and CLEC12A for improved risk stratification of critically ill COVID-19 patients. Sci Rep. (2023) 13:4388. doi: 10.1038/s41598-023-30158-1
17. Rocco, PRM, Silva, PL, Cruz, FF, Tierno, P, Rabello, E, Junior, JC, et al. Nitazoxanide in patients hospitalized with COVID-19 pneumonia: a multicentre, randomized, double-blind, placebo-controlled trial. Front Med (Lausanne). (2022) 9:844728. doi: 10.3389/fmed.2022.844728
18. von Elm, E, and Altman, DG. Reporting guidelines: looking back from the future. Chest. (2008) 134:682–4. doi: 10.1378/chest.08-1671
19. Friedman, J, Tibshirani, R, and Hastie, T. Regularization paths for generalized linear models via coordinate descent. J Stat Softw. (2010) 33:1–22. doi: 10.18637/jss.v033.i01
20. Tay, JK, Narasimhan, B, and Hastie, T. Elastic net regularization paths for all generalized linear models. J Stat Softw. (2023) 106:1–31. doi: 10.18637/jss.v106.i01
21. Ferrari, I, Rossi, R, and Mazzara, S. (2023). Combiroc: selection and ranking of omics biomarkers combinations made easy. R package version 0.3.4. Available online at: https://CRAN.R-project.org/package=combiroc (Accessed June 7, 2024).
22. R Core Team. R: A language and environment for statistical computing. Vienna, Austria: R Foundation for Statistical Computing (2021).
23. DeLong, ER, DeLong, DM, and Clarke-Pearson, DL. Comparing the areas under two or more correlated receiver operating characteristic curves: a nonparametric approach. Biometrics. (1988) 44:837–45. doi: 10.2307/2531595
24. Robin, X, Turck, N, Hainard, A, Tiberti, N, Lisacek, F, Sanchez, JC, et al. Proc: an open-source package for R and S+ to analyze and compare ROC curves. BMC Bioinform. (2011) 12:77. doi: 10.1186/1471-2105-12-77
25. Rubulotta, F, Bahrami, S, Marshall, DC, and Komorowski, M. Machine learning tools for acute respiratory distress syndrome detection and prediction. Crit Care Med. (2024) 52:1768–80. doi: 10.1097/CCM.0000000000006390
26. Aguilar, RB, Hardigan, P, Mayi, B, Sider, D, Piotrkowski, J, Mehta, JP, et al. Current understanding of COVID-19 clinical course and investigational treatments. Front Med (Lausanne). (2020) 7:555301. doi: 10.3389/fmed.2020.555301
27. Kalil, AC, Patterson, TF, Mehta, AK, Tomashek, KM, Wolfe, CR, Ghazaryan, V, et al. Baricitinib plus remdesivir for hospitalized adults with COVID-19. N Engl J Med. (2021) 384:795–807. doi: 10.1056/NEJMoa2031994
28. Garibaldi, BT, Wang, K, Robinson, ML, Zeger, SL, Bandeen-Roche, K, Wang, MC, et al. Comparison of time to clinical improvement with vs without remdesivir treatment in hospitalized patients with COVID-19. JAMA Netw Open. (2021) 4:e213071. doi: 10.1001/jamanetworkopen.2021.3071
29. WHO Working Group on the Clinical Characterisation and Management of COVID-19 Infection. A minimal common outcome measure set for COVID-19 clinical research. Lancet. (2020) 20:e192–7. doi: 10.1016/S1473-3099(20)30483-7
30. Qiu, L, Huang, D, Chen, CY, Wang, R, Shen, L, Shen, Y, et al. Severe tuberculosis induces unbalanced up-regulation of gene networks and overexpression of IL-22, MIP-1alpha, CCL27, IP-10, CCR4, CCR5, CXCR3, PD1, PDL2, IL-3, IFN-beta, TIM1, and TLR2 but low antigen-specific cellular responses. J Infect Dis. (2008) 198:1514–9. doi: 10.1086/592448
31. Zaira, B, Yulianti, T, and Levita, J. Correlation between hepatocyte growth factor (HGF) with D-dimer and interleukin-6 as prognostic markers of coagulation and inflammation in long COVID-19 survivors. Curr Issues Mol Biol. (2023) 45:5725–40. doi: 10.3390/cimb45070361
32. Perreau, M, Suffiotti, M, Marques-Vidal, P, Wiedemann, A, Levy, Y, Laouenan, C, et al. The cytokines HGF and CXCL13 predict the severity and the mortality in COVID-19 patients. Nat Commun. (2021) 12:4888. doi: 10.1038/s41467-021-25191-5
33. Kimura, H, Francisco, D, Conway, M, Martinez, FD, Vercelli, D, Polverino, F, et al. Type 2 inflammation modulates ACE2 and TMPRSS2 in airway epithelial cells. J Allergy Clin Immunol. (2020) 146:80–88.e8. doi: 10.1016/j.jaci.2020.05.004
34. Bonser, LR, Eckalbar, WL, Rodriguez, L, Shen, J, Koh, KD, Ghias, K, et al. The type 2 asthma mediator il-13 inhibits severe acute respiratory syndrome coronavirus 2 infection of bronchial epithelium. Am J Respir Cell Mol Biol. (2022) 66:391–401. doi: 10.1165/rcmb.2021-0364OC
35. Pine, AB, Meizlish, ML, Goshua, G, Chang, CH, Zhang, H, Bishai, J, et al. Circulating markers of angiogenesis and endotheliopathy in COVID-19. Pulm Circ. (2020) 10:2045894020966547. doi: 10.1177/2045894020966547
36. Crawford, A, Angelosanto, JM, Nadwodny, KL, Blackburn, SD, and Wherry, EJ. A role for the chemokine RANTES in regulating CD8 T cell responses during chronic viral infection. PLoS Pathog. (2011) 7:e1002098. doi: 10.1371/journal.ppat.1002098
37. Zhao, Y, Qin, L, Zhang, P, Li, K, Liang, L, Sun, J, et al. Longitudinal COVID-19 profiling associates IL-1RA and IL-10 with disease severity and RANTES with mild disease. JCI Insight. (2020) 5:e139834. doi: 10.1172/jci.insight.139834
38. Monaghan, TF, Rahman, SN, Agudelo, CW, Wein, AJ, Lazar, JM, Everaert, K, et al. Foundational statistical principles in medical research: sensitivity, specificity, positive predictive value, and negative predictive value. Medicina (Kaunas). (2021) 57:503. doi: 10.3390/medicina57050503
39. Bonanad, C, García-Blas, S, Tarazona-Santabalbina, F, Sanchis, J, Bertomeu-González, V, Fácila, L, et al. The effect of age on mortality in patients with COVID-19: a meta-analysis with 611,583 subjects. J Am Med Dir Assoc. (2020) 21:915–8. doi: 10.1016/j.jamda.2020.05.045
40. Russell, CD, Lone, NI, and Baillie, JK. Comorbidities, multimorbidity and COVID-19. Nat Med. (2023) 29:334–43. doi: 10.1038/s41591-022-02156-9
41. Watson, OJ, Barnsley, G, Toor, J, Hogan, AB, Winskill, P, and Ghani, AC. Global impact of the first year of COVID-19 vaccination: a mathematical modelling study. Lancet Infect Dis. (2022) 22:1293–302. doi: 10.1016/S1473-3099(22)00320-6
42. Hopkins, KL, Lihemo, G, Underwood, T, Sommers, T, Dockery, M, Boehman, N, et al. The second annual vaccination acceptance research network conference (Varn2023): shifting the immunization narrative to center equity and community expertise. Vaccine. (2024) 42:126027. doi: 10.1016/j.vaccine.2024.05.075
43. Chen, B, Li, N, and Bao, W. CLPr_in_ML: cleft lip and palate reconstructed features with machine learning. Curr Bioinforma. (2024) 20:179–93. doi: 10.2174/0115748936330499240909082529
Glossary
AI - Artificial intelligence
AUC - Area under the curve
CI - Confidence interval
CTACK - T cell–attracting chemokine
Hb - Hemoglobin
Hct - Hematocrit
HGF - Hepatocyte growth factor
IFN - Interferon
IL - Interleukin
IQR - Interquartile range
LASSO - Least absolute shrinkage and selection operator
LDH - Lactate dehydrogenase
MCP - Monocyte chemotactic protein
MIG - Monokine induced by IFN-γ
OR - Odds ratio
PDGF - Platelet-derived growth factor
RCT - Randomized clinical trial
ROC - Receiver operating characteristic
RR - Respiratory rate
SCF - Stem cell factor
TNF - Tumor necrosis factor
WHO - World Health Organization
Keywords: COVID-19, biomarkers, machine learning, LASSO, CombiROC, clinical improvement
Citation: Conceição CCS, Martins CM, Medeiros Silva M, Neto HCCF, Chiumello D, Rocco PRM, Cruz FF and Silva PL (2025) Predicting clinical outcomes at hospital admission of patients with COVID-19 pneumonia using artificial intelligence: a secondary analysis of a randomized clinical trial. Front. Med. 12:1561980. doi: 10.3389/fmed.2025.1561980
Edited by:
Qinghe Meng, Upstate Medical University, United StatesReviewed by:
Wenzheng Bao, Xuzhou University of Technology, ChinaChangjing Zhuge, Beijing University of Technology, China
Copyright © 2025 Conceição, Martins, Medeiros Silva, Neto, Chiumello, Rocco, Cruz and Silva. This is an open-access article distributed under the terms of the Creative Commons Attribution License (CC BY). The use, distribution or reproduction in other forums is permitted, provided the original author(s) and the copyright owner(s) are credited and that the original publication in this journal is cited, in accordance with accepted academic practice. No use, distribution or reproduction is permitted which does not comply with these terms.
*Correspondence: Pedro Leme Silva, cGVkcm9sZW1lQGJpb2YudWZyai5icg==