 Yuting Wu
 Yuxin Liu1,2
 Guanghui Liu
94% of researchers rate our articles as excellent or good
Learn more about the work of our research integrity team to safeguard the quality of each article we publish.
Find out more
ORIGINAL RESEARCH article
Front. Med., 06 March 2025
Sec. Ophthalmology
Volume 12 - 2025 | https://doi.org/10.3389/fmed.2025.1552978
This article is part of the Research TopicNew Concepts, Advances, and Future Trends in Clinical Research on Eye DiseasesView all 29 articles
Objective: The association between the weight-adjusted waist index (WWI) and age-related macular degeneration (AMD) in US adults aged 40 years and older is unknown. The goal of this study was to ascertain a possible association between the two.
Methods: Data were obtained from the National Health and Nutrition Examination Survey (NHANES) in the US from 2005 to 2008. The WWI was calculated by dividing waist circumference (WC) by the square root of body weight (kg). AMD was diagnosed based on distinctive features observed in the fundus, using a standard classification system. Weighted logistic regression analyses were conducted to investigate the association between the WWI and AMD. Spline smoothing and threshold effects were applied to explore non-linear correlations. Subgroup analyses were performed to identify underlying covariates affecting this relationship. In addition, receiver operating characteristic (ROC) curve analysis was used to evaluate the predictive power of the WWI for AMD.
Results: A total of 5,132 participants were enrolled in this study. The results showed a significant positive association between the WWI and risk of AMD (OR = 1.76 (1.52, 2.04); p < 0.0001). When the WWI was categorized into tertiles, the highest group exhibited a stronger association compared to the lowest tertile (OR = 2.90 (2.18, 3.86); p < 0.0001) in model 1. The subgroup analyses and interaction tests indicated that the relationship between the WWI and AMD was stable across various populations. The spline smoothing and threshold effects showed a positive non-linear correlation between the WWI and AMD incidence. Furthermore, compared to body mass index (BMI), WC, and weight, the WWI showed better predictability for AMD, as shown by the ROC analysis.
Conclusion: There exists a positive non-linear association between the WWI and AMD in US adults aged 40 years and older. The WWI-related obesity management is necessary for the prevention and treatment of AMD.
Age-related macular degeneration (AMD) is one of the leading causes of irreversible blindness worldwide, damaging the macular area of the retina (1). It is classified into neovascular and non-neovascular types (1). Both types can lead to the loss of central vision, even resulting in severe and permanent visual impairment and blindness (2, 3). In addition, AMD is a major contributor to significant visual impairment in individuals over the age of 50 in high-income countries (4). It is estimated that 8.69% of the global population is affected by this disease. By 2020, the number of individuals with AMD was 196 million; by 2040, this prevalence is estimated to reach 288 million (5).
Relevant studies have shown that AMD incidence is closely related to genetic and environmental factors, including aging and cardiovascular diseases (6, 7). A comprehensive study conducted in Taiwan, employing a range of methodologies, identified that ARMS2/HTRA1 risk alleles are instrumental in elucidating the molecular and genetic mechanisms underlying neovascular AMD (8). A systematic review highlighted that genetic predispositions, including variants in CFH, APOE, and pathways related to oxidative stress, significantly influence the risk and progression of AMD (9). In addition, certain genes associated with lipid transport and complement regulation have been implicated in AMD pathogenesis (10). Pharmacological interventions may also impact AMD incidence. For instance, a clinical study demonstrated that metformin significantly reduced the risk of AMD in Taiwanese patients with type 2 diabetes mellitus (11) and also lowered the risk of AMD-related conditions such as dementia, hypertension, and heart failure (12–14). Furthermore, glucagon-like peptide-1 receptor agonists (GLP-1RAs) have been suggested to decrease the risk of exudative AMD (15), while sodium-glucose cotransporter-2 (SGLT2) inhibitors exhibit a robust protective effect against macular degeneration in diabetic patients (16). An experimental study also demonstrated that atorvastatin (AT) confers protection against AMD by inhibiting the progression of pyroptosis (17).
AMD has been independently correlated with a variety of diseases. A European study on ocular diseases found a correlation between hypertension and an increased likelihood of early AMD (18). Furthermore, a retrospective cohort study by Lee et al. (19) reported a heightened incidence of exudative AMD among patients with diabetes mellitus. High levels of plasma high-density lipoprotein cholesterol (HDL-C), which represent dyslipidemia, were causally associated with an increased risk of advanced AMD in European and Asian populations according to a multiethnic study (20). The development of AMD affects individuals’ quality of life and increases socioeconomic burdens (21). Therefore, early prediction and diagnosis of AMD hold significant clinical value.
Obesity is influenced by human metabolism, ethnic heritage, individual behaviors, and environmental changes (22). It is expected to affect more than half of American adults in 29 states by 2030 (23). Previous studies have shown that obesity increases the risk of several illnesses (24–27). In terms of AMD incidence, it has also been identified as a risk factor (28, 29). Body mass index (BMI) is a commonly used measure for obesity assessment and classification; however, it cannot accurately distinguish between fat, lean mass, and fat distribution in individuals (30). In addition, waist circumference (WC), the waist-to-height ratio (WHtR), and the waist–hip ratio (WHR) are commonly used clinical parameters for assessing central obesity.
A population-based Taiwanese survey reported that WC and the WHtR have similar efficacy and are superior to BMI and the WHR for predicting diseases such as hypertension and dyslipidemia (31). However, these indicators cannot quantify fat content and do not accurately reflect overall adiposity or leanness status. Therefore, exploring novel indices that better represent obesity is necessary.
Recognized as a new assessment tool for obesity, the weight-adjusted waist index (WWI) can better distinguish between fat distribution and muscle mass within the body. In terms of ocular diseases, the WWI has become a vital parameter (32). While the WWI has a strong predictive utility for other diseases (33–35), the link between the WWI and AMD has not been investigated.
In this study, the National Health and Nutrition Examination Survey (NHANES) database from 2005 to 2008 was utilized to investigate the association between the WWI and AMD.
The NHANES database uses a complex, multistage probability sampling design to represent the diet and health conditions of the non-institutionalized civilian population in the United States. It ensures a representative sample of the total U.S. population through random selection, under the administration of the Centers for Disease Control and Prevention. The National Center for Health Statistics (NCHS) initially collected the data. All data calculations required the use of sample weights, in accordance with the NCHS analysis guidelines. Approximately 5,000 American participants were tested each year. In this study, the NHANES 2005–2006 and 2007–2008 study cycles were included. A total of 20,497 individuals were initially included. All survey participants provided written informed consent before the survey. The exclusion criteria included individuals under the age of 40 years (n = 13,990), individuals with missing data on weight and waist circumference (n = 151), and individuals with missing data on other covariates (n = 30). In the end, 5,132 participants were included (Figure 1).
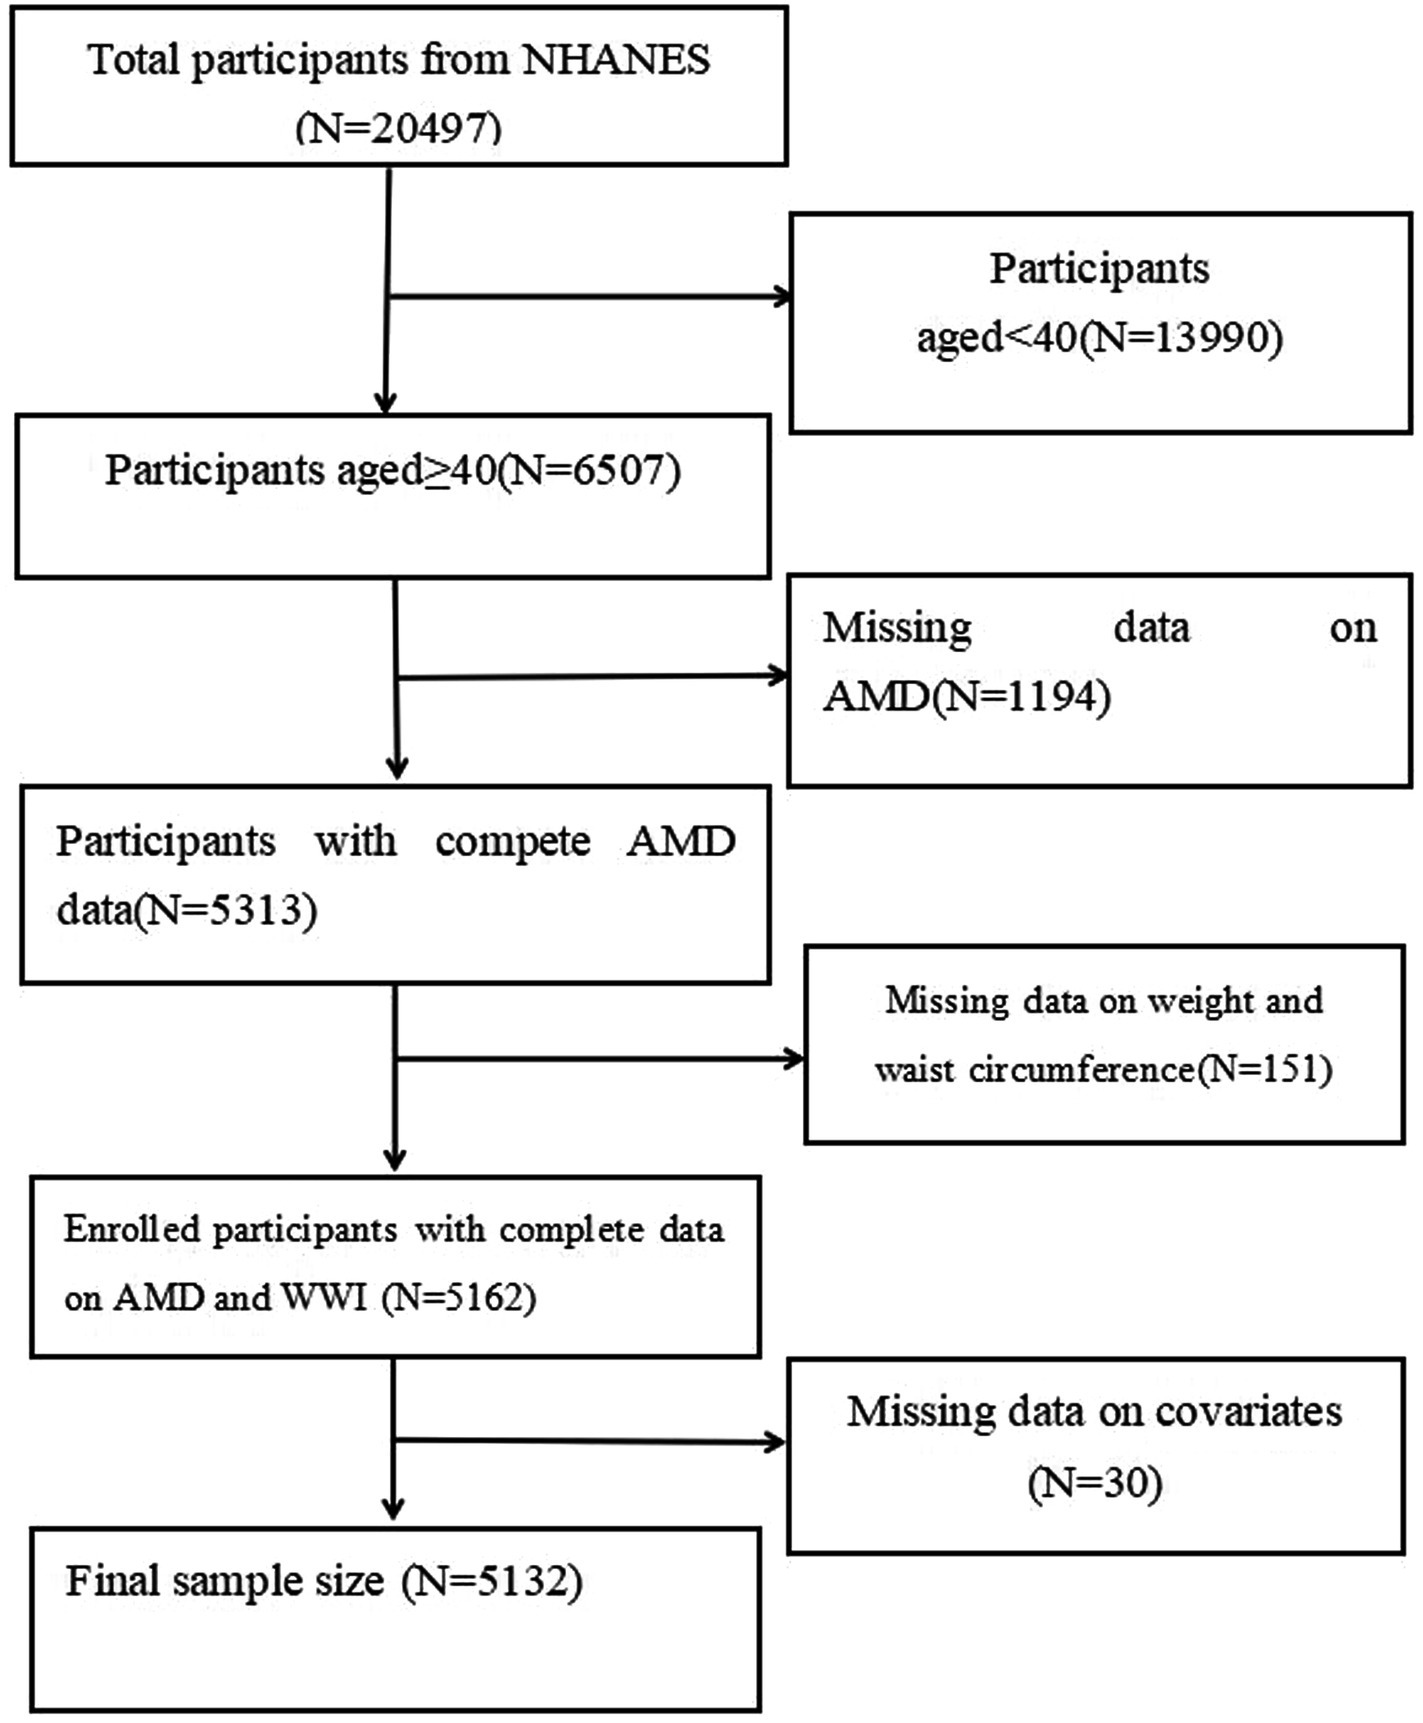
Figure 1. Flowchart of the sample selection from the NHANES 2005–2008 cycles.
The WWI was used as the exposure variable in the study. It is a novel obesity index evaluating an individual’s central obesity degree based on waist circumference and weight measurements, both of which were taken at a designated mobile examination center (MEC) where experimental measurements were conducted under controlled conditions (36, 37). The WWI was calculated as follows (32):
The participants’ AMD data were assessed from the NHANES examination dataset. The diagnosis was based on accurate fundus photography. Individuals aged 40 and above throughout the NHANES cycles from 2005 to 2008 underwent retinal photography. A Canon CR6 non-mydriatic camera, equipped with a Canon 10D camera on the back, was used to capture two 45-degree non-mydriatic fundus photographs of the retina in each eye of every survey participant. At the University of Wisconsin–Madison in America, each retinal image of the participants was evaluated and scored by experienced experts using a taxonomy standard based on a modified version of the Wisconsin age-related macular disease grading classification system (38). On the NHANES website, a detailed retinal image processing manual was available (39). At least two specialists rated the scores, and if inconsistencies arose, a third researcher would intervene to resolve them. Early AMD was defined by the presence of drusen with a grid area larger than a 500-μm circle and/or pigmentary abnormalities, while late AMD was characterized by the appearance of geographic atrophy or exudative AMD (including subretinal detachments, subretinal hemorrhage, visible subretinal new vessels, subretinal fibrous scars, or laser treatment scars for AMD) (40, 41). If the participants had retinal images of both eyes, valid analyses were performed selectively on the retina of the worse eye.
The covariates considered in the study included sex (male and female), age (years), ethnicity (Mexican American, other Hispanic, non-Hispanic white, non-Hispanic Black, and other ethnicities), education level (less than 9th Grade, 9-11th grade, high school grad/GED or equivalent, some college or associate degree, and college graduate or above), marital status (married, widowed, divorced, separated, never married, living with partner), poverty–income ratio (PIR), waist circumference (WC), weight, body mass index (BMI), smoking status (yes/no), hypertension status (yes/no), and diabetes status (yes/no/borderline). BMI was calculated as body weight (kg) divided by height (m)2 at the MEC. Smoking status was determined by whether the participants had smoked at least 100 cigarettes in their lifetime. Hypertension was defined based on the question: “Were you told by a doctor or other health expert that you have hypertension, also called high blood pressure?” The participants who answered “Yes” to the question, “Has your doctor told you that you have diabetes?” were characterized as having diabetes (excluding gestational diabetes) (32). All details regarding these covariates were accessed directly from the NHANES website.
The continuous covariates were presented as mean ± standard deviation (SD), while the categorical covariates were reported as percentages. For the continuous covariates, p-values were calculated using weighted linear regression analysis. For the categorical covariates, weighted chi-square tests were used to assess the data.
Weighted multiple logistic regression analysis was performed. This analysis was divided into three models. Model 1 was established without any adjustments. Model 2 was adjusted for sex, age, and ethnicity in terms of the demographic variables. Model 3 included all the adjustments of Model 2, plus education level, marital status, poverty-income ratio, body mass index (BMI), smoking status (smoked at least 100 cigarettes in life), and diabetes and hypertension status, accounting for a range of potential factors affecting the relationship between the WWI and AMD. To enhance the robustness and reliability of the analytical results, the WWI was transformed from a continuous variable to a categorical variable, categorized into tertiles through sensitivity analyses. Subgroup analyses and interaction tests were used to further identify variables that influence this association across diverse populations. A potential linear or non-linear correlation was detected using smoothing curve fitting and threshold effect analyses. Data analysis was performed using R1 and EmpowerStats (version 4.2). In addition, a p-value of <0.05 was considered statistically significant.
A total of 5,132 individuals were included in this study, with 50.16% being female and 49.84% being male. Among them, 391 participants had AMD, representing 7.62% of the total sample. The WWI tertiles were categorized as Tertile 1 (8.59–10.85), Tertile 2 (10.85–11.52), and Tertile 3 (11.52–15.70). As shown in Table 1, statistically significant differences between the WWI tertiles were found for sex, age, ethnicity, education level, marital status, PIR, waist circumference, weight, BMI, diabetes status, hypertension status, smoking status, and AMD (all p < 0.05). The highest WWI tertile group tended to consist of older female individuals with lower educational attainment and PIR compared to those in Tertile 1. In addition, the participants in the higher WWI groups were more likely to be non-Hispanic white and widowed, considering ethnicity and marital status. Higher proportions of waist circumference, weight, and BMI were related to higher WWI tertiles. There was a higher likelihood of experiencing diabetes, hypertension, and AMD and having smoked at least 100 cigarettes in a lifetime in the higher WWI tertiles (all p < 0.05). In addition, after the inclusion of the WHtR, the relevant characteristics of the study population are shown in Supplementary Table 1, while Supplementary Tables 4, 5 show the population characteristics by sex.
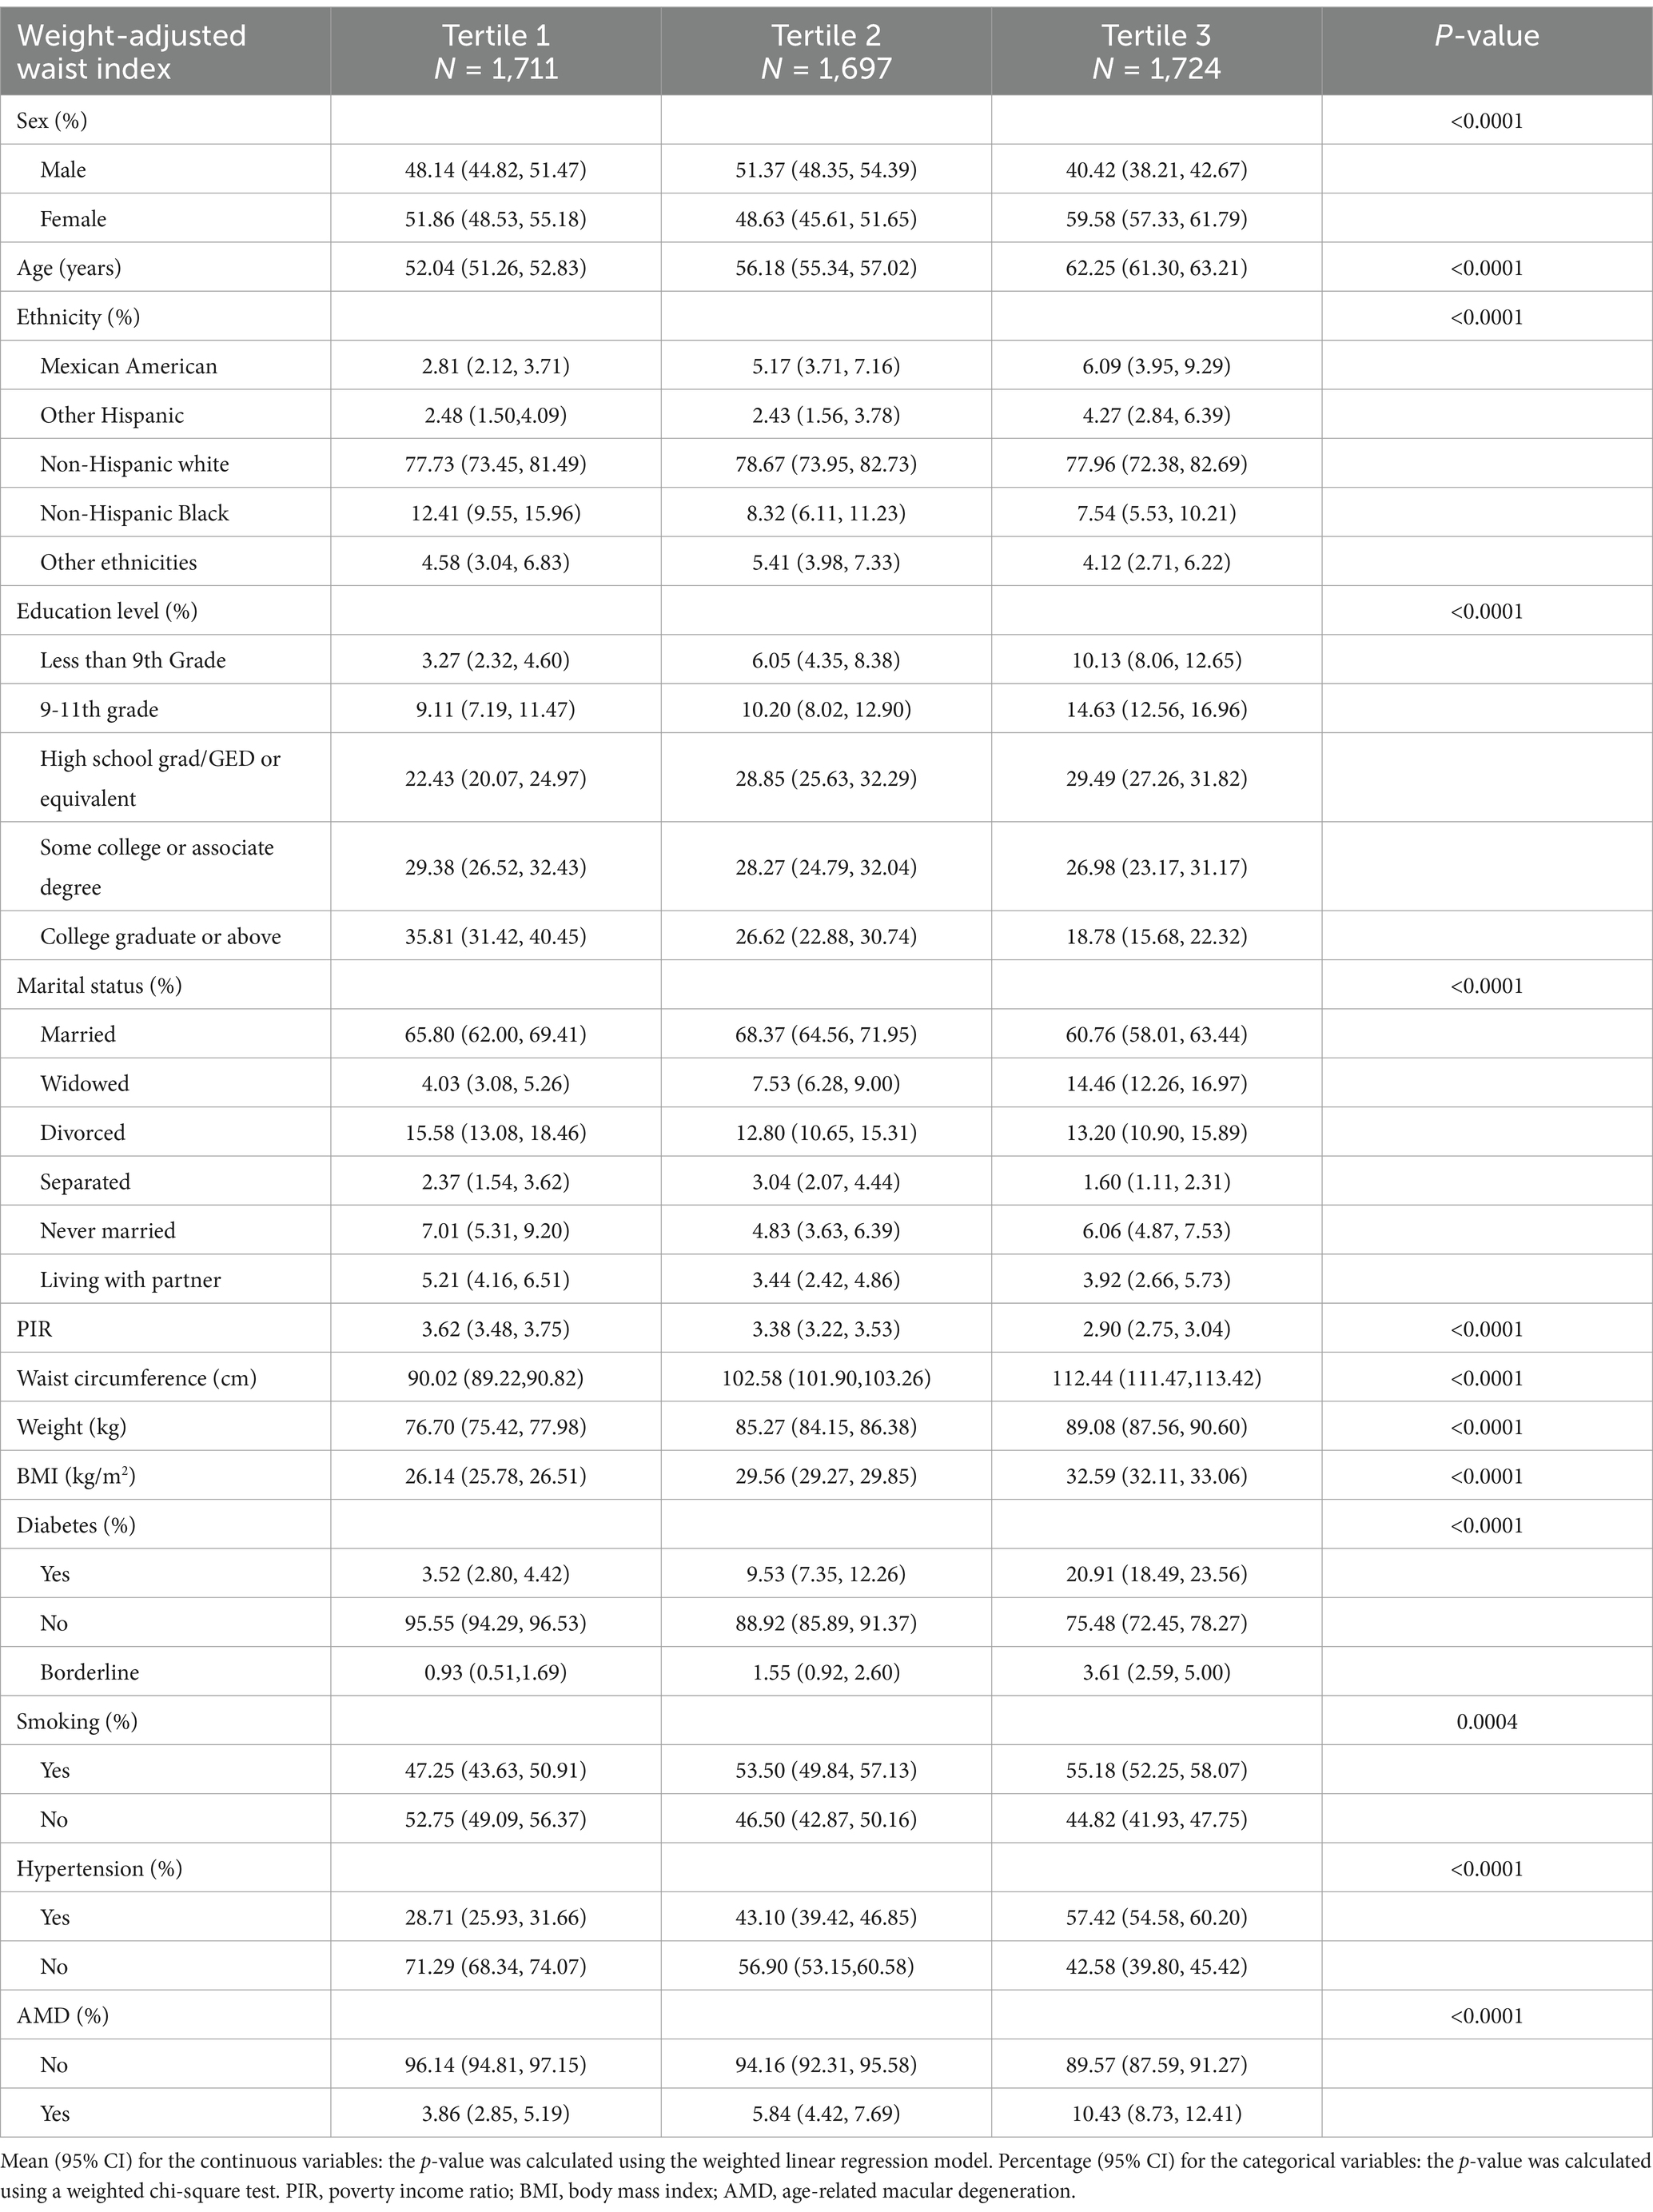
Table 1. Baseline characteristics of the study population.
The correlation between the WWI and AMD is presented in Table 2. This study examined the impact of the WWI on AMD prevalence through weighted multivariable logistic regression analyses. While the WWI was considered a consecutive covariate, a significant difference was observed in the association with the presence of AMD in Model 1 compared to the adjusted models (OR: 1.76, 95% CI: 1.52–2.04; OR: 1.12, 95% CI: 0.96–1.32; OR: 1.11, 95% CI: 0.90–1.36). Each unit increase in the WWI increased a participant’s likelihood of having AMD by 76%, as observed in model 1. When the WWI was set as a categorical variable in model 1, the tertile 3 group had a significantly higher risk of developing AMD, 1.9 times greater compared to the lowest tertile group (OR: 2.90, 95% CI: 2.18–3.86). The overall positive trend in this model was also significant, as indicated by the trend test (p for trend <0.0001). Nevertheless, this effect remained different in the partially and fully adjusted models (model 2 and model 3). The positive trend in these two models was not significant after adjusting for the covariates included in the study (p for trend >0.05). When the WHtR index, representing central obesity, was included, a different association between the WWI and AMD was observed, as shown in Supplementary Table 2.
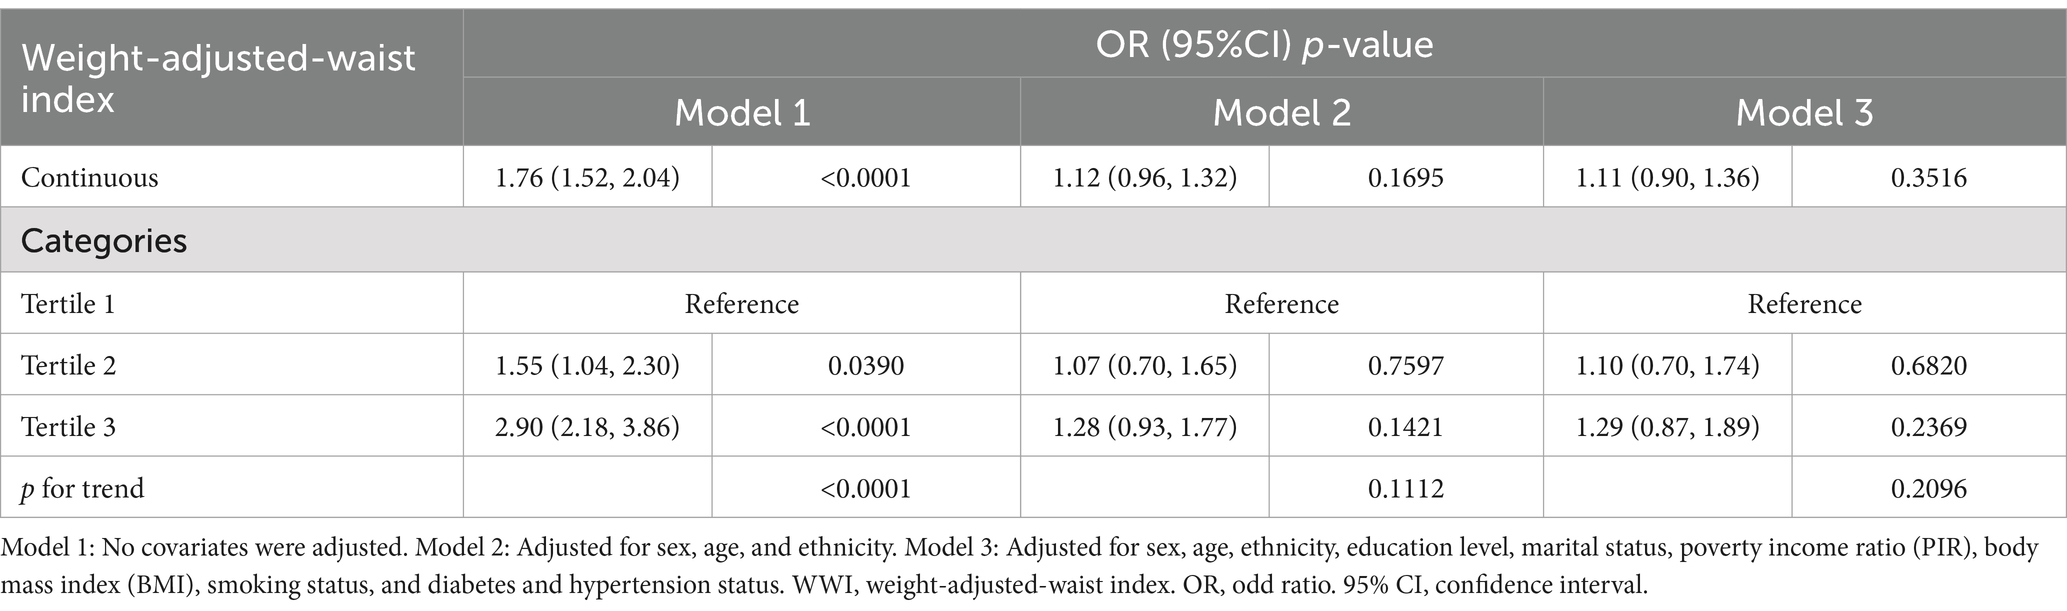
Table 2. Association between the WWI and AMD.
Based on the analyses of spline smoothing, a positive non-linear correlation was observed between the WWI and AMD. A log-likelihood ratio test comparing a single-line (non-segmentation) model and a segmentation regression model in the threshold effect analyses was used to confirm whether a threshold point existed. The threshold effect analyses identified a turning point of 12.11 for the association between the WWI and AMD in the general population (p < 0.05) (Figure 2A; Table 3). When the WWI value was below this point, a significant positive increase was observed in the association with AMD (OR 1.50, 95% CI: 1.04–2.16, p = 0.0300). When the WWI value exceeded this threshold, there was no statistically significant increase (OR: 0.75, 95% CI: 0.39–1.45, p = 0.3943). From a biological perspective, it was hypothesized that this inflection point may represent a critical threshold, beyond which the risk for AMD does not increase significantly, potentially indicating minimal pronounced pathological changes in the retina within this study population. In the subgroups stratified by sex, the WWI was positively associated with AMD in the male participants. Simultaneously, the log-likelihood ratio was below 0.05 in the male participants, indicating a non-linear trend among them (Figure 2B; Table 3). When the value was below 12.2, a significant association with AMD was observed (OR 1.85, 95% CI: 1.22–2.81, p = 0.0040). However, above this threshold, this association was not statistically significant (OR 0.32, 95% CI: 0.05–2.08, p = 0.2299). For the female participants, the turning point in the non-linear relationship between the WWI and AMD was calculated to be 11.83 (Figure 2C). Below this point, there was a positive association with AMD prevalence (OR: 1.93, 95% CI: 1.28–2.91, p = 0.0016), while above this point, the association was not statistically significant (OR: 0.86, 95% CI: 0.47–1.58, p = 0.6303), as shown in Table 3.
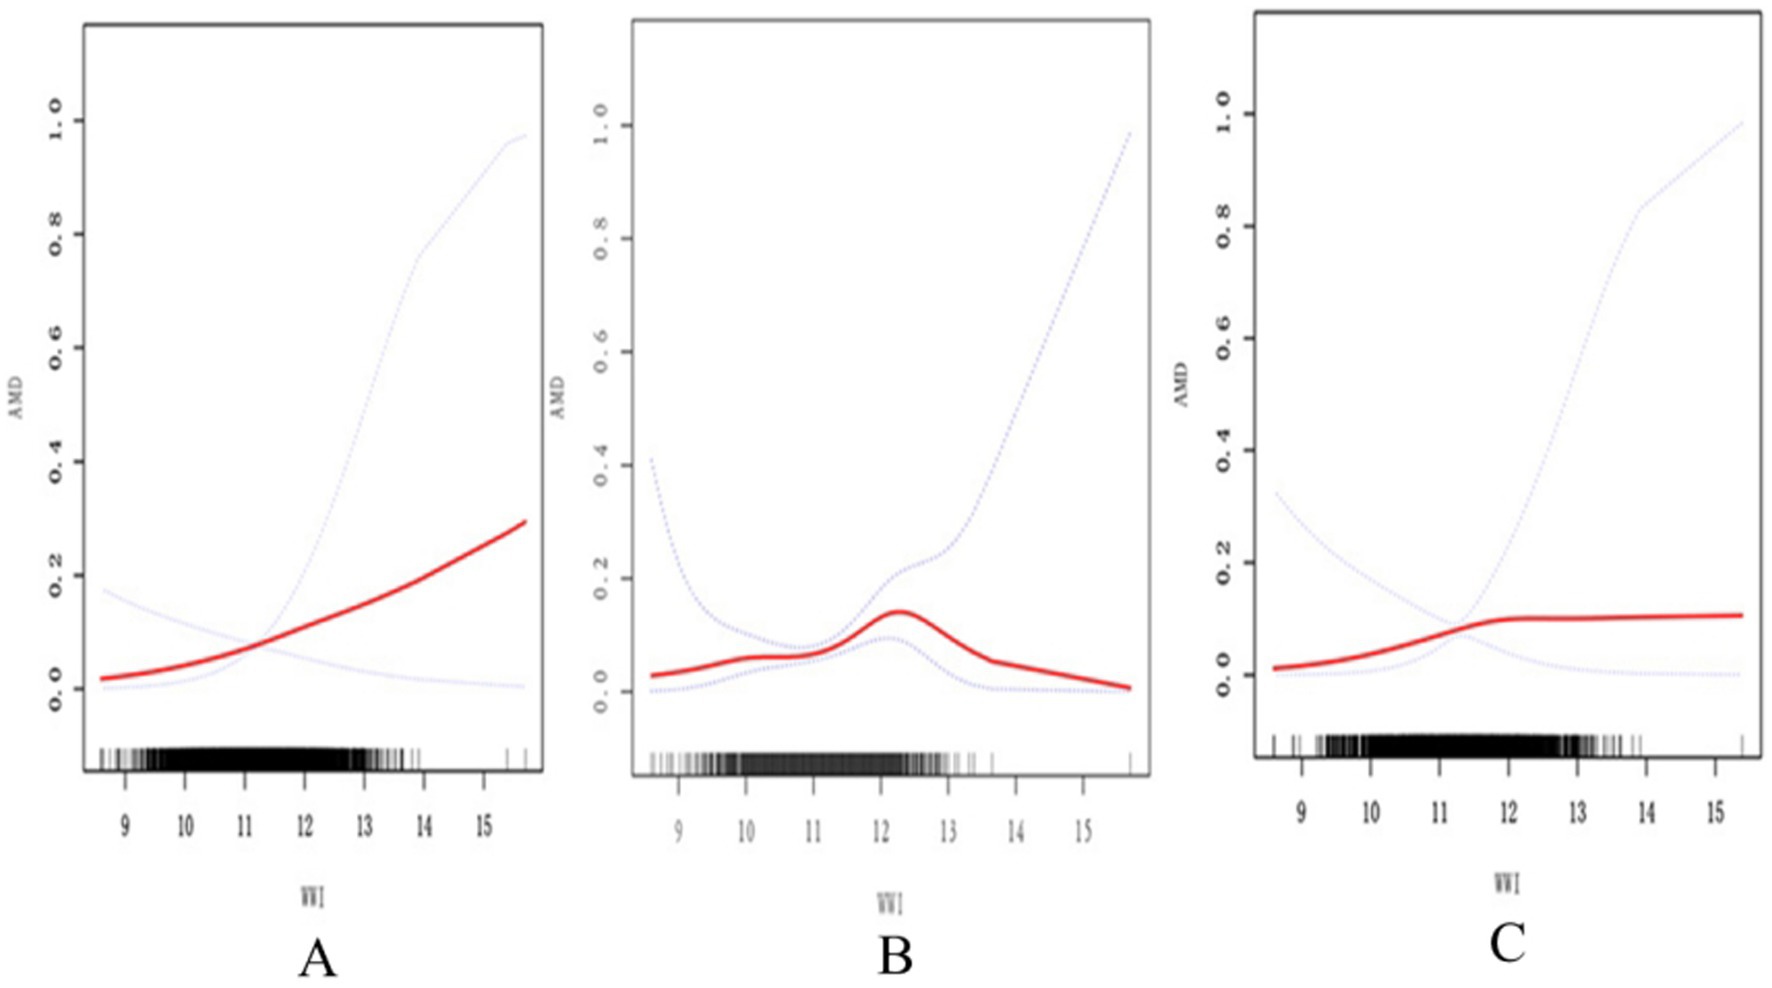
Figure 2. Association between the WWI and AMD assessed using spline smoothing. The black vertical line on the horizontal axis represents the WWI distribution. The smooth curve fit between the variables is shown by the solid red line. The blue bands represent the 95% confidence interval. (A) The association between WWI and AMD in the general population. (B) The association between WWI and AMD in males. (C) The association between WWI and AMD in females All covariates in Table 1 are adjusted. AMD, age-related macular degeneration; WWI, weight-adjusted waist index.
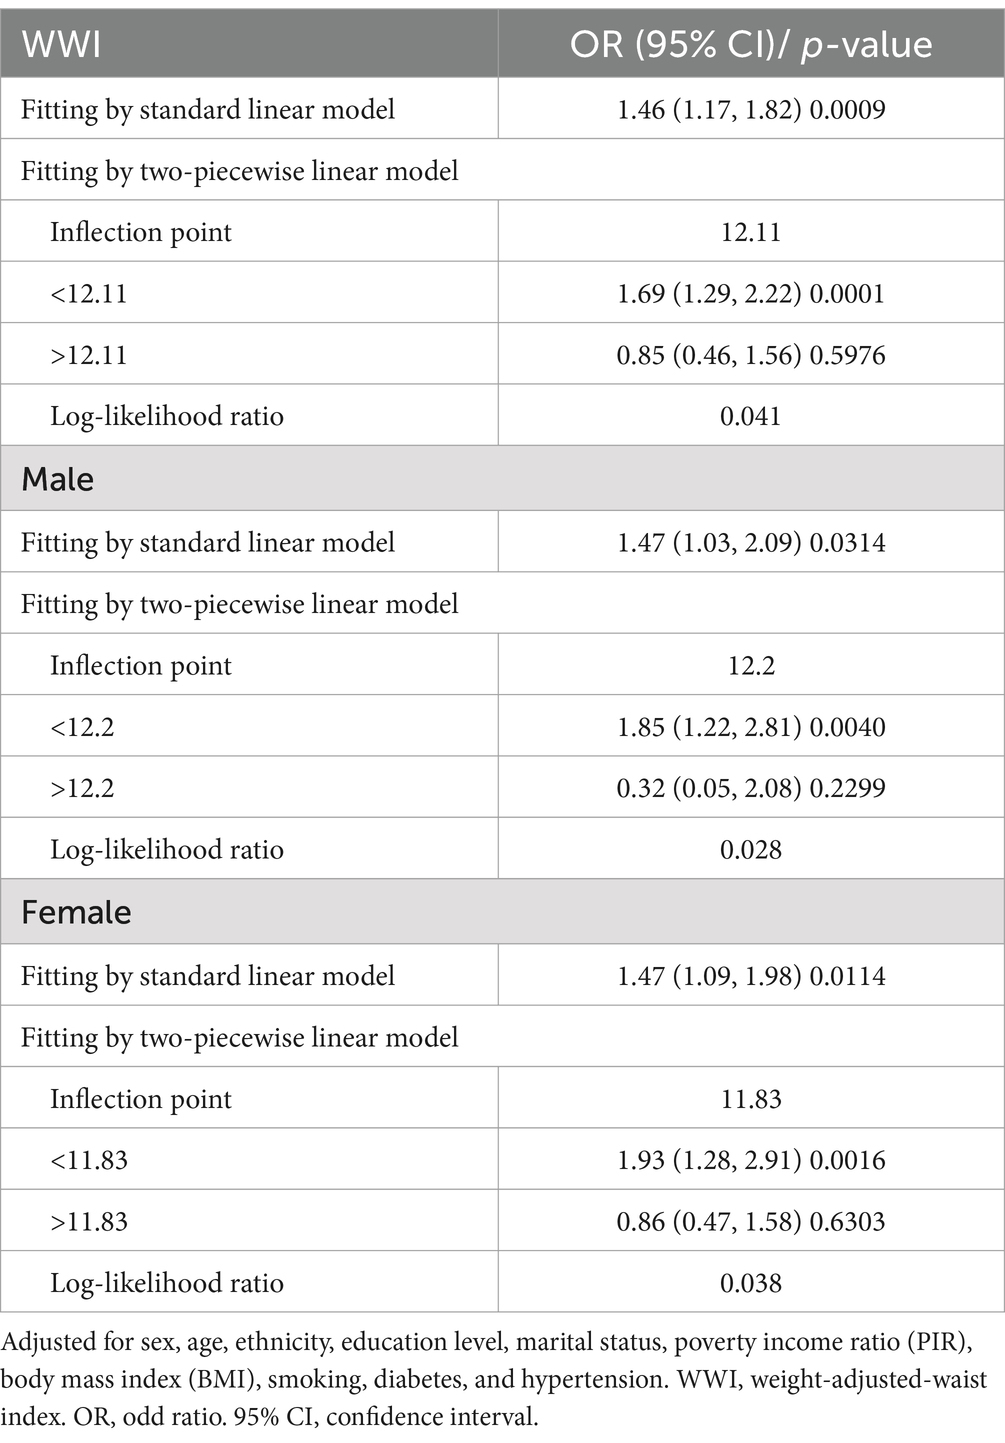
Table 3. Threshold effect analyses of the WWI on AMD.
In addition, considering the WHtR and WC indices, the associations between the WHtR or WC and AMD across the different sex groups were assessed using spline smoothing, as shown in Supplementary Figures 1, 2.
Stratified by multivariable adjustments, subgroup analyses and interaction tests were conducted to further explore potential covariates influencing the association between the WWI and AMD prevalence across the various population groups (Table 4). The results revealed that the correlation between the WWI and AMD remained consistent across all stratified subgroups (all p for interaction >0.05). Considering the correlation between the WHtR, WC, and BMI with AMD, additional subgroup analyses are detailed in Supplementary Table 3. The results showed that the associations remained consistent across the specific subgroups based on age and sex (all p for interaction >0.05).
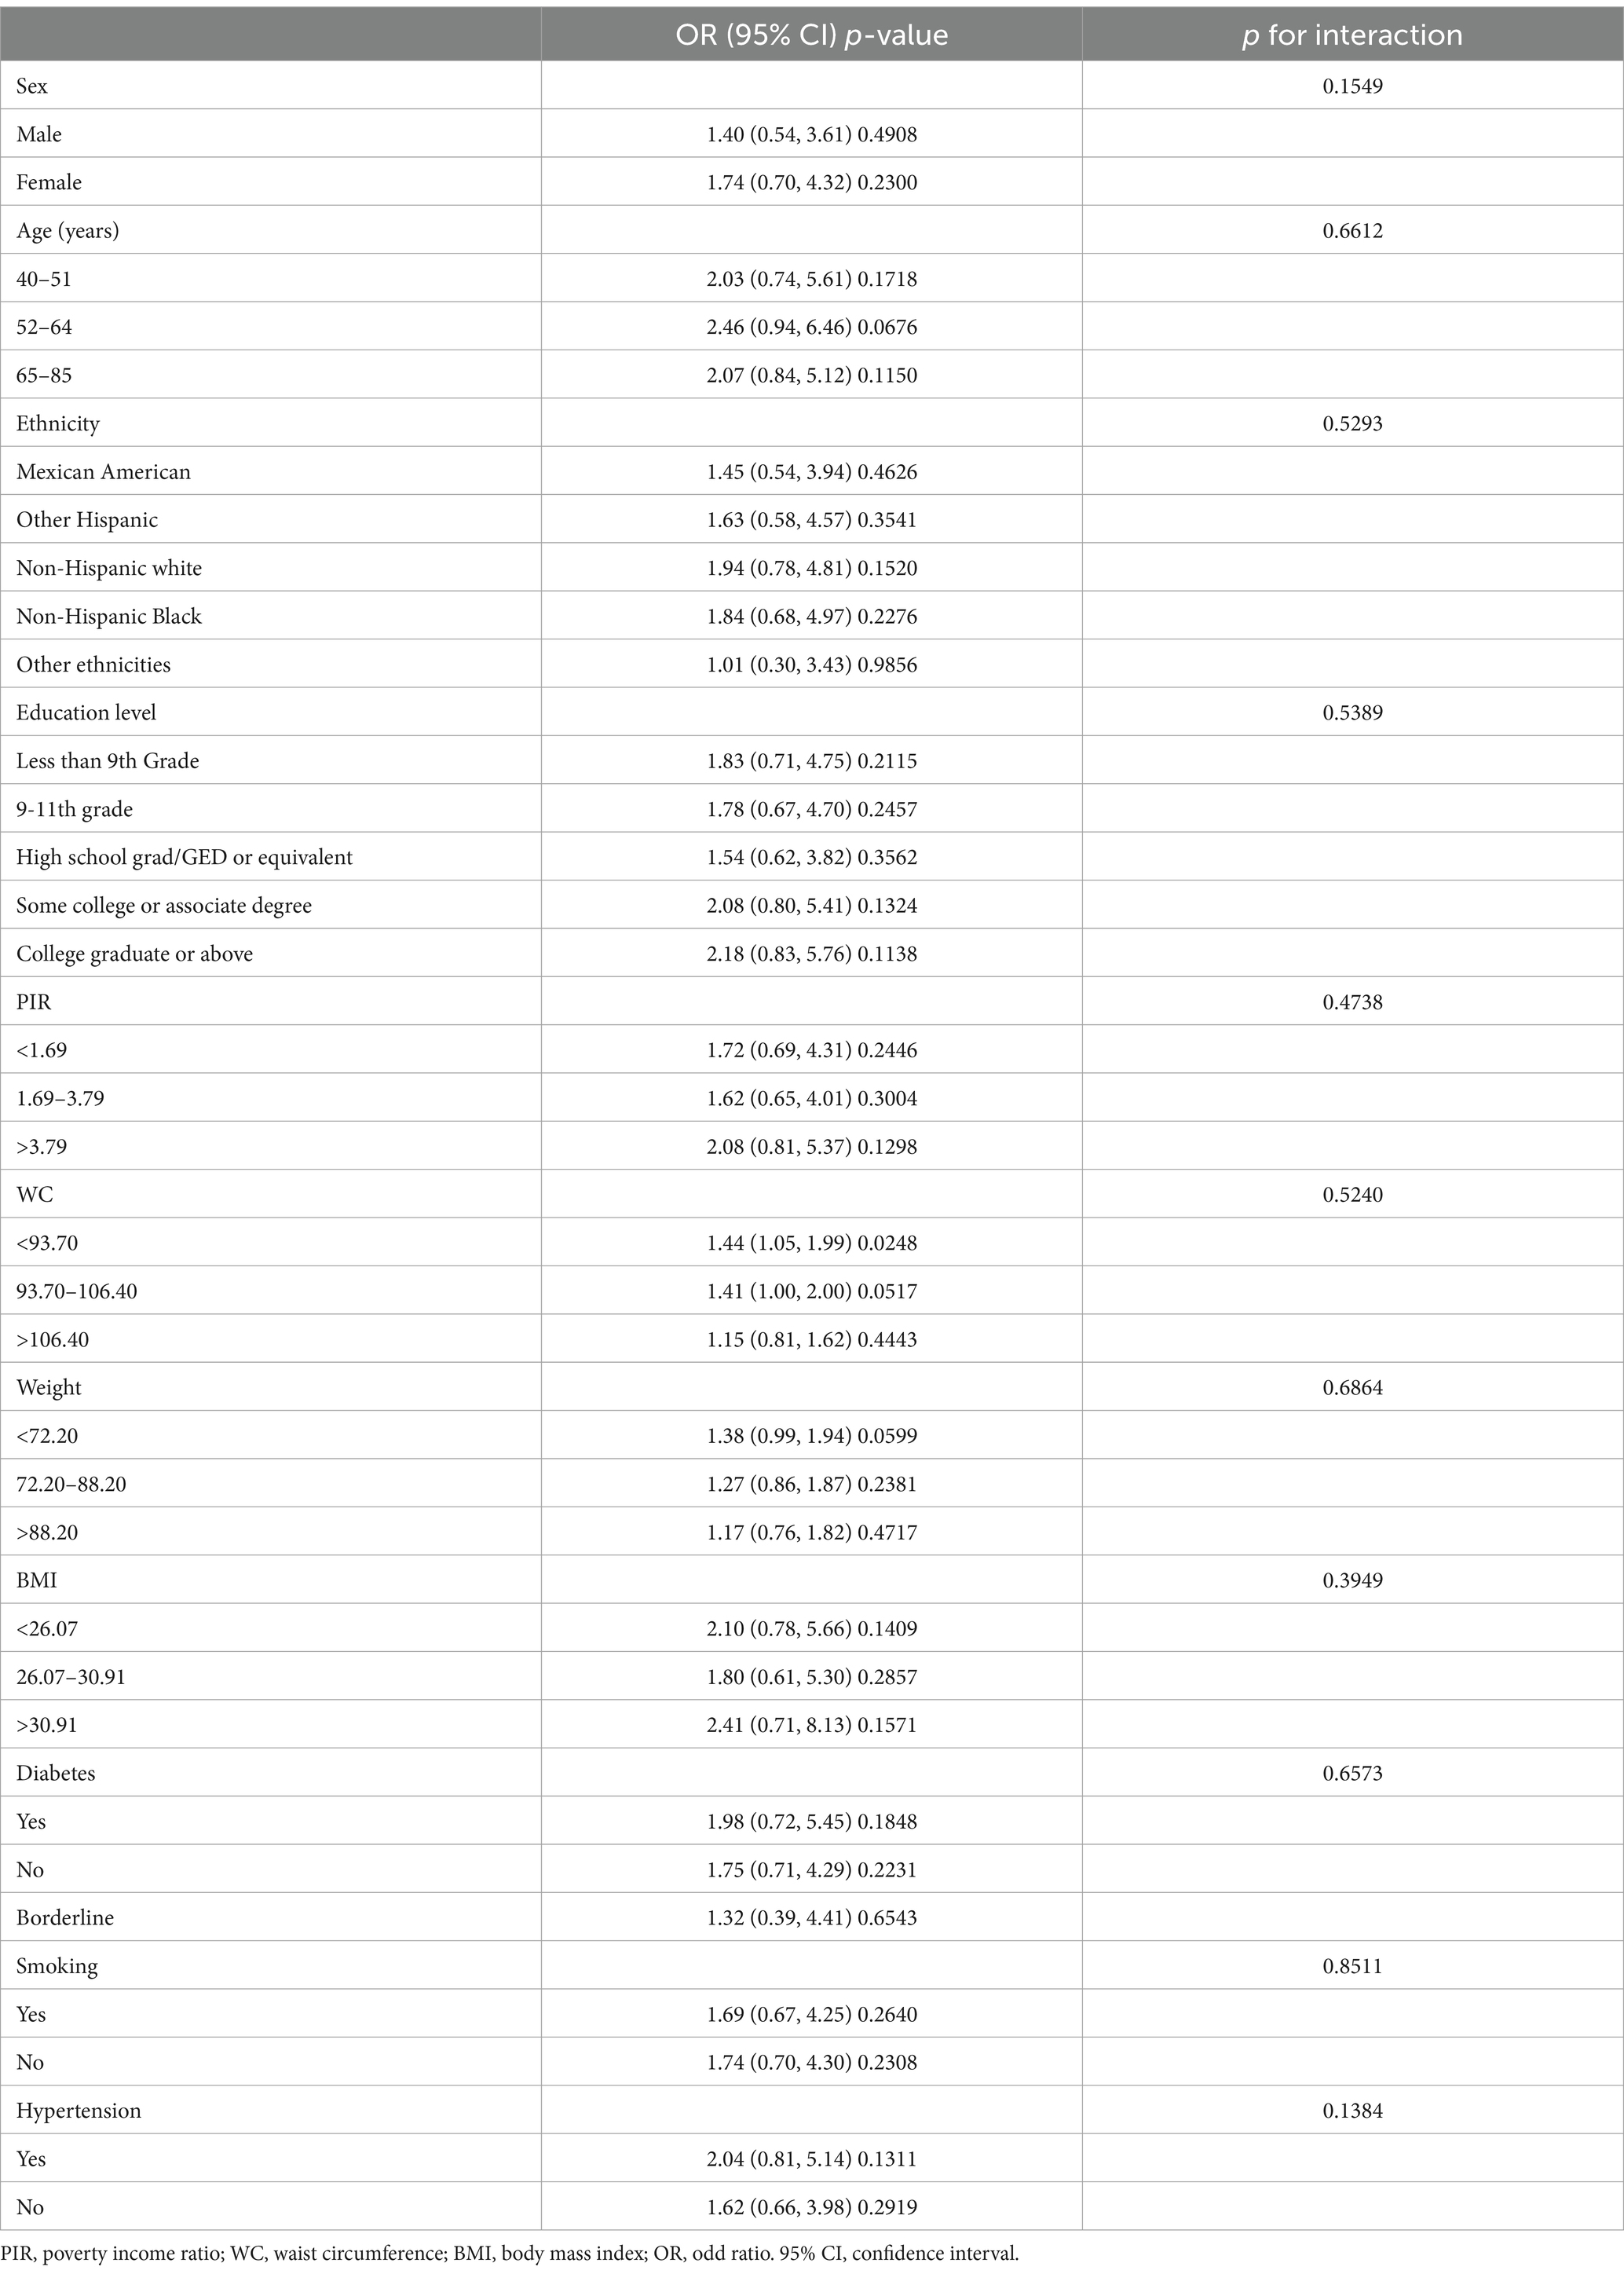
Table 4. Subgroup analyses of the association between the WWI and AMD.
Through receiver operating characteristic (ROC) curve analysis, the predictive power of the WWI for AMD was tested and compared with other obesity assessment indicators. For AMD incidence, the corresponding area under the curve (AUC) values in the model were as follows: WWI, 0.625; weight, 0.560; BMI, 0.530; and WC, 0.508. The results indicated that the WWI had a greater capability to identify AMD risk compared to BMI, WC, and weight (Figure 3). In examining the WHtR index, the ROC curves are depicted in Supplementary Figure 3. The AUC value for the WHtR shown in this Supplementary Figure 3 was 0.537, which was lower than the value for the WWI. This suggests that the WWI may be regarded as a more effective and valuable obesity indicator for AMD compared to other central obesity indices.

Figure 3. ROC curves between the different anthropometric indices and AMD. ROC, receiver operating characteristic curve; AUC, area under the curve; AMD, age-related macular degeneration; WWI, weight-adjusted waist index; BMI, Body mass index; WC, waist circumference.
This cross-sectional study showed that the WWI had a significant positive non-linear relationship with AMD incidence. The subgroup analyses by sex revealed consistent non-linear connections between the WWI and AMD in both groups.
As the global prevalence of obesity and the incidence of obesity-related diseases rise, the associated economic burden on healthcare continues to increase (32). The degree of obesity is currently evaluated using an increasing number of new indicators. Traditional anthropometric methods used to measure obesity, including BMI and WC, while convenient to obtain, have difficulty distinguishing between muscle mass and adipose tissue (42). Consequently, numerous studies related to BMI have theorized the “obesity paradox” (43, 44). This paradox suggests that individuals who are obese or overweight may have better prognoses than the average-weight population to some extent (45). This is in line with a population-based study in Korea, which found that non-overweight status, often regarded as a positive health indicator, was detrimentally associated with AMD (46). These inverse associations with obesity, known as the obesity paradox, have also been observed in other diseases (47). A population-based study conducted on diabetic patients in Taiwan indicated that this observed phenomenon was predominantly associated with non-cancer mortality, implying a survival advantage among obese individuals (48). Several plausible explanations are offered for these adverse correlations. First, the aging process tends to result in a selective group of non-obese individuals, given that mortality rates are higher among obese individuals compared to non-obese populations (49). Secondly, ethnic variations may mediate the correlation between obesity and AMD, as previously noted (50, 51). In addition, a study involving white individuals found that the relationship between the two differed by sex (52).
Gradually, a new obesity index called the WWI was introduced in 2018 and was deemed to more accurately reflect the morbidity and mortality associated with obese-related diseases (53). For instance, Kim et al. (36) explored a positive relationship between the WWI and belly fat accumulation and a negative relationship between the WWI and abdominal muscle mass, which were not affected by ethnicity. While body weight has always reflected fat distribution and adiposity in adults due to the stability of height, many studies have shown that central obesity, especially fat accumulation in deep subcutaneous tissues, is a more representative indicator. The WWI, which combines weight and WC, serves as an integrated index reflecting body composition and better representing physical conditions. A high WWI often indicates that individuals with a larger WC have greater fat mass and proportionally lower muscle mass (54). In addition, inflammatory reactions and metabolic disorders are mostly caused by central obesity (55, 56). In the context of assessing abdominal obesity and associated health risks, WC has been identified as a significant predictor of cardiometabolic risk in previous studies (57). In Colombian older adults, WC demonstrated moderate discriminative ability in detecting type 2 diabetes mellitus in the elderly population (58). Interventions aimed at reducing central obesity, as measured by WC, may be more effective in preventing severe metabolic disorders, including myocardial infarction (59). The use of the WHtR for the detection of abdominal obesity and its associated health risks was first proposed in the mid-1990s (60). A multi-ethnic study indicated that the WHtR is superior to both WC and BMI in identifying cardiometabolic risk factors such as hypertension and diabetes (61). However, similar to BMI, both the WHtR and WC are limited in their ability to differentiate and quantify the proportions of muscle and fat in the human body, and individual differences exist greatly. A recent study has increasingly demonstrated that the WWI is a more promising indicator than WC, BMI, and the WHtR for diagnosing diabetes and cardiovascular disease related to adiposity (62). In brief, it is credible to use the WWI as a better predictive tool for obesity (32).
The study demonstrated that the WWI was positively associated with AMD prevalence after adjusting for all confounders. This result aligns with those of previous studies, such as the Age-Related Eye Disease Study (AREDS), which found that larger weight gains were related to a higher risk of AMD (63). One possible reason is that excessive caloric intake increases the risk of AMD, as it may induce oxidative stress reactions in the eyes, damaging the retina (64). Similarly, obesity was found to be a pro-inflammatory state, contributing to the chronic inflammatory response of AMD (65). Previous studies have confirmed that both generalized and abdominal obesity are associated with AMD (66). Zhang et al. (67) summarized prospective studies on the correlation between obesity and AMD. They elaborated that overweight may be a potential inducement for the onset of AMD. In some studies, the secretion of pro-inflammatory stimuli, such as monocyte chemoattractant protein-1 and tumor necrosis factor-α, was significantly elevated in obesity groups, triggering monocyte migration and infiltration, which led to retinal pigment epithelial dysfunction that produced AMD lesions (68, 69). At the molecular level of the WWI-AMD link, various classes of lipid and lipoprotein metabolism have been implicated in the pathogenesis of AMD (70). Given that multiple cholesterol-related genes serve as risk factors for AMD, the cholesterol-AMD link is robust, supported by evidence such as elevated cholesterol content in drusen, the aging of Bruch’s membrane, and the recent identification of subretinal lesions (71).
In contrast to previous studies, this present study used the WWI as a marker to assess the correlation between obesity and AMD, investigating the association between the WWI and AMD across different populations by subgroups. Specifically, the WWI-AMD link revealed the same positive non-linear relationship in both sex groups. Generally, female individuals tend to store fat primarily in peripheral areas, such as the subcutaneous tissues of the buttocks, thighs, and limbs, giving them a pear-shaped body. In contrast, obese male individuals typically accumulate more visceral fat (72). Unlike what is typically observed, this study indicated that the female individuals were as susceptible to central obesity as the male individuals, which aligns with findings from some other studies (73–75). The causes of this discrepancy may be related to the factors listed below. Early evidence showed that female individuals had a higher mean WWI than male individuals (54). This suggested that female individuals had a worse body composition than men, contributing to this positive association. In addition, individual differences in this survey may have influenced the results, particularly since the female population exhibited a higher proportion of central fat, similar to the male group. Furthermore, female individuals may be more focused on diet and external factors, although individual variations in estrogen and hormone metabolism could offer protective benefits.
There are several advantages to this study. First, all the data incorporated were derived from the NHANES database, which has a large sample size and represents international diversity. In addition, it is the first cross-sectional study to examine the relationship between the WWI and AMD. However, there are some limitations as well. First, a definite causal association between the WWI and AMD was difficult to establish given the cross-sectional nature of the study. Second, since this data survey was conducted among the United States population, it remains uncertain whether similar conclusions can be drawn for other countries and ethnicities. Third, although many important covariates were adjusted for, there is no guarantee that residual variables not included would have had an impact on the results. Finally, due to the limitations of AMD’s investigable scope, relatively old data had to be utilized, which limited its timeliness and impacted the current trends.
In summary, higher WWI was associated with an increased prevalence of AMD in this study. The research underscores the potential of the WWI as a reliable predictive biomarker for AMD, with spline smoothing analyses confirming a non-linear positive relationship between the WWI and AMD prevalence. These findings emphasize the significance of early prediction and intervention for AMD in the general population. Nonetheless, future research should prioritize investigating diverse racial groups, conducting longitudinal studies to establish cause-and-effect relationships, and potentially utilizing intelligent ophthalmology (IO) technology to explore molecular mechanisms in greater depth, as the pathophysiology of AMD warrants further exploration (76).
The datasets presented in this study can be found in online repositories. The names of the repository/repositories and accession number(s) can be found at: https://www.cdc.gov/nchs/nhanes/.
The studies involving humans were approved by the National Center for Health Statistics (NCHS) in the USA. The studies were conducted in accordance with the local legislation and institutional requirements. Written informed consent for participation in this study was provided by the participants’ legal guardians/next of kin. Written informed consent was obtained from the individual(s) for the publication of any potentially identifiable images or data included in this article.
YW: Writing – original draft, Writing – review & editing. YL: Data curation, Formal analysis, Writing – review & editing. ZJ: Data curation, Formal analysis, Writing – review & editing. XC: Methodology, Project administration, Writing – review & editing. HL: Methodology, Project administration, Writing – review & editing. YZ: Investigation, Software, Writing – review & editing. GL: Supervision, Validation, Visualization, Writing – review & editing.
The author(s) declare that financial support was received for the research, authorship, and/or publication of this article. This study was supported by a grant from National Natural Science Foundation of China (grant number 81774369), Natural Science Foundation of Fujian Province, China (grant number 2023J01852), Fujian Major Research Grants for Young and Middle-aged Health Professionals (grant number 2021ZQNZD012), and Special Project of Fujian University of Traditional Chinese Medicine (X2022018-SP).
The authors declare that the research was conducted in the absence of any commercial or financial relationships that could be construed as a potential conflict of interest.
The authors declare that no Gen AI was used in the creation of this manuscript.
All claims expressed in this article are solely those of the authors and do not necessarily represent those of their affiliated organizations, or those of the publisher, the editors and the reviewers. Any product that may be evaluated in this article, or claim that may be made by its manufacturer, is not guaranteed or endorsed by the publisher.
The Supplementary material for this article can be found online at: https://www.frontiersin.org/articles/10.3389/fmed.2025.1552978/full#supplementary-material
1. Li, K, Liu, J, Li, X, Liu, X, Hu, P, and He, M. Association of EPA and DHA with age-related macular degeneration: a cross-sectional study from NHANES. Front Med. (2024) 11:1440479. doi: 10.3389/fmed.2024.1440479
2. Mitchell, P, Liew, G, Gopinath, B, and Wong, TY. Age-related macular degeneration. Lancet. (2018) 392:1147–59. doi: 10.1016/S0140-6736(18)31550-2
3. Guymer, RH, and Campbell, TG. Age-related macular degeneration. Lancet. (2023) 401:1459–72. doi: 10.1016/S0140-6736(22)02609-5
4. Bernasconi, AA, Wiest, MM, Lavie, CJ, Milani, RV, and Laukkanen, JA. Effect of Omega-3 dosage on cardiovascular outcomes: an updated Meta-analysis and Meta-regression of interventional trials. Mayo Clin Proc. (2021) 96:304–13. doi: 10.1016/j.mayocp.2020.08.034
5. Wong, WL, Su, X, Li, X, Cheung, CM, Klein, R, Cheng, CY, et al. Global prevalence of age-related macular degeneration and disease burden projection for 2020 and 2040: a systematic review and meta-analysis. Lancet Glob Health. (2014) 2:e106–16. doi: 10.1016/S2214-109X(13)70145-1
6. Chowdhury, R, Warnakula, S, Kunutsor, S, Crowe, F, Ward, HA, Johnson, L, et al. Association of dietary, circulating, and supplement fatty acids with coronary risk: a systematic review and meta-analysis. Ann Intern Med. (2014) 160:398–406. doi: 10.7326/M13-1788
7. Klein, R, Cruickshanks, KJ, Myers, CE, Sivakumaran, TA, Iyengar, SK, Meuer, SM, et al. The relationship of atherosclerosis to the 10-year cumulative incidence of age-related macular degeneration: the beaver dam studies. Ophthalmology. (2013) 120:1012–9. doi: 10.1016/j.ophtha.2012.11.003
8. Pan, Y, and Iwata, T. Role of ARMS2/HTRA1 risk alleles in the pathogenesis of neovascular age-related macular degeneration. Taiwan J Ophthalmol. (2024) 14:531–9. doi: 10.4103/tjo.TJO-D-23-00152
9. Figueiredo, I, Farinha, C, Barreto, P, Coimbra, R, Pereira, P, Marques, JP, et al. Nutritional genomics: implications for age-related macular degeneration. Nutrients. (2024) 16:4124. doi: 10.3390/nu16234124
10. Tang, S, Yang, J, Xiao, B, Wang, Y, Lei, Y, Lai, D, et al. Aberrant lipid metabolism and complement activation in age-related macular degeneration. Invest Ophthalmol Vis Sci. (2024) 65:20. doi: 10.1167/iovs.65.12.20
11. Tseng, CH. The risk of age-related macular degeneration is reduced in type 2 diabetes patients who use metformin. Pharmaceuticals. (2023) 16:224. doi: 10.3390/ph16020224
12. Chin-Hsiao, T. Metformin and the risk of dementia in type 2 diabetes patients. Aging Dis. (2019) 10:37–48. doi: 10.14336/AD.2017.1202
13. Tseng, CH. Metformin and risk of hypertension in Taiwanese patients with type 2 diabetes mellitus. J Am Heart Assoc. (2018) 7:e008860. doi: 10.1161/JAHA.118.008860
14. Tseng, CH. Metformin use is associated with a lower risk of hospitalization for heart failure in patients with type 2 diabetes mellitus: a retrospective cohort analysis. J Am Heart Assoc. (2019) 8:e011640. doi: 10.1161/JAHA.118.011640
15. Allan, KC, Joo, JH, Kim, S, Shaia, J, Kaelber, DC, Singh, R, et al. Glucagon-like Peptide-1 receptor agonist impact on chronic ocular disease including age-related macular degeneration. Ophthalmology. (2025) S0161-6420:70–3. doi: 10.1016/j.ophtha.2025.01.016
16. Hsu, MY, Luo, KS, Chou, CC, Lin, YH, Hung, YC, Chuang, WL, et al. Association between sodium-glucose cotransporter-2 (SGLT2) inhibitors and macular degeneration in patients with diabetes: a nationwide population-based study in Taiwan. Acta Diabetol. (2024) 61:1161–8. doi: 10.1007/s00592-024-02303-3
17. Lu, J, He, Y, Du, Y, Zhao, L, Wu, P, Shu, Q, et al. Atorvastatin alleviates age-related macular degeneration via AIM2-regulated Pyroptosis. Inflammation. (2024). doi: 10.1007/s10753-024-02179-z
18. Vermeulen, J, Mhmud, H, Vergroesen, J, et al. Investigating the association between cardiovascular disease, hypertension and age-related macular degeneration stages within the European eye epidemiology (E3) consortium. Invest Ophthalmol Vis Sci. (2024) 65:1343.
19. Lee, H, Han, KD, and Shin, J. Association between glycemic status and age-related macular degeneration: a nationwide population-based cohort study. Diabetes Metab. (2023) 49:101442. doi: 10.1016/j.diabet.2023.101442
20. Fan, Q, Maranville, JC, Fritsche, L, Sim, X, Cheung, CMG, Chen, LJ, et al. HDL-cholesterol levels and risk of age-related macular degeneration: a multiethnic genetic study using Mendelian randomization. Int J Epidemiol. (2017) 46:1891–902. doi: 10.1093/ije/dyx189
21. Cardarelli, WJ, and Smith, RA. Managed care implications of age-related ocular conditions. Am J Manag Care. (2013) 19:S85–91.
22. Heymsfield, SB, and Wadden, TA. Mechanisms, pathophysiology, and Management of Obesity. N Engl J Med. (2017) 376:254–66. doi: 10.1056/NEJMra1514009
23. Ward, ZJ, Bleich, SN, Cradock, AL, Barrett, JL, Giles, CM, Flax, C, et al. Projected U.S. state-level prevalence of adult obesity and severe obesity. N Engl J Med. (2019) 381:2440–50. doi: 10.1056/NEJMsa1909301
24. Williams, EP, Mesidor, M, Winters, K, Dubbert, PM, and Wyatt, SB. Overweight and obesity: prevalence, consequences, and causes of a growing public health problem. Curr Obes Rep. (2015) 4:363–70. doi: 10.1007/s13679-015-0169-4
25. Guh, DP, Zhang, W, Bansback, N, Amarsi, Z, Birmingham, CL, and Anis, AH. The incidence of co-morbidities related to obesity and overweight: a systematic review and meta-analysis. BMC Public Health. (2009) 9:88. doi: 10.1186/1471-2458-9-88
26. Wallace, AS, Chang, AR, Shin, JI, Reider, J, Echouffo-Tcheugui, JB, Grams, ME, et al. Obesity and chronic kidney disease in US adults with type 1 and type 2 diabetes mellitus. J Clin Endocrinol Metab. (2022) 107:1247–56. doi: 10.1210/clinem/dgab927
27. Faulkner, JL. Obesity-associated cardiovascular risk in women: hypertension and heart failure. Clin Sci (Lond). (2021) 135:1523–44. doi: 10.1042/CS20210384
28. Age-Related Eye Disease Study Research Group. Risk factors associated with age-related macular degeneration. A case-control study in the age-related eye disease study: age-related eye disease study report number 3. Ophthalmology. (2000) 107:2224–32. doi: 10.1016/s0161-6420(00)00409-7
29. Hogg, RE, Woodside, JV, Gilchrist, SE, Graydon, R, Fletcher, AE, Chan, W, et al. Cardiovascular disease and hypertension are strong risk factors for choroidal neovascularization. Ophthalmology. (2008) 115:1046–1052.e2. doi: 10.1016/j.ophtha.2007.07.031
30. Simati, S, Kokkinos, A, Dalamaga, M, and Argyrakopoulou, G. Obesity paradox: fact or fiction? Curr Obes Rep. (2023) 12:75–85. doi: 10.1007/s13679-023-00497-1
31. Tseng, CH, Chong, CK, Chan, TT, Bai, CH, You, SL, Chiou, HY, et al. Optimal anthropometric factor cutoffs for hyperglycemia, hypertension and dyslipidemia for the Taiwanese population. Atherosclerosis. (2010) 210:585–9. doi: 10.1016/j.atherosclerosis.2009.12.015
32. Li, X, Huang, Y, and Chen, M. Correlation of weight-adjusted waist index with diabetic retinopathy in US adults aged ≥ 40 years: the NHANES 2005-2008. Sci Rep. (2024) 14:19369. doi: 10.1038/s41598-024-69404-5
33. Cai, S, Zhou, L, Zhang, Y, Cheng, B, Zhang, A, Sun, J, et al. Association of the Weight-Adjusted-Waist Index with Risk of all-cause mortality: a 10-year follow-up study. Front Nutr. (2022) 9:894686. doi: 10.3389/fnut.2022.894686
34. Cao, S, Hu, X, Shao, Y, Wang, Y, Tang, Y, Ren, S, et al. Relationship between weight-adjusted-waist index and erectile dysfunction in the United State: results from NHANES 2001-2004. Front Endocrinol. (2023) 14:1128076. doi: 10.3389/fendo.2023.1128076
35. Ye, J, Hu, Y, Chen, X, Yin, Z, Yuan, X, Huang, L, et al. Association between the weight-adjusted waist index and stroke: a cross-sectional study. BMC Public Health. (2023) 23:1689. doi: 10.1186/s12889-023-16621-8
36. Kim, NH, Park, Y, Kim, NH, and Kim, SG. Weight-adjusted waist index reflects fat and muscle mass in the opposite direction in older adults. Age Ageing. (2021) 50:780–6. doi: 10.1093/ageing/afaa208
37. Kim, JY, Choi, J, Vella, CA, Criqui, MH, Allison, MA, and Kim, NH. Associations between weight-adjusted waist index and abdominal fat and muscle mass: multi-ethnic study of atherosclerosis. Diabetes Metab J. (2022) 46:747–55. doi: 10.4093/dmj.2021.0294
38. Klein, R, Chou, CF, Klein, BE, Zhang, X, Meuer, SM, and Saaddine, JB. Prevalence of age-related macular degeneration in the US population. Arch Ophthalmol. (2011) 129:75–80. doi: 10.1001/archophthalmol.2010.318
39. Centers for Disease Control and Prevention. National health and nutrition examination survey digital grading protocol. Available online at: http://www.cdc.gov/nchs/data/nhanes/nhanes_05_06/NHANES_ophthamology_digital_grading_protocol.pdf (Accesssed September 16, 2024).
40. Klein, R, Meuer, SM, Moss, SE, Klein, BE, Neider, MW, and Reinke, J. Detection of age-related macular degeneration using a nonmydriatic digital camera and a standard film fundus camera. Arch Ophthalmol. (2004) 122:1642–6. doi: 10.1001/archopht.122.11.1642
41. Klein, R, Klein, BE, Knudtson, MD, Wong, TY, Cotch, MF, Liu, K, et al. Prevalence of age-related macular degeneration in 4 racial/ethnic groups in the multi-ethnic study of atherosclerosis. Ophthalmology. (2006) 113:373–80. doi: 10.1016/j.ophtha.2005.12.013
42. Romero-Corral, A, Somers, VK, Sierra-Johnson, J, Thomas, RJ, Collazo-Clavell, ML, Korinek, J, et al. Accuracy of body mass index in diagnosing obesity in the adult general population. Int J Obes. (2008) 32:959–66. doi: 10.1038/ijo.2008.11
43. Kim, NH, Lee, J, Kim, TJ, Kim, NH, Choi, KM, Baik, SH, et al. Body mass index and mortality in the general population and in subjects with chronic disease in Korea: a Nationwide cohort study (2002-2010). PLoS One. (2015) 10:e0139924. doi: 10.1371/journal.pone.0139924
44. Carnethon, MR, De Chavez, PJ, Biggs, ML, Lewis, CE, Pankow, JS, Bertoni, AG, et al. Association of weight status with mortality in adults with incident diabetes. JAMA. (2012) 308:581–90. doi: 10.1001/jama.2012.9282
45. Antonopoulos, AS, Oikonomou, EK, Antoniades, C, and Tousoulis, D. From the BMI paradox to the obesity paradox: the obesity-mortality association in coronary heart disease. Obes Rev. (2016) 17:989–1000. doi: 10.1111/obr.12440
46. Park, SJ, Lee, JH, Woo, SJ, Ahn, J, Shin, JP, Song, SJ, et al. Epidemiologic survey Committee of the Korean Ophthalmologic Society. Age-related macular degeneration: prevalence and risk factors from Korean National Health and nutrition examination survey, 2008 through 2011. Ophthalmology. (2014) 121:1756–65. doi: 10.1016/j.ophtha.2014.03.022
47. Clark, AL, Fonarow, GC, and Horwich, TB. Waist circumference, body mass index, and survival in systolic heart failure: the obesity paradox revisited. J Card Fail. (2011) 17:374–80. doi: 10.1016/j.cardfail.2011.01.009
48. Tseng, CH. Obesity paradox: differential effects on cancer and noncancer mortality in patients with type 2 diabetes mellitus. Atherosclerosis. (2013) 226:186–92. doi: 10.1016/j.atherosclerosis.2012.09.004
49. Allison, DB, Fontaine, KR, Manson, JE, Stevens, J, and Van Itallie, TB. Annual deaths attributable to obesity in the United States. JAMA. (1999) 282:1530–8. doi: 10.1001/jama.282.16.1530
50. Gatineau, M, and Mathrani, S. Ethnicity and obesity in the UK. Perspect Public Health. (2011) 131:159–60. doi: 10.1177/1757913911412478
51. Ma, RC, and Chan, JC. Type 2 diabetes in east Asians: similarities and differences with populations in Europe and the United States. Ann N Y Acad Sci. (2013) 1281:64–91. doi: 10.1111/nyas.12098
52. Adams, MK, Simpson, JA, Aung, KZ, Makeyeva, GA, Giles, GG, English, DR, et al. Abdominal obesity and age-related macular degeneration. Am J Epidemiol. (2011) 173:1246–55. doi: 10.1093/aje/kwr005
53. Ding, C, Shi, Y, Li, J, Li, M, Hu, L, Rao, J, et al. Association of weight-adjusted-waist index with all-cause and cardiovascular mortality in China: a prospective cohort study. Nutr Metab Cardiovasc Dis. (2022) 32:1210–7. doi: 10.1016/j.numecd.2022.01.033
54. Kim, KJ, Son, S, Kim, KJ, Kim, SG, and Kim, NH. Weight-adjusted waist as an integrated index for fat, muscle and bone health in adults. J Cachexia Sarcopenia Muscle. (2023) 14:2196–203. doi: 10.1002/jcsm.13302
55. Park, Y, Kim, NH, Kwon, TY, and Kim, SG. A novel adiposity index as an integrated predictor of cardiometabolic disease morbidity and mortality. Sci Rep. (2018) 8:16753. doi: 10.1038/s41598-018-35073-4
56. Banerji, MA, Faridi, N, Atluri, R, Chaiken, RL, and Lebovitz, HE. Body composition, visceral fat, leptin, and insulin resistance in Asian Indian men. J Clin Endocrinol Metab. (1999) 84:137–44. doi: 10.1210/jcem.84.1.5371
57. Ross, R, Neeland, IJ, Yamashita, S, Shai, I, Seidell, J, Magni, P, et al. Waist circumference as a vital sign in clinical practice: a consensus statement from the IAS and ICCR working group on visceral obesity. Nat Rev Endocrinol. (2020) 16:177–89. doi: 10.1038/s41574-019-0310-7
58. Ramírez-Vélez, R, Pérez-Sousa, MA, González-Jiménez, E, Correa-Rodríguez, M, Calderón-González, JC, Dávila-Grisales, A, et al. Using different anthropometric indices of obesity as predictors for type 2 diabetes mellitus in older adults. Curr Probl Cardiol. (2025) 50:102924. doi: 10.1016/j.cpcardiol.2024.102924
59. Bagheri, M, Nouri, M, Kohanmoo, A, Homayounfar, R, and Akhlaghi, M. The influence of gender and waist circumference in the association of body fat with cardiometabolic diseases. BMC Nutr. (2025) 11:24. doi: 10.1186/s40795-024-00931-0
60. Ashwell, M, Lejeune, S, and McPherson, K. Ratio of waist circumference to height may be better indicator of need for weight management. BMJ. (1996) 312:377. doi: 10.1136/bmj.312.7027.377
61. Ashwell, M, Gunn, P, and Gibson, S. Waist-to-height ratio is a better screening tool than waist circumference and BMI for adult cardiometabolic risk factors: systematic review and meta-analysis. Obes Rev. (2012) 13:275–86. doi: 10.1111/j.1467-789X.2011.00952.x
62. Liu, S, Yu, J, Wang, L, Zhang, X, Wang, F, and Zhu, Y. Weight-adjusted waist index as a practical predictor for diabetes, cardiovascular disease, and non-accidental mortality risk. Nutr Metab Cardiovasc Dis. (2024) 34:2498–510. doi: 10.1016/j.numecd.2024.06.012
63. Clemons, TE, and Milton, RC. Klein R, Seddon JM, Ferris FL 3rd; age-related eye disease study research group. Risk factors for the incidence of advanced age-related macular degeneration in the age-related eye disease study (AREDS) AREDS report no. 19. Ophthalmology. (2005) 112:533–9. doi: 10.1016/j.ophtha.2004.10.047
64. Hirvelä, H, Luukinen, H, Läärä, E, Sc, L, and Laatikainen, L. Risk factors of age-related maculopathy in a population 70 years of age or older. Ophthalmology. (1996) 103:871–7. doi: 10.1016/s0161-6420(96)30593-9
65. Klein, BE, Klein, R, Lee, KE, and Jensen, SC. Measures of obesity and age-related eye diseases. Ophthalmic Epidemiol. (2001) 8:251–62. doi: 10.1076/opep.8.4.251.1612
66. Seddon, JM, Cote, J, Davis, N, and Rosner, B. Progression of age-related macular degeneration: association with body mass index, waist circumference, and waist-hip ratio. Arch Ophthalmol. (2003) 121:785–92. doi: 10.1001/archopht.121.6.785
67. Zhang, QY, Tie, LJ, Wu, SS, Lv, PL, Huang, HW, Wang, WQ, et al. Overweight, obesity, and risk of age-related macular degeneration. Invest Ophthalmol Vis Sci. (2016) 57:1276–83. doi: 10.1167/iovs.15-18637
68. Peeters, A, Magliano, DJ, Stevens, J, Duncan, BB, Klein, R, and Wong, TY. Changes in abdominal obesity and age-related macular degeneration: the atherosclerosis risk in communities study. Arch Ophthalmol. (2008) 126:1554–60. doi: 10.1001/archopht.126.11.1554
69. Charo, IF, and Taubman, MB. Chemokines in the pathogenesis of vascular disease. Circ Res. (2004) 95:858–66. doi: 10.1161/01.RES.0000146672.10582.17
70. van Leeuwen, EM, Emri, E, Merle, BMJ, Colijn, JM, Kersten, E, Cougnard-Gregoire, A, et al. A new perspective on lipid research in age-related macular degeneration. Prog Retin Eye Res. (2018) 67:56–86. doi: 10.1016/j.preteyeres.2018.04.006
71. Pikuleva, IA, and Curcio, CA. Cholesterol in the retina: the best is yet to come. Prog Retin Eye Res. (2014) 41:64–89. doi: 10.1016/j.preteyeres.2014.03.002
72. Dixon, AE, and Peters, U. The effect of obesity on lung function. Expert Rev Respir Med. (2018) 12:755–67. doi: 10.1080/17476348.2018.1506331
73. Wang, Y, Beydoun, MA, Min, J, Xue, H, Kaminsky, LA, and Cheskin, LJ. Has the prevalence of overweight, obesity and central obesity levelled off in the United States? Trends, patterns, disparities, and future projections for the obesity epidemic. Int J Epidemiol. (2020) 49:810–23. doi: 10.1093/ije/dyz273
74. Shri, N, Singh, S, and Singh, A. Prevalence and predictors of combined body mass index and waist circumference among Indian adults. Int J Public Health. (2023) 68:1605595. doi: 10.3389/ijph.2023.1605595
75. Malik, SK, Kouame, J, Gbane, M, Coulibaly, M, Ake, MD, and Ake, O. Prevalence of abdominal obesity and its correlates among adults in a peri-urban population of West Africa. AIMS Public Health. (2019) 6:334–44. doi: 10.3934/publichealth.2019.3.334
Keywords: weight-adjusted waist index, age-related macular degeneration, NHANES, obesity, non-linear association
Citation: Wu Y, Liu Y, Jiao Z, Chen X, Li H, Zhou Y and Liu G (2025) Association between the weight-adjusted waist index and age-related macular degeneration in US adults aged≥40 years: the NHANES 2005–2008. Front. Med. 12:1552978. doi: 10.3389/fmed.2025.1552978
Edited by:
Weihua Yang, Southern Medical University, ChinaReviewed by:
Chin-Hsiao Tseng, National Taiwan University, TaiwanCopyright © 2025 Wu, Liu, Jiao, Chen, Li, Zhou and Liu. This is an open-access article distributed under the terms of the Creative Commons Attribution License (CC BY). The use, distribution or reproduction in other forums is permitted, provided the original author(s) and the copyright owner(s) are credited and that the original publication in this journal is cited, in accordance with accepted academic practice. No use, distribution or reproduction is permitted which does not comply with these terms.
*Correspondence: Guanghui Liu, bGF0aW55QGdtYWlsLmNvbQ==
Disclaimer: All claims expressed in this article are solely those of the authors and do not necessarily represent those of their affiliated organizations, or those of the publisher, the editors and the reviewers. Any product that may be evaluated in this article or claim that may be made by its manufacturer is not guaranteed or endorsed by the publisher.
Research integrity at Frontiers
Learn more about the work of our research integrity team to safeguard the quality of each article we publish.