 Xiao Cao†
 Nian Fu
- Department of Gastroenterology, Hunan Provincial Clinical Research Center for Metabolic Associated Fatty Liver Diseases, The Affiliated Nanhua Hospital, Hengyang Medical School, University of South China, Hengyang, Hunan, China
Background: Effective biomarkers for the diagnosis of metabolic dysfunction-associated steatotic liver disease (MASLD) remain limited. This study aims to evaluate the potential of advanced glycation end products (AGEs) and their endogenous secretory receptor (esRAGE) as non-invasive biomarkers for diagnosing MASLD, to explore differences between obese and non-obese MASLD patients, and to develop a novel diagnostic model based on these biomarkers.
Methods: This study enrolled 341 participants, including 246 MASLD patients (118 non-obese, 128 obese) and 95 healthy controls. Serum AGEs and esRAGE levels were measured by ELISA. Key predictors were identified using the Lasso algorithm, and a diagnostic model was developed with logistic regression and visualized as nomograms. Diagnostic accuracy and utility were evaluated through the area under the curve (AUC), bootstrap validation, calibration curves, and decision curve analysis (DCA).
Results: Serum AGEs and esRAGE levels were significantly higher in MASLD patients compared to controls. Moreover, obese MASLD patients had higher esRAGE levels than non-obese ones, but no significant difference in AGEs levels was found. A diagnostic model incorporating age, WC, BMI, ALT, TG, HDL, AGEs, and esRAGE achieved an AUC of 0.963, with 94.3% sensitivity and 85.3% specificity. The AUC for bootstrap internal validation was 0.963 (95% CI: 0.944–0.982). Calibration curves showed strong predictive accuracy, and DCA demonstrated high net clinical benefit.
Conclusion: Serum AGEs and esRAGE serve as non-invasive biomarkers for distinguishing MASLD patients. We developed and validated diagnostic models for MASLD, offering valuable tools to identify at-risk populations and improve prevention and treatment strategies.
1 Introduction
Metabolic dysfunction-associated steatotic liver disease (MASLD) is the most widespread chronic liver disorder globally, impacting more than one-third of adults (1). Projections indicate that by 2040, the prevalence could exceed 50% of the adult population worldwide (2). Although liver biopsy remains the gold standard for diagnosing MASLD, enabling the classification of hepatic steatosis, fibrosis, and inflammation (3), it is invasive, carries risks of complications, and is limited by sampling variability and significant interobserver variability in pathology interpretation (4, 5). In this context, the development of simple, noninvasive tools for routine clinical use, including various serum-based scoring systems, has been proposed as viable alternatives, such as the fatty liver index (FLI) and the hepatic steatosis index (HSI) (6–9). While models like FLI and HSI are commonly used in MASLD screening, they have notable limitations, primarily because they rely heavily on traditional metabolic parameters (e.g., BMI, lipid levels, liver function indices) and are predominantly based on populations from Western countries (10, 11). Approximately 40% of the global MASLD population is categorized as non-obese (12). Patients with MASLD who are obese and those who are not have notable variations in their clinical and metabolic characteristics (13). This presents challenges in diagnosing MASLD using scoring systems based solely on clinical characteristics and basic serum markers. Therefore, identifying serum biomarkers with high discriminatory power for both non-obese and obese MASLD is essential. The “multiple- hit” hypothesis has recently emerged, proposing that various factors act simultaneously and synergistically to induce metabolic and molecular changes, driving the onset and progression of MASLD (14, 15). Within this framework, several studies have highlighted the significant role of advanced glycation end products (AGEs) in the pathogenesis of MASLD (16–18).
AGEs form through a non-enzymatic reaction between amine groups in proteins, lipids, nucleic acids, and carbonyl groups in reducing sugars (19). The receptor for advanced glycation end products (RAGE) is a transmembrane receptor that recognizes products of non-enzymatic glycation and protein oxidation (20). When AGEs bind to RAGE, it triggers various intracellular signaling pathways that enhance cytokine production. This cascade eventually results in lipid buildup in the liver, promoting steatosis and the development of MASLD (18, 21–23). Several studies suggest that AGEs may serve as potential plasma biomarkers for diagnosing MASLD (24, 25). The endogenous secretory receptor for advanced glycation end products (esRAGE) is a C-truncated splice variant of RAGE that functions as a decoy receptor for RAGE ligands, modulating RAGE signaling (26). Levels of circulating esRAGE can be utilized as a measure of RAGE generation in tissues (27), as well as a reaction to reduce RAGE-induced tissue damage (20, 26, 28). Thus, the aim of this study was to investigate the potential of AGEs and esRAGE as non-invasive biomarkers for MASLD, and to develop and evaluate a novel diagnostic model based on these biomarkers.
2 Materials and methods
2.1 Participants
Participants for this cross-sectional research were recruited from Nanhua Hospital, which is connected with Nanhua University, between January and September 2024. There were 246 patients with a diagnosis of MASLD (118 with non-obese MASLD and 128 with obese MASLD) and 95 healthy controls among the 341 people that were included. The MASLD diagnostic criteria were based on the Multi-Society Delphi Consensus Statement on New Nomenclature for Fatty Liver Disease (29). Inclusion criteria consisted of participants aged 18–75 years, with an ultrasound-confirmed diagnosis of fatty liver, exclusion of excessive alcohol consumption (≥210 g/week for men and ≥ 140 g/week for women), exclusion of other causes of fatty liver, and the presence of at least one component of metabolic syndrome. Patients with chronic inflammatory conditions were excluded. Cases with missing data were excluded from the analysis. MASLD patients were split into two groups: those who were non-obesity (BMI < 25 kg/m2) and those who were obese (BMI ≥ 25 kg/m2). The study was authorized by the Nanhua Hospital Ethics Committee at Nanhua University (approval code: 2024-Ky-232), and all participants gave signed informed consent. The research complied with the 1975 Declaration of Helsinki’s ethical guidelines.
2.2 Clinical and laboratory data collection
Body Mass Index (BMI), waist circumference (WC), and systolic blood pressure (SBP) from the right arm were among the anthropometric measurements that were gathered. Following a period of fasting lasting 12 h, blood samples were drawn. Hematological parameters, including white blood cells (WBC), neutrophils, monocytes, hemoglobin, and platelets, were assessed using an automatic blood cell analyzer at the Nanhua Hospital Laboratory, Nanhua University. Biochemical parameters, including albumin, fasting blood glucose (FPG), direct bilirubin (DB), bile acids (BA), alanine aminotransferase (ALT), aspartate aminotransferase (AST), total bilirubin (TB), uric acid (UA), urea nitrogen (BUN), creatinine, total cholesterol (TC), triglycerides (TG), high-density lipoprotein (HDL), low-density lipoprotein (LDL), sodium, and potassium, were measured using an automated biochemical analyzer.
2.3 Plasma AGEs and esRAGE
Serum samples were separated from fasting patients and kept at −80°C before analysis. Mlbio’s ELISA kit measured serum AGE and esRAGE levels. In these assays, undiluted serum samples were utilized, and the measurements were conducted following the manufacturer’s guidelines.
2.4 Statistical analysis
The quantitative data were non-normally distributed, as determined by the Shapiro-Wilk test. Quantitative data were presented as medians with interquartile ranges (P25, P75) and analyzed using the Mann-Whitney U test, whereas qualitative data were compared using the chi-square test. The correlation between AGEs, esRAGE, and clinical indicators were looked at using Spearman’s correlation coefficient. R 4.4.1 and SPSS version 28.0 were used for all statistics studies.
The predictors selected through the Lasso method for clinical modeling were first subjected to univariate logistic regression analysis to identify clinically significant variables. Construction of the final model using multiple logistic regression analysis. The area under the receiver operating characteristic (ROC) curve (AUC) was used to measure performance. With the help of the “caret” R package, internal validation was carried out using the 1,000-iteration Bootstrap resampling approach. ROC curves were constructed with the help of the “pROC” R package, and a nomogram was made with the help of the “rms” R package. The “rms” and “ResourceSelection” R packages were used to plot calibration curves. The “rmda” R packages was used to perform decision curve analysis (DCA), which evaluated the diagnostic model’s clinical usefulness. Common MASLD indices, including his (30), Korea National Health and Nutrition Examination Survey-derived nonalcoholic fatty liver disease score (K-NAFLD) (31), the NAFL Screening Score (NSS) (32), and the NAFLD Ridge Score (33), were calculated according to the methods described in the original publications.
3 Results
3.1 Association between AGEs and esRAGE and MASLD
Following stringent screening and exclusion standards, 341 people in all were included in the study: 246 patients with MASLD, of whom 118 were categorized as non-obese MASLD and 128 as obese MASLD, and 95 normal controls (Figure 1). The anthropometric and laboratory parameters of these participants are summarized in Table 1. The cohort included 159 men (46.6%) and 182 females (53.4%). The MASLD group had a considerably larger proportion of males than the normal control group (P < 0.001). The cohort’s median age was 54 years, and patients with MASLD were notably older than the normal controls (P < 0.001). Anthropometric measures showed that the MASLD group had substantially greater WC, BMI, and SBP than the controls (P < 0.001). Similarly, laboratory findings showed significantly higher levels of WBC, neutrophils, monocytes, hemoglobin, ALT, AST, UA, BUN, TC, TG, LDL, and FBG in MASLD patients (P < 0.05). Conversely, there was a substantial decrease in HDL values in the MASLD group (P < 0.05). The groups’ levels of platelets, albumin, TB, DB, BA, creatinine, sodium, and potassium did not differ much.
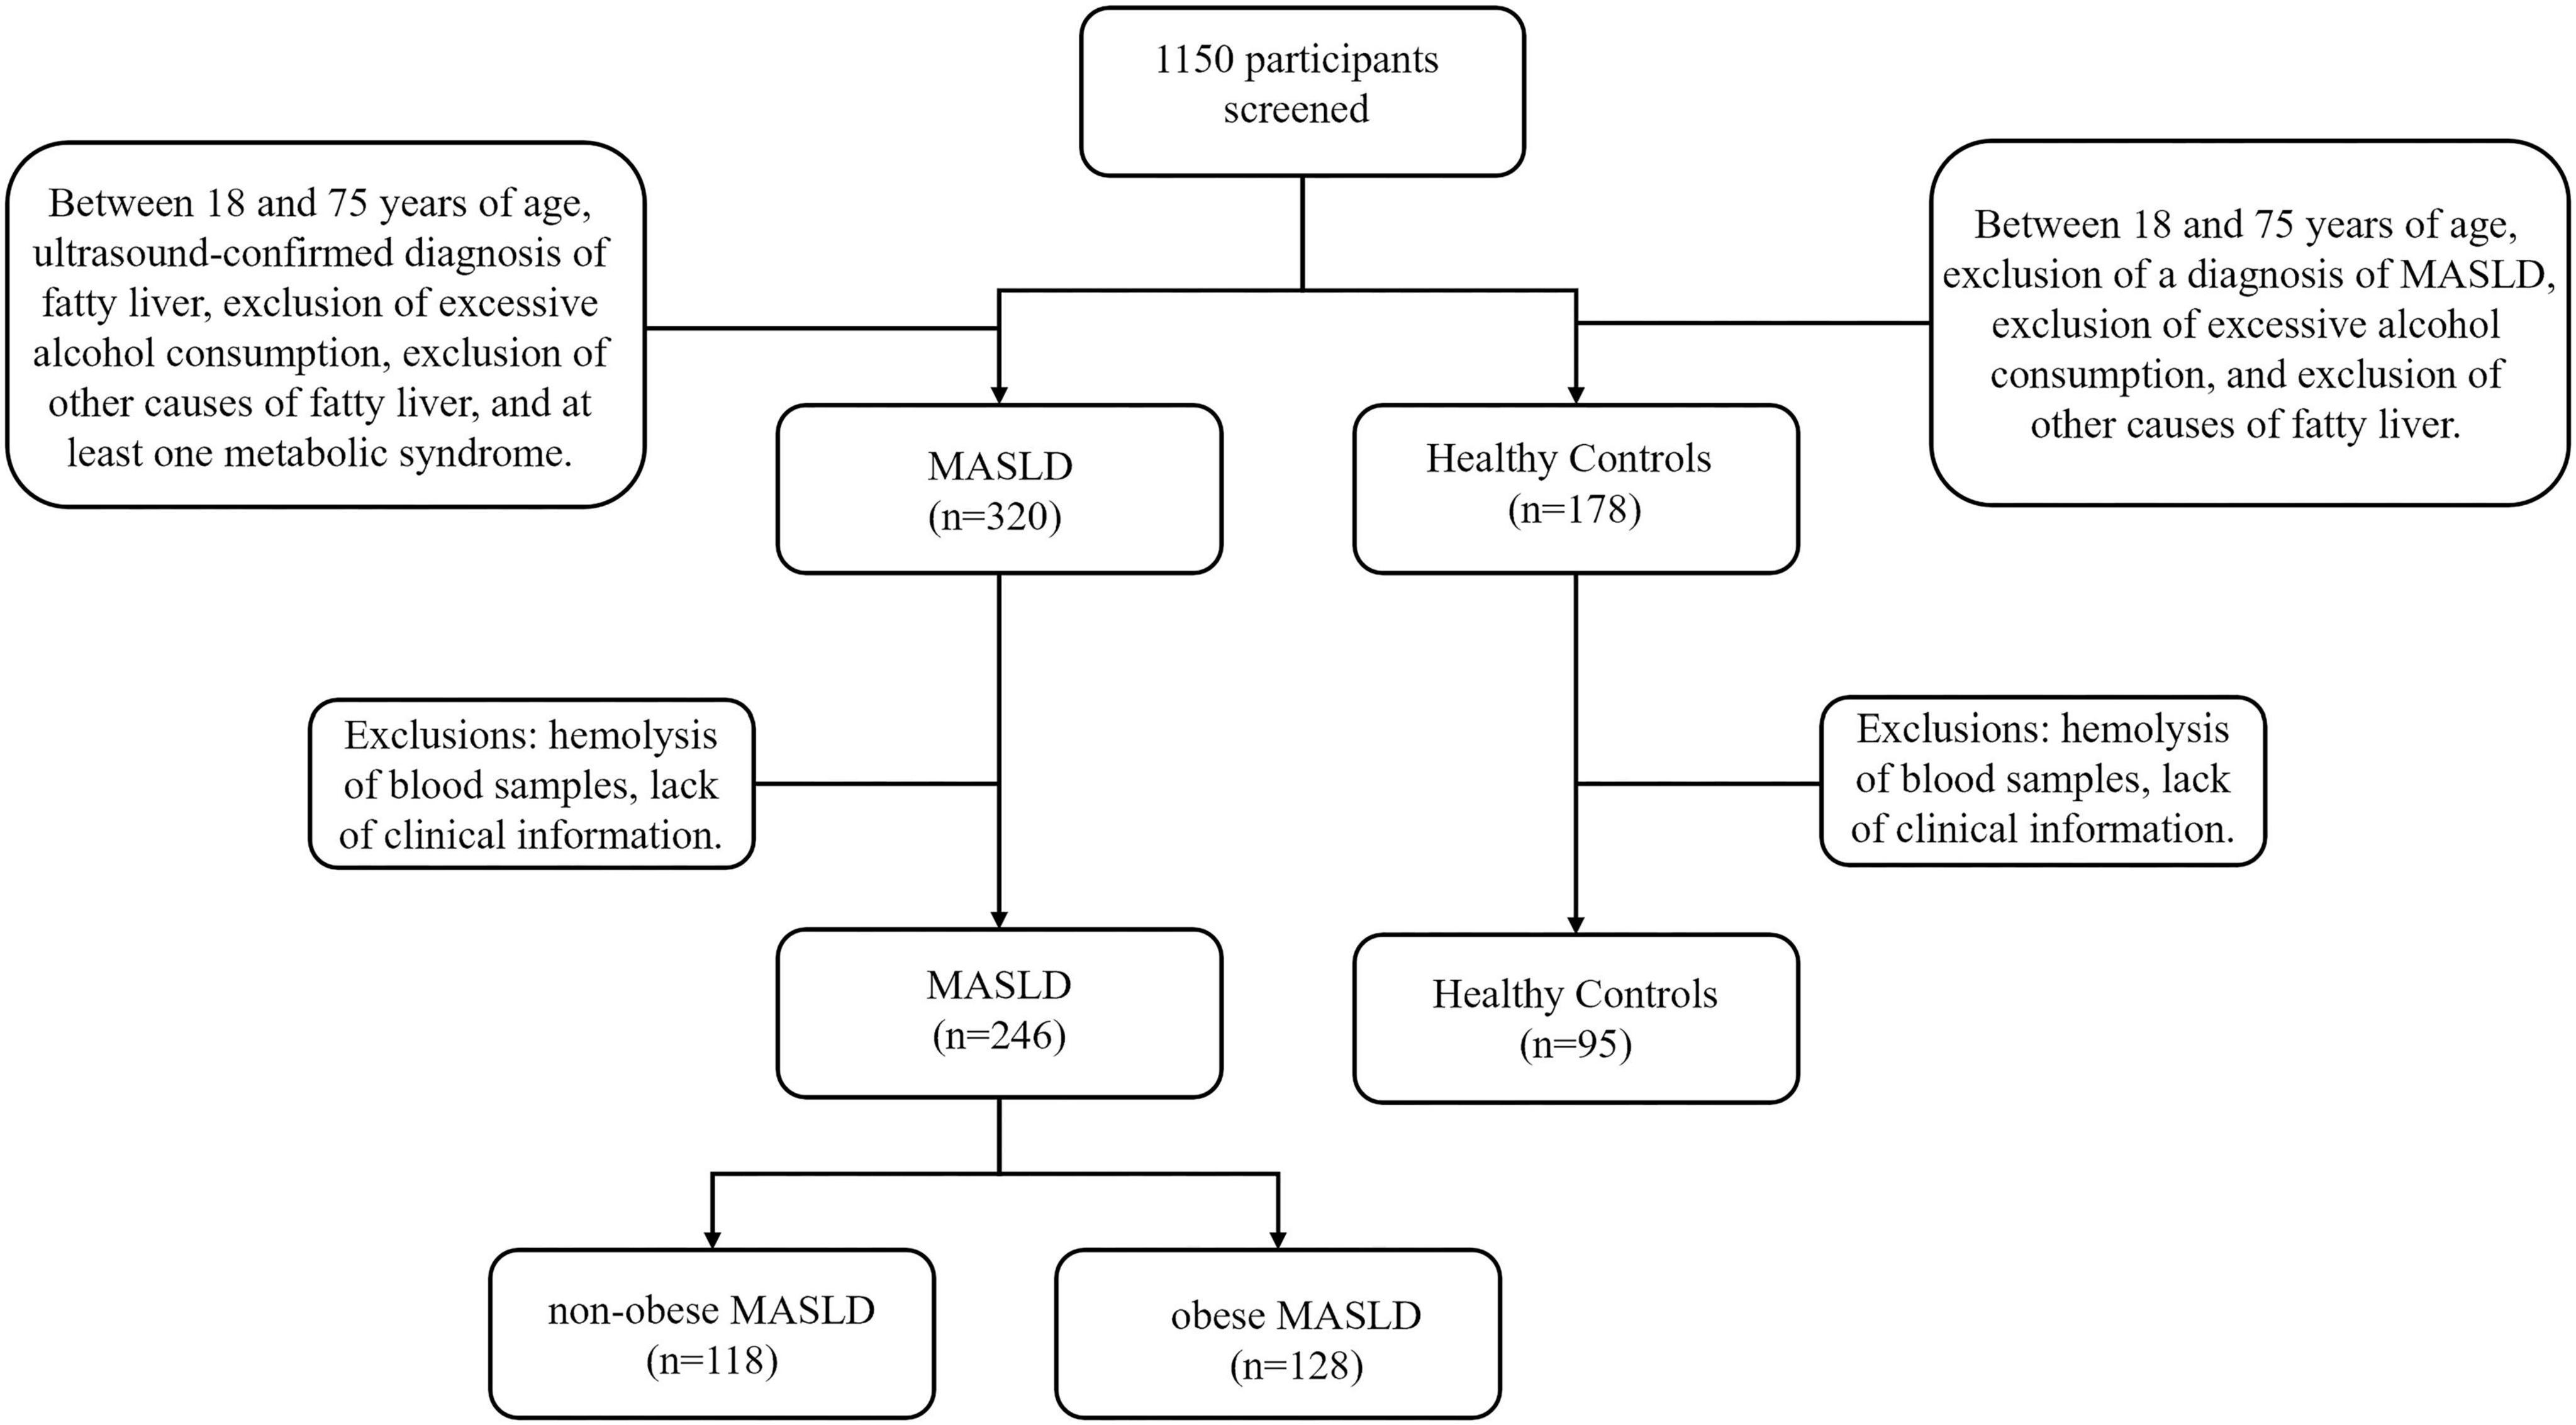
Figure 1. Participant selection flowchart.
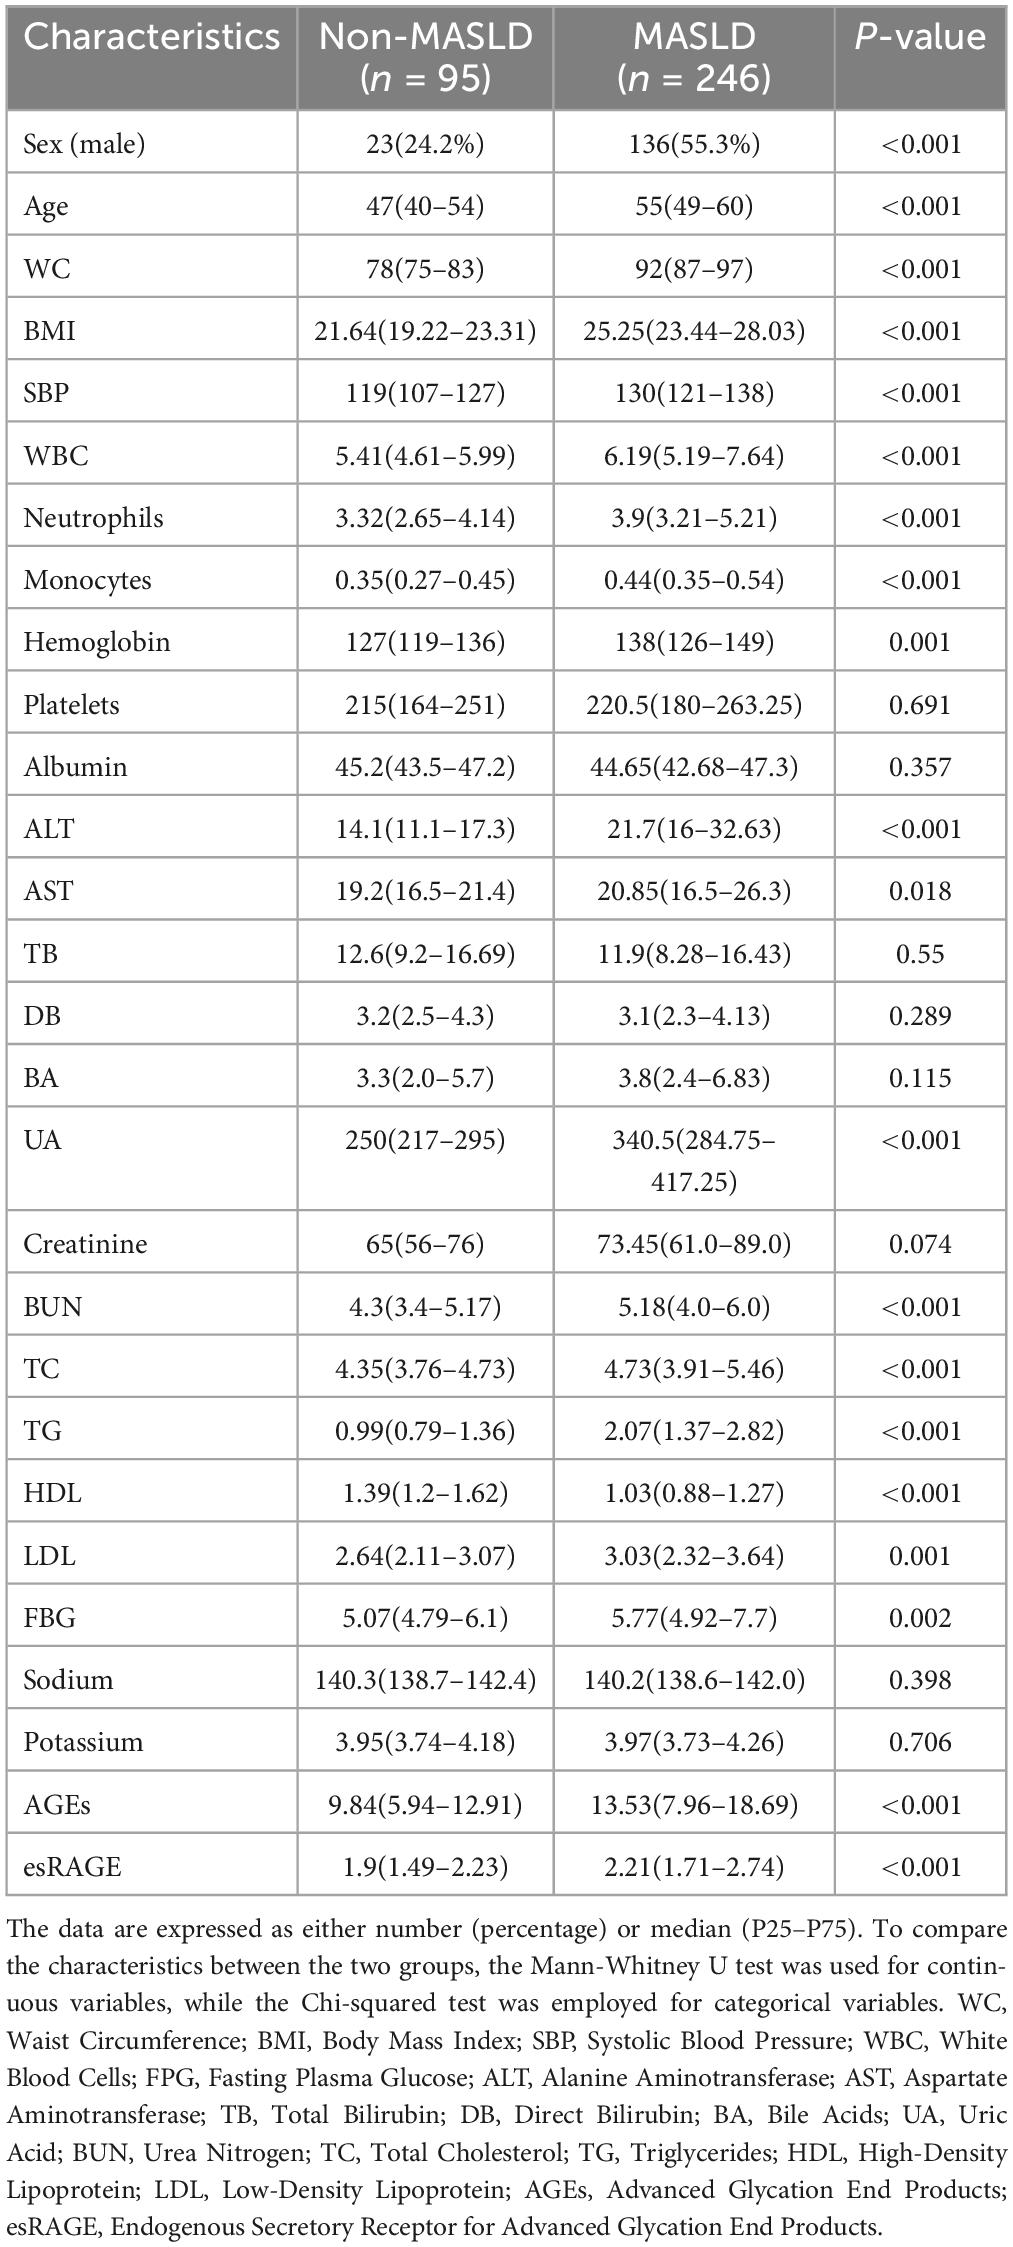
Table 1. Characteristics of participants.
The distribution of AGEs and esRAGE in normal controls and MASLD patients is illustrated in Figure 2. MASLD patients had considerably greater levels of both AGEs and esRAGE than healthy controls (P < 0.001) (Figures 2a,b). To visualize the relationships among the predictor variables, a correlation heatmap was generated, incorporating all continuous predictor variables with the degree of correlation between them indicated on the plot (Figure 2C). The colors in the heatmap indicate the direction of the correlations, with the intensity of the color representing the strength of the correlation. AGEs showed positive correlations with age, WC, BMI, WBC, monocytes, TB, BA, UA, creatinine, sodium, and esRAGE (P < 0.05), but showed negative correlations with HDL and potassium (P < 0.05). Similarly, esRAGE was positively correlated with WC, BMI, SBP, WBC, monocytes, hemoglobin, platelets, ALT, UA, creatinine, TC, LDL, and AGEs (P < 0.05), but negatively correlated with BA. The association between AGEs and esRAGE was analyzed using Spearman’s correlation test, and the resulting scatter plot demonstrated a substantial positive correlation (r = 0.1299, P = 0.0164) (Figure 2D).
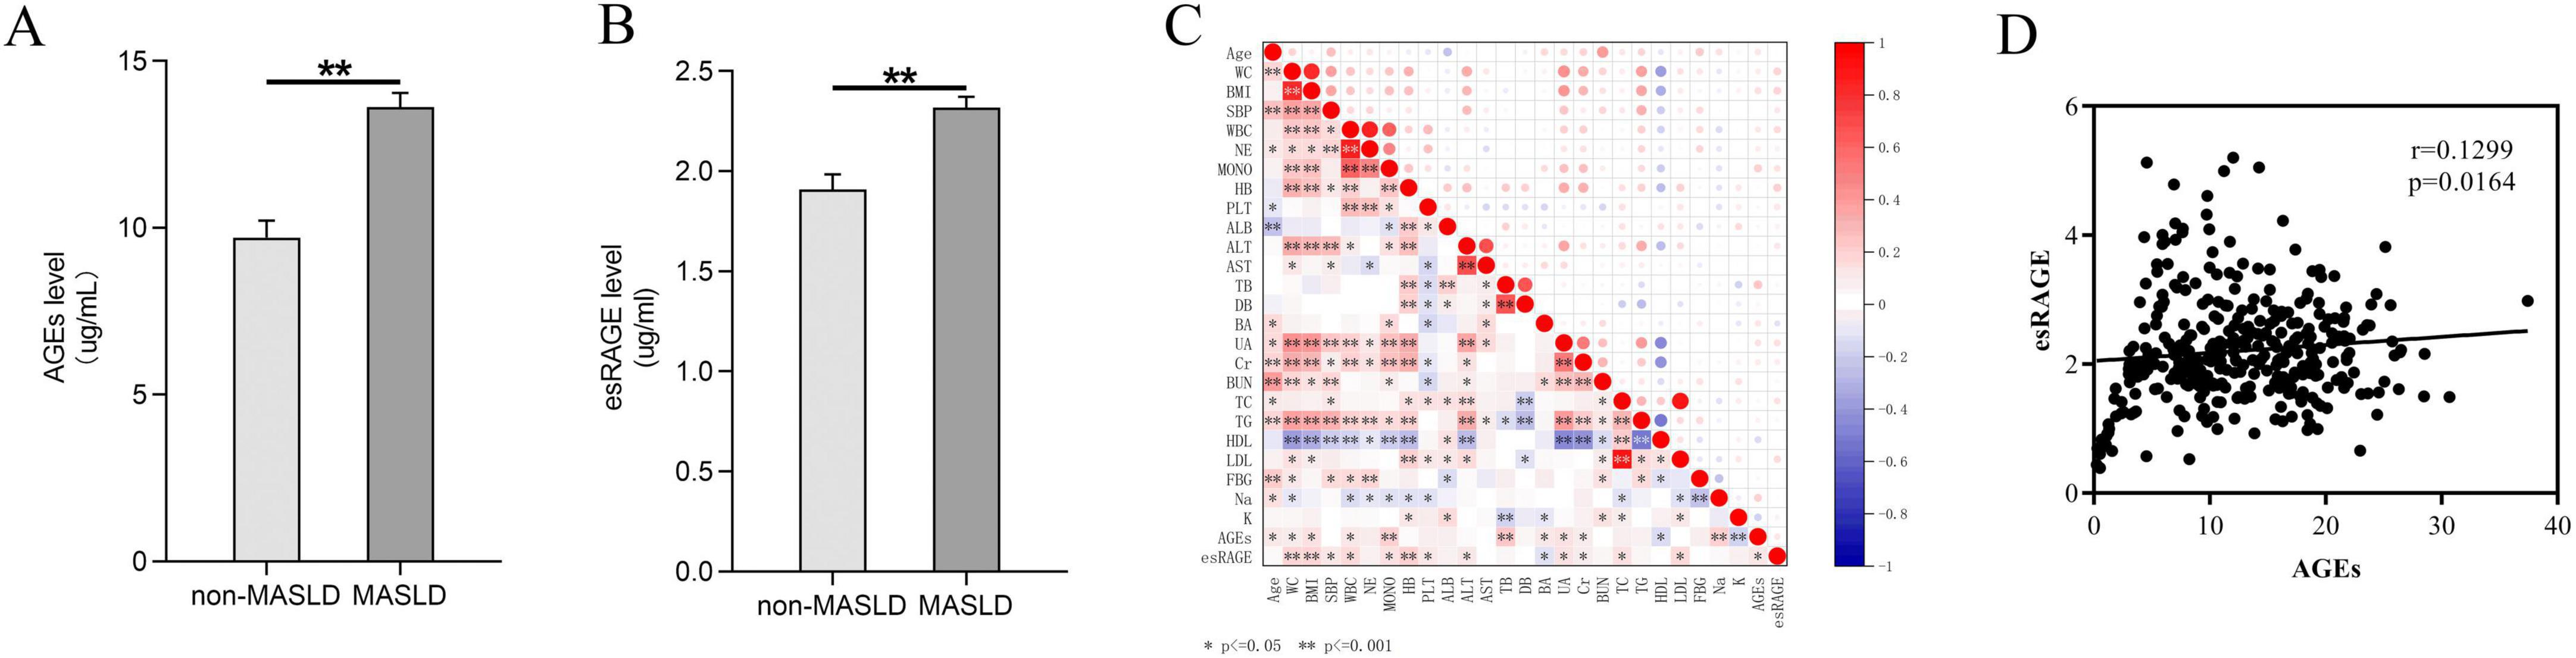
Figure 2. Comparative analysis of AGEs and esRAGE levels in normal controls versus patients with MASLD. (A) Patients with MASLD had considerably higher levels of AGEs (P < 0.001). (B) MASLD patients had considerably higher levels of esRAGE (P < 0.001). (C) A heatmap depicting the correlation analysis among all candidate predictors showed statistical significance, indicated by asterisks (*) and double asterisks (**), in the correlations between variables. (D) Scatterplot of AGEs versus esRAGE, with a positive correlation (P = 0.0164).
3.2 Comparative analysis of AGEs and esRAGE in non-obese and obese MASLD
The anthropometric and laboratory parameters of non-obese and obese MASLD patients are presented in Table 2. The proportion of males among those with obese MASLD (68.7%) was significantly greater than that of males with non-obese MASLD (40.7%) (P < 0.001). Additionally, non-obese MASLD patients were substantially older than their obese counterparts (P < 0.001). Non-obese MASLD patients had considerably lower BMI and WC levels (P < 0.001). Regarding laboratory parameters, serum levels of monocytes, hemoglobin, UA, creatinine, and potassium were significantly elevated in obese MASLD patients (P < 0.05). There were no significant differences in WBC, neutrophils, platelets, albumin, ALT, AST, TB, DB, BA, BUN, TC, TG, HDL, LDL, FBG, or sodium levels across groups.
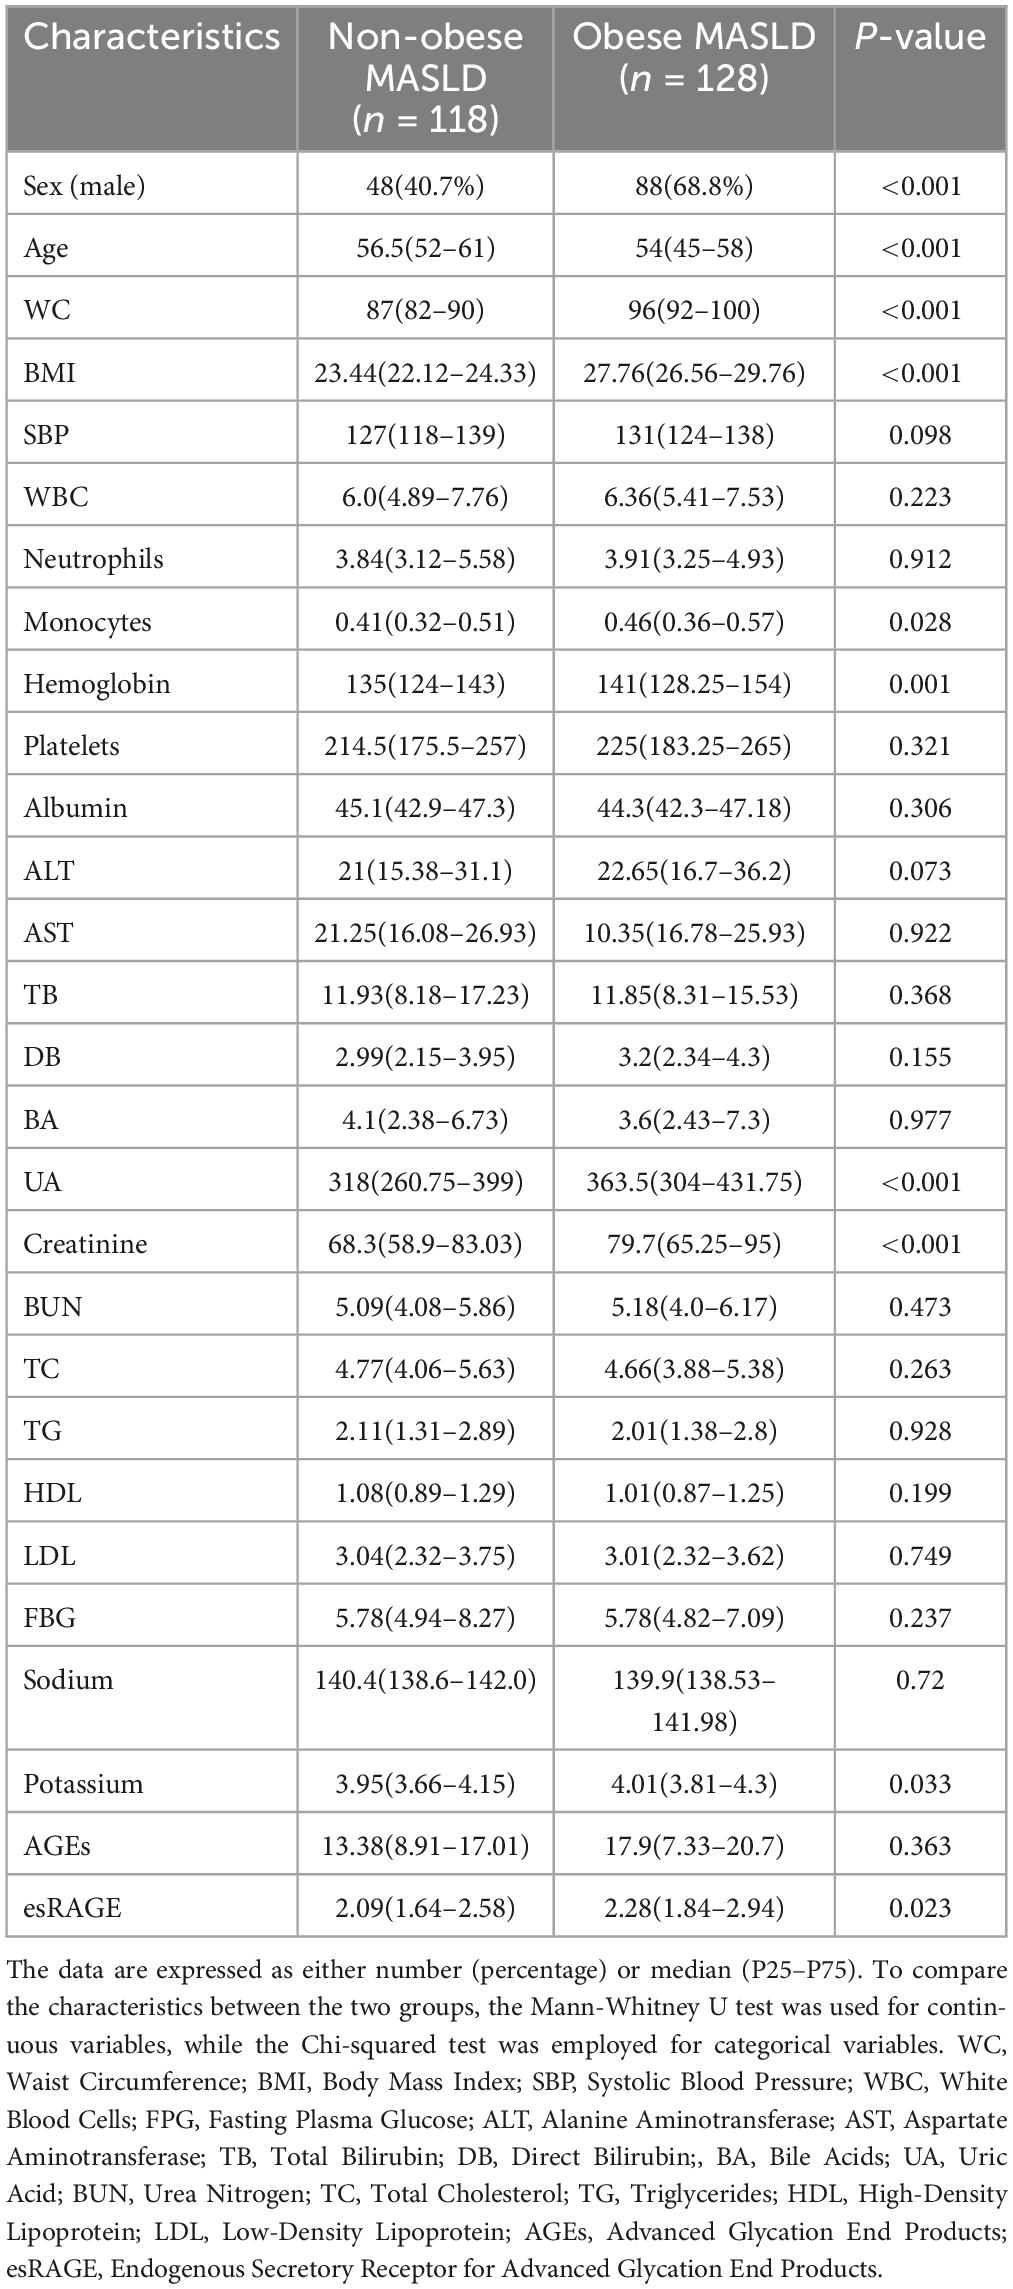
Table 2. Characteristics of patients with non-obese and obese MASLD.
The distribution of AGEs and esRAGE levels in non-obese and obese MASLD patients is illustrated in Figure 3. Although levels of AGEs elevated in obese MASLD patients compared with non-obese individuals, the difference was not statistically significant (Figure 3A). In contrast, obese MASLD patients had substantially elevated esRAGE levels compared to non-obese patients (P < 0.05) (Figure 3B). To illustrate the correlations among all candidate predictor variables in MASLD patients, a correlation heatmap was generated (Figure 3C). The correlation between AGEs and esRAGE was further examined using Spearman’s test, and the resulting scatter plot indicated no significant correlation between AGEs and esRAGE in MASLD patients (Figure 3D).
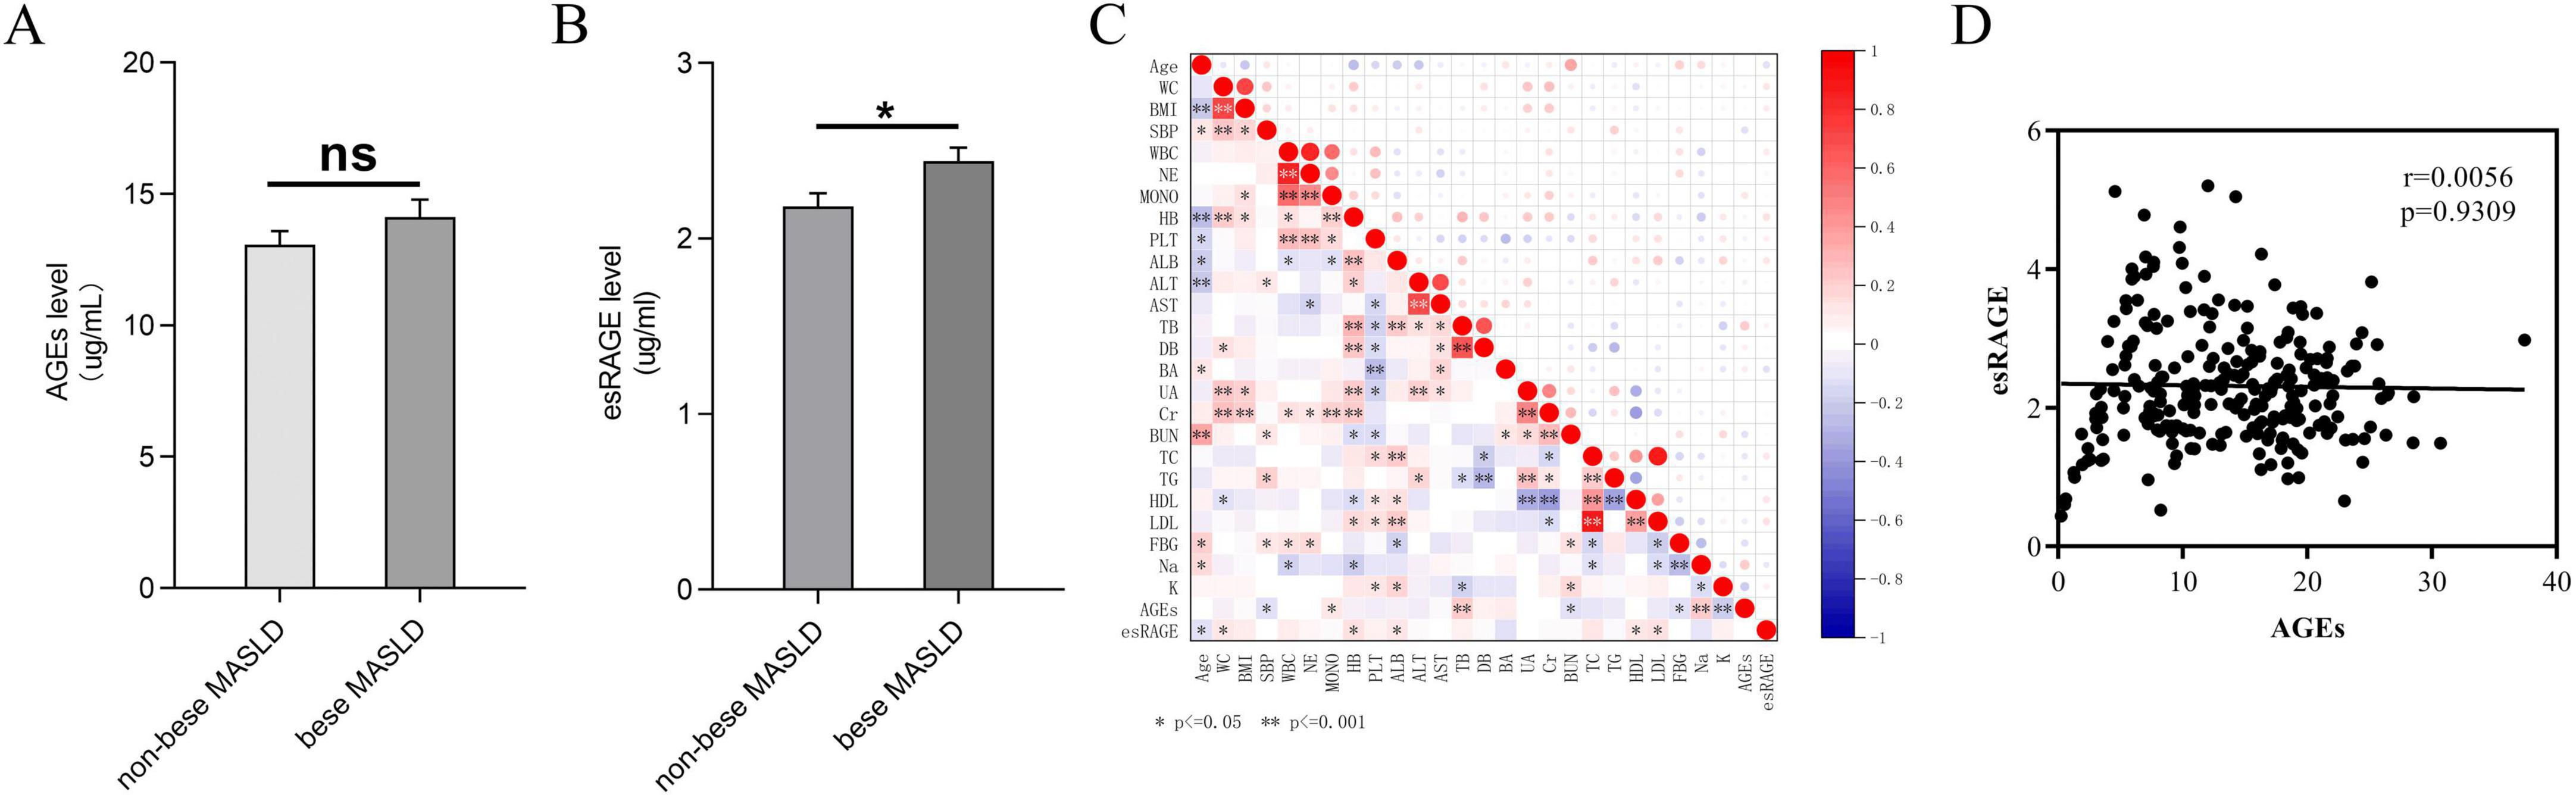
Figure 3. AGEs and esRAGE levels in obese and non-obese MASLD patients are compared. (A) No substantial variations in AGE levels were seen between non-obese and obese MASLD patients. (B) Patients with MASLD who were obese had elevated levels of esRAGE (P < 0.05). (C) A heatmap depicting the correlation analysis among all candidate predictors showed statistical significance, indicated by asterisks (*) and double asterisks (**), in the correlations between variables. (D) AGEs and esRAGE did not show a statistically significant link, according to Spearman’s correlation analysis.
3.3 Diagnostic models based on AGEs and esRAGE
3.3.1 Construction of the model
To mitigate the risk of overfitting, we conducted LASSO regression analysis on all candidate predictor variables, generating LASSO coefficient path diagrams (Figure 4A) and LASSO regularized path diagrams (Figure 4B). Based on the optimal λ-value, we retained 18 characteristic variables: age, WC, BMI, SBP, neutrophils, monocytes, ALT, TB, UA, TC, TG, HDL, LDL, FBG, sodium, potassium, AGEs, esRAGE.
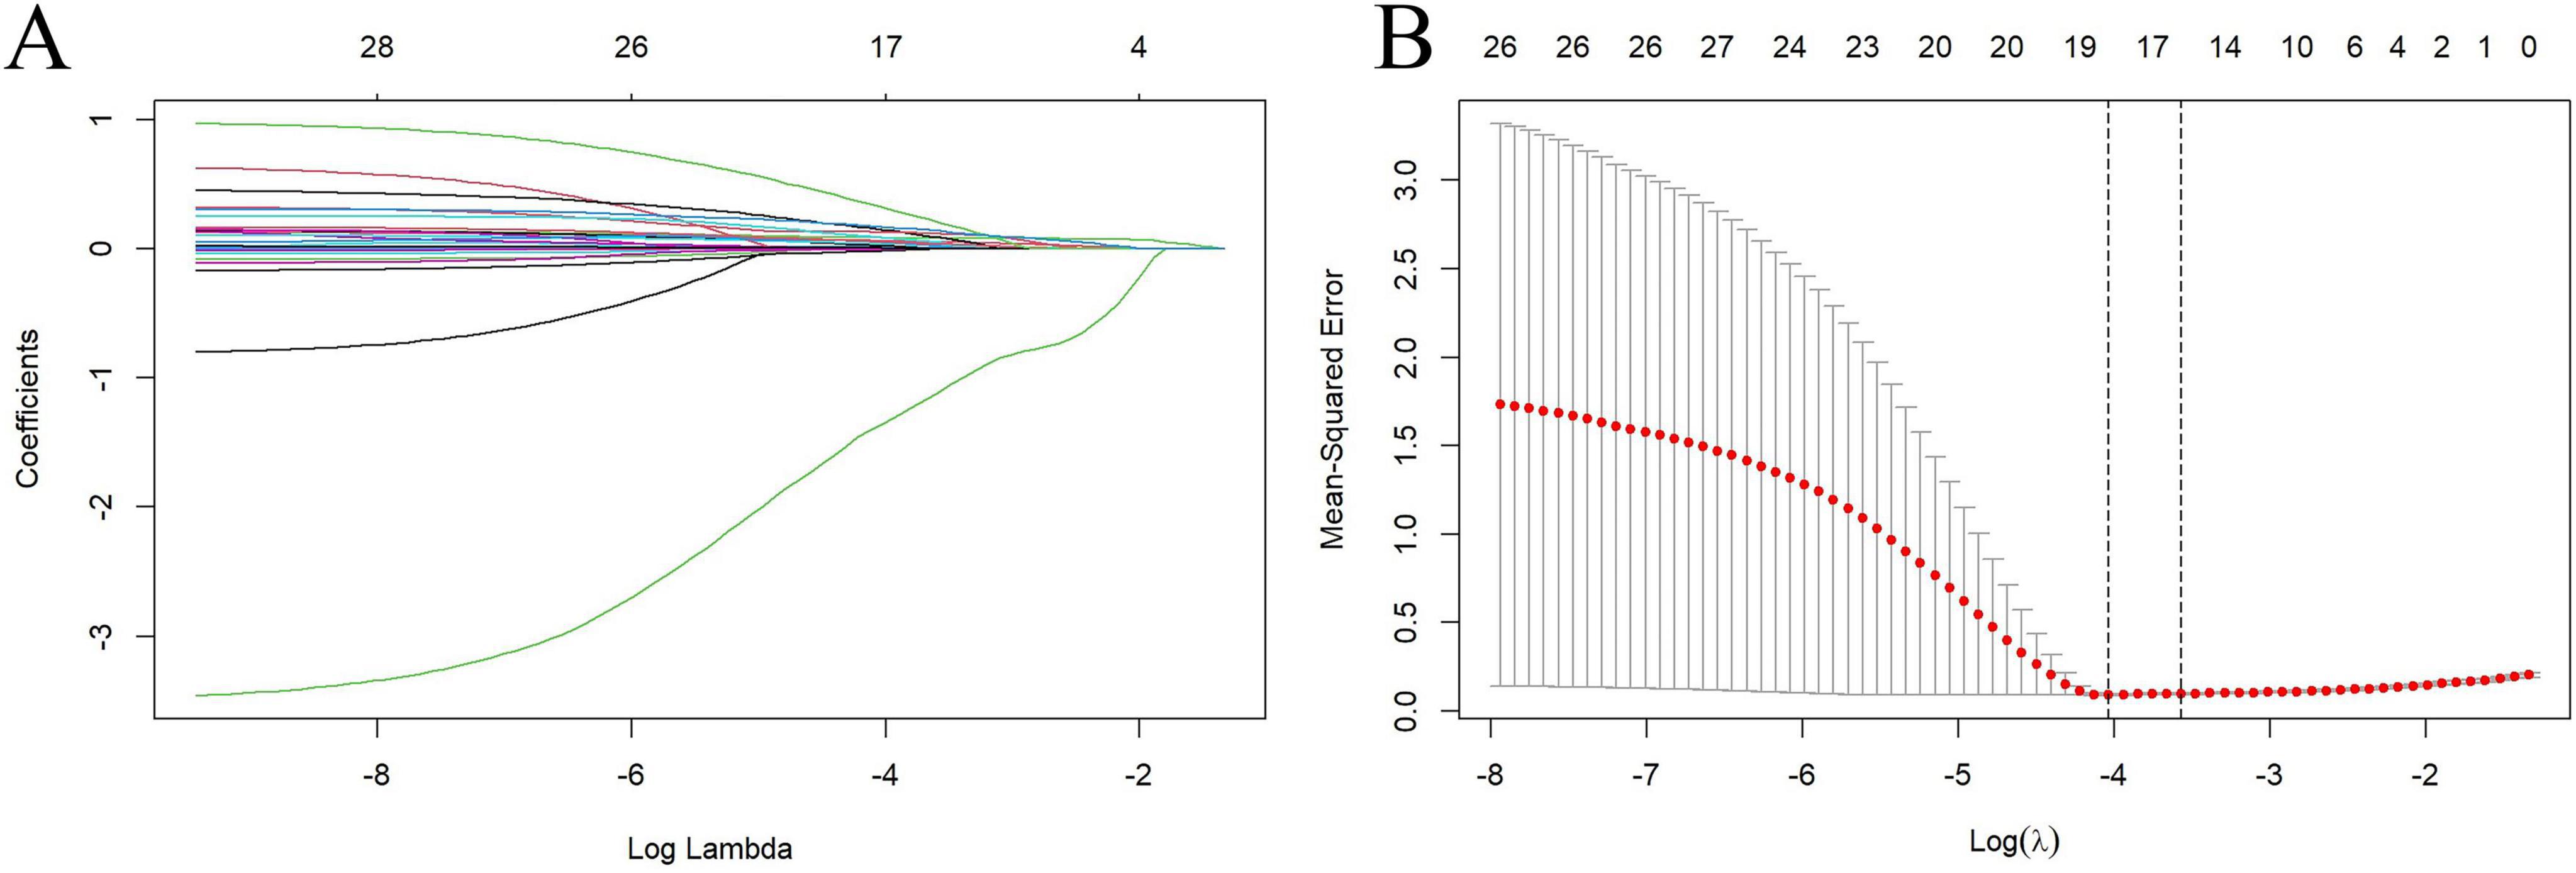
Figure 4. Factor selection was conducted using Lasso binary logistic regression models. (A) The logarithm of the lambda (λ) values for the 28 candidate variables in the Lasso model was determined. (B) log (Lambda) value that was most appropriate in the LASSO model.
Univariate regression analysis of the 18 retained characteristic variables revealed that 15 were significantly associated with MASLD (P < 0.05) (Table 3). The results indicated that the odds ratios (ORs) were as follows: age, 1.089 (1.061–1.117); waist circumference, 1.265 (1.201–1.332); Body Mass Index, 1.769 (1.545–2.025); systolic blood pressure, 1.076 (1.053–1.100); neutrophils, 1.381 (1.146–1.665); monocytes, 50.064 (7.378–339.706); alanine aminotransferase, 1.140 (1.093–1.189); uric acid, 1.015 (1.011–1.020); total cholesterol, 1.583 (1.227–2.042); triglycerides, 4.464 (2.852–6.989); high-density lipoprotein, 0.038 (0.016–0.092); low-density lipoprotein, 1.709 (1.280–2.283); fasting blood glucose, 1.321 (1.127–1.549); AGEs, 1.106 (1.061–1.153); and esRAGE, 1.979 (1.408–2.781). These variables were included in the multivariate regression analysis, which employed a stepwise backward selection method to establish the final model. This resulted in eight characteristic variables retained in the final model: age, 1.146 (1.079–1.218); waist circumference, 1.139 (1.032–1.258); Body Mass Index, 1.381 (1.073–1.777); alanine transaminase, 1.103 (1.042–1.168); triglycerides, 1.522 (1.088–2.129); high-density lipoprotein, 0.201 (0.052–0.773); AGEs, 1.113 (1.027–1.206); and esRAGE, 2.259 (1.154–4.422) (Table 3). The score can be calculated using the following equation:
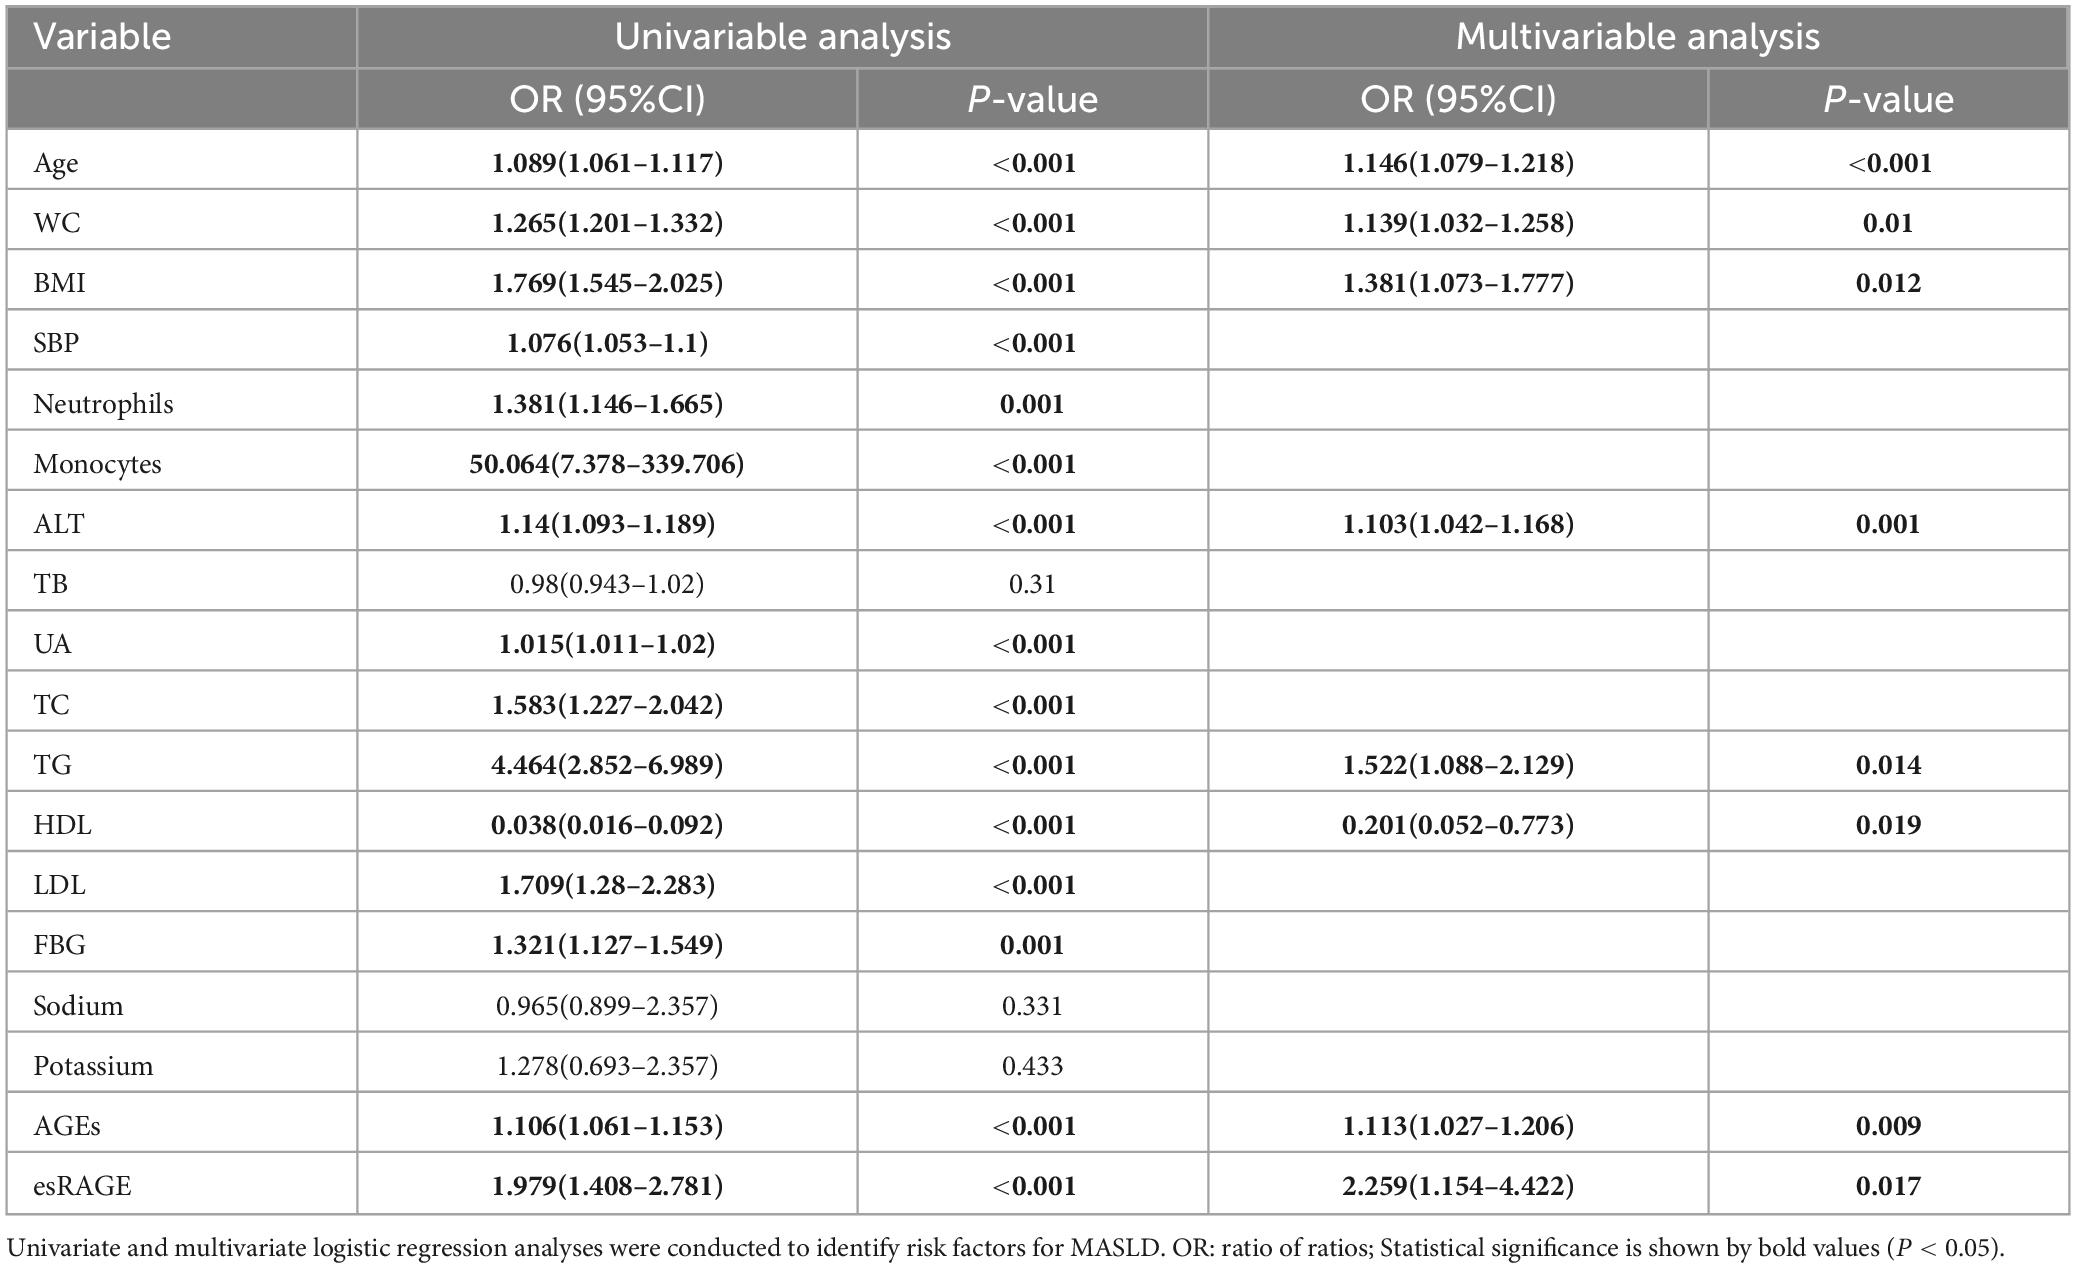
Table 3. Table of MASLD risk variables analyzed using univariate and multivariate logistic regression.
MASLD Score = 0.136 × Age (years) + 0.130 × WC (cm) + 0.323 × BMI (kg/m2) + 0.098 × ALT (U/L) + 0.420 × TG (mmol/L) − 0.603 × HDL (mmol/L) + 0.107 × AGEs (μg/mL) + 0.815 × esRAGE (μg/mL) − 28.240
3.3.2 Validation of the model
Following logistic regression analysis, eight variables were determined to be independent predictors (Table 3). ROC analyses were conducted on these predictors to assess their capability in differentiating MASLD, with results displayed in Figures 5A–H. The area under the curve (AUC) values indicated strong discriminatory performance, demonstrating their accuracy in diagnosing MASLD. The predictive power of the MASLD diagnostic model was significantly higher than that of the univariate clinical model, with an AUC of 0.963 (Figure 5I). In the MASLD model, the sensitivity, specificity, positive predictive value (PPV), negative predictive value (NPV), positive likelihood ratio (PLR), and negative likelihood ratio (NLR) were 94.3, 85.3, 94.6, 84.7, 6.41, and 0.07%, respectively (Table 4). For internal validation, the model was assessed using 1,000 Bootstrap resamplings, and it yielded an AUC of 0.963 (95% CI: 0.944–0.982) (Figure 6A). To enhance diagnostic efficiency, we developed a nomogram incorporating the final variables to estimate the risk of MASLD (Figure 6B). Meanwhile, calibration curves indicated good alignment between predicted and observed probabilities (Figure 6C). Additionally, a decision curve analysis evaluated the model’s utility in clinical decision-making. The model curve, as illustrated in Figure 6D, diverged from the extreme “none” and “all” curves, showing that patients with MASLD could benefit significantly from the diagnostic model in terms of net clinical outcomes. These findings demonstrate that the diagnostic model, which incorporates AGEs and esRAGE, has strong diagnostic efficacy and practical utility.
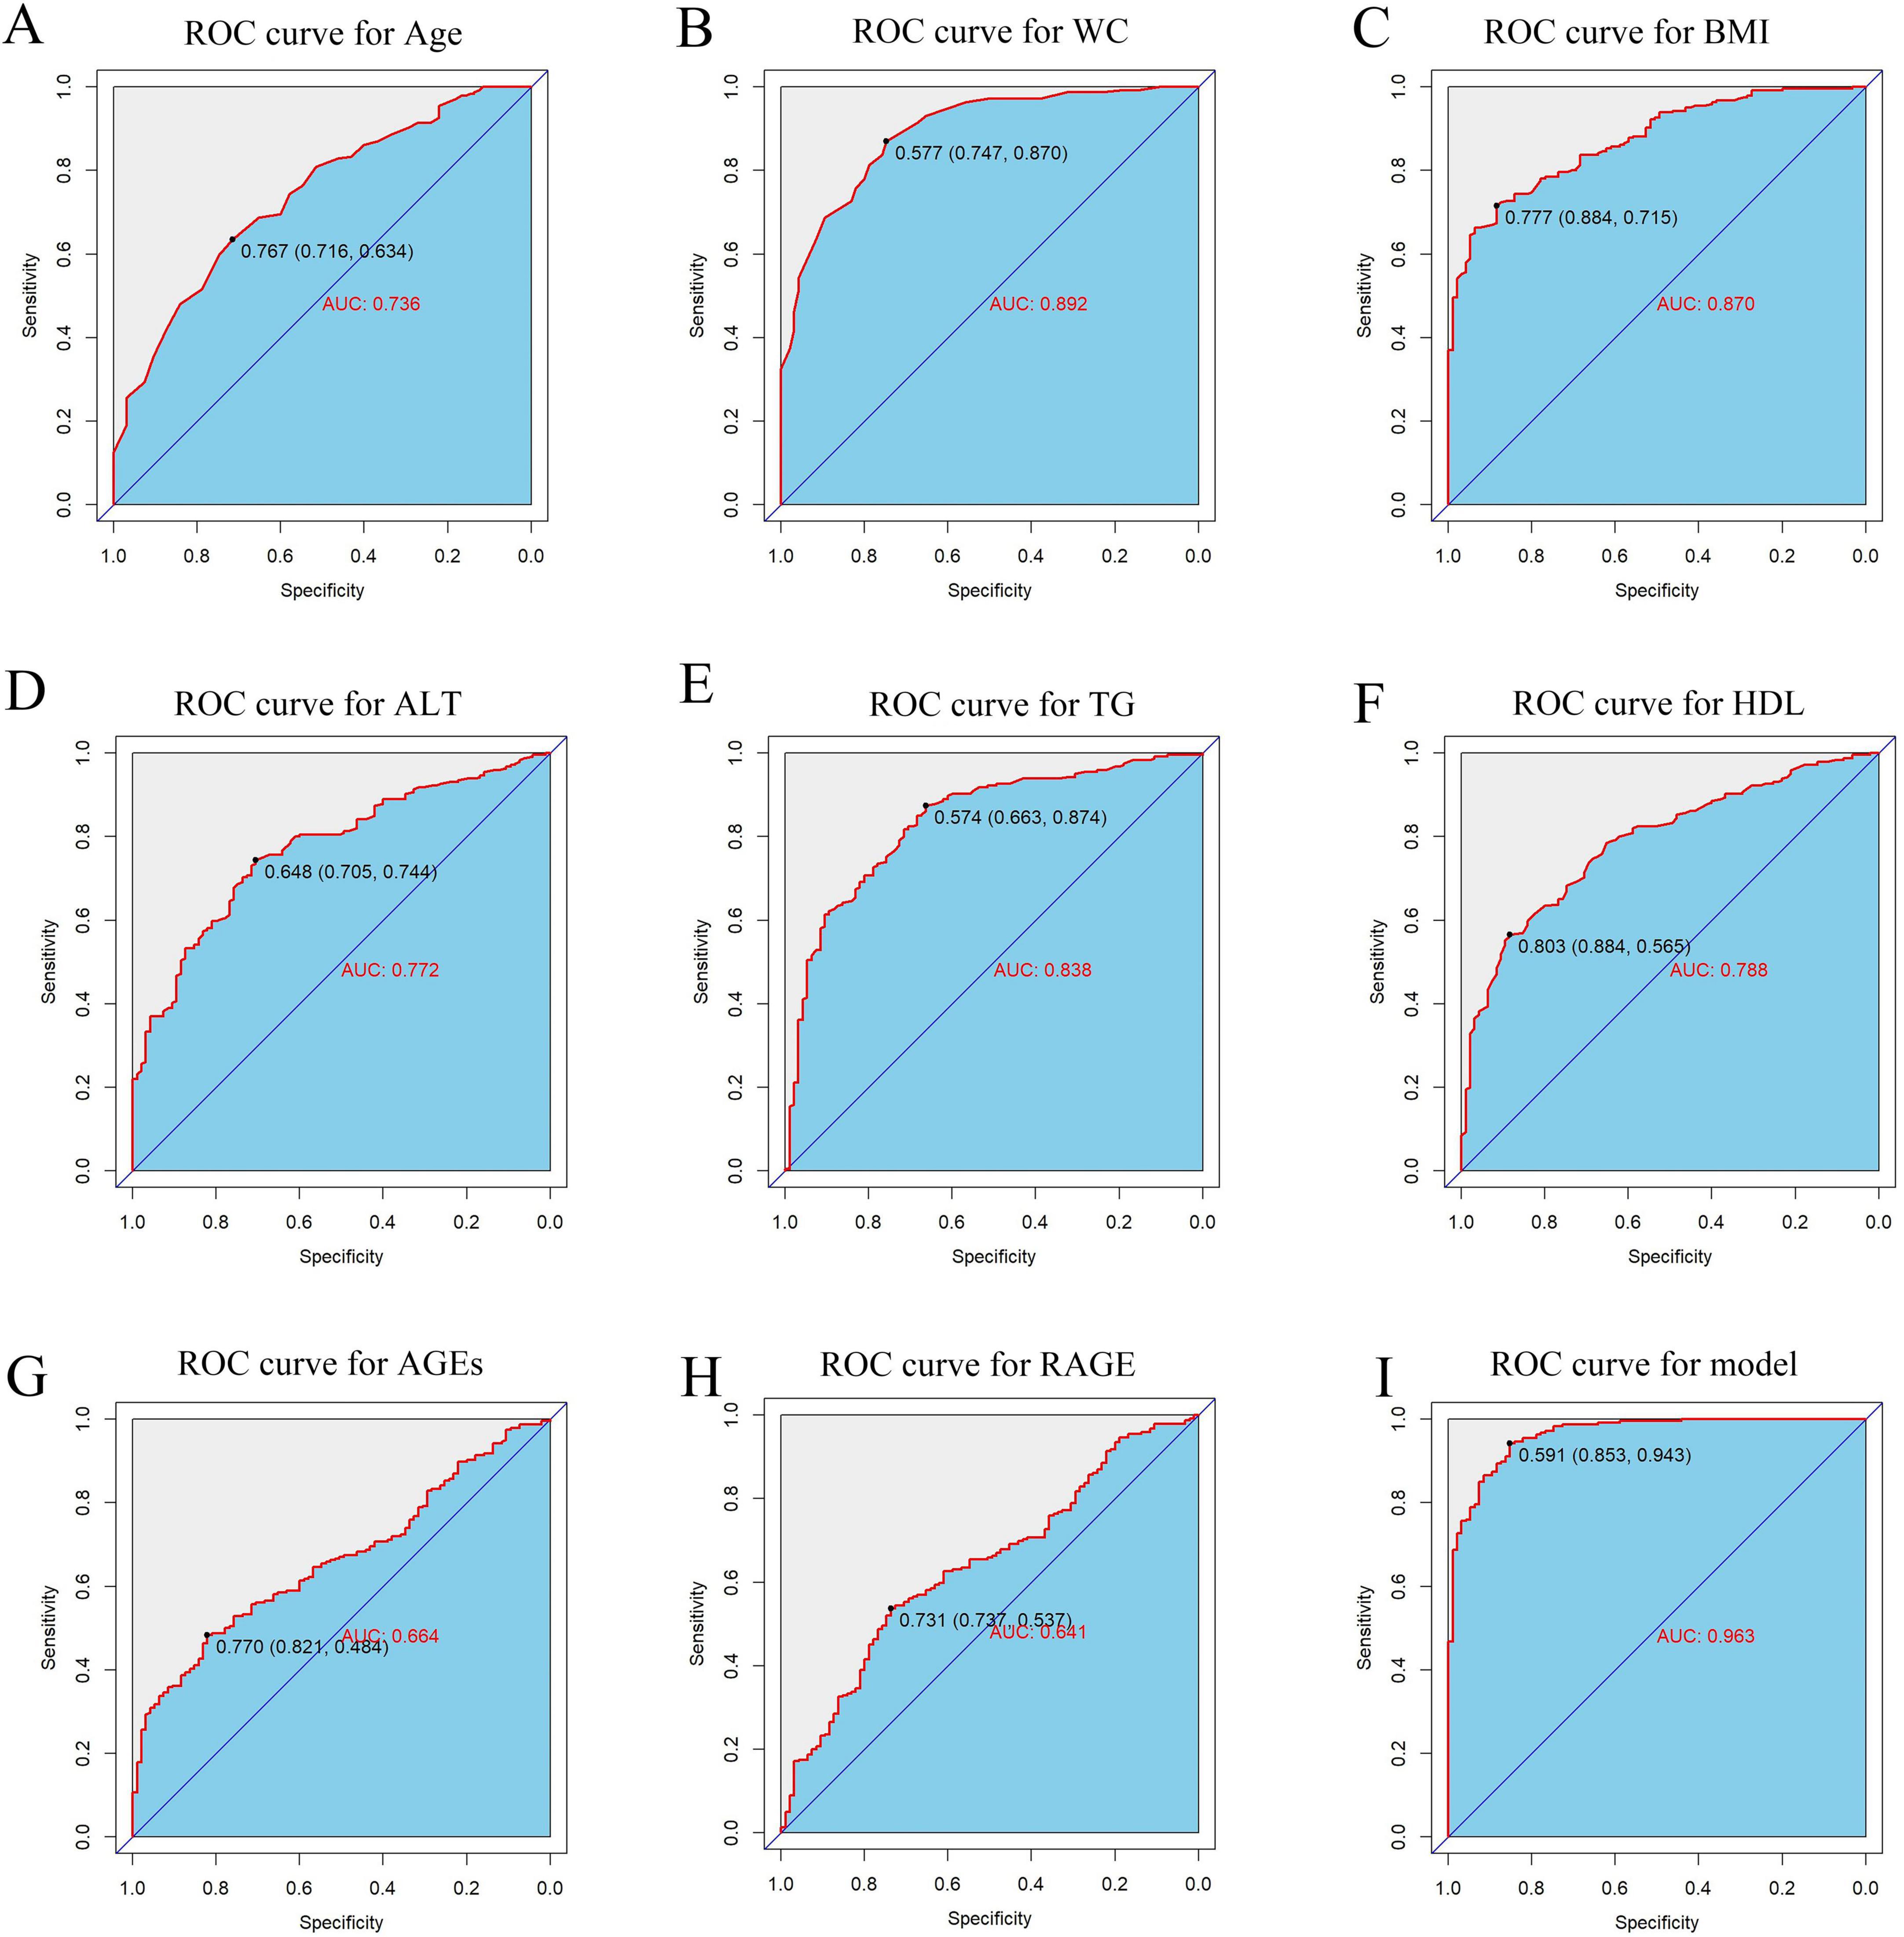
Figure 5. ROC curves for predictors and MASLD diagnostic models. (A–H) ROC curves for predictors Age, WC, BMI, ALT, TG, HDL, AGEs, esRAGE models. (I) ROC curves for diagnostic models.
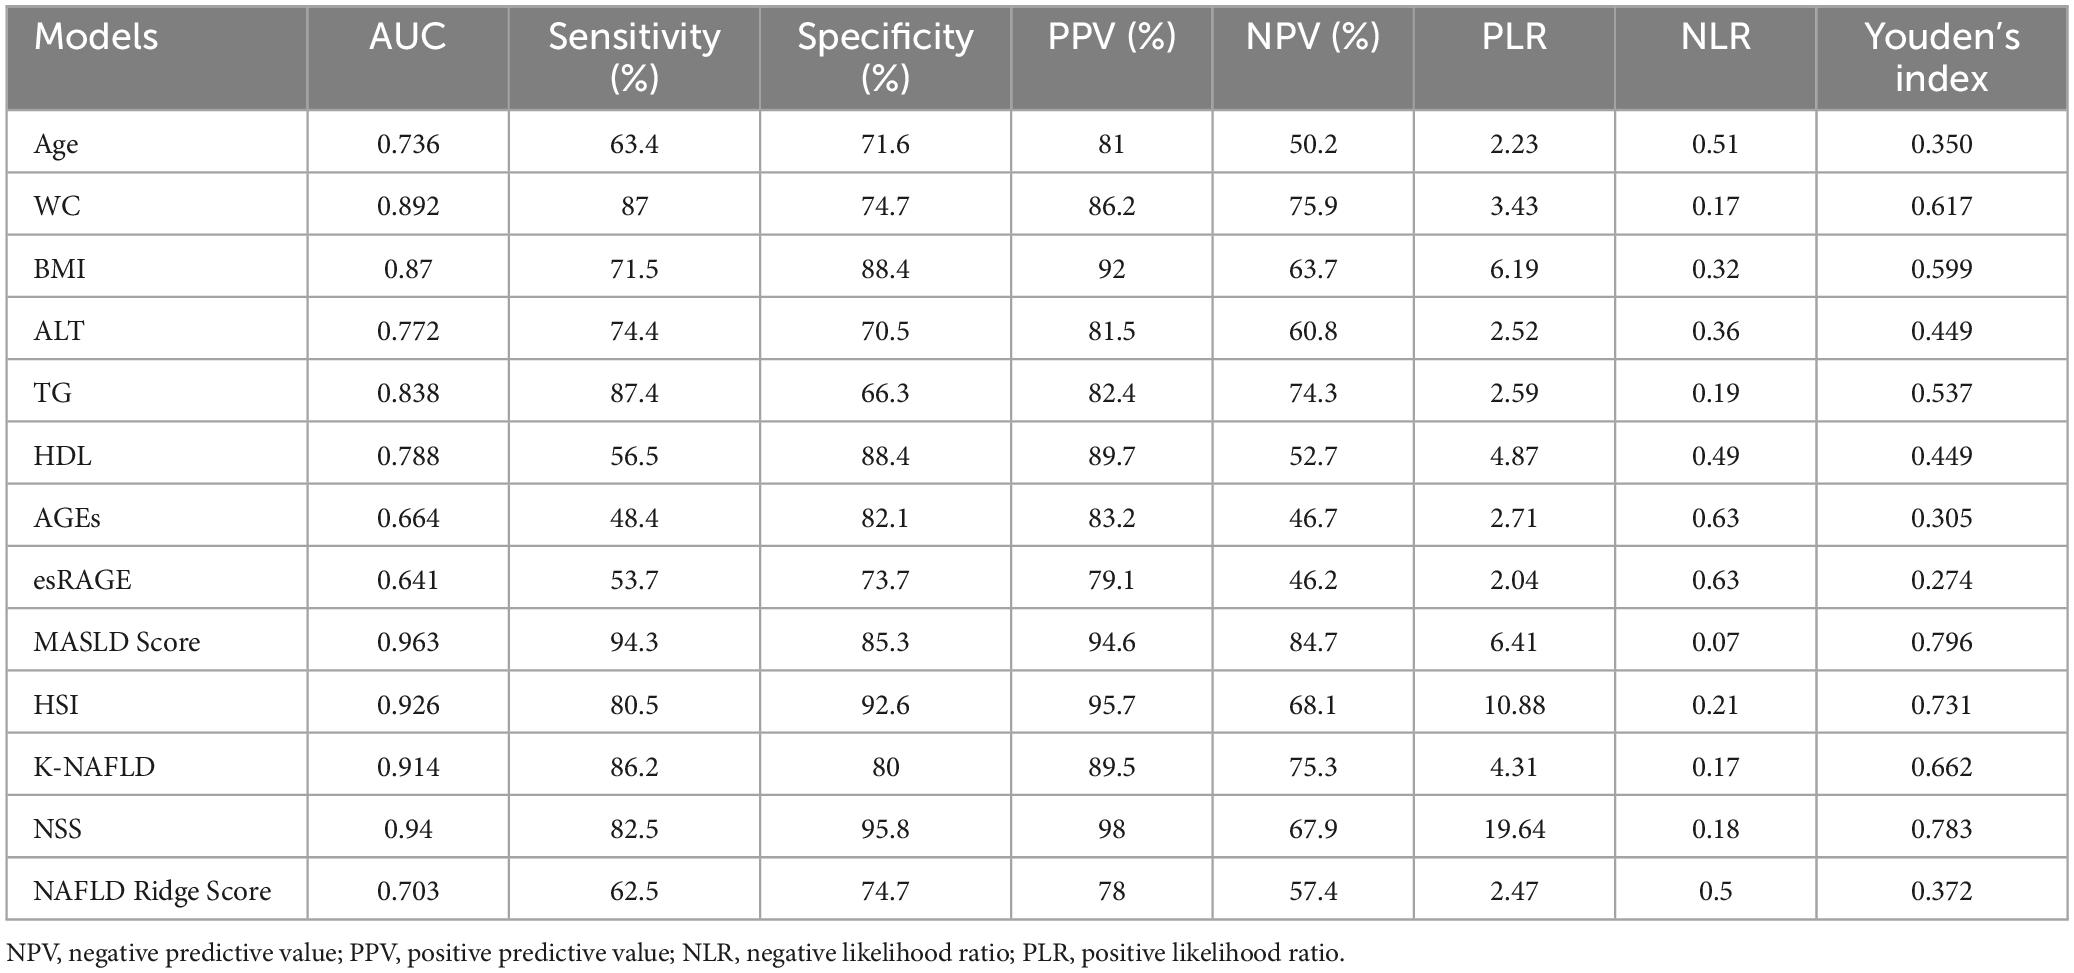
Table 4. Diagnostic accuracy of the model.
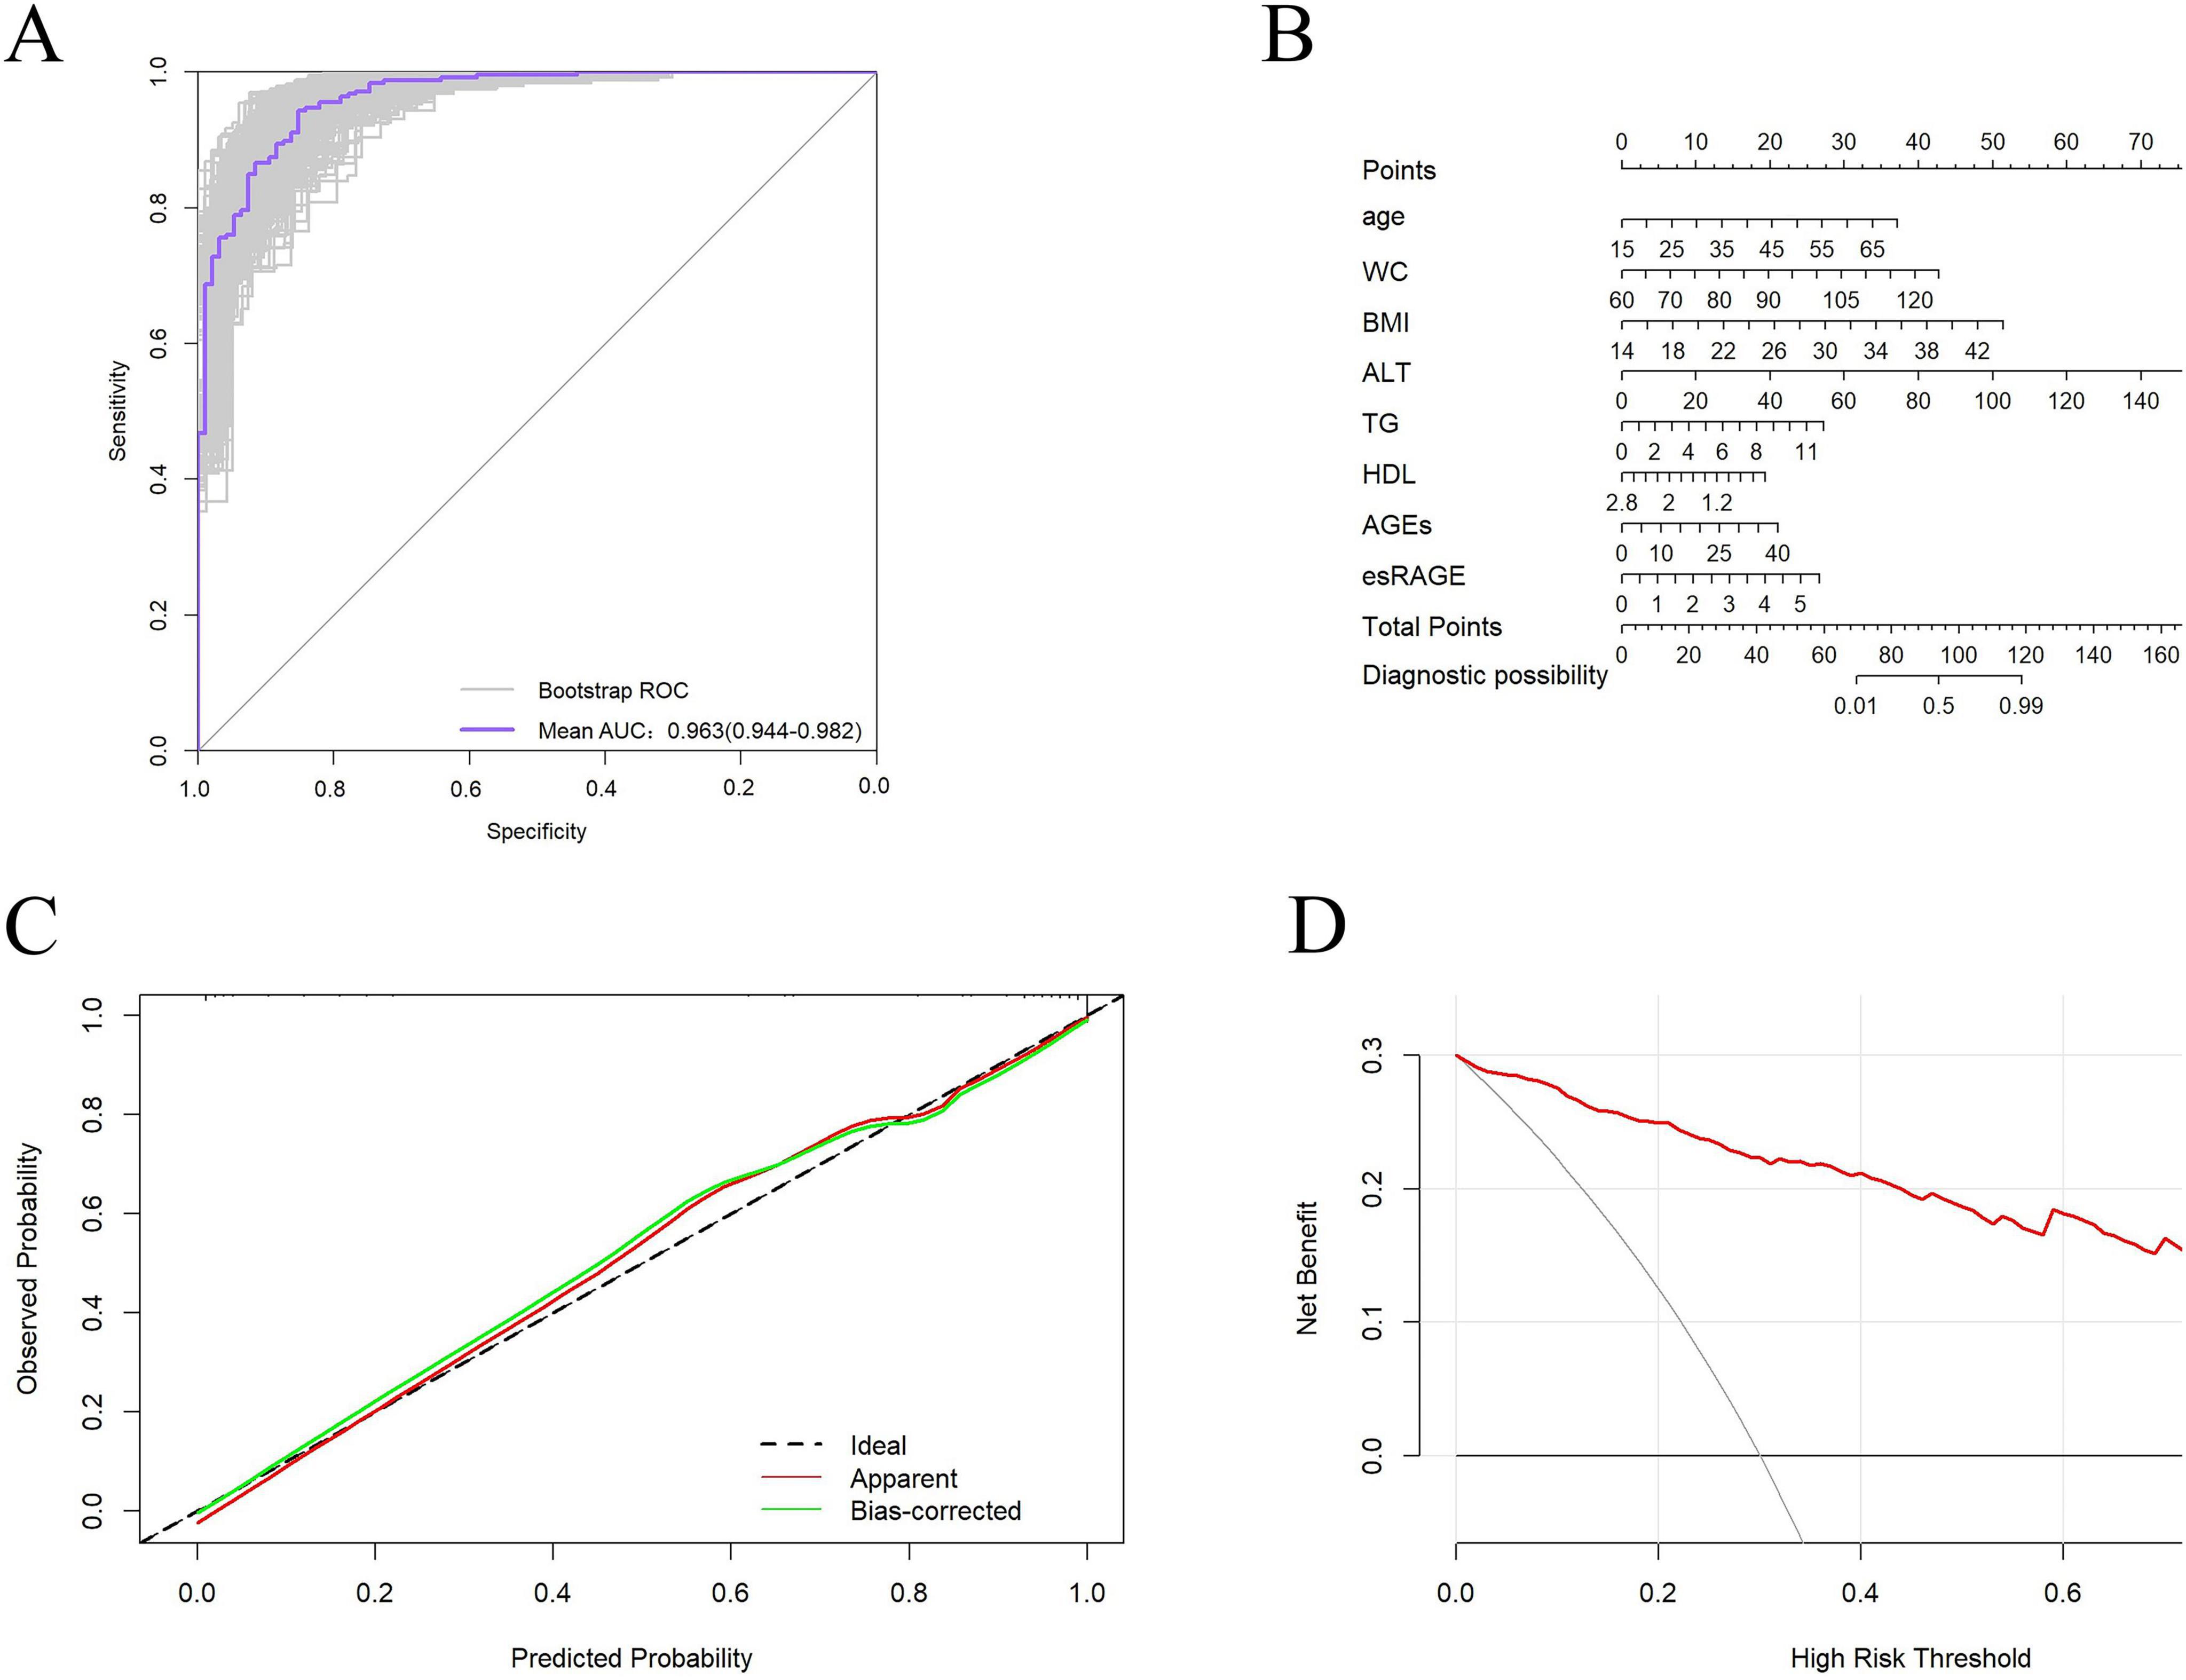
Figure 6. Validation of the diagnostic models. (A) Bootstrap internally validated ROC curves. (B) Nomogram for predicting MASLD risk classification. (C) Model calibration curves. (D) When compared to a “all treatment” or “no treatment strategy, DCA demonstrates the net advantage of using the model to diagnose MASLD at different decision thresholds.
The diagnostic performance of five MASLD diagnostic scores (i.e., MASLD Score, HSI, K-NAFLD, NSS, and NAFLD Ridge Score) was systematically evaluated (Table 4). The results indicated that the MASLD Score exhibited superior diagnostic performance compared with the other scoring systems (Figure 7A). To assess the diagnostic performance of the five models in the non-obese and obese MASLD subgroups, we applied each model to its respective subgroup. In the non-obese MASLD subgroup, the MASLD Score maintained high discriminatory power (AUC = 0.942), whereas the diagnostic validity of the other models was significantly lower (Figure 7B). In contrast, all models demonstrated robust diagnostic performance in the obese MASLD subgroup (Figure 7C; Table 5).
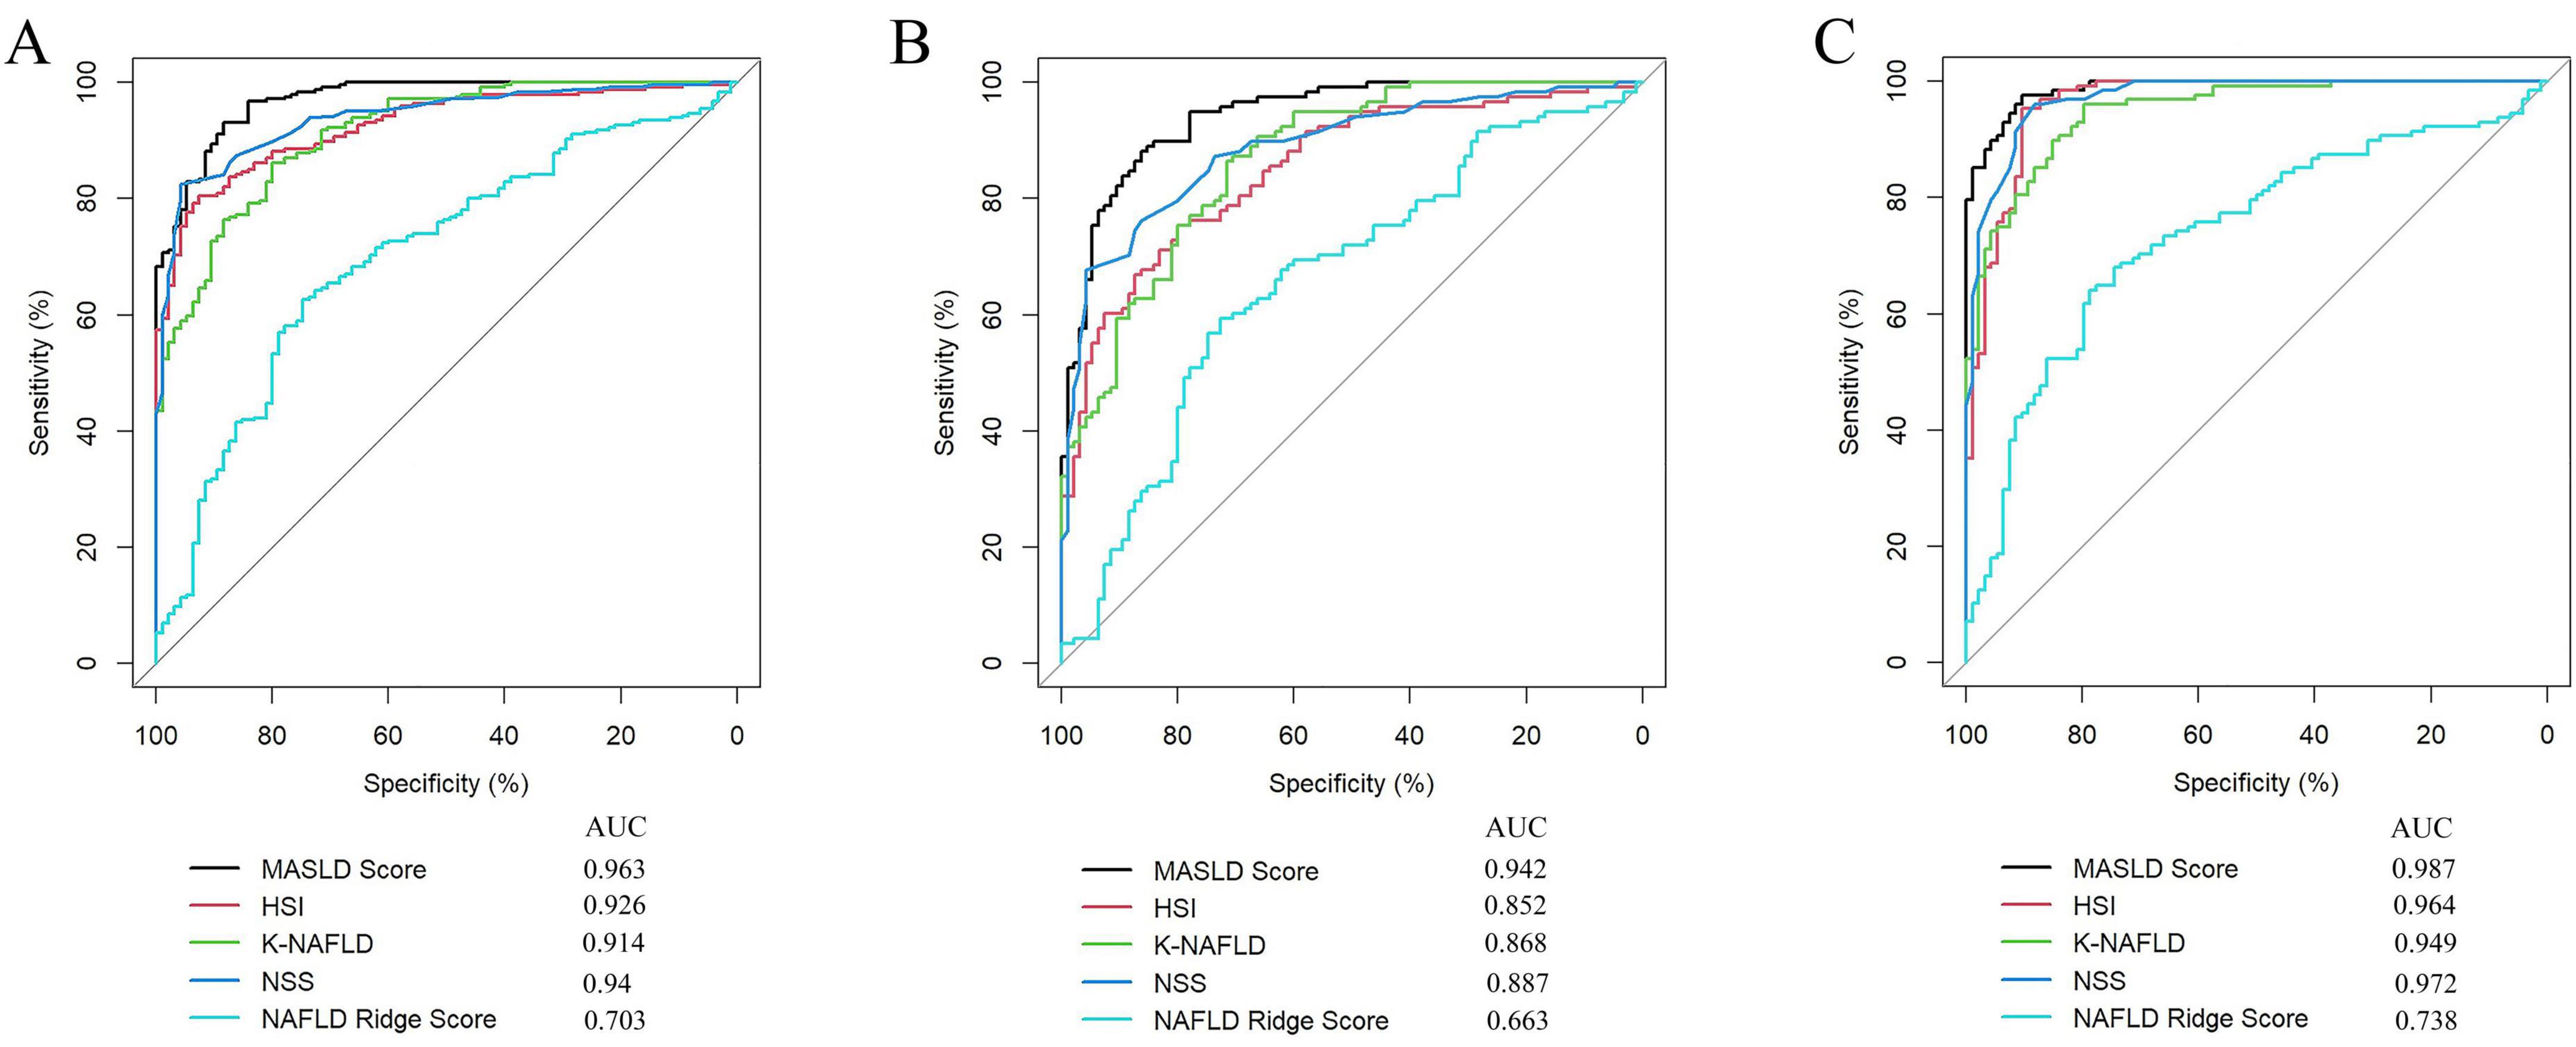
Figure 7. Comparison of the MASLD Score with MASLD-related scoring systems. (A) ROC curve analysis of the MASLD score, HSI, K-NAFLD, NSS, and NAFLD Ridge Score in the MASLD cohort. (B) Comparison of the diagnostic performance of the models in the non-obese MASLD population. (C) Comparison of the diagnostic performance of the models in the obese MASLD population.
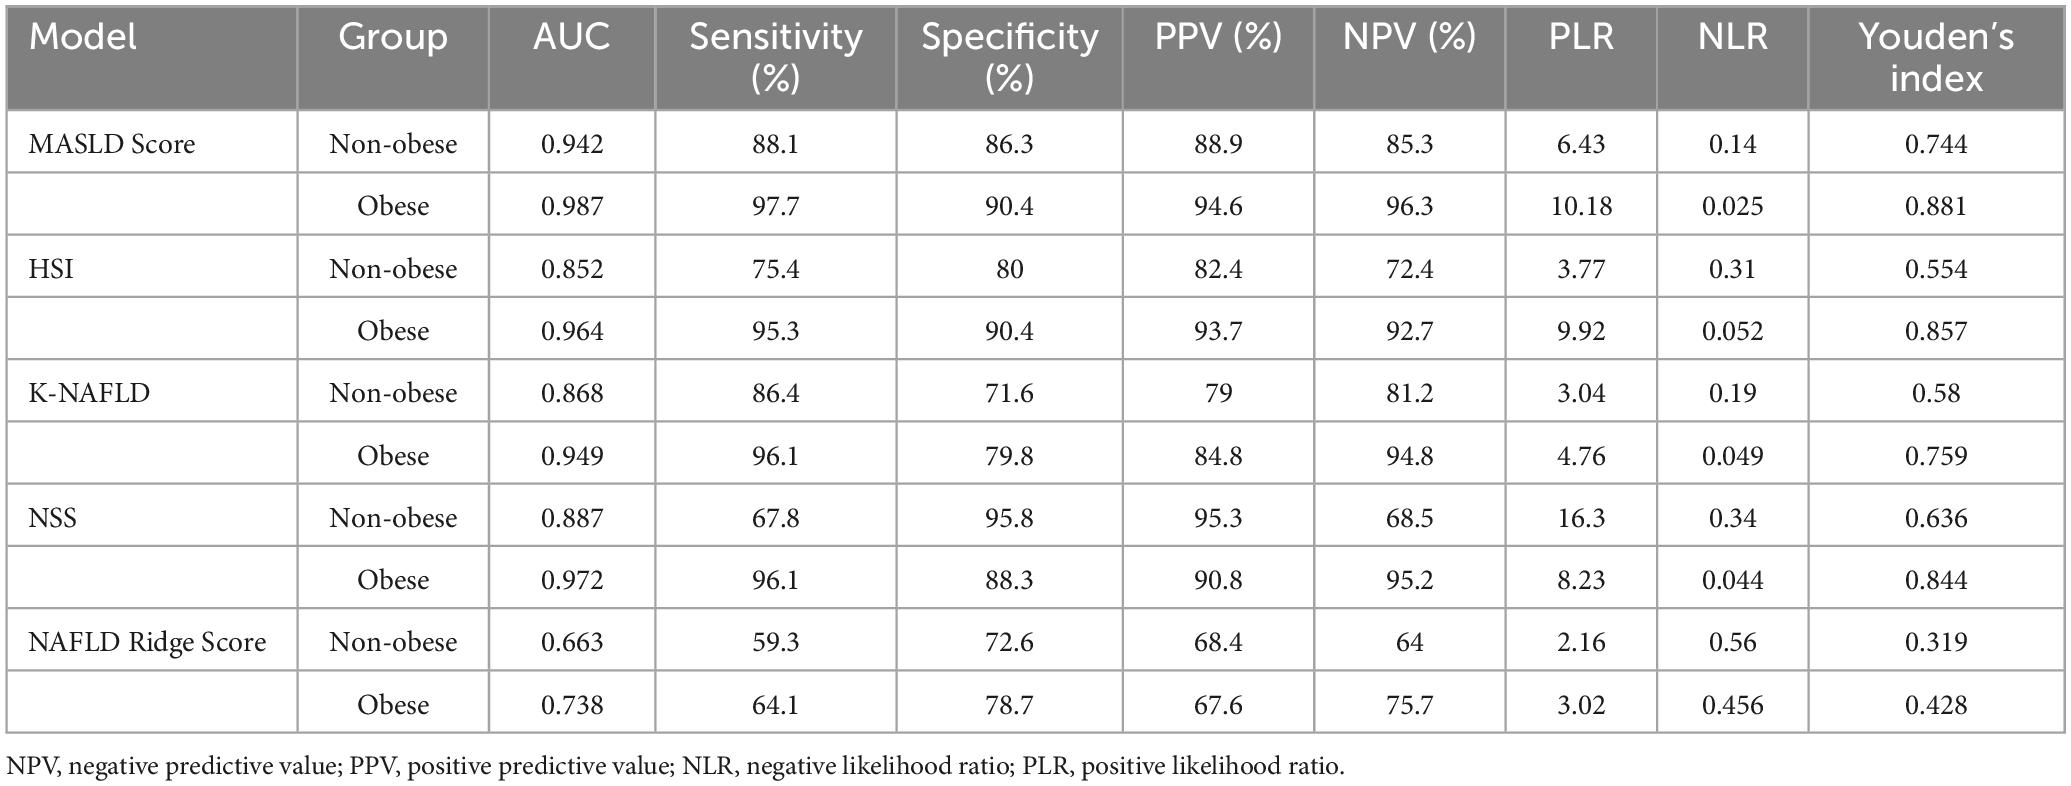
Table 5. Comparison of the diagnostic performance of the models in non-obese and obese MASLD populations.
4 Discussion
Research has demonstrated that the AGE/RAGE axis establishes a positive feedback loop that initiates a series of processes, including oxidative stress, inflammation, cellular malfunction, fibrosis, and apoptosis, all of which contribute to damage in end organs (18, 34). Conversely, the esRAGE provides a protective effect by inhibiting AGE/RAGE interactions (20, 26, 28). Therefore, a comprehensive assessment of AGEs and their receptors (esRAGE), is essential for understanding the development and progression of MASLD.
In the study, we discovered that the levels of AGEs were considerably elevated in MASLD patients than in healthy controls, aligning with findings from previous research. In a cross-sectional survey of MASLD cases (n = 67), serum AGEs were significantly elevated in both early and advanced stages of MASLD when compared to the normal group (25). Additionally, a controlled study of 58 MASLD patients and 58 healthy individuals found greater levels of late glycation markers, such as carboxymethyl-lysine, pentosidine, and AGE fluorescence, in the MASLD group (35). Interestingly, only three previous research have assessed the correlation between blood esRAGE levels and MASLD, despite the fact that several investigations have shown the link between esRAGE and liver disease. D’Adamo et al. (36) found that in a cohort of obese prepubertal children (n = 140, aged 6–10 years), serum esRAGE levels were lower in those with hepatic steatosis than in healthy controls. Francesca et al. (37) investigated 60 patients with MASLD and 50 without hepatic steatosis, finding that serum esRAGE levels were lower in the MASLD group. Conversely, Rohini et al. (38) reported that among 340 patients (BMI > 35) who underwent bariatric surgery, there were no significant differences in serum levels of esRAGE between those with MASLD and those without liver disease. These studies were conducted with smaller cohort samples or within specific populations and do not adequately reflect serum esRAGE levels in a broader MASLD population. Consequently, larger studies investigating esRAGE in MASLD are warranted. The present study was conducted in a larger cohort, serum esRAGE levels were elevated in patients with MASLD compared to healthy controls. Recent evidence suggests that RAGE activation leads to an increase in reactive oxygen species production and upregulation of various genes, including RAGE itself, thereby initiating a positive feedback loop (18). Since esRAGE is derived from RAGE (26), any alterations in RAGE levels are mirrored by changes in esRAGE levels. Consequently, the elevated RAGE levels are attributable to significantly increased serum AGEs, which may further elevate esRAGE levels. In conclusion, AGEs and esRAGE can be used as biomarkers for the diagnosis of MASLD.
The current study population found that the incidence was higher in females than males in non-obese MASLD populations. Recent studies have corroborated that non-obese MASLD is more prevalent among women (11, 39). Additionally, our findings revealed that non-obese MASLD patients were older than their obese counterparts, a result supported by a cross-sectional analysis of 946 MASLD cases (13). The comparison of serum AGEs and esRAGE levels between non-obese and obese MASLD patients found that serum AGEs were greater in obese MASLD patients, but there was no statistical difference. A comparison of correlations revealed a positive correlation between AGEs and BMI (P < 0.05). This was consistent with a bibliometric analysis that showed higher levels of serum AGEs in the presence of obesity (40). Notably, for the first time, our study discovered that obese MASLD patients had significantly elevated serum esRAGE levels than non-obese MASLD patients. Consistent with the idea in this paper, elevated amounts of AGEs can cause elevated levels of RAGE, which can then increase levels of esRAGE. There is a lack of studies on esRAGE in non-obese and obese MASLD, and the emergence of serum esRAGE as a non-invasive biomarker for non-obese and obese MASLD needs to be confirmed by further studies.
There have been numerous non-invasive and simple models created to identify MASLD (6, 7). The Fatty Liver Index (FLI), developed from a cohort of 5,780 individuals in Italy (10), is suitable for large-scale detection of MASLD (41). The Hepatic Steatosis Index (HSI) has demonstrated effectiveness as a simple screening tool for predicting MASLD in studies involving over 10,000 Korean patients (30). Other scoring systems, such as the Lipid Accumulation Product (LAP), can assess central lipid accumulation (42). MASLD results from a complex interaction of environmental, genetic, and dietary factors (43). Certain dietary practices, including excessive consumption of fructose and calories, as well as physical inactivity, are linked to the development of MASLD (44). However, there are notable differences between Asian and Western people’s food habits, lifestyles, and genetic origins (45). These scoring systems were originally designed for Western cohorts and may not be applicable to Asian individuals. Furthermore, there are notable variations in the clinical and metabolic features of individuals with MASLD who are not fat compared to their counterparts who are obese (13). Therefore, obesity should not be the only criterion for MASLD screening, particularly in light of the increasing prevalence of non-obese MASLD (12). This study developed a diagnostic model incorporating Age, WC, BMI, ALT, TG, HDL, AGEs, and esRAGE for diagnosing MASLD. To our knowledge, this is the first investigation to create a diagnostic model based on AGEs and esRAGE in MASLD patients. In this paper, we developed a nomogram to calculate the exact probability of having MASLD, facilitating the model’s application in clinical settings. The values of each variable in the nomogram are assigned scores on a scale from 0 to 100, and the scores are subsequently summed. The total sum is plotted on the total score axis, enabling the prediction of the probability of MASLD. Internal validation using Bootstrap resampling demonstrated good discrimination, indicating that the model we constructed is stable for prediction. The most crucial factor to consider when using a model is determining whether an individual requires further treatment or care based on their actual needs (46). To establish clinical utility, we used decision curve analysis to determine whether model-assisted decision-making would give clinical advantages to individuals. The decision curves indicated that using our model to predict MASLD could yield greater benefits compared to a “treat all” or “treat none” approach. In the present study, the MASLD Score demonstrated superior diagnostic performance compared with existing MASLD models (i.e., HSI, K-NAFLD, NSS, and NAFLD Ridge Score), achieving high accuracy in both the overall population and the non-obese subgroup, thereby overcoming the poor diagnostic performance of traditional models in non-obese MASLD patients. Therefore, this model might be a useful tool for Chinese community doctors in diagnosing MASLD.
Unavoidably, this study has certain limitations. First, due to the fact that this research is cross-sectional, we are unable to demonstrate that there is a causal association between the variables. Second, this study employed a single-center design with participants from a single region, which may introduce bias due to geographic diet, genetics, or environmental factors. Future multicenter studies are essential to validate the model’s generalizability, particularly by including cohorts from diverse ethnic, geographic, and socioeconomic backgrounds. In addition, although conventional ultrasound is widely employed for the clinical screening of MASLD, its capacity to quantitatively assess steatosis remains limited. Future studies should incorporate more precise imaging techniques (e.g., MRI-PDFF or controlled attenuation parameter) to further enhance diagnostic accuracy.
5 Conclusion
In conclusion, this cross-sectional study indicates that AGEs and esRAGE can be used as potential non-invasive biomarkers for differentiating patients with MASLD. Additionally, this study is the first to show that obese MASLD patients have considerably higher serum esRAGE levels than their non-obese counterparts. Finally, we create and evaluate a diagnostic model to predict the risk of MASLD, which assists in identifying high-risk individuals and enhancing strategies for the prevention and treatment of MASLD.
Data availability statement
The datasets presented in this study can be found in online repositories. The names of the repository/repositories and accession number(s) can be found in the article/supplementary material.
Ethics statement
The studies involving humans were approved by the Nanhua Hospital Ethics Committee at Nanhua University. The studies were conducted in accordance with the local legislation and institutional requirements. The participants provided their written informed consent to participate in this study.
Author contributions
XC: Data curation, Writing – original draft, Writing – review & editing, Methodology. XX: Software, Writing – original draft, Writing – review & editing. PJ: Supervision, Writing – review & editing. NF: Supervision, Writing – review & editing.
Funding
The author(s) declare that financial support was received for the research and/or publication of this article. This work was jointly supported by the Special Funding for the Construction of Innovative Provinces in Hunan (2021SK4031), Natural Science Foundation of Hunan Province (2024JJ5362, 2024JJ9401, 2023JJ60370, 2022JJ40407), Major research projects come from National Clinical Key Specialty (Z2023081), Scientific Research Project of University of South China (Documents of the university of south China [2019]02), Clinical Medical Technology Innovation Guidance Project of Hunan Province (2021SK51912), and Guiding Planning Project of Hengyang[2021]51-129, [2021]51-144.
Conflict of interest
The authors declare that the research was conducted in the absence of any commercial or financial relationships that could be construed as a potential conflict of interest.
Generative AI statement
The authors declare that no Generative AI was used in the creation of this manuscript.
Publisher’s note
All claims expressed in this article are solely those of the authors and do not necessarily represent those of their affiliated organizations, or those of the publisher, the editors and the reviewers. Any product that may be evaluated in this article, or claim that may be made by its manufacturer, is not guaranteed or endorsed by the publisher.
References
1. Miao L, Targher G, Byrne C, Cao Y, Zheng M. Current status and future trends of the global burden of MASLD. Trends Endocrinol Metab. (2024) 35:697–707. doi: 10.1016/j.tem.2024.02.007
2. Le M, Yeo Y, Zou B, Barnet S, Henry L, Cheung R, et al. Forecasted 2040 global prevalence of nonalcoholic fatty liver disease using hierarchical bayesian approach. Clin Mol Hepatol. (2022) 28:841–50. doi: 10.3350/cmh.2022.0239
3. Nalbantoglu I, Brunt E. Role of liver biopsy in nonalcoholic fatty liver disease. World J Gastroenterol. (2014) 20:9026–37. doi: 10.3748/wjg.v20.i27.9026
4. Mózes F, Lee J, Selvaraj E, Jayaswal A, Trauner M, Boursier J, et al. Diagnostic accuracy of non-invasive tests for advanced fibrosis in patients with NAFLD: An individual patient data meta-analysis. Gut. (2022) 71:1006–19. doi: 10.1136/gutjnl-2021-324243
5. Shen D, Cai X, Hu J, Song S, Zhu Q, Ma H, et al. Inflammatory indices and MAFLD prevalence in hypertensive patients: A large-scale cross-sectional analysis from China. J Inflamm Res. (2025) 18:1623–38. doi: 10.2147/jir.S503648
6. Ahn S. Noninvasive serum biomarkers for liver steatosis in nonalcoholic fatty liver disease: Current and future developments. Clin Mol Hepatol. (2023) 29:S150–6. doi: 10.3350/cmh.2022.0362
7. Gîlcã-Blanariu G, Budur D, Mitricã D, Gologan E, Timofte O, Bãlan G, et al. Advances in noninvasive biomarkers for nonalcoholic fatty liver disease. Metabolites. (2023) 13:1115. doi: 10.3390/metabo13111115
8. Wang J, Jiang S, Hu A, Zhou A, Hu T, Li H, et al. Non-invasive diagnosis of non-alcoholic fatty liver disease: Current status and future perspective. Heliyon. (2024) 10:e27325. doi: 10.1016/j.heliyon.2024.e27325
9. Dawod S, Brown K. Non-invasive testing in metabolic dysfunction-associated steatotic liver disease. Front Med (Lausanne). (2024) 11:1499013. doi: 10.3389/fmed.2024.1499013
10. Bedogni G, Bellentani S, Miglioli L, Masutti F, Passalacqua M, Castiglione A, et al. The fatty liver index: A simple and accurate predictor of hepatic steatosis in the general population. BMC Gastroenterol. (2006) 6:33. doi: 10.1186/1471-230x-6-33
11. Hu H, Han Y, Cao C, He Y. The triglyceride glucose-body mass index: A non-invasive index that identifies non-alcoholic fatty liver disease in the general Japanese population. J Transl Med. (2022) 20:398. doi: 10.1186/s12967-022-03611-4
12. Ye Q, Zou B, Yeo Y, Li J, Huang D, Wu Y, et al. Global prevalence, incidence, and outcomes of non-obese or lean non-alcoholic fatty liver disease: A systematic review and meta-analysis. Lancet Gastroenterol Hepatol. (2020) 5:739–52. doi: 10.1016/s2468-1253(20)30077-7
13. Zhang Y, Xiang L, Qi F, Cao Y, Zhang W, Lv T, et al. The metabolic profiles and body composition of non-obese metabolic associated fatty liver disease. Front Endocrinol (Lausanne). (2024) 15:1322563. doi: 10.3389/fendo.2024.1322563
14. Buzzetti E, Pinzani M, Tsochatzis E. The multiple-hit pathogenesis of non-alcoholic fatty liver disease (NAFLD). Metabolism. (2016) 65:1038–48. doi: 10.1016/j.metabol.2015.12.012
15. Shen D, Cai X, Hu J, Song S, Zhu Q, Ma H, et al. Associating plasma aldosterone concentration with the prevalence of MAFLD in hypertensive patients: Insights from a large-scale cross-sectional study. Front Endocrinol (Lausanne). (2024) 15:1451383. doi: 10.3389/fendo.2024.1451383
16. Sayej W, Knight Iii P, Guo W, Mullan B, Ohtake P, Davidson B, et al. Advanced glycation end products induce obesity and hepatosteatosis in CD-1 wild-type mice. Biomed Res Int. (2016) 2016:7867852. doi: 10.1155/2016/7867852
17. Leung C, Herath C, Jia Z, Goodwin M, Mak K, Watt M, et al. Dietary glycotoxins exacerbate progression of experimental fatty liver disease. J Hepatol. (2014) 60:832–8. doi: 10.1016/j.jhep.2013.11.033
18. Fernando D, Forbes J, Angus P, Herath C. Development and progression of non-alcoholic fatty liver disease: The role of advanced glycation end products. Int J Mol Sci. (2019) 20:5037. doi: 10.3390/ijms20205037
19. Twarda-Clapa A, Olczak A, Białkowska A, Koziołkiewicz M. Advanced glycation end-products (AGEs): Formation, chemistry, classification, receptors, and diseases related to AGEs. Cells. (2022) 11:1312. doi: 10.3390/cells11081312
20. Matafome P, Rodrigues T, Sena C, Seiça R. Methylglyoxal in metabolic disorders: Facts, myths, and promises. Med Res Rev. (2017) 37:368–403. doi: 10.1002/med.21410
21. Yamagishi S, Matsui T. Role of receptor for advanced glycation end products (RAGE) in liver disease. Eur J Med Res. (2015) 20:15. doi: 10.1186/s40001-015-0090-z
22. Pang Q, Sun Z, Shao C, Cai H, Bao Z, Wang L, et al. CML/RAGE signal bridges a common pathogenesis between atherosclerosis and non-alcoholic fatty liver. Front Med (Lausanne). (2020) 7:583943. doi: 10.3389/fmed.2020.583943
23. Wang J, Liu H, Xie G, Cai W, Xu J. Identification of hub genes and key pathways of dietary advanced glycation end products-induced non-alcoholic fatty liver disease by bioinformatics analysis and animal experiments. Mol Med Rep. (2020) 21:685–94. doi: 10.3892/mmr.2019.10872
24. Pereira E, Paula D, de Araujo B, da Fonseca M, Diniz M, Daliry A, et al. Advanced glycation end product: A potential biomarker for risk stratification of non-alcoholic fatty liver disease in ELSA-Brasil study. World J Gastroenterol. (2021) 27:4913–28. doi: 10.3748/wjg.v27.i29.4913
25. Świderska M, Maciejczyk M, Zalewska A, Pogorzelska J, Flisiak R, Chabowski A. Oxidative stress biomarkers in the serum and plasma of patients with non-alcoholic fatty liver disease (NAFLD). Can plasma AGE be a marker of NAFLD? Oxidative stress biomarkers in NAFLD patients. Free Radic Res. (2019) 53:841–50. doi: 10.1080/10715762.2019.1635691
26. Yonekura H, Yamamoto Y, Sakurai S, Petrova R, Abedin M, Li H, et al. Novel splice variants of the receptor for advanced glycation end-products expressed in human vascular endothelial cells and pericytes, and their putative roles in diabetes-induced vascular injury. Biochem J. (2003) 370:1097–109. doi: 10.1042/bj20021371
27. Yamagishi S, Imaizumi T. Serum levels of soluble form of receptor for advanced glycation end products (sRAGE) may reflect tissue RAGE expression in diabetes. Arterioscler Thromb Vasc Biol. (2007) 27:e32. doi: 10.1161/atvbaha.107.139923
28. Yamagishi S, Matsui T, Nakamura K. Kinetics, role and therapeutic implications of endogenous soluble form of receptor for advanced glycation end products (sRAGE) in diabetes. Curr Drug Targets. (2007) 8:1138–43. doi: 10.2174/138945007782151298
29. Rinella M, Lazarus J, Ratziu V, Francque S, Sanyal A, Kanwal F, et al. A multisociety Delphi consensus statement on new fatty liver disease nomenclature. J Hepatol. (2023) 79:1542–56. doi: 10.1016/j.jhep.2023.06.003
30. Lee J, Kim D, Kim H, Lee C, Yang J, Kim W, et al. Hepatic steatosis index: A simple screening tool reflecting nonalcoholic fatty liver disease. Dig Liver Dis. (2010) 42:503–8. doi: 10.1016/j.dld.2009.08.002
31. Jeong S, Kim K, Chang J, Choi S, Kim S, Son J, et al. Development of a simple nonalcoholic fatty liver disease scoring system indicative of metabolic risks and insulin resistance. Ann Transl Med. (2020) 8:1414. doi: 10.21037/atm-20-2951
32. Zhou Y, Zhou Y, Zheng J, Liu W, Van Poucke S, Zou T, et al. NAFL screening score: A basic score identifying ultrasound-diagnosed non-alcoholic fatty liver. Clin Chim Acta. (2017) 475:44–50. doi: 10.1016/j.cca.2017.09.020
33. Yip T, Ma A, Wong V, Tse Y, Chan H, Yuen P, et al. Laboratory parameter-based machine learning model for excluding non-alcoholic fatty liver disease (NAFLD) in the general population. Aliment Pharmacol Ther. (2017) 46:447–56. doi: 10.1111/apt.14172
34. Thornalley P. Cell activation by glycated proteins. AGE receptors, receptor recognition factors and functional classification of AGEs. Cell Mol Biol (Noisy-le-grand). (1998) 44:1013–23.
35. Palma-Duran S, Kontogianni M, Vlassopoulos A, Zhao S, Margariti A, Georgoulis M, et al. Serum levels of advanced glycation end-products (AGEs) and the decoy soluble receptor for AGEs (sRAGE) can identify non-alcoholic fatty liver disease in age-, sex- and BMI-matched normo-glycemic adults. Metabolism. (2018) 83:120–7. doi: 10.1016/j.metabol.2018.01.023
36. D’Adamo E, Marcovecchio M, Giannini C, de Giorgis T, Chiavaroli V, Chiarelli F, et al. Improved oxidative stress and cardio-metabolic status in obese prepubertal children with liver steatosis treated with lifestyle combined with Vitamin E. Free Radic Res. (2013) 47:146–53. doi: 10.3109/10715762.2012.755262
37. Santilli F, Blardi P, Scapellato C, Bocchia M, Guazzi G, Terzuoli L, et al. Decreased plasma endogenous soluble RAGE, and enhanced adipokine secretion, oxidative stress and platelet/coagulative activation identify non-alcoholic fatty liver disease among patients with familial combined hyperlipidemia and/or metabolic syndrome. Vascul Pharmacol. (2015) 72:16–24. doi: 10.1016/j.vph.2015.04.004
38. Mehta R, Shaw G, Masschelin P, Felix S, Otgonsuren M, Baranova A, et al. Polymorphisms in the receptor for advanced glycation end-products (RAGE) gene and circulating RAGE levels as a susceptibility factor for non-alcoholic steatohepatitis (NASH). PLoS One. (2018) 13:e0199294. doi: 10.1371/journal.pone.0199294
39. Shida T, Oshida N, Suzuki H, Okada K, Watahiki T, Oh S, et al. Clinical and anthropometric characteristics of non-obese non-alcoholic fatty liver disease subjects in Japan. Hepatol Res. (2020) 50:1032–46. doi: 10.1111/hepr.13543
40. Liman P, Anastasya K, Salma N, Yenny Y, Faradilla M. Research trends in advanced glycation end products and obesity: Bibliometric analysis. Nutrients. (2022) 14:5255. doi: 10.3390/nu14245255
41. Motamed N, Faraji A, Khonsari M, Maadi M, Tameshkel F, Keyvani H, et al. Fatty liver index (FLI) and prediction of new cases of non-alcoholic fatty liver disease: A population-based study of northern Iran. Clin Nutr. (2020) 39:468–74. doi: 10.1016/j.clnu.2019.02.024
42. Kahn H. The “lipid accumulation product” performs better than the body mass index for recognizing cardiovascular risk: A population-based comparison. BMC Cardiovasc Disord. (2005) 5:26. doi: 10.1186/1471-2261-5-26
43. Oyarzún J, Andia M, Uribe S, Núñez Pizarro P, Núñez G, Montenegro G, et al. Honeybee pollen extracts reduce oxidative stress and steatosis in hepatic cells. Molecules. (2020) 26:6. doi: 10.3390/molecules26010006
44. Dongiovanni P, Valenti L. A nutrigenomic approach to non-alcoholic fatty liver disease. Int J Mol Sci. (2017) 18:1534. doi: 10.3390/ijms18071534
45. Lin Y, Gong X, Li X, Shao C, Wu T, Li M, et al. Distinct cause of death profiles of hospitalized non-alcoholic fatty liver disease: A 10 years’ cross-sectional multicenter study in China. Front Med (Lausanne). (2020) 7:584396. doi: 10.3389/fmed.2020.584396
Keywords: MASLD, non-obese, advanced glycation end products, diagnostic model, esRAGE
Citation: Cao X, Xiao X, Jiang P and Fu N (2025) Construction and evaluation of a diagnostic model for metabolic dysfunction-associated steatotic liver disease based on advanced glycation end products and their receptors. Front. Med. 12:1539708. doi: 10.3389/fmed.2025.1539708
Received: 04 December 2024; Accepted: 14 March 2025;
Published: 28 March 2025.
Edited by:
Cristiane Nogueira, Federal University of Rio de Janeiro, BrazilReviewed by:
Giovani Schulte Farina, School of Public Health and Harvard University, United StatesDi Shen, People’s Hospital of Xinjiang Uygur Autonomous Region, China
Copyright © 2025 Cao, Xiao, Jiang and Fu. This is an open-access article distributed under the terms of the Creative Commons Attribution License (CC BY). The use, distribution or reproduction in other forums is permitted, provided the original author(s) and the copyright owner(s) are credited and that the original publication in this journal is cited, in accordance with accepted academic practice. No use, distribution or reproduction is permitted which does not comply with these terms.
*Correspondence: Peipei Jiang, MTg4NTYzMTVAcXEuY29t; Nian Fu, MjAwMmZ1bmlhbkAxNjMuY29t
†These authors share first authorship