 Liping Zhan1†
 Yuping Yang1†Biao Nie1,2†
 Yanqi Kou1†
 Shenshen Du1,3Yuan Tian4Yujie Huang1Ruyin Ye1Zhe Huang5Botao Luo4Lei Ge6*
 Shicai Ye1*
- 1Department of Gastroenterology, Affiliated Hospital of Guangdong Medical University, Guangdong Medical University, Zhanjiang, China
- 2Department of Gastroenterology, The First Affiliated Hospital of Jinan University, Jinan University, Guangzhou, China
- 3Department of Gastroenterology, Huanghe Sanmenxia Hospital, Sanmenxia, China
- 4Department of Pathology, Guangdong Medical University, Zhanjiang, China
- 5Department of Colorectal Surgery, Affiliated Hospital of Guangdong Medical University, Guangdong Medical University, Zhanjiang, China
- 6Department of Gastrointestinal Surgery, Affiliated Hospital of Guangdong Medical University, Guangdong Medical University, Zhanjiang, China
Objectives: This study investigates serum markers for short-term prognosis in hepatic encephalopathy patients.
Background: Patients with hepatic encephalopathy face elevated mortality rates and bleak prognoses. However, effective prognostic models or indicators are lacking. This study aims to explore serum markers for predicting short-term prognosis in these patients.
Methods: We conducted a retrospective analysis of 552 patients with hepatic encephalopathy, categorizing 429 individuals meeting exclusion criteria into normal and high activated partial thromboplastin time (APTT) groups. We assessed 12-day and 25-day survival rates using Kaplan–Meier analysis and Cox regression models to examine associations between groups and outcomes.
Results: Upon comparing baseline characteristics, the high APTT group exhibited significant disparities in acute kidney injury, sepsis, coagulation disorders, and ascites (p < 0.05). In the multivariate COX regression model, the hazard ratios [HRs; 95% confidence interval (CI)] of 12- and 25-day mortality were 1.012 (1.001, 1.022, p = 0.033) and 1.010 (1.002, 1.018, p = 0.013), respectively. We discovered that APTT demonstrated an independent association with prognosis. Our findings revealed that the ability of APTT to predict short-term prognosis surpasses that of the traditional MELD model. Regarding 12- and 25-day survival, Kaplan–Meier survival curves from these groups demonstrated a lower survival probability for patients in the high APTT group than the normal group (log-rank p < 0.05). The results of subgroup analysis and interaction analysis indicate that APTT is not influenced by other confounding factors.
Conclusion: A prolonged APTT suggests a poorer short-term prognosis in patients with hepatic encephalopathy.
Introduction
Hepatic encephalopathy, a neurological disorder stemming from liver dysfunction, is characterized by cognitive impairment and altered consciousness, and its incidence has steadily risen in recent years (1–3). This condition presents a spectrum of neurological and psychiatric abnormalities, ranging from mild cognitive impairment to severe coma, often resulting in disorientation or profound debilitation for affected individuals (4, 5). Diagnosis of hepatic encephalopathy primarily hinges on clinical symptoms such as dizziness, confusion, lethargy, and coma, alongside the exclusion of alternative neurological disorders (6). The etiology of liver disease is a fundamental determinant of the progression and prognosis of hepatic encephalopathy, encompassing conditions such as cirrhosis and non-cirrhotic portal hypertension. Once diagnosed, prompt intervention is imperative. However, managing this condition not only imposes a financial burden on patients but also escalates societal expenses (7). Therefore, accurate assessment of prognosis is pivotal in guiding appropriate treatment strategies for these patients (8–10).
Despite ongoing research, the prognosis and management of hepatic encephalopathy remain inconclusive. Liver injury is known to diminish blood coagulation factors such as factors VII, IX, and X, leading to a finely balanced hemostatic state in affected patients (11). The liver plays a critical role in synthesizing blood coagulation factors, and both acute and chronic liver diseases, along with other factors, contribute to coagulation abnormalities. These abnormalities include reduced synthesis of coagulation and inhibitory factors, decreased clearance of activation factors, platelet deficiencies in both quantity and quality, hyperfibrinolysis, and increased intravascular coagulation. The propensity to bleed significantly heightens the risk of illness and mortality among patients with liver disease (12). While the international normalized ratio (INR) is strongly linked to the prognosis and severity of acute or chronic liver disease, it inadequately predicts bleeding risk and should not be relied upon solely for this purpose (13). The connection between hepatic encephalopathy and abnormalities in the coagulation system can be identified through routine and specialized thrombotests. Activated partial thromboplastin time (APTT), a widely used coagulation test, warrants further examination, particularly in patients with liver disease, as prolongation of APTT adversely impacts the prognosis of hepatic encephalopathy patients.
While hepatic encephalopathy is linked with liver dysfunction, portal hypertension, skeletal muscle issues, nutrition, and gut microbiome disturbances, unconventional assessments such as sarcopenia have demonstrated effectiveness in predicting outcomes (14–16). Despite the efficacy of these markers in prognosis prediction, relying solely on muscular steatosis for hepatic encephalopathy prognosis assessment proves impractical due to cost, patient compliance issues, and measurement complexities in clinical settings. If we can pinpoint a simpler-to-measure indicator with predictive performance akin to the MELD model, boasting high accuracy and resilience to confounding factors, early intervention in patient management could markedly enhance outcomes. Our aim was to identify a swift and precise indicator for assessing hepatic encephalopathy prognosis.
Materials and methods
Utilizing database searches, we accessed data from the Medical Information Market for Intensive Care (MIMIC)-MEDI-IV database covering the period from 2012 to 2022. We focused on patients diagnosed with hepatic encephalopathy. The dataset retrieved from this database has undergone anonymization, ensuring that all personal patient information has been coded and any identifiable data excluded. Consequently, patient consent is deemed unnecessary for the utilization of this data (17, 18).
In this retrospective study, we gathered data from the MIMIC IV database, comprising 552 patients diagnosed with hepatic encephalopathy. We applied the following exclusion criteria: (1) patients who deceased within 24 h of admission (n = 13); (2) patients with hospital readmissions (n = 99); (3) patients lacking recorded activated partial thromboplastin time data (n = 14). After applying these criteria, we identified a subset of 429 patients for analysis. The survival rates were observed at 12 days and 25 days. Based on their APTT values, which measure activated partial thromboplastin time, we categorized them into two groups. Given the normal APTT range of 23–36, individuals with a value exceeding 37 were included in the high APTT group, while those with APTT values falling within 23–36 were assigned to the normal APTT group. The high APTT group comprised 280 individuals, while the normal APTT group consisted of 149 individuals. For this study, we designated the high APTT group as the experimental group and the normal APTT group as the control group (Figure 1). Following consideration of potential confounding factors such as age, complications, and duration of hospital stay, we initially conducted a univariate analysis to identify risk factors for hepatic encephalopathy patients and potential confounders. Subsequently, we employed the COX regression model to comprehensively analyze all factors. We further strengthened our analysis by employing the Kaplan–Meier method for survival analysis, aimed at capturing survival rates among patients in the high APTT group compared to the normal group. Through comparison with MELD scoring systems via receiver operating curves (ROC), we assessed the predictive abilities of risk models for the 12- and 25-day survival of hepatic encephalopathy patients. The heatmap illustrates the distribution of activated partial thromboplastin time (APTT) across different levels of liver function impairment. Subgroup analysis revealed an interaction between APTT and various confounding factors in patients with hepatic encephalopathy.
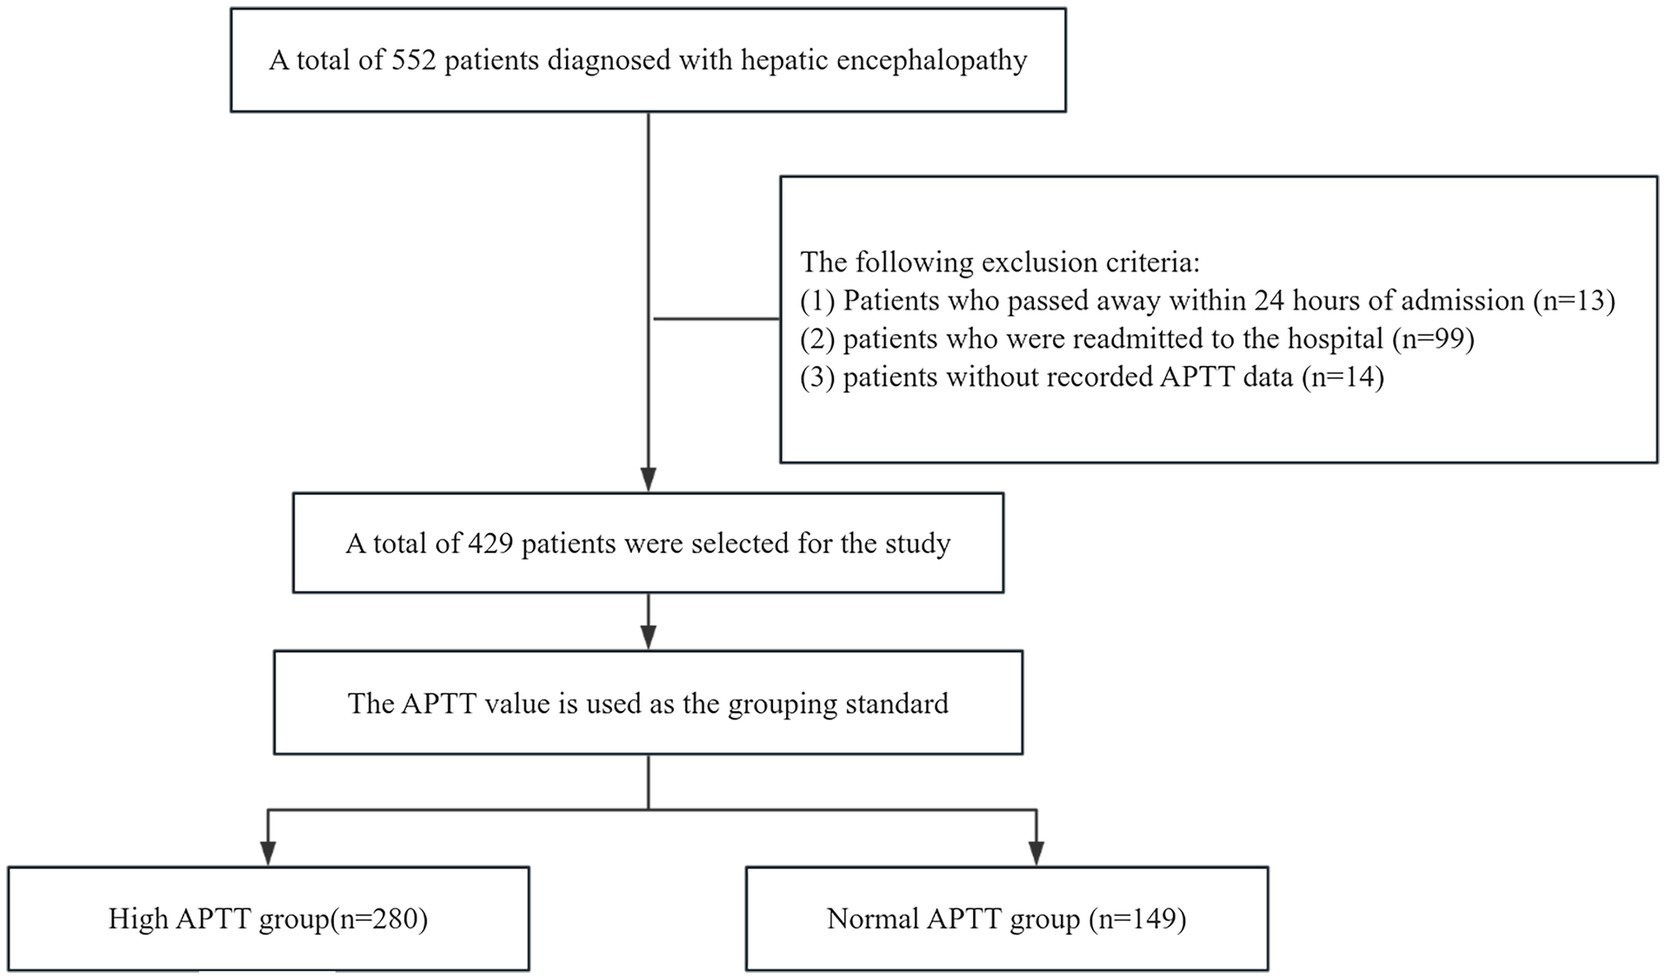
Figure 1. Flow diagram of group selection. (APTT: activated partial thromboplastin time).
Data extraction
We collected data on various variables, including sex, age, length of hospital stay, length of ICU stay, routine biochemistry, presence of complications, and use of vasopressin. Subsequently, we compared scores of Logistic Organ Dysfunction System, Sequential Organ Failure Assessment, Autoimmune Polyglandular Syndrome Type III, Model for End-Stage Liver Disease, Oxford Acute Severity of Illness Score, Simplified Acute Physiology Score II, and Systemic Inflammatory Response Syndrome, between the experimental (high activated partial thromboplastin time) and control (normal activated partial thromboplastin time) groups. Our primary focus centered on studying the short-term survival time of patients within these groups. While the study cohort may include patients with both first-episode and recurrent hepatic encephalopathy, comprehensive pre-hospitalization data, including Child–Turcotte–Pugh and Model for End-Stage Liver Disease combined with serum sodium concentration scores, were not uniformly available.
Data analysis
For comprehensive analysis and comparison between the two groups, we utilized SPSS version 27 (IBM SPSS) for statistical analysis. A bilateral p-value of less than 0.05 was deemed statistically significant. Numerical variables were described using mean for normally distributed data and median for non-normally distributed data, with normality assessed by the Shapiro–Wilk test. For normally distributed data, the t-test was used for group comparisons; for non-normally distributed data, the Mann–Whitney U test was applied. Qualitative data were summarized using percentages, with group comparisons conducted using the chi-square test or Fisher’s exact test where appropriate. Heatmaps were used to visualize data distribution and intergroup differences. Furthermore, Cox regression was employed to identify risk factors for hepatic encephalopathy, and the predictive power of the score was evaluated using receiver operating characteristic (ROC) curve analysis. To compare the AUC values between different prediction models, the DeLong test was employed. This test assesses the statistical significance of the AUC difference by estimating the standard error and covariance, thereby evaluating the significance of the performance differences between the models. Survival curves were compared using the log-rank test. Additionally, the test for comparing areas under ROC curves was performed to evaluate differences in predictive accuracy. Survival analysis was conducted utilizing Kaplan–Meier (KM) and Cox regression, with potential confounding factors taken into account.
Results
Participation in the baseline characteristics of patients
Initially, 552 patients were enrolled in the study. After applying specific exclusion criteria, a final cohort of 429 patients was included in the analysis. These patients were stratified into two groups based on their activated partial thromboplastin time (APTT) levels: the high APTT group (n = 280) and the normal APTT group (n = 149). The median APTT value for the normal group was 31.80 (IQR: 28.60–34.40) (95% CI: 30.19, 31.35), while the median for the high APTT group was 48.15 (IQR: 59.00–41.975) (95% CI: 53.07, 59.15). The two-sided p-value of the t-test was less than 0.001 at a significance level of 0.05, indicating a significant difference in APTT values between the two groups.
Regarding baseline characteristics, no statistically significant differences were observed between the high APTT and normal APTT groups in terms of sex, erythrocyte specific volume, mean erythrocyte hemoglobin concentration, potassium, Glasgow Coma Scale (GCS), and Oxford Acute Severity of Illness Score (OASIS) scores (p > 0.05) (Table 1). However, significant differences were noted between the two groups in terms of age and length of hospital stay, with patients in the high APTT group being younger and having longer hospitalization durations.
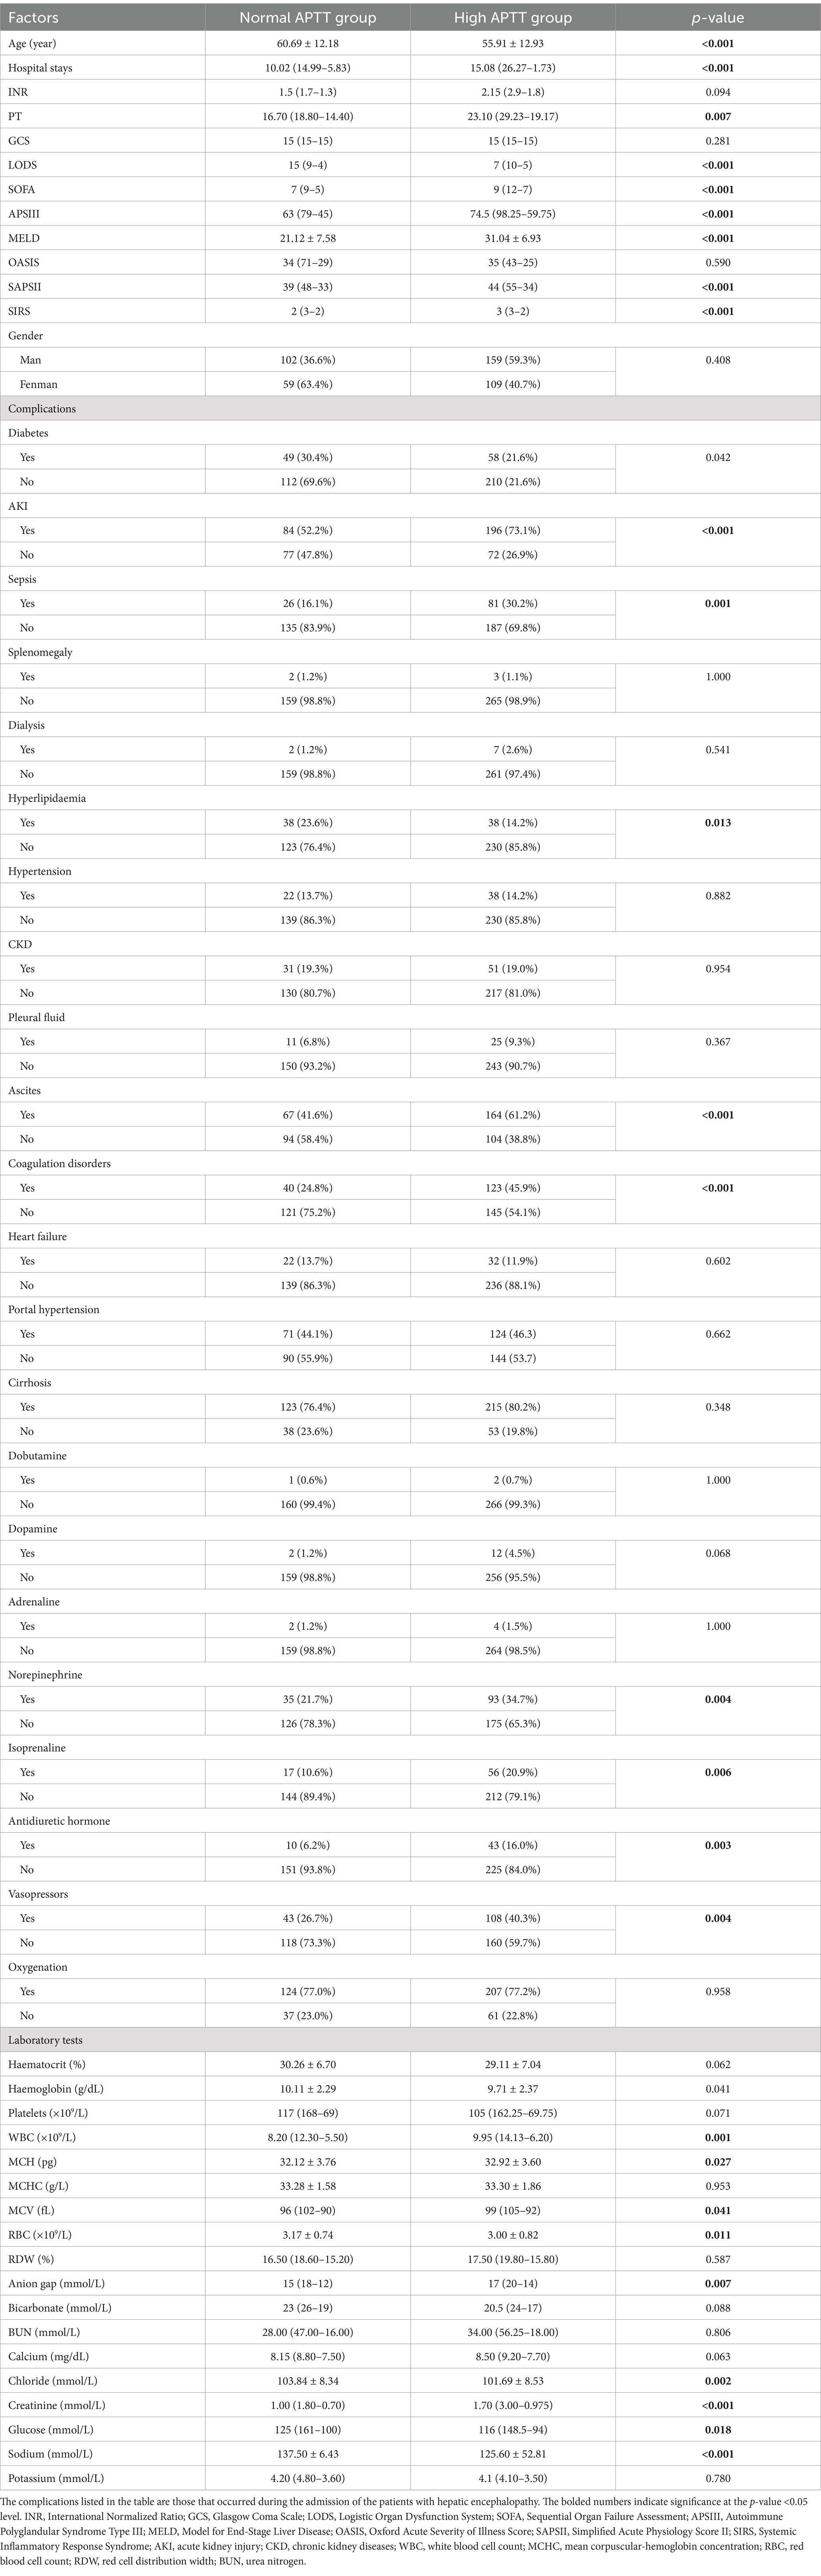
Table 1. Baseline characteristics of normal and high groups.
Additionally, significant disparities were identified between the high APTT and normal APTT groups in hematocrit, hemoglobin, platelet count, white blood cell count, mean corpuscular volume, mean corpuscular hemoglobin concentration, red blood cell count (Table 1).
Furthermore, differences were observed in the use of norepinephrine, isoprenaline, antidiuretic hormone, and vasopressin, as well as the prevalence of diabetes, acute kidney injury, coagulation disorders, ascites, hyperlipidemia, sepsis, and other complications between the two groups. Notably, scores for Logistic Organ Dysfunction System (LODS), Sequential Organ Failure Assessment (SOFA), Acute Physiology and Chronic Health Evaluation III (APSIII), and Model for End-Stage Liver Disease (MELD) were significantly higher in the high APTT group compared to the normal APTT group. The study included 91 patients without cirrhosis, reflecting the broader clinical context in which hepatic encephalopathy can arise from non-cirrhotic conditions. Within the subgroup of cirrhotic patients, elevated APTT remained an independent predictor of short-term prognosis, highlighting the robustness and applicability of our findings.
Elevated APTT indicates poor short-term prognosis in patients with hepatic encephalopathy
Our Survival plots figure revealed a significantly lower rate of survival for patients in the high APTT group, evident at both the 12-day and 25-day time points (Figures 2A,B). In the 12-day survival analysis, the log-rank (Mantel–Cox) p-value was found to be less than 0.001, indicating a robust statistical significance. Similarly, in the 25-day survival analysis, the log-rank (Mantel–Cox) p-value was 0.014, indicating a significant difference between the survival rates of the two groups.
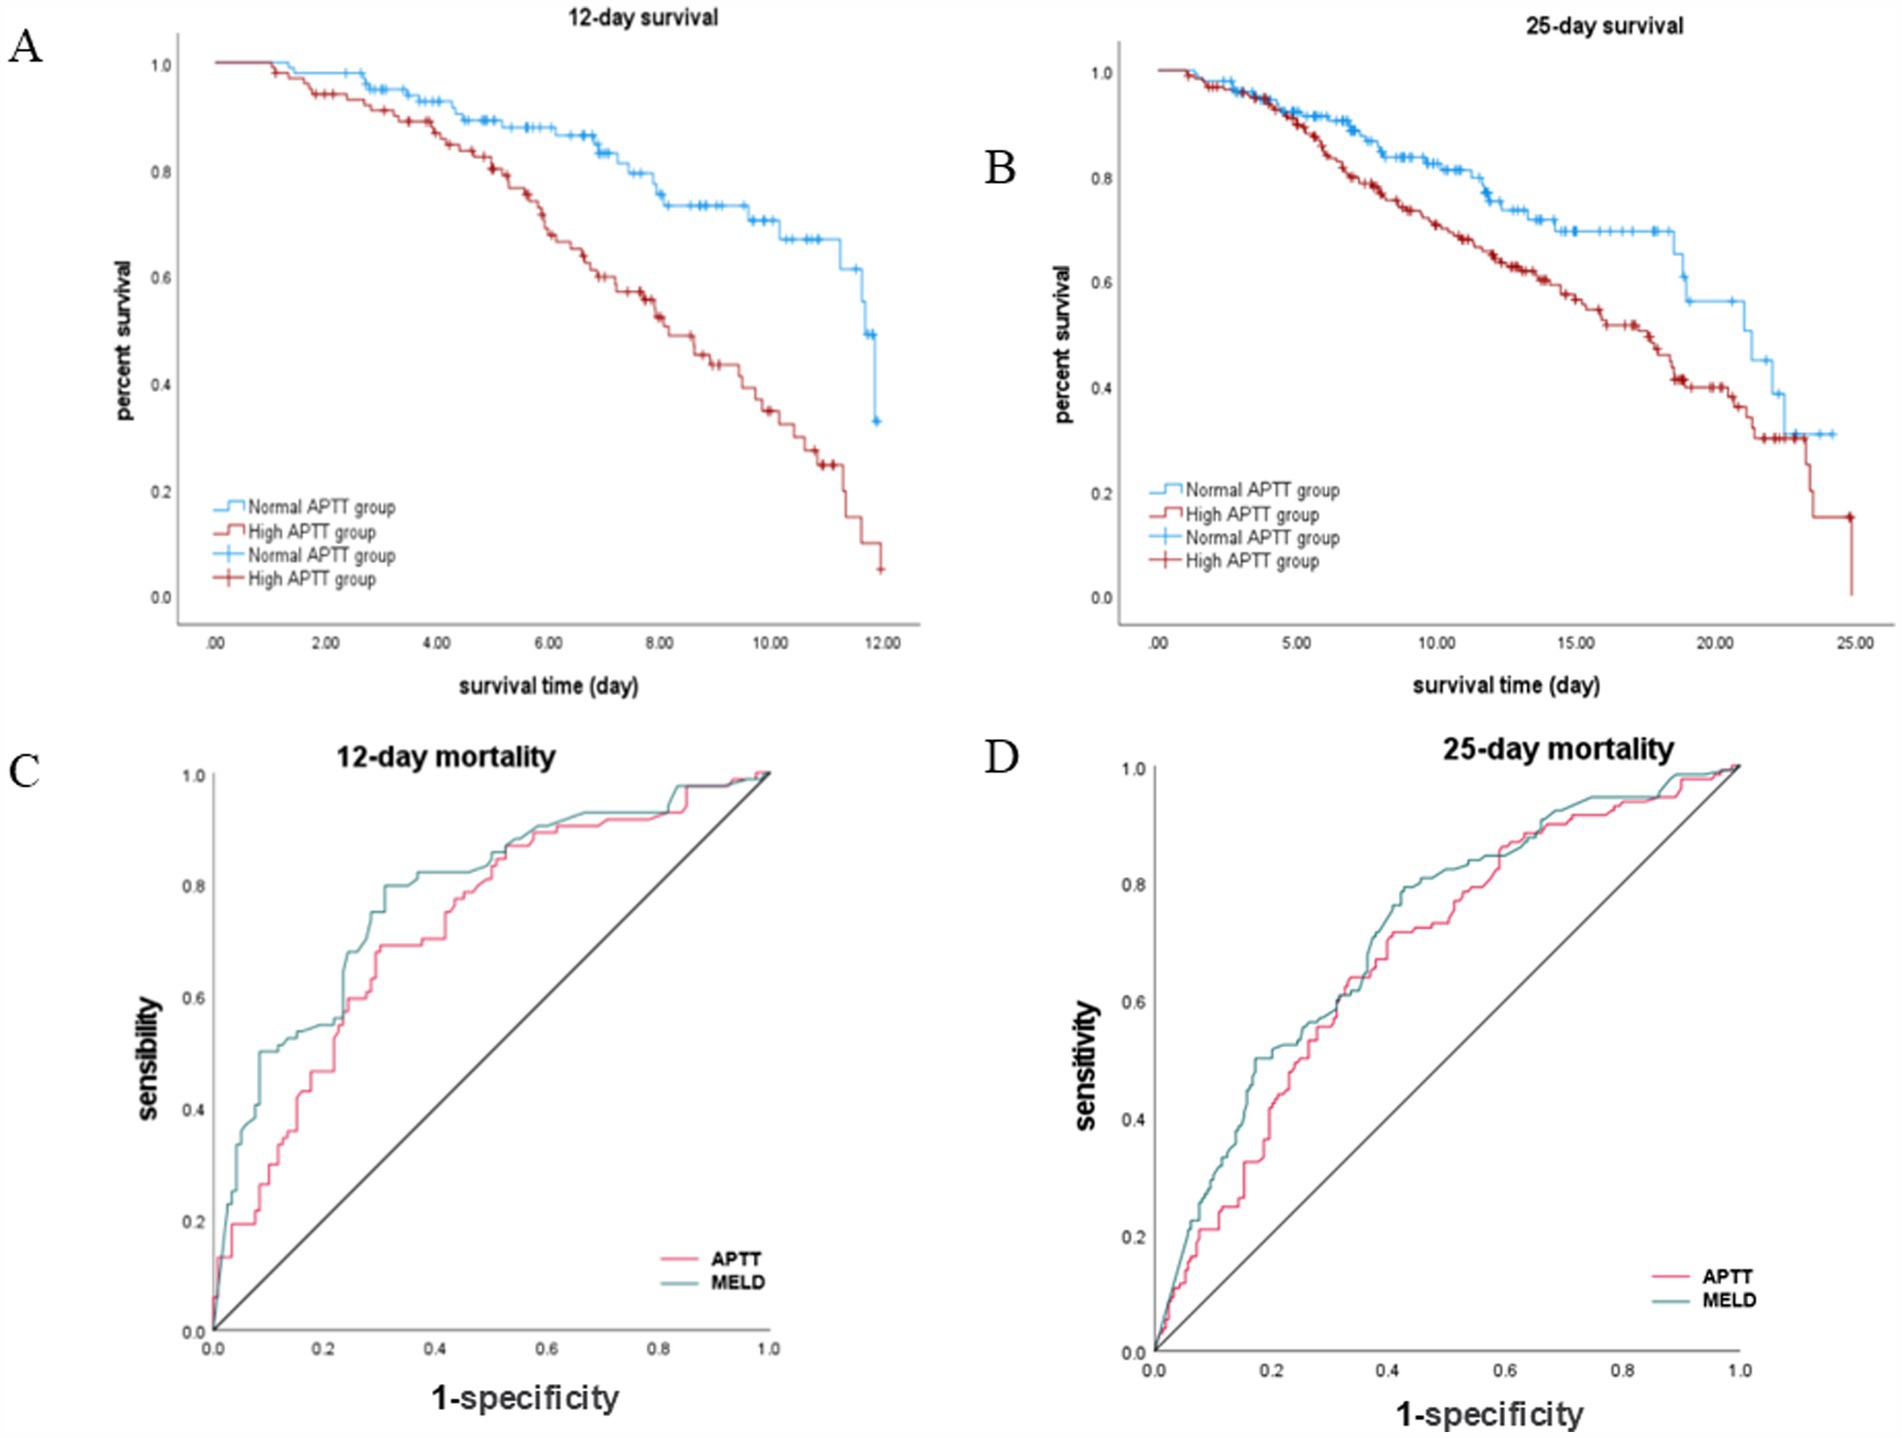
Figure 2. Survival analysis and ROC curve comparison for APTT and MELD in hepatic encephalopathy patients. (A,B) Kaplan–Meier survival curves stratified by APTT levels. (C,D) ROC curve analyses for predicting survival at 12-day and 25-day time points.
APTT predicts poor prognosis in patients with hepatic encephalopathy comparable to the traditional MELD model
Our analysis revealed that APTT exhibited comparable performance to the MELD score in predicting the survival of hepatic encephalopathy patients at both the 12-day and 25-day marks (Figures 2C,D). Specifically, for the 12-day mortality rate, the area under the curve (AUC) for APTT was 0.723 (95% CI: 0.652–0.794), while the AUC for MELD was 0.779 (p < 0.001). Similarly, for the 25-day mortality rate, the AUC for APTT was 0.679, and the AUC for MELD was 0.717 (95% CI: 0.621–0.736) (p < 0.001) (Table 2). For the ROC curve analyses, the area under the curve for the MELD model was higher than that for APTT at both evaluated time points. While the differences in AUC values were statistically significant (p < 0.05), the area under the curve for APTT remained close to that of the MELD model, suggesting that APTT provides a comparable level of predictive accuracy in assessing the survival of patients with hepatic encephalopathy.
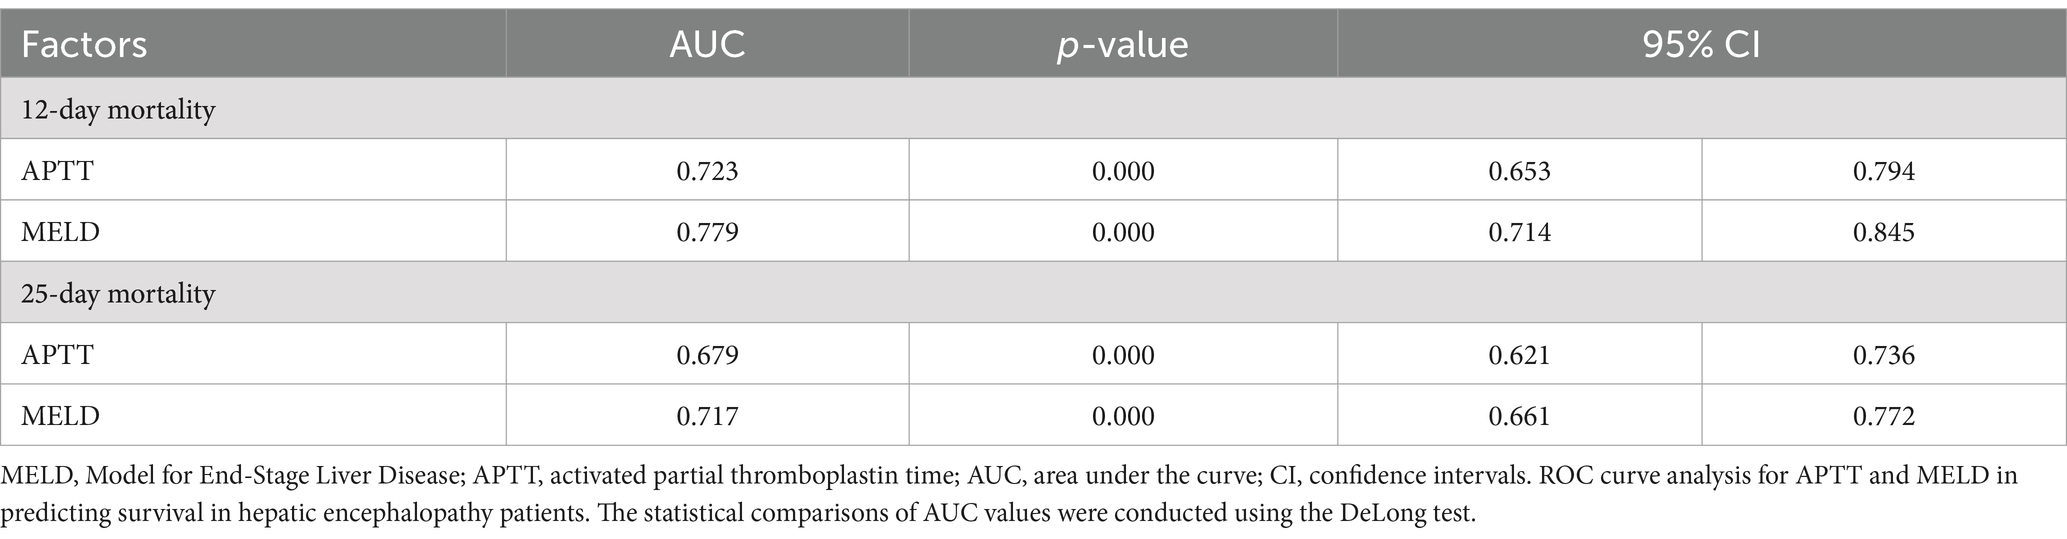
Table 2. Receiver operating curves (ROC) for the abilities of risk models to predict 12- and 25-day survival of hepatic encephalopathy patients.
APTT emerges as an independent risk factor influencing the prognosis of patients with hepatic encephalopathy
In the unadjusted univariate model, significant differences were observed in APTT (p < 0.05) in both the 12-day and 25-day survival analyses, while no significant differences were noted in sepsis, hyperlipidemia, and coagulation disorders (p > 0.05). The hazard ratios [HRs; 95% confidence interval (CI)] for 12- and 25-day survival analyses were 1.011 (1.004, 1.017, p < 0.01) and 1.006 (1.000, 1.012, p = 0.039), respectively (Table 3).
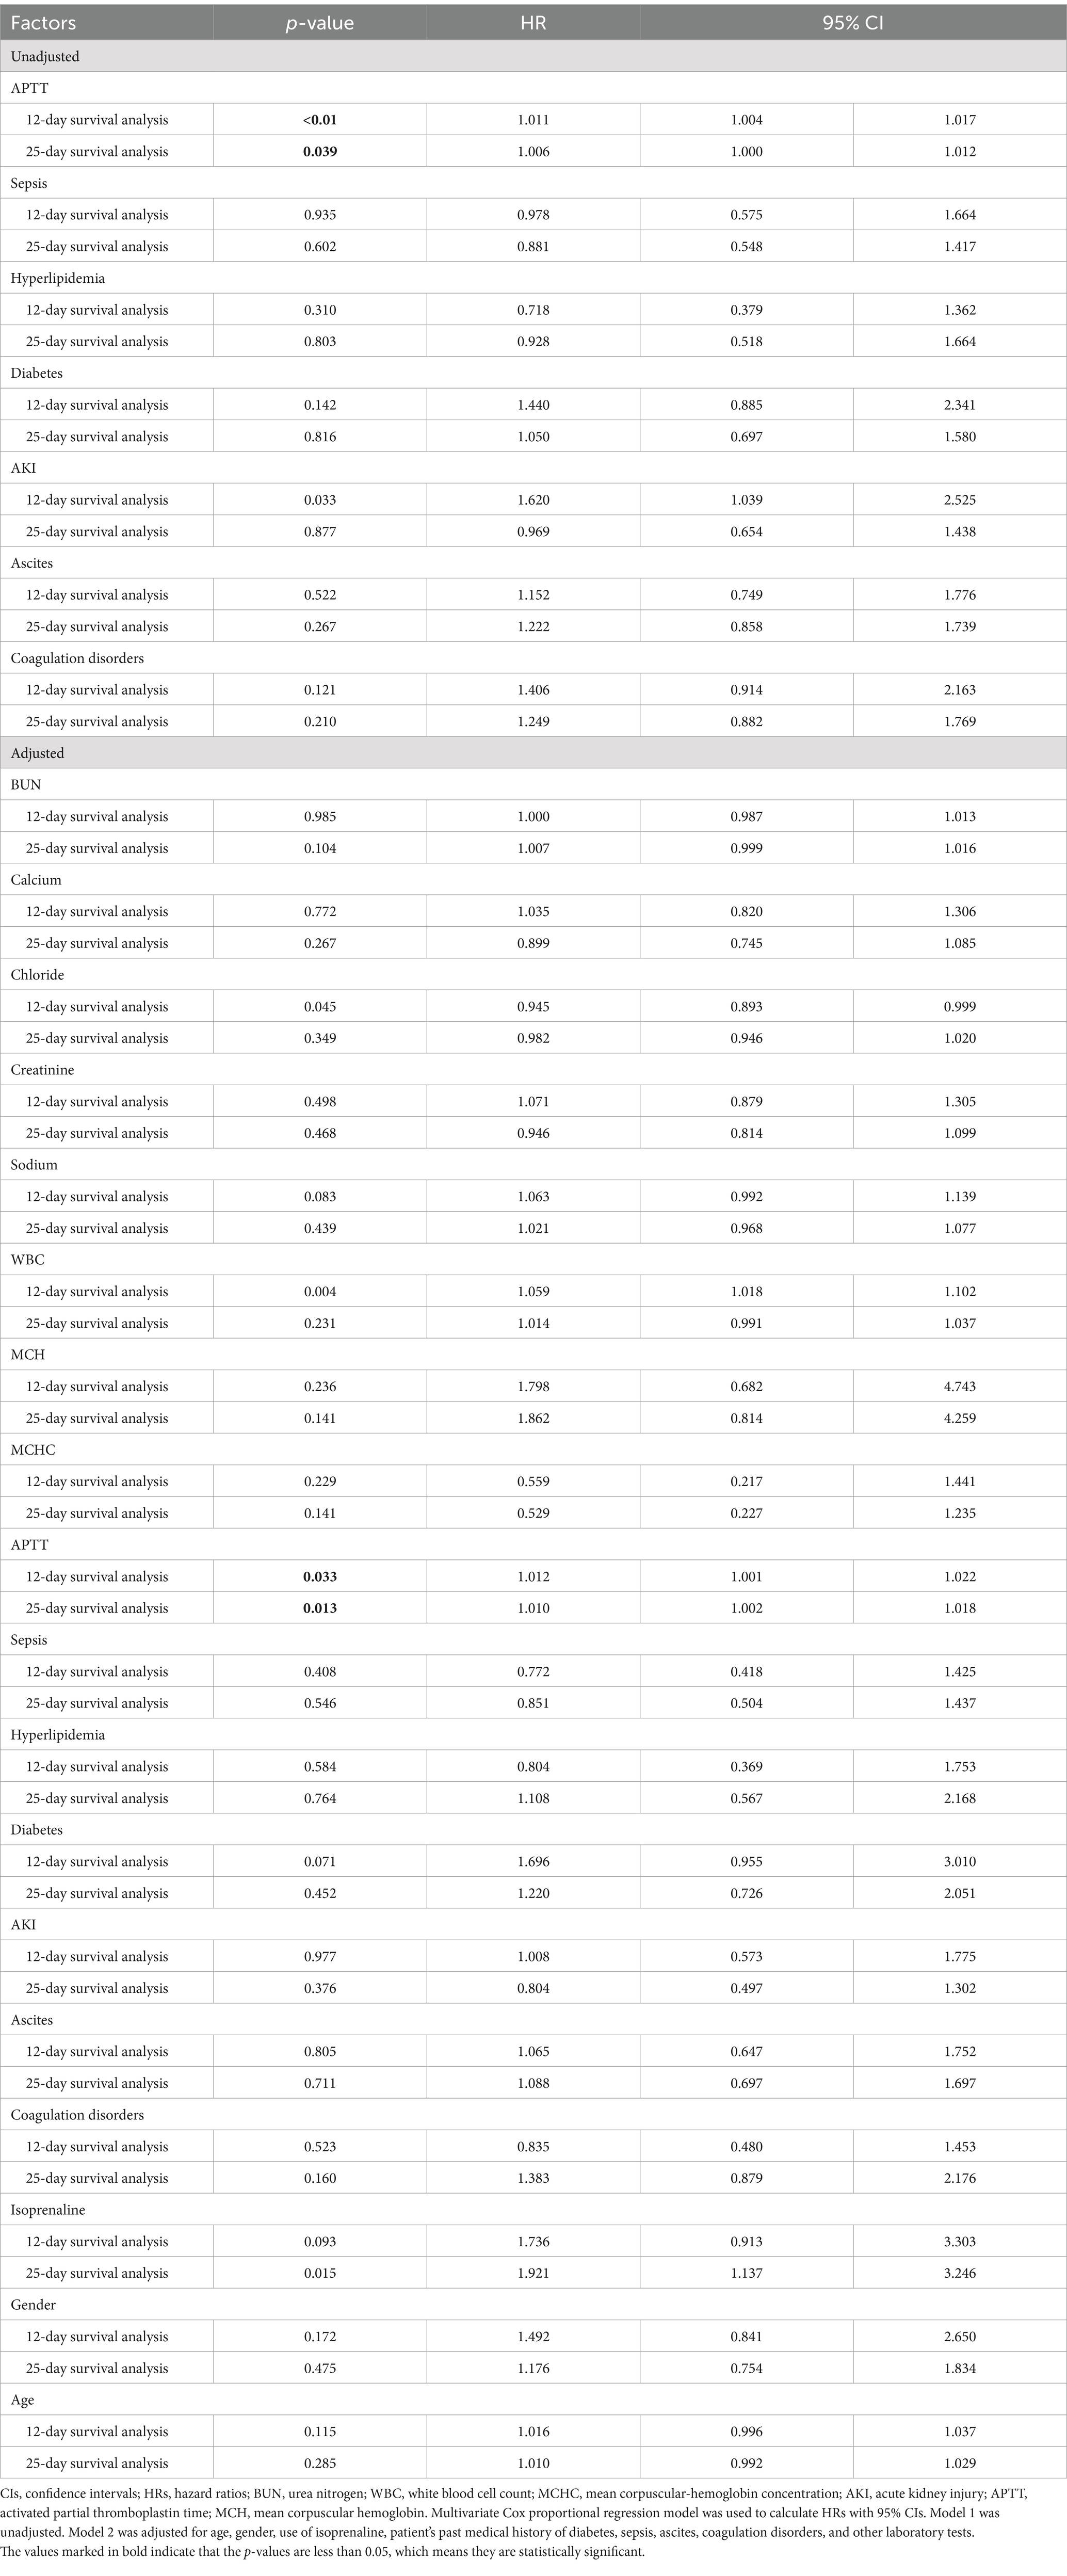
Table 3. Multivariate Cox proportional regression model.
Certain variables, such as sepsis, hyperlipidemia, diabetes mellitus, acute kidney injury, and ascites (p > 0.05), were intentionally excluded to mitigate collinearity (Table 3). Upon examination of indicators such as urea nitrogen, mean corpuscular hemoglobin concentration, and calcium ion concentration, APTT demonstrated an independent association with prognosis. The hazard ratios (HRs; 95% CI) for 12- and 25-day survival analyses were 1.012 (1.001, 1.022, p = 0.033) and 1.010 (1.002, 1.018, p = 0.013), respectively (Table 3).
Analysis of APTT distribution across liver function impairment stages
The liver function groups are categorized into four stages based on total bilirubin levels: normal liver function (≤1.2 mg/dL), mild impairment (1.2–3.0 mg/dL), moderate impairment (3.0–10.0 mg/dL), and severe impairment (>10.0 mg/dL). These classifications provide a clear framework for understanding the progression of liver dysfunction, with higher bilirubin levels indicating more significant liver impairment. By segmenting the data in this manner, the analysis aims to highlight potential variations in APTT across different stages of liver function deterioration, which can offer valuable insights into the coagulopathy associated with liver disease (Figure 3). The APTT is divided into normal and high categories, with color intensity representing the frequency or prevalence of cases in each subgroup. As liver function impairment progresses from normal to severe, there is a noticeable increase in the prevalence of high APTT, particularly in the severe liver impairment group, which is marked by the darkest color on the heatmap. This trend suggests a potential association between higher APTT values and worsening liver function.
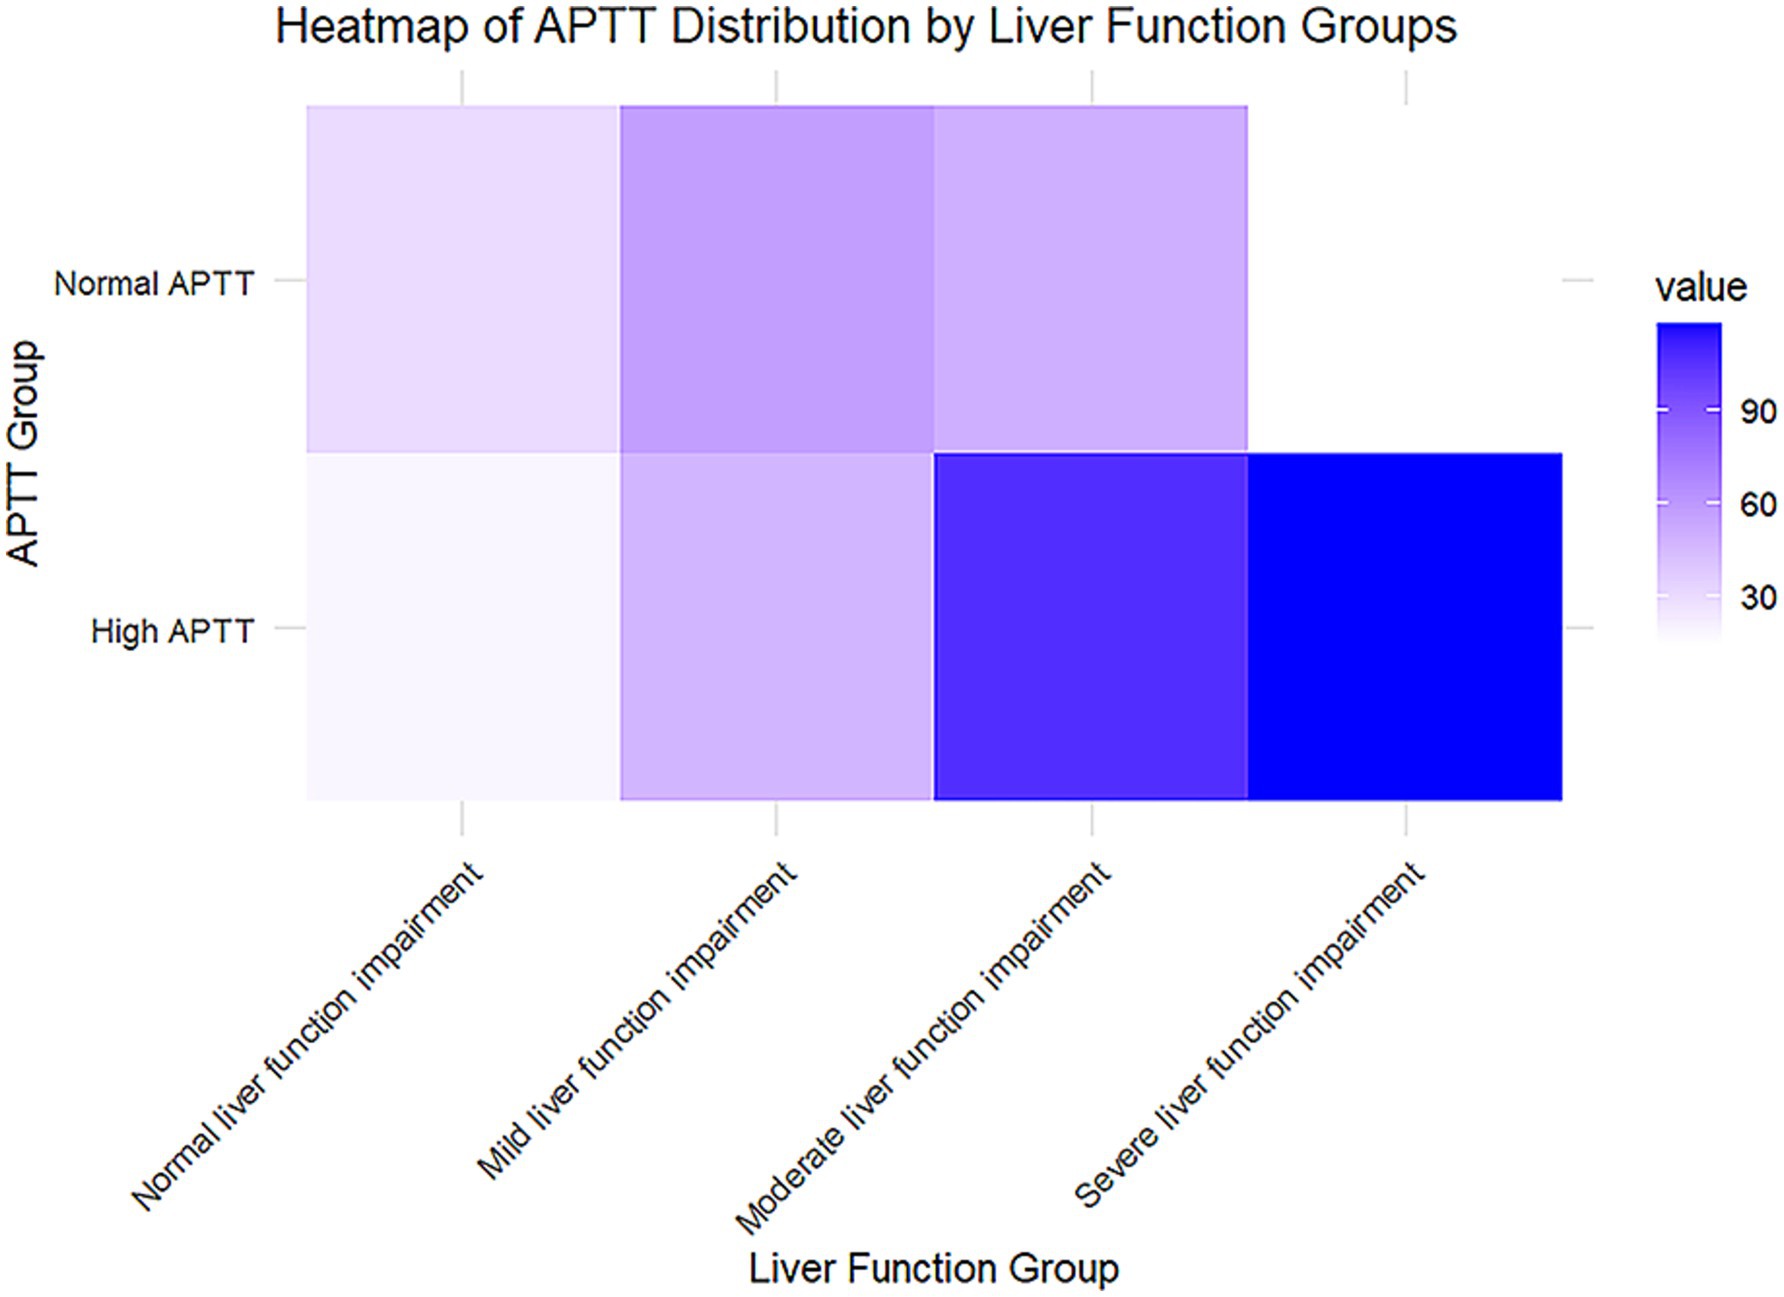
Figure 3. Heatmap of APTT distribution by liver function groups.
The results of subgroup analysis suggest that APTT predicts the short-term prognosis of patients with hepatic encephalopathy independently of other factors
Our analysis encompassed an examination of the interaction between APTT and various confounding factors in patients with hepatic encephalopathy. The findings reveal no significant interaction between APTT and confounding factors such as acute renal failure, hyperlipidemia, coagulation disorders, liver cirrhosis, and ascites (p < 0.05) (Table 4). This indicates that the APTT range remains unaffected by factors like liver cirrhosis or ascites, further underlining its role as an independent prognostic risk factor for patients with hepatic encephalopathy.
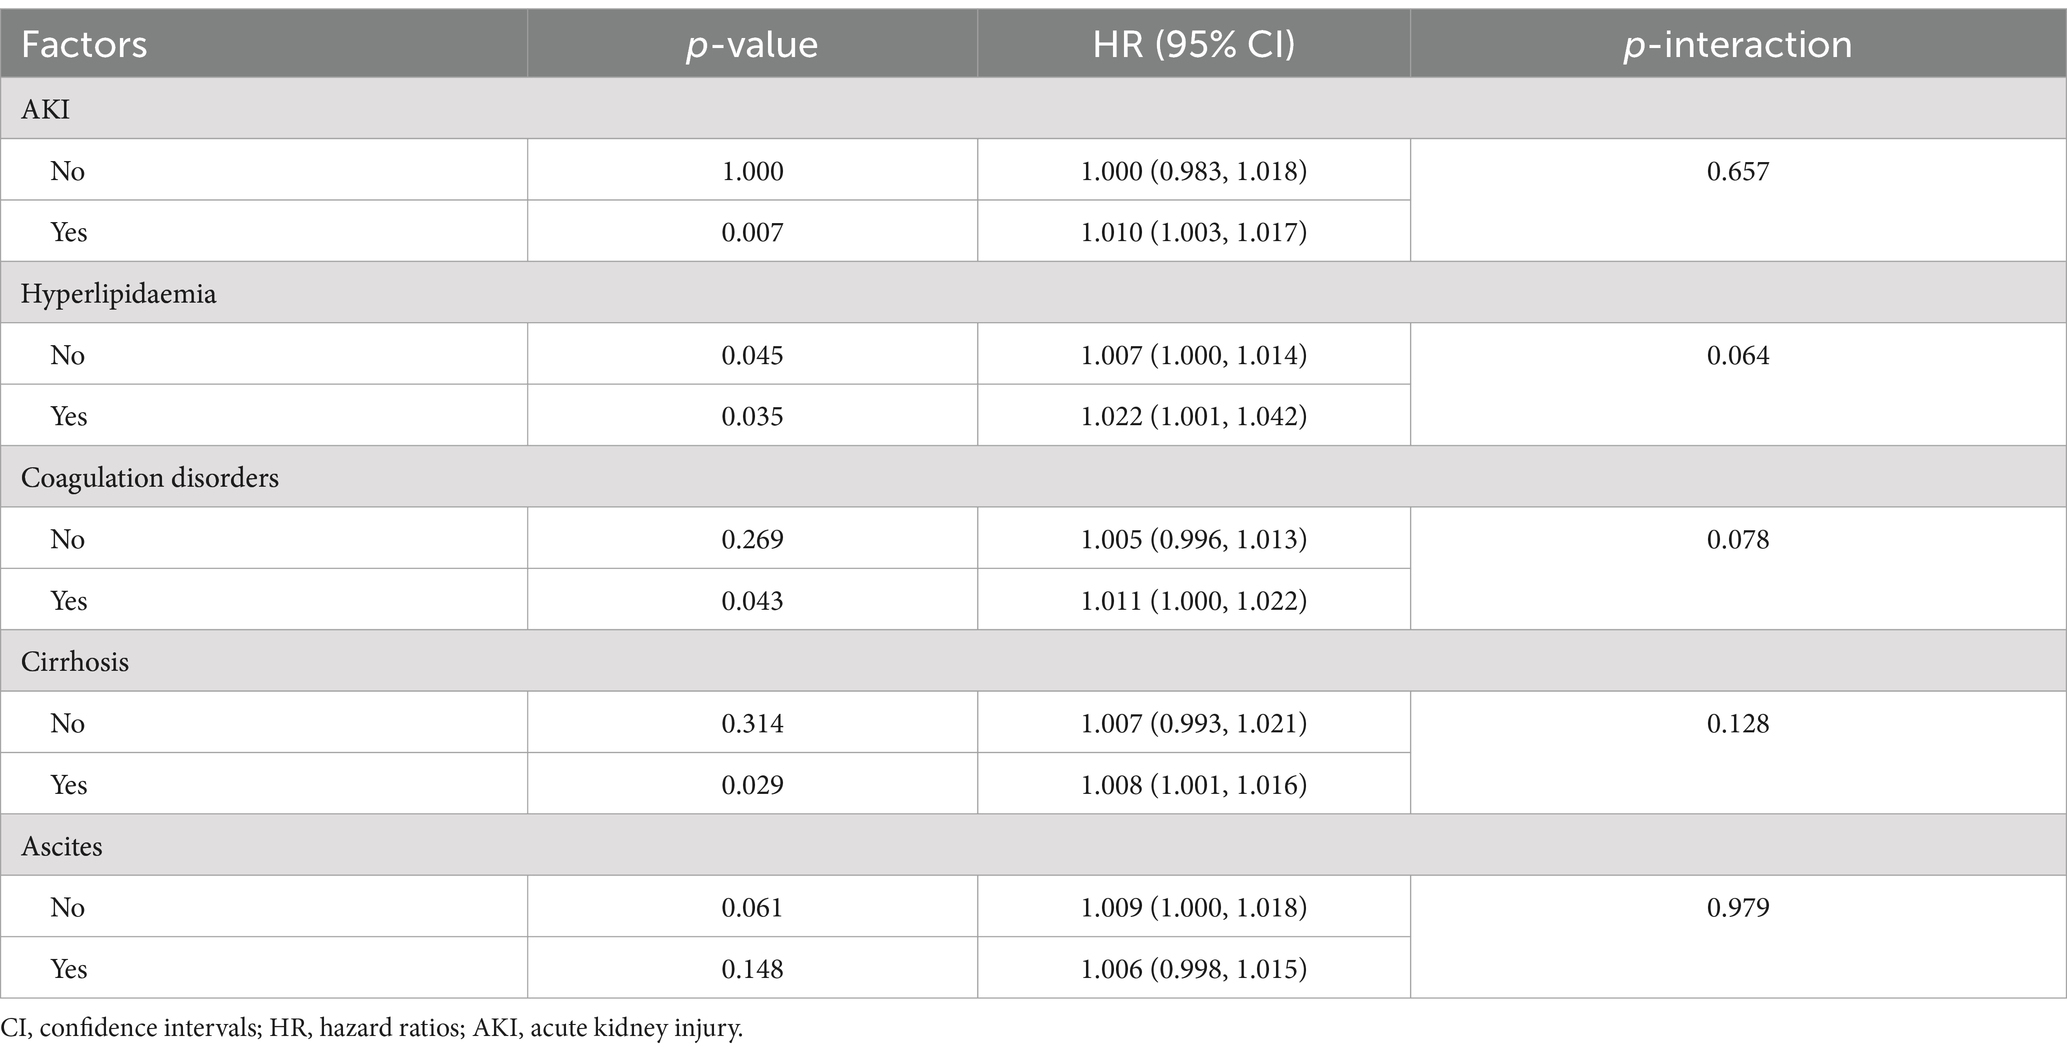
Table 4. Subgroup analysis of the associations between all-cause mortality.
Differentiating acute-on-chronic liver failure, acute decompensation, and non-acute decompensation is crucial for understanding hepatic encephalopathy progression and prognosis. Due to data limitations, our study did not stratify patients by these categories. Future prospective studies should address this to better evaluate APTT and other prognostic markers.
Discussion
Hepatic encephalopathy stands as the most prevalent complication in patients with advanced liver disease. While it’s commonly believed that the pathogenesis of hepatic encephalopathy is linked to elevated ammonia levels in the blood, the exact mechanisms remain inconclusive despite extensive literature (14, 19). Consequently, the use of blood ammonia as an indicator for predicting the prognosis of hepatic encephalopathy is subject to bias and lacks robust support from rigorous scientific literature. Patients with cirrhosis frequently exhibit abnormalities in hemostasis and coagulation indicators, including decreased platelet count, prolonged prothrombin time (PT), and reduced fibrinogen levels. Liver function abnormalities in these patients are often associated with a heightened risk of bleeding (11, 20). In normal individuals, there exists a delicate balance among the body’s coagulation system, anticoagulation system, and fibrinolytic system to prevent bleeding and thrombosis. However, patients with chronic liver disease or cirrhosis experience significant deviations from this balance (21). Firstly, abnormalities in platelet counts and function are prevalent in patients with chronic liver disease or cirrhosis. Reduced platelet counts, along with abnormal platelet function and decreased platelet aggregation ability, are common. Thrombocytopenia mechanisms include portal hypertension-induced platelet sequestration in the spleen, potential myelodysplasia suppression, immune-related platelet destruction, and diminished thrombopoietin production, primarily synthesized by the liver (22, 23). Secondly, liver disease disrupts the synthesis of various blood coagulation factors, as the liver is the primary site of synthesis for nearly all coagulation factors except Von Willebrand factor (VWF). Consequently, disorders in the synthesis of factors II, V, VII, IX, X, and XI occur (24, 25). Lastly, abnormalities in fibrinogen function and synthesis, along with hyperfibrinolysis, are common in cirrhosis patients. These alterations significantly increase the risk of bleeding, subsequently elevating the risk of disease progression and mortality in patients with hepatic encephalopathy (25–27).
Following the initial single-variable screening, multivariate analysis was employed to accurately assess the relationship between predictors and the dependent variable. Through this comprehensive analysis, it becomes evident that activated partial thromboplastin time (APTT) serves as a robust predictor of the prognosis of hepatic encephalopathy. Patients with elevated APTT values tend to experience longer hospital stays and higher mortality rates compared to those with normal APTT values. Moreover, older patients with higher APTT values are at an increased risk of developing hepatic encephalopathy and facing elevated mortality rates. The hazard ratios for APTT [1.011 (1.004–1.017) for 12-day survival and 1.006 (1.000–1.012) for 25-day survival] demonstrate a statistically significant association with short-term prognosis in hepatic encephalopathy patients. Although the effect sizes are modest, these findings suggest that even small elevations in APTT may reflect critical underlying coagulopathy or systemic dysfunction, which are known to contribute to worse outcomes in liver disease. The ROC curve analysis demonstrated that while the MELD model showed statistically higher AUC values compared to APTT, the differences were relatively small, indicating that APTT has a predictive performance comparable to MELD in assessing the survival of patients with hepatic encephalopathy. These results suggest that APTT could serve as an alternative or complementary predictor to the MELD model. Further investigations are warranted to explore potential synergies between APTT and MELD in improving prognostic accuracy. The prevalence of elevated APTT was significantly higher, particularly in the severe liver dysfunction group. This trend suggests a potential association between higher APTT values and liver function deterioration, indicating that APTT may serve as a useful prognostic marker for liver disease, especially in conditions like hepatic encephalopathy. From a clinical perspective, APTT serves as a readily available and cost-effective test that can be incorporated into routine practice to stratify risk and guide early interventions. However, its modest effect size indicates that APTT should be considered as part of a multifactorial prognostic assessment rather than a standalone marker. Additionally, the high APTT group exhibits a greater propensity for complications such as acute kidney injury, sepsis, coagulation disorders, and ascites. These patients often require more intensive medical interventions, including the frequent use of medications such as norepinephrine, isoprenaline, antidiuretic hormone, vasopressin, and ventilators. Such complexities in their condition contribute to prolonged treatment durations and extended hospital stays. In identifying independent risk factors for the prognosis of hepatic encephalopathy while considering various confounding factors, the COX regression model highlighted APTT as a significant independent risk factor. Complications such as acute kidney injury, sepsis, coagulopathy, and ascites were found not to be independent risk factors, indicating no linear correlation between these complications and the prognosis of hepatic encephalopathy. Furthermore, APTT demonstrates comparable predictive efficacy to the laboratory-based Model for End-Stage Liver Disease (MELD) model. Kaplan–Meier survival analysis further substantiates the prognostic significance of APTT, revealing a marked decrease in survival among patients with elevated APTT values. Importantly, the simplicity, convenience, and cost-effectiveness of APTT measurement make it an attractive option for clinicians. This not only conserves medical resources but also enhances patient compliance and improves treatment outcomes. In conclusion, APTT emerges as a valuable and accessible tool for forecasting the prognosis of patients with hepatic encephalopathy, contributing to more effective clinical management and better patient outcomes.
Moreover, APTT showcases comparable predictive efficacy to the laboratory-based Model for End-Stage Liver Disease (MELD) model. Kaplan–Meier survival analysis further reinforces the prognostic significance of APTT, indicating a significant decrease in survival rates among patients with elevated APTT values. Significantly, the simplicity, convenience, and cost-effectiveness of APTT measurement render it an appealing option for clinicians. This not only conserves medical resources but also enhances patient compliance and facilitates improved treatment outcomes. But the dynamic and complex nature of disease decompensation, as highlighted by the CANONIC and PREDICT studies, underscores the importance of understanding baseline patient status before hospitalization. In our cohort, baseline data such as pre-hospital liver function, previous decompensation episodes, and outpatient management history were not uniformly recorded, limiting our ability to fully assess the influence of pre-hospital factors on APTT levels and outcomes. Future studies should aim to incorporate comprehensive baseline data to provide a more holistic understanding of the progression and prognostic markers of hepatic encephalopathy. Anyway, APTT emerges as a valuable and accessible tool for predicting the prognosis of patients with hepatic encephalopathy, thereby contributing to more effective clinical management and better patient outcomes.
Conclusion
A prolonged APTT suggests a poorer short-term prognosis in patients with hepatic encephalopathy.
Data availability statement
The raw data supporting the conclusions of this article will be made available by the authors, without undue reservation.
Author contributions
LZ: Writing – original draft. YY: Writing – review & editing. BN: Writing – review & editing. YK: Data curation, Writing – review & editing. SD: Writing – original draft. YT: Data curation, Writing – review & editing. YH: Formal analysis, Writing – review & editing. RY: Formal analysis, Writing – review & editing. ZH: Methodology, Writing – review & editing. BL: Methodology, Writing – review & editing. LG: Supervision, Writing – review & editing. SY: Supervision, Writing – review & editing.
Funding
The author(s) declare that financial support was received for the research, authorship, and/or publication of this article. This study was supported by the In-Hospital Funding Clinical Research Project of the Affiliated Hospital of Guangdong Medical University (No. LCYJ2023A002), and the Clinical-Basic Science and Technology Innovation Special Program of Guangdong Medical University (No. GDMULCJC2024019).
Acknowledgments
Our sincere gratitude to all the staff members who constructed the Medical Information Mart for Intensive Care (MIMIC)-IV database.
Conflict of interest
The authors declare that the research was conducted in the absence of any commercial or financial relationships that could be construed as a potential conflict of interest.
Generative AI statement
The authors declare that no Generative AI was used in the creation of this manuscript.
Publisher’s note
All claims expressed in this article are solely those of the authors and do not necessarily represent those of their affiliated organizations, or those of the publisher, the editors and the reviewers. Any product that may be evaluated in this article, or claim that may be made by its manufacturer, is not guaranteed or endorsed by the publisher.
References
1. Elsaid, MI, and Rustgi, VK. Epidemiology of hepatic encephalopathy. Clin Liver Dis. (2020) 24:157–74. doi: 10.1016/j.cld.2020.01.001
2. Mellinger, JL, Shedden, K, Winder, GS, Tapper, E, Adams, M, Fontana, RJ, et al. The high burden of alcoholic cirrhosis in privately insured persons in the United States. Hepatology. (2018) 68:872–82. doi: 10.1002/hep.29887
3. Rose, CF, Amodio, P, Bajaj, JS, Dhiman, RK, Montagnese, S, Taylor-Robinson, SD, et al. Hepatic encephalopathy: novel insights into classification, pathophysiology and therapy. J Hepatol. (2020) 73:1526–47. doi: 10.1016/j.jhep.2020.07.013
4. Peng, Y, Wei, Q, Liu, Y, Wu, Z, Zhang, H, Wu, H, et al. Prediction and risk factors for prognosis of cirrhotic patients with hepatic encephalopathy. Gastroenterol Res Pract. (2021) 2021:5623601. doi: 10.1155/2021/5623601
5. Tapper, EB. Predicting overt hepatic encephalopathy for the population with cirrhosis. Hepatology. (2019) 70:403–9. doi: 10.1002/hep.30533
6. Rudler, M, Weiss, N, Bouzbib, C, and Thabut, D. Diagnosis and management of hepatic encephalopathy. Clin Liver Dis. (2021) 25:393–417. doi: 10.1016/j.cld.2021.01.008
7. Bajaj, JS, Wade, JB, Gibson, DP, Heuman, DM, Thacker, LR, Sterling, RK, et al. The multi-dimensional burden of cirrhosis and hepatic encephalopathy on patients and caregivers. Am J Gastroenterol. (2011) 106:1646–53. doi: 10.1038/ajg.2011.157
8. Amodio, P. Hepatic encephalopathy: diagnosis and management. Liver Int. (2018) 38:966–75. doi: 10.1111/liv.13752
9. Wijdicks, EF. Hepatic encephalopathy. N Engl J Med. (2016) 375:1660–70. doi: 10.1056/NEJMra1600561
10. Yoshiji, H, Nagoshi, S, Akahane, T, Asaoka, Y, Ueno, Y, Ogawa, K, et al. Evidence-based clinical practice guidelines for liver cirrhosis 2020. J Gastroenterol. (2021) 56:593–619. doi: 10.1007/s00535-021-01788-x
11. O’Leary, JG, Greenberg, CS, Patton, HM, and Caldwell, SH. AGA clinical practice update: coagulation in cirrhosis. Gastroenterology. (2019) 157:34–43.e1. doi: 10.1053/j.gastro.2019.03.070
12. Intagliata, NM, Davis, JPE, and Caldwell, SH. Coagulation pathways, hemostasis, and thrombosis in liver failure. Semin Respir Crit Care Med. (2018) 39:598–608. doi: 10.1055/s-0038-1673658
13. Stotts, MJ, Davis, JPE, and Shah, NL. Coagulation testing and management in liver disease patients. Curr Opin Gastroenterol. (2020) 36:169–76. doi: 10.1097/MOG.0000000000000635
14. Fiati Kenston, SS, Song, X, Li, Z, and Zhao, J. Mechanistic insight, diagnosis, and treatment of ammonia-induced hepatic encephalopathy. J Gastroenterol Hepatol. (2019) 34:31–9. doi: 10.1111/jgh.14408
15. Gracia-Sancho, J, Marrone, G, and Fernández-Iglesias, A. Hepatic microcirculation and mechanisms of portal hypertension. Nat Rev Gastroenterol Hepatol. (2019) 16:221–34. doi: 10.1038/s41575-018-0097-3
16. Won, SM, Oh, KK, Gupta, H, Ganesan, R, Sharma, SP, Jeong, JJ, et al. The link between gut microbiota and hepatic encephalopathy. Int J Mol Sci. (2022) 23:8999. doi: 10.3390/ijms23168999
17. Johnson, AEW, Bulgarelli, L, Shen, L, Gayles, A, Shammout, A, Horng, S, et al. MIMIC-IV, a freely accessible electronic health record dataset. Sci Data. (2023) 10:1. doi: 10.1038/s41597-022-01899-x
18. Wu, WT, Li, YJ, Feng, AZ, Li, L, Huang, T, Xu, AD, et al. Data mining in clinical big data: the frequently used databases, steps, and methodological models. Mil Med Res. (2021) 8:44. doi: 10.1186/s40779-021-00338-z
19. Kroupina, K, Bémeur, C, and Rose, CF. Amino acids, ammonia, and hepatic encephalopathy. Anal Biochem. (2022) 649:114696. doi: 10.1016/j.ab.2022.114696
20. O’Shea, RS, Davitkov, P, Ko, CW, Rajasekhar, A, Su, GL, Sultan, S, et al. AGA clinical practice guideline on the management of coagulation disorders in patients with cirrhosis. Gastroenterology. (2021) 161:1615–1627.e1. doi: 10.1053/j.gastro.2021.08.015
21. European Association for the Study of the Liver. EASL clinical practice guidelines on prevention and management of bleeding and thrombosis in patients with cirrhosis. J Hepatol. (2022) 76:1151–84. doi: 10.1016/j.jhep.2021.09.003
22. Intagliata, NM, Davitkov, P, Allen, AM, Falck-Ytter, YT, and Stine, JG. AGA technical review on coagulation in cirrhosis. Gastroenterology. (2021) 161:1630–56. doi: 10.1053/j.gastro.2021.09.004
23. Zanetto, A, Campello, E, Bulato, C, Gavasso, S, Farinati, F, Burra, P, et al. Increased platelet aggregation in patients with decompensated cirrhosis indicates higher risk of further decompensation and death. J Hepatol. (2022) 77:S358–9. doi: 10.1016/S0168-8278(22)01072-8
24. Sang, Y, Roest, M, de Laat, B, de Groot, PG, and Huskens, D. Interplay between platelets and coagulation. Blood Rev. (2021) 46:100733. doi: 10.1016/j.blre.2020.100733
25. Amitrano, L, Guardascione, MA, Brancaccio, V, and Balzano, A. Coagulation disorders in liver disease. Semin Liver Dis. (2002) 22:083–96. doi: 10.1055/s-2002-23205
26. Weissenborn, K. Hepatic encephalopathy: definition, clinical grading and diagnostic principles. Drugs. (2019) 79:5–9. doi: 10.1007/s40265-018-1018-z
Keywords: hepatic encephalopathy, activated partial thromboplastin time (APTT), prognosis, risk factors, database
Citation: Zhan L, Yang Y, Nie B, Kou Y, Du S, Tian Y, Huang Y, Ye R, Huang Z, Luo B, Ge L and Ye S (2025) A prolonged activated partial thromboplastin time indicates poor short-term prognosis in patients with hepatic encephalopathy: insights from the MIMIC database. Front. Med. 12:1514327. doi: 10.3389/fmed.2025.1514327
Edited by:
Jonathan Soldera, University of Caxias do Sul, BrazilReviewed by:
Giovani Schulte Farina, Harvard University, United StatesSantiago Rodríguez Villafuerte, Hospital Vozandes, Ecuador
Vinicius Remus Ballotin, University of Caxias do Sul, Brazil
Copyright © 2025 Zhan, Yang, Nie, Kou, Du, Tian, Huang, Ye, Huang, Luo, Ge and Ye. This is an open-access article distributed under the terms of the Creative Commons Attribution License (CC BY). The use, distribution or reproduction in other forums is permitted, provided the original author(s) and the copyright owner(s) are credited and that the original publication in this journal is cited, in accordance with accepted academic practice. No use, distribution or reproduction is permitted which does not comply with these terms.
*Correspondence: Lei Ge, Y2hhbXBhbmVAcXEuY29t; Shicai Ye, eWVzaGljYWlAZ2RtdS5lZHUuY24=
†These authors have contributed equally to this work