
95% of researchers rate our articles as excellent or good
Learn more about the work of our research integrity team to safeguard the quality of each article we publish.
Find out more
ORIGINAL RESEARCH article
Front. Med. , 14 February 2025
Sec. Infectious Diseases: Pathogenesis and Therapy
Volume 12 - 2025 | https://doi.org/10.3389/fmed.2025.1502804
 Ruohan Sun1,2†
 Huangchao Jia1†Qiujia Kang1,2Yanmin Ma3Zichen He1,2Xiuxia Ma1Jun Yuan1Huijun Guo1Qianlei Xu1,2*Yantao Jin1*
Background: The study aimed to investigate the dose–response association between CD4+ T-cell counts and mortality risk in people living with HIV (PLHIV).
Methods: Data on PLHIV who had a high prevalence of acquired immunodeficiency syndrome (AIDS) were retrospectively collected from the routine treatment database in Henan Province, China, covering the period from October 2003 to October 2021. We randomly selected 1,000 PLHIV from age groups 30, 40, 50, and 60 years who met the inclusion criteria as study participants. The Kaplan–Meier analysis, the Cox proportional hazards regression model, and the restricted cubic spline (RCS) model were employed to analyze the association between CD4+ T-cell counts and mortality risk in PLHIV.
Results: A total of 4,000 participants were enrolled in the study, with a follow-up period of 28,158 person-years. During this period, there were 941 (23.5%) deaths, resulting in a mortality rate of 3.34 per 100 person-years. The mean duration of follow-up was 6.77 ± 3.45 years, and the cumulative survival rate was 76.5%. The Cox proportional hazards regression model revealed that as the CD4+ T-cell count increased, the hazard ratio (HR) decreased. The results of the RCS model demonstrated a non-linear association between CD4+ T-cell counts and mortality risk in PLHIV, with cutoff values for each age group being 382, 332, 334, and 215 cells/μL. The non-linear curve indicated that the HR decreased as the CD4+ T-cell counts increased. However, once the CD4+ T-cell counts reached their respective cutoff values, the curve showing the reduction in mortality risk began to flatten.
Conclusion: There was a non-linear association between CD4+ T-cell counts and mortality risk in PLHIV. Although the cutoff values vary across age groups, they consistently remain close to 350 cells/μL. Therefore, considering a threshold of CD4+ T-cell count <350 cells/μL across various age groups is crucial as a strategic approach to mitigate mortality rates among PLHIV.
Acquired immunodeficiency syndrome (AIDS) is an infectious disease caused by human immunodeficiency virus (HIV). According to the World Health Organization, there were approximately 39.9 million (36.1 million–44.6 million) cases of people living with HIV (PLHIV) by the end of 2023, with 1.3 million (1 million-1.7 million) new infections and 630,000 (500,000-820,000) deaths (1). AIDS remains a significant global public health challenge.
With the widespread use of CD4+ T-cell count detection technology, the CD4+ T-cell count has become a crucial indicator for assessing the immune status and clinical stage of HIV-infected individuals (2), initiating antiretroviral therapy (ART) and evaluating the therapeutic effect (3). Numerous studies have investigated the association between CD4+ T-cell counts and mortality risk among PLHIV. However, many of these studies treated the CD4+ T-cell count as a categorical variable, often overlooking its dynamic fluctuations and their evolving impact on mortality risk (4, 5). This dynamic trajectory may exhibit non-linear characteristics, which are often overlooked in linear analyses. The restricted cubic spline (RCS) model effectively integrates spline functions into generalized linear models (e.g., logistic regression and Cox proportional hazards regression) to elucidate the dose–response association between independent and dependent variables (6).
In this study, a 10-year retrospective cohort design was based on the routine treatment database, with a specific focus on PLHIV aged 30, 40, 50, and 60 years to control for age effects. The RCS model was used to analyze the dose–response association between CD4+ T-cell counts and mortality risk in PLHIV.
According to a previous study, the 10-year mortality rate among PLHIV and related diseases was 32.1% (7). Consequently, the sample size was determined using the following formula:
where α = 0.05, d = 0.1p, and p = 0.321. This calculation yielded a sample size of 813 cases; however, considering a 15% loss to follow-up, at least 957 individuals were required for this study. The study focused on PLHIV from a specific area in Henan and was conducted from October 2003 to October 2021. We randomly selected 1,000 PLHIV from the age groups of 30, 40, 50, and 60 years who met the inclusion criteria and were followed up for 10 years, until October 2021, or until death. Age served as the grouping factor: “30 years,” “40 years,” “50 years,” and “60 years.”
First-line ART regimens before 2008 consisted of [azidothymidine (AZT) or stavudine (D4T)] + [didanosine (DDI) or lamivudine (3TC)] + [nevirapine (NVP) or efavirenz (EFV)]. The second edition of the National Free ART Guideline, released in 2008, was revised to include [oftenofovir (TDF) or azidothymidine (AZT)] + lamivudine (3Tc) + [efavirenz (EFV) or nevirapine (NVP)] (8).
PLHIV in Henan Province, China, which has a high prevalence of AIDS, were included in the study if they tested positive for HIV using Western blotting and were aged 30, 40, 50, or 60 years. Participants were required to have a baseline CD4+ T-cell count at the start of the study. Individuals with follow-up periods of less than 1 month or incomplete information on variables were excluded from the study.
Information regarding the study individuals was extracted from the routine treatment database named “AIDS Prevention and Control Information System.” This information included birth date, sex, marital status, occupation, educational level, transmission, HIV-positive confirmation time, CD4+ T-cell count, detection time, ART initiation time, treatment withdrawal time, death time, and cause of death.
The latest CD4+ T-cell count recorded within 6 months before or after cohort commencement was used as the CD4+ T-cell value for the study analysis, which was divided into evenly spaced intervals of 100 cells/μL for interpretation. Continuous variables were described as means ± standard deviations, while categorical variables were described as frequencies and percentages. The life table method was used to calculate mortality density, and the Kaplan–Meier method was used to construct survival curves. The Cox proportional hazards regression model was used to analyze factors influencing mortality in PLHIV, utilizing hazard ratios (HRs) and corresponding 95% confidence intervals (CIs) to describe the association. The RCS model was used to analyze the dose–response association between the CD4+ T-cell counts and mortality risk in PLHIV across the different age groups, with density diagrams depicting the distribution of the CD4+ T-cell count for each group. Generally, R2 and Dxy were used to evaluate the RCS model. R2 indicates the goodness of fit, representing the proportion of variation explained by the model, while Dxy represents the model’s discrimination ability. Larger values indicate a better model. The model with the highest R2 and Dxy values was considered the optimal model after the RCS analysis. The data were analyzed using R4.2.0, and a p-value of <0.05 was considered statistically significant.
In each age group, 1,000 participants were included, for a total of 4,000 participants. Of these, 941 (23.5%) deaths were recorded, with a total of 28,158 person-years accrued during the follow-up, resulting in a mortality rate of 3.34/100 person-years. The mean duration of the follow-up was 6.77 ± 3.45 years. Among the cohort, 2,218 (55.5%) were male participants, 1,782 (44.5%) were female participants, and 3,559 (89.0%) were farmers. Within the study group, 2,316 (57.9%) participants were infected through blood transmission, 3,497 (87.4%) participants had been HIV-positive for more than 8 years, and 2,515 (62.9%) participants had received ART for more than 8 years. The mean ART duration for the participants aged 30, 40, 50, and 60 years was 7.2, 20.3, 28.7, and 32.5 months, respectively. The mean HIV-positive duration for these age groups was 30.6, 44.4, 44.8, and 50.8 months, respectively. The mean CD4+ T-cell count was 374 ± 227 cells/μL. The distribution of PLHIV based on their baseline CD4+ T-cell counts is as follows:
0–100 cells/μL: 369 individuals (9.2%),
101–200 cells/μL: 554 individuals (13.9%),
201–300 cells/μL: 742 individuals (18.6%),
301–400 cells/μL: 740 individuals (18.5%),
401–500 cells/μL: 605 individuals (15.1%),
501–600 cells/μL: 403 individuals (10.1%), and
>600 cells/μL: 587 individuals (14.7%). Detailed information on the baseline characteristics and mortality rates in the subgroups of PLHIV is shown in Table 1.
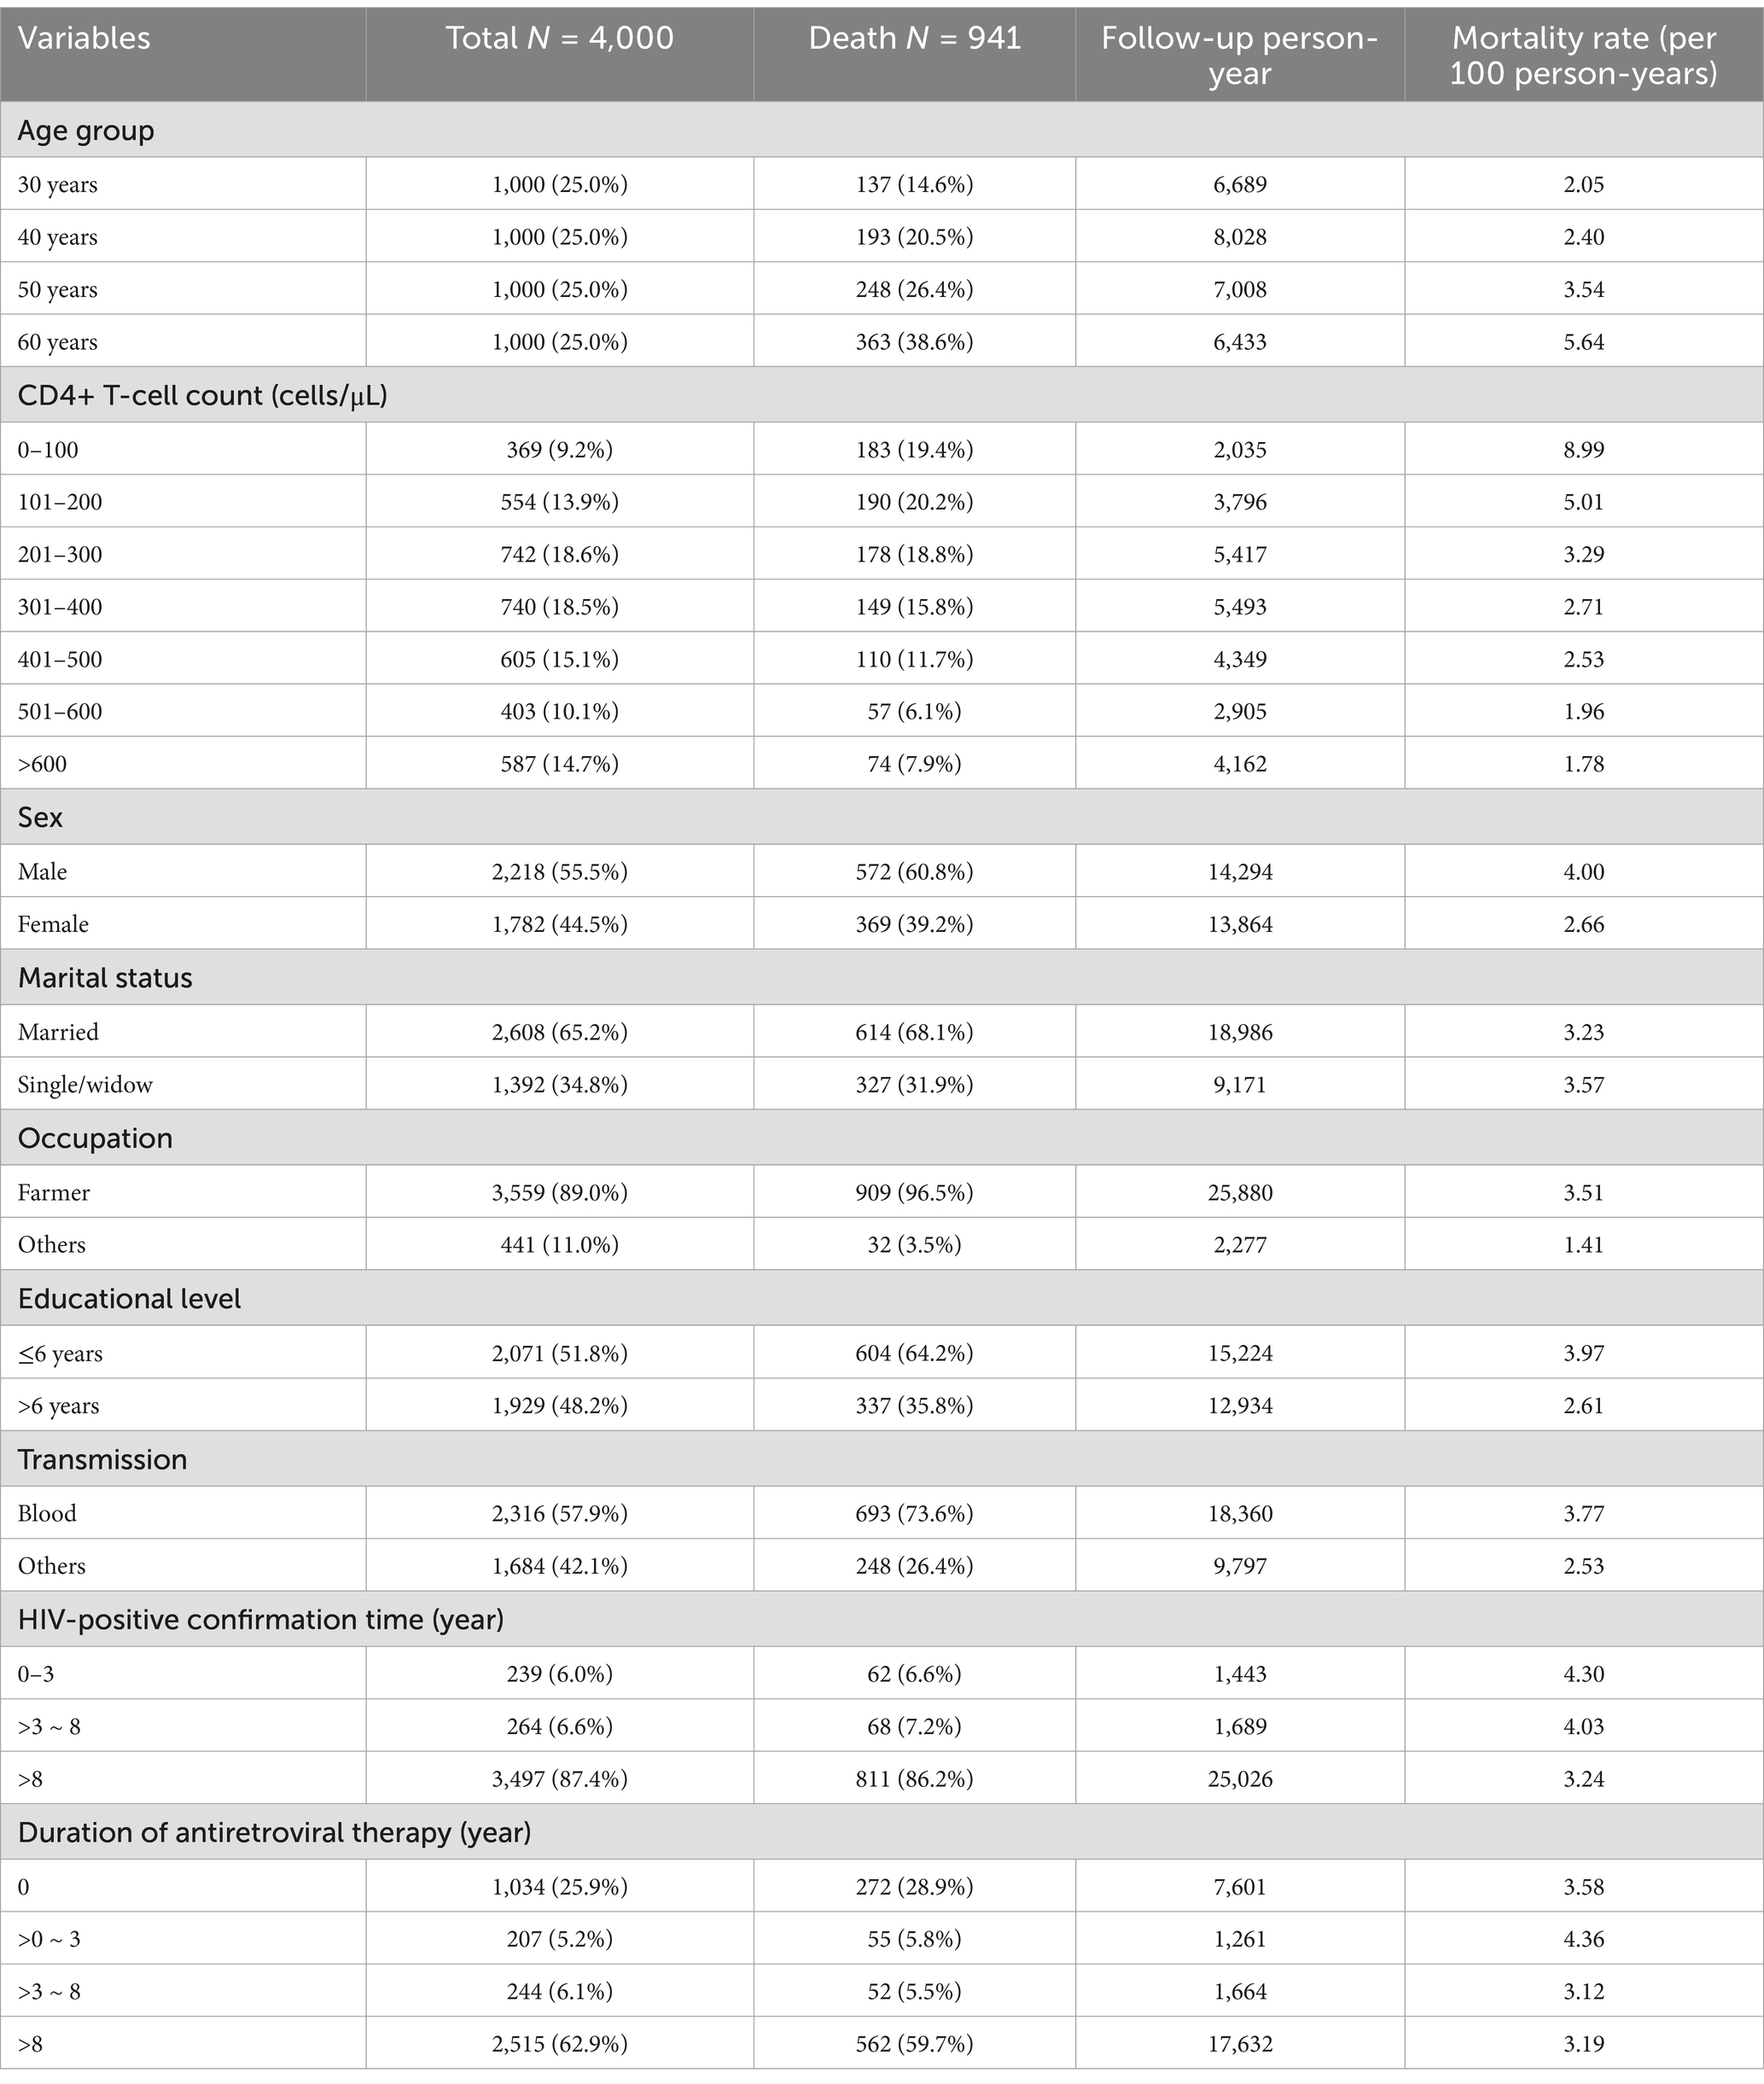
Table 1. Detailed information on the baseline characteristics and mortality rates in the subgroups of PLHIV.
Among the 4,000 participants, the cumulative survival rate was 76.5%. The cumulative survival rates for PLHIV aged 30, 40, 50, and 60 years were 83.3, 79.5, 70.7, and 57.0%, respectively. PLHIV aged 60 years demonstrated lower survival rates compared to other age groups (Figure 1A). The cumulative survival rates for PLHIV with baseline CD4+ T-cell counts of 0–100, 101–200, 201–300, 301–400, 401–500, 501–600, and > 600 cells/μL were 48.2, 61.9, 73.1, 76.2, 76.7, 82.1, and 84.1%, respectively, indicating that a higher baseline CD4+ T-cell count was associated with an improved survival rate (Figure 1B). As the follow-up time increased, the survival curves for the CD4+ T-cell count groups across all four age groups showed a downward trend (Figures 1C1–C4). Among these, the 60-year-old group with a CD4+ T-cell count of 0–100 cells/μL exhibited the fastest decline in the survival curve (Figure 1C4).
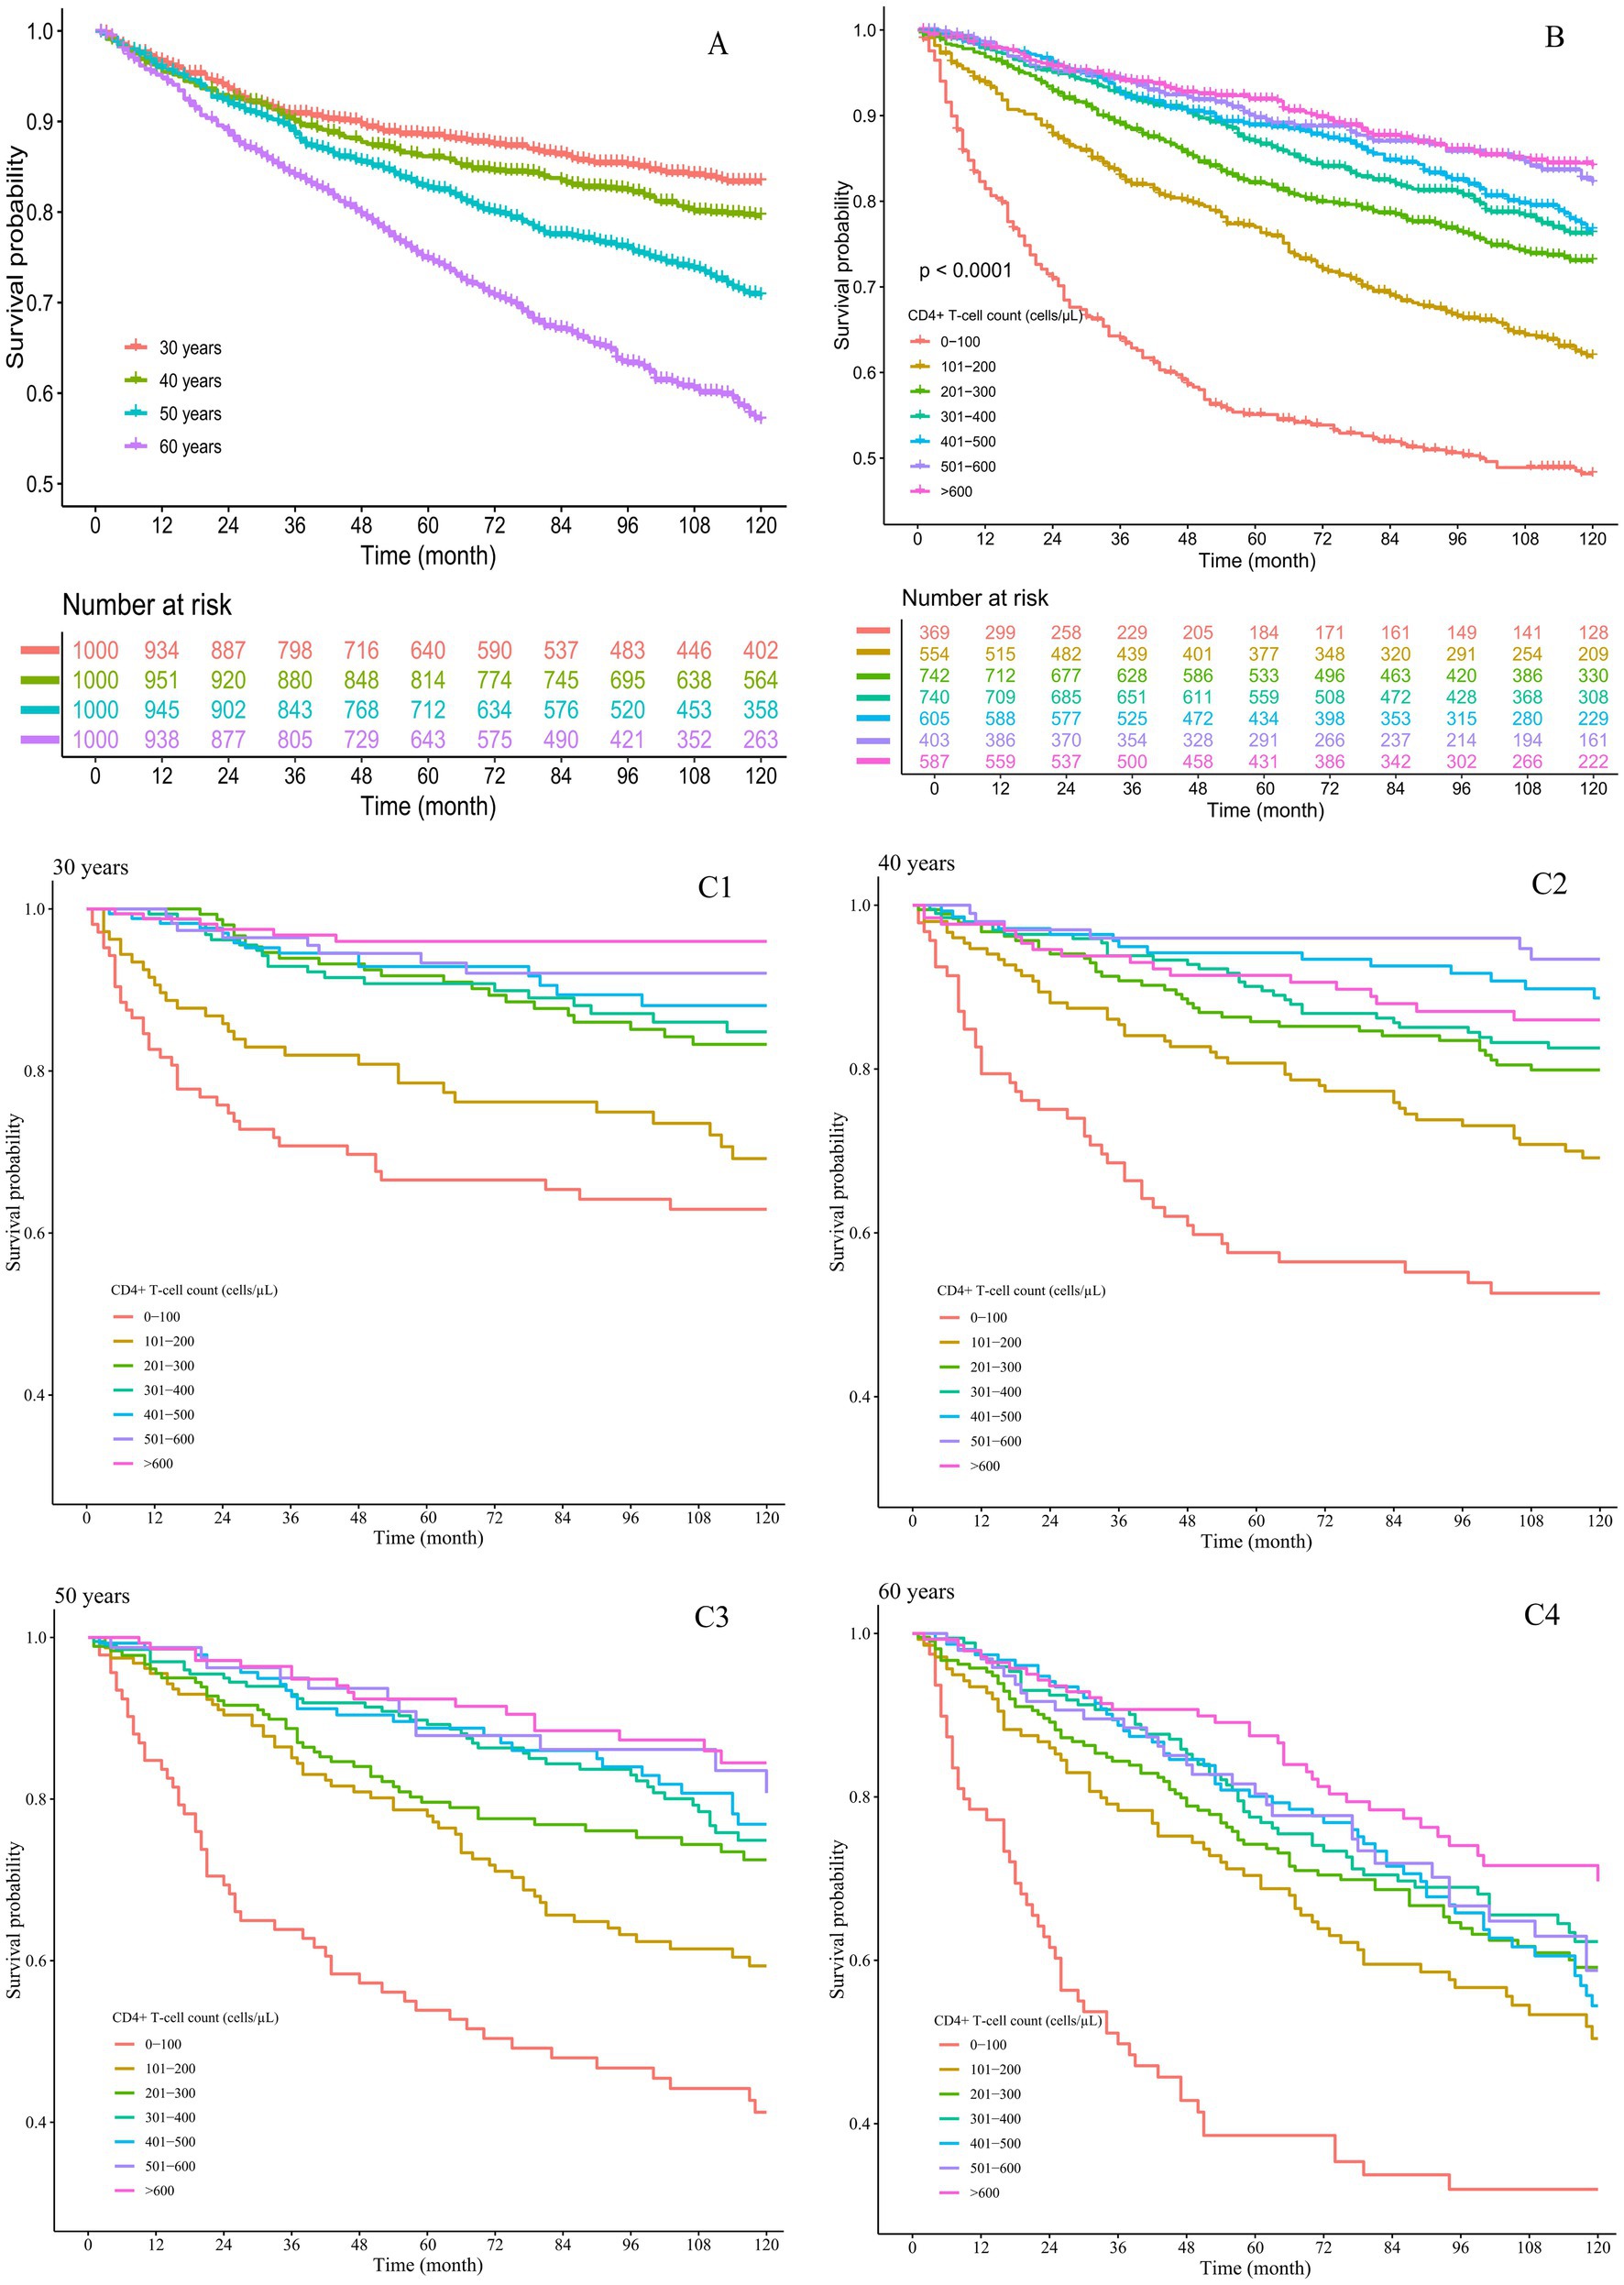
Figure 1. Cumulative survival rates of the PLHIV. (A) By different age groups; (B) by different CD4+ T-cell count groups; (C) by both age and CD4+ T-cell count groups, with subgroups (C1) 30 years, (C2) 40 years, (C3) 50 years, and (C4) 60 years.
The univariable Cox proportional hazards model showed that PLHIV aged 50 and 60 years had a higher mortality risk compared to those aged 30 and 40 years. A CD4+ T-cell count >100 cells/μL, being a woman, working in occupations other than farming, having more than 6 years of education, transmission through routes other than blood, and time on ART >8 years decreased the risk of mortality.
After adjusting for factors such as sex, marital status, occupation, education level, transmission, HIV-positive confirmation time and time on ART, the multivariable Cox proportional hazards regression model showed that PLHIV aged 50 and 60 years, a CD4+ T-cell count >100 cells/μL, being female, working in occupations other than farming, transmission through routes other than blood, and time on ART >8 years were all independently associated with mortality. In addition, as the CD4+ T-cell count increased, the HR value decreased. The results are shown in Figure 2.
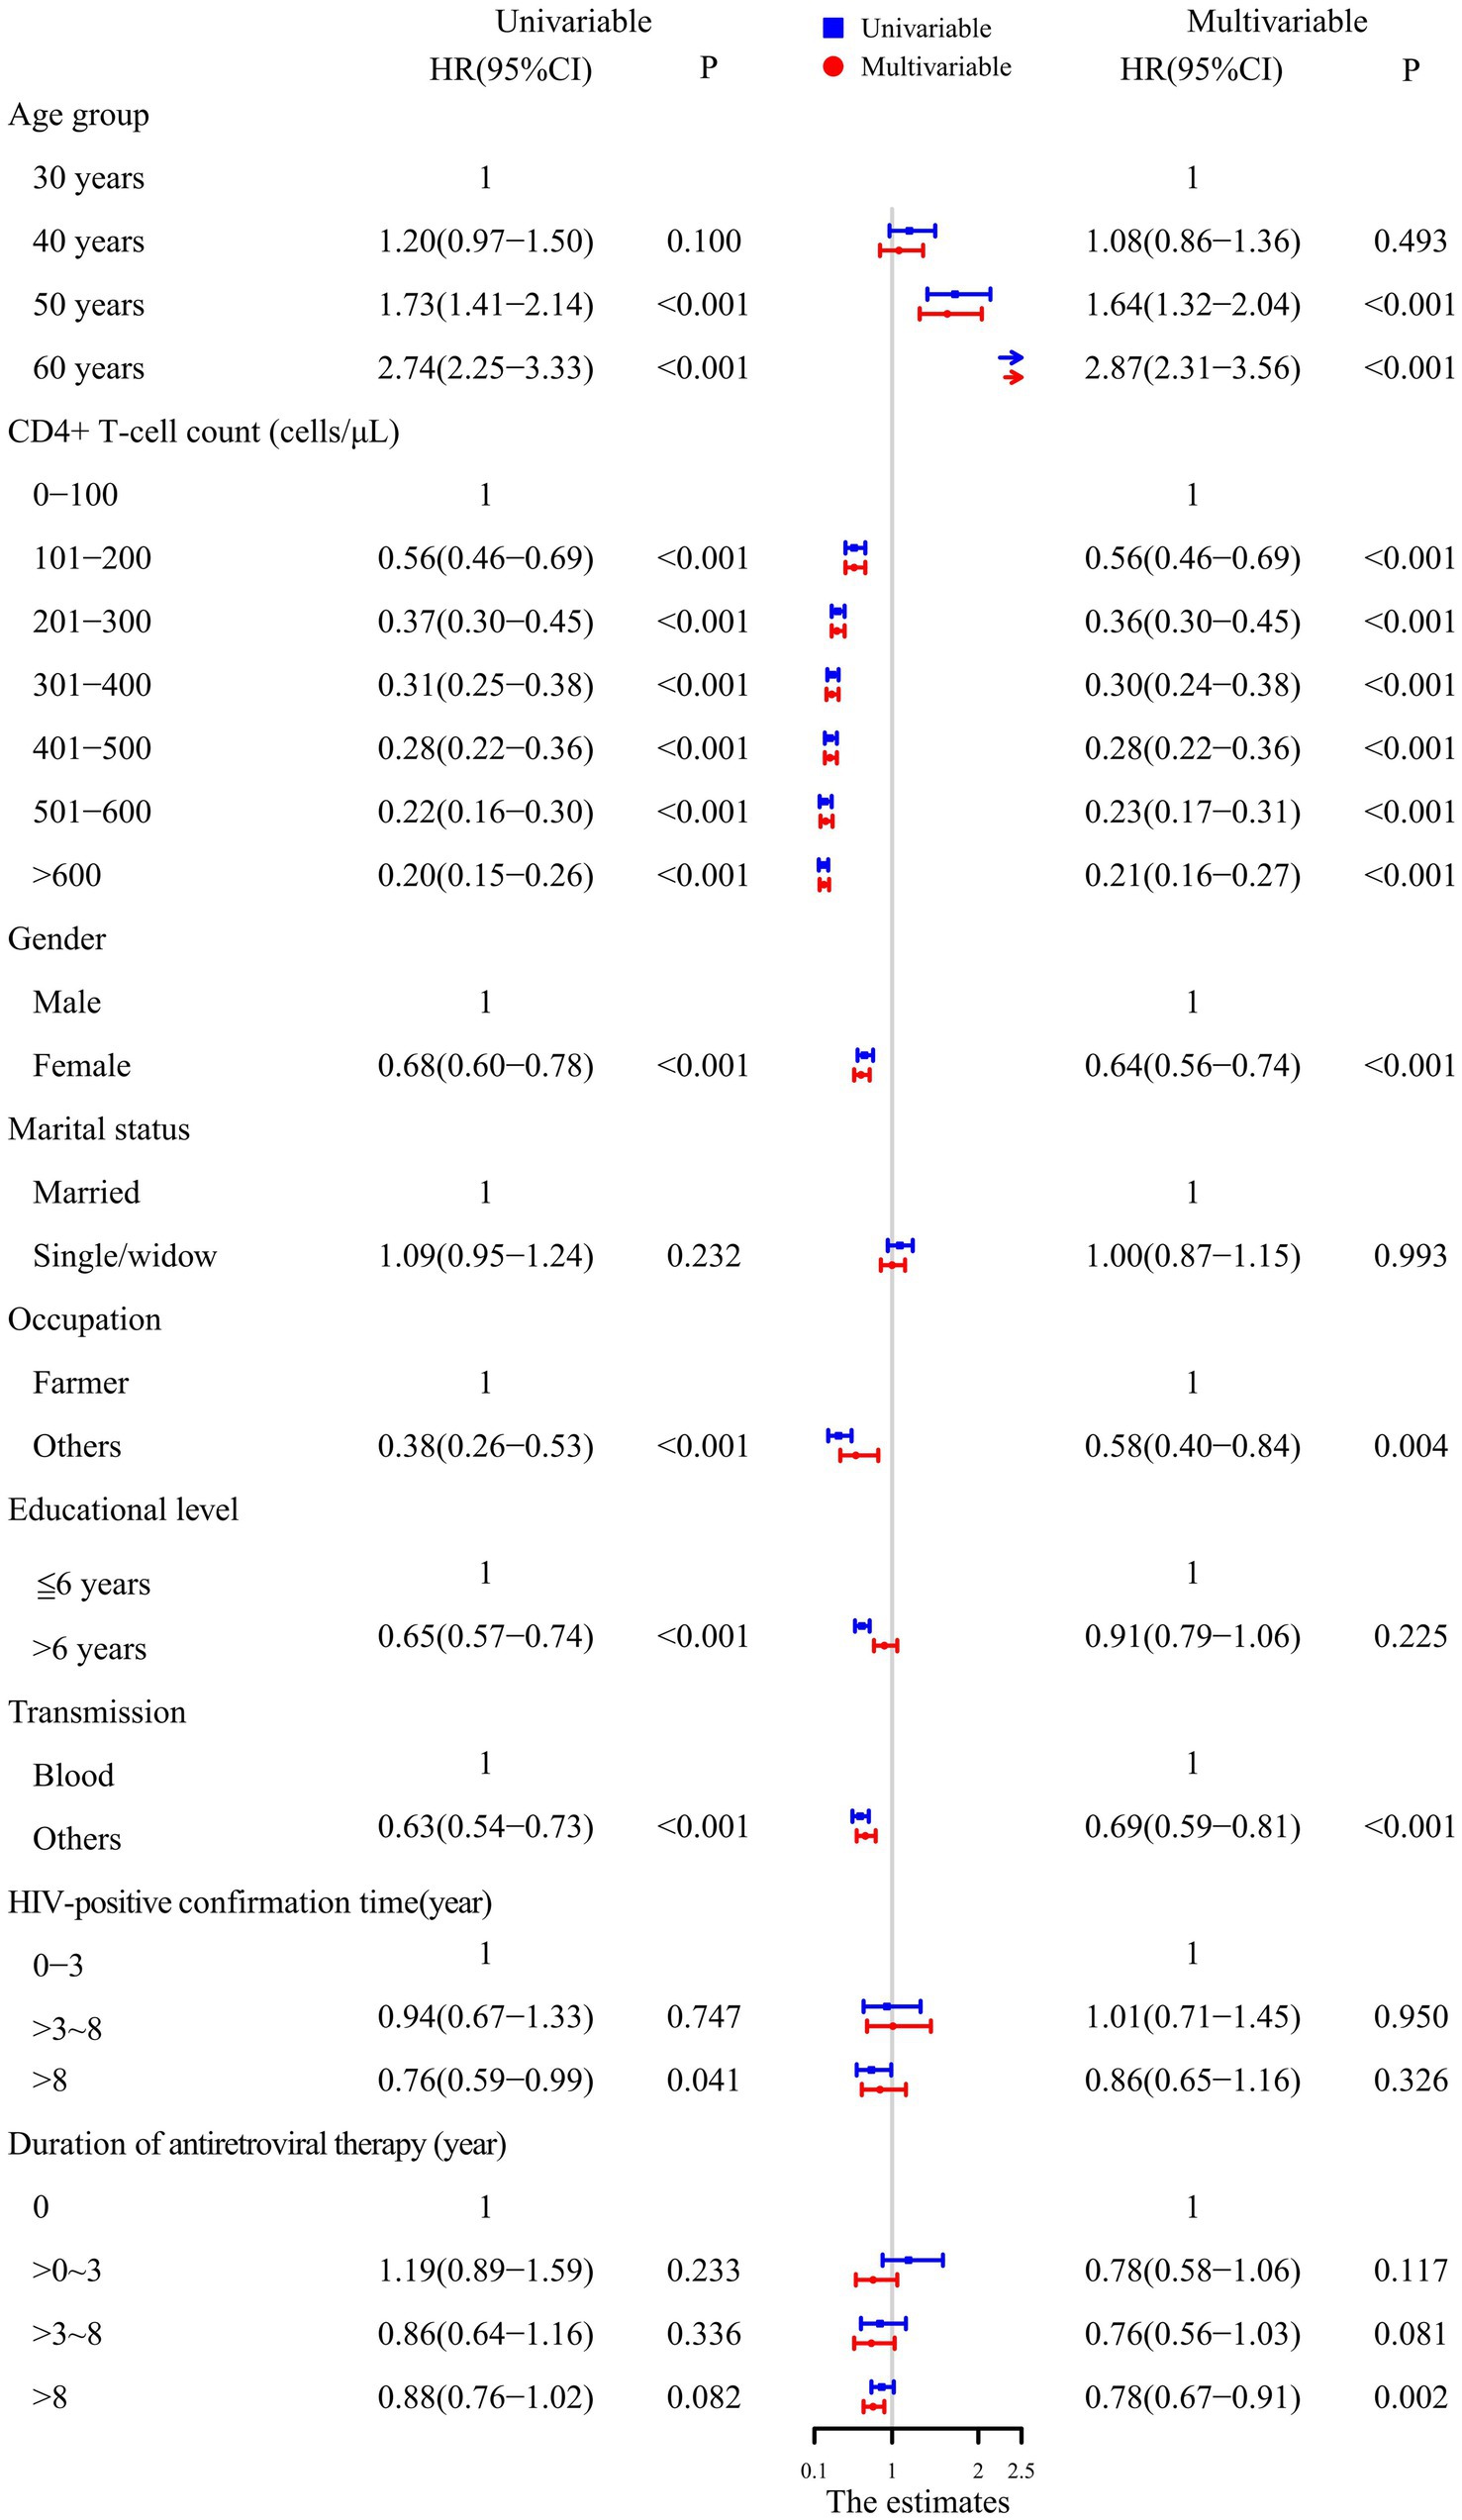
Figure 2. Analysis of the factors influencing survival in PLHIV using the Cox proportional hazards model.
A 5-knot RCS model was used for the 30-year, 50-year, and 60-year age groups. A 3-knot RCS model was used for the 40-year age group (results detailed in Table 2). The optimal RCS model revealed a non-linear association between the CD4+ T-cell counts and mortality risk in the PLHIV across the different age groups, with cutoff values of 382, 332, 334, and 215 cells/μL for the 30-, 40-, 50-, and 60-year age groups, respectively. The non-linear curve showed that the HR decreased as the CD4+ T-cell count increased. However, once the CD4+ T-cell counts reached their respective cutoff values, the curve indicating the mortality risk reduction began to flatten, as shown in Figure 3.
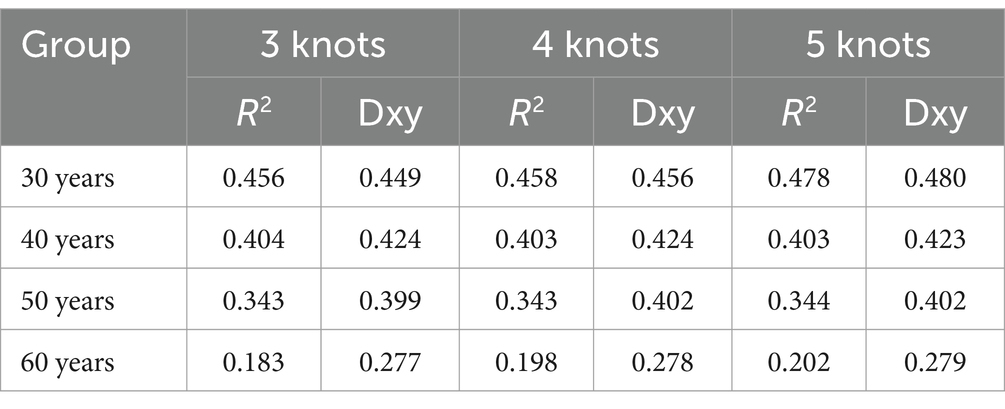
Table 2. Evaluation of RCS models with different knots across the four age groups.
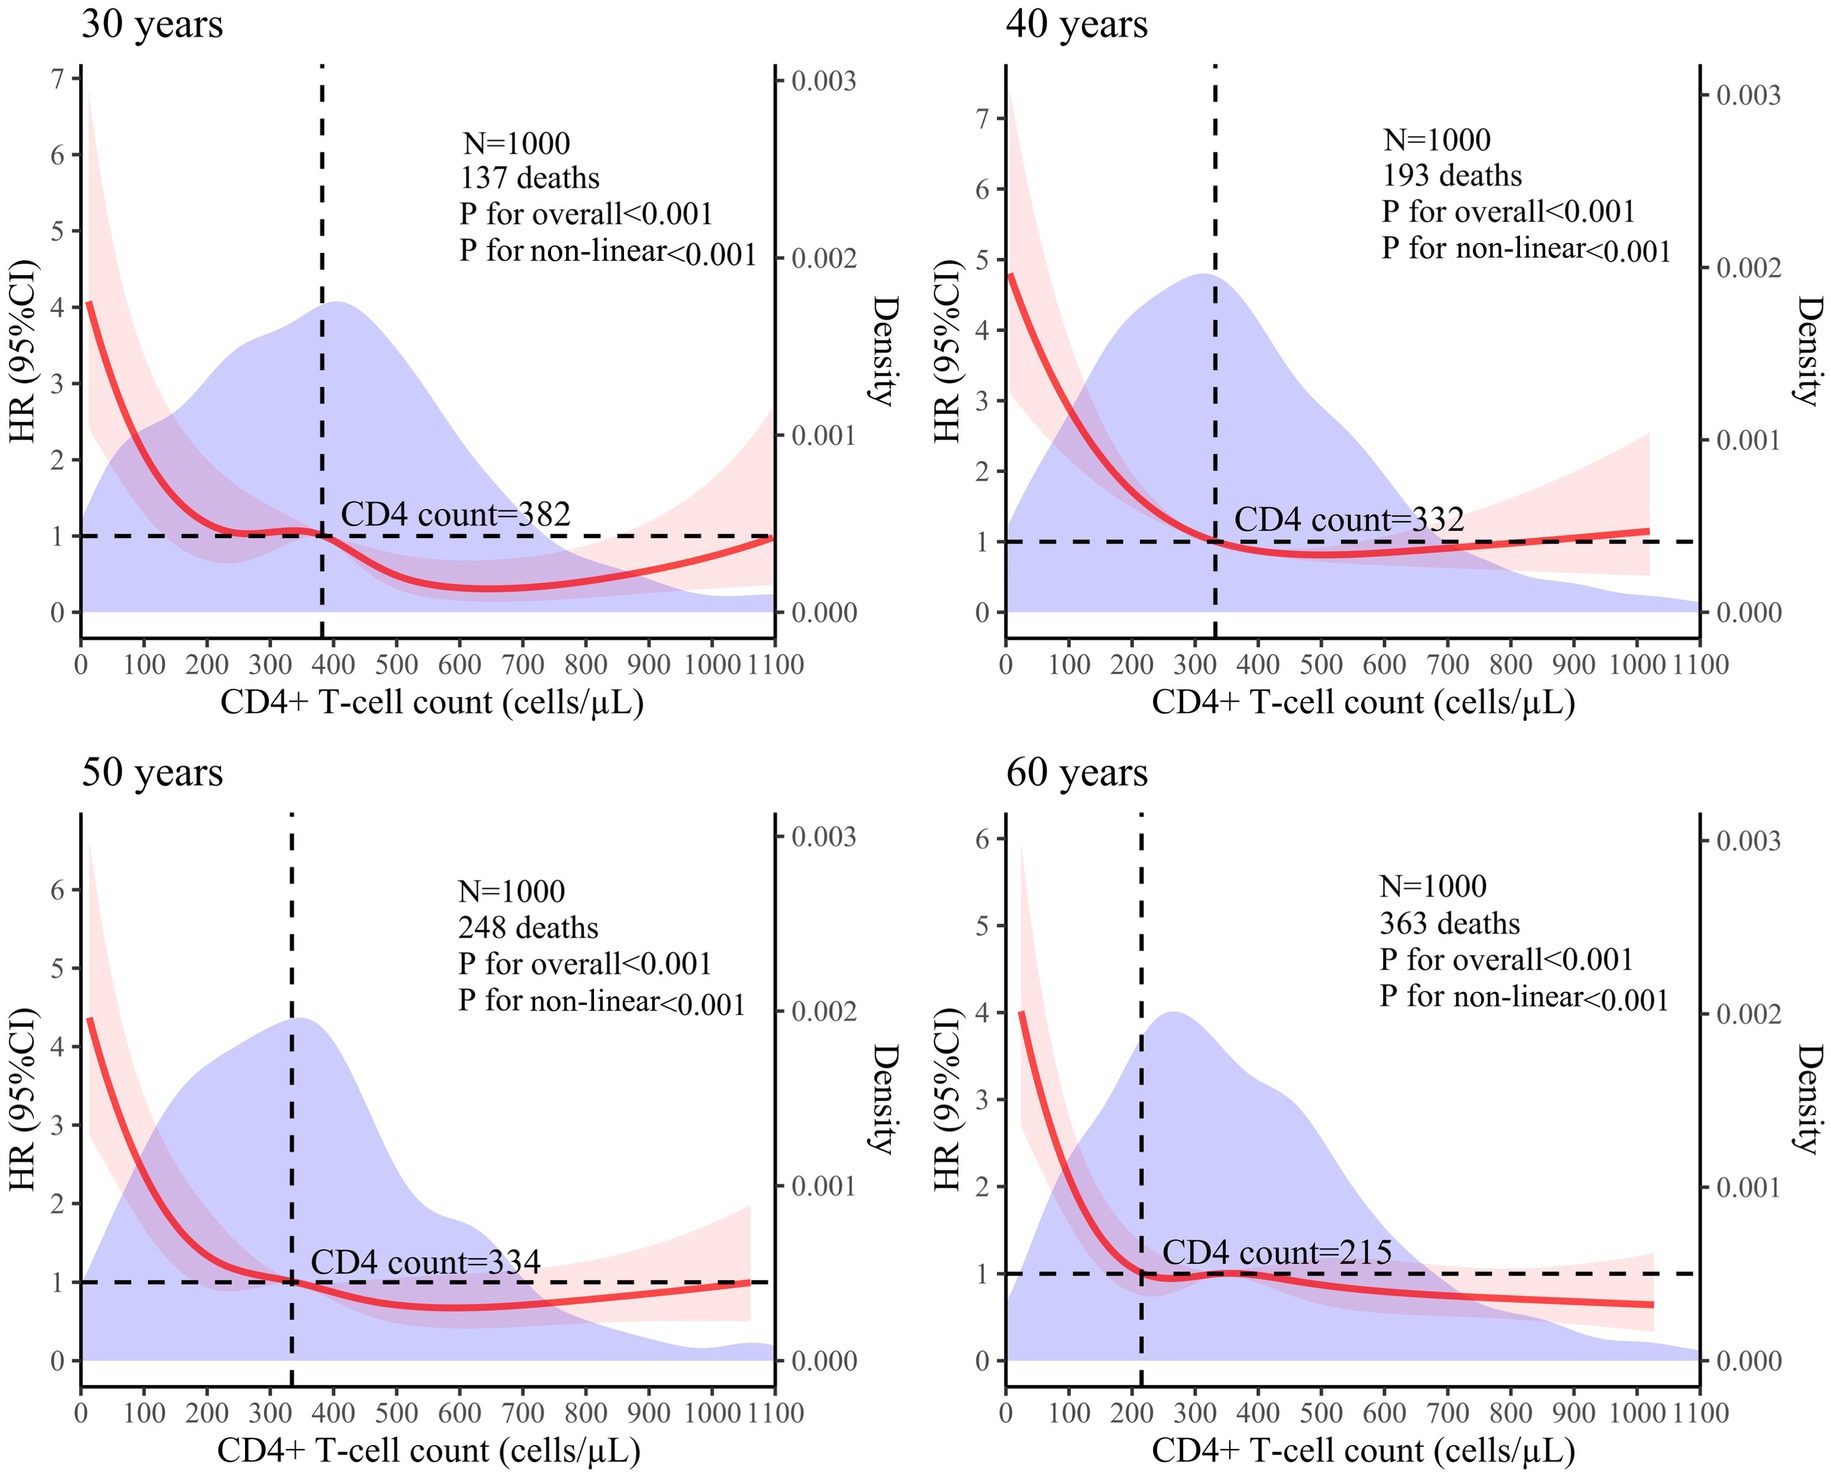
Figure 3. Analysis of the non-linear association between CD4+ T-cell counts and mortality risk in PLHIV based on the RCS model (The red solid line represents the HR value, the red shaded area corresponds to its 95% CI, and the purple area represents the density of different CD4+ T-cell counts).
The Cox proportional hazards regression model indicated that as the CD4+ T-cell count increased, the HR value decreased; however, the HR value did not exhibit a proportional reduction, suggesting a non-linear association between the CD4+ T-cell counts and mortality risk in PLHIV. This finding aligns with those of previous research (9, 10). While regression models are frequently utilized to explore associations between CD4+ T-cell counts and mortality risk, these models often presuppose a linear association (11). If actual data do not conform to this assumption, simply converting the CD4+ T-cell count into a categorical variable may not only overlook or discard the continuous nature of the data but also introduce new biases, thereby potentially affecting the accuracy and reliability of the analysis results. In contrast, the RCS model can treat CD4+ T-cell counts as continuous variables to effectively model their non-linear association with mortality risk through a smooth curve.
Previous studies have demonstrated that age is a significant risk factor for mortality in PLHIV (12, 13). These studies typically categorized PLHIV by age groups, such as Yue Tingting’s study, which divided PLHIV into four groups: under 30 years, 30–39 years, 40–49 years, and 50 years and older (14). Tian Bo used 50 years as the cutoff point, dividing age groups into two: below 50 years and above 50 years (15). Jun-fan Pu categorized age into four groups: 15–29 years, 30–44 years, 45–59 years, and 60 years and older (16). This approach often employs broad intervals of 10 or 15 years, and in some cases, a singular boundary at 50 years, potentially exacerbating disparities in the target analysis variables across different age cohorts (17). Therefore, this study adopted a more refined division strategy, focusing specifically on ages 30, 40, 50, and 60 years to control for potential confounding effects of age on the research results.
The RCS model showed that once the CD4+ T-cell counts reached the respective cutoff values—382 cells/μL for 30 years, 332 cells/μL for 40 years, 334 cells/μL for 50 years, and 215 cells/μL for 60 years—the curve depicting the reduction in mortality risk tended to flatten. Research has indicated that as age increases, the likelihood of opportunistic infections and complications also rises, leading to higher mortality risks (18, 19). Therefore, it is expected that the cutoff value would decrease with advancing age.
Although the cutoff values for each age group vary, they consistently remain around 350 cells/μL. A CD4+ T-cell count of 350 cells/μL is a critical threshold in AIDS-related research. Several studies have used survival curves to clearly illustrate that PLHIV with baseline CD4+ T-cell counts ≥350 cells/μL have higher survival rates throughout the observation period compared to those with counts <350 cells/μL. In addition, the Cox proportional hazards model revealed that the PLHIV with a CD4+ T-cell count <350 cells/μL exhibited a significantly higher mortality risk than those with a count ≥350 cells/μL (16, 20). A study aimed at identifying the determinants of tuberculosis co-infection among PLHIV in Papua found that HIV-infected individuals with a baseline CD4+ T-cell count <350 cells/μL were at a significantly higher risk of opportunistic infections compared to those with a CD4+ T-cell count ≥350 cells/μL (21). Some studies on complications associated with HIV infection have suggested that a CD4+ T-cell count <350 cells/μL can accelerate hepatitis progression (22) and is a risk factor for malignancies (23) and cervical cytological abnormalities (24) in PLHIV. Studies on the impact of HIV-1 genetic diversity on disease progression (25) and the efficacy and safety of a simplified lamivudine plus dolutegravir dual therapy in HIV-1-Infected patients (26) have also identified that a CD4+ T-cell count <350 cells/μL is a risk factor that impedes CD4 + T lymphocyte recovery. Research on pregnancy in women has found that a lower pregnancy incidence (27) and adverse pregnancy outcomes (28) are associated with a CD4+ T-cell count <350 cells/μL. Therefore, considering these findings along with the cutoff value, it is widely recognized that a CD4+ T-cell count <350 cells/μL signifies an elevated risk of mortality and necessitates disease prevention strategies.
In summary, there was a non-linear association between CD4+ T-cell counts and mortality risk in PLHIV. As CD4+ T-cell counts fall below their respective cutoff values, the mortality risk increases significantly. Notably, despite variations in cutoff values across age groups, they consistently remain around 350 cells/μL. Consequently, it is imperative to concentrate on populations whose mortality risk increases rapidly. Comprehensively considering cutoff values—specifically targeting a CD4+ T-cell count <350 cells/μL—is vital for reducing the mortality rate of PLHIV. There are certain limitations to this study. Firstly, it was a retrospective study based on real-world data, which might have resulted in incomplete data collection and insufficient exclusion of confounding factors, such as reasons for attrition and comorbidities. Secondly, only participants aged 30, 40, 50, and 60 years were included, and age was treated as a discrete variable—for example, a person aged 30 years and 11 months was placed in the 30-year age group although they were closer to 40 years old— potentially limiting the generalizability of the results. Thirdly, the single data source might have limited the variability regarding the infection routes. In addition, the study spanned a considerable period but did not account for the progress of the ART protocols over time, which might have introduced bias in mortality risk. Considering these limitations, it is necessary to conduct prospective, multicenter cohort studies to analyze the association between CD4+ T-cell counts and mortality risk of PLHIV, thereby addressing the shortcomings of this study.
The original contributions presented in the study are included in the article/supplementary material, further inquiries can be directed to the corresponding authors.
The studies involving humans were approved by the First Affiliated Hospital of Henan University of CM. The studies were conducted in accordance with the local legislation and institutional requirements. Written informed consent for participation was not required from the participants or the participants’ legal guardians/next of kin in accordance with the national legislation and institutional requirements.
RS: Writing – original draft, Writing – review & editing. HJ: Writing – review & editing. QK: Data curation, Supervision, Writing – review & editing. YM: Data curation, Writing – review & editing. ZH: Data curation, Writing – review & editing. XM: Methodology, Supervision, Writing – review & editing. JY: Methodology, Supervision, Writing – review & editing. HG: Resources, Writing – review & editing. QX: Supervision, Writing – review & editing. YJ: Data curation, Funding acquisition, Methodology, Software, Supervision, Writing – review & editing.
The author(s) declare financial support was received for the research, authorship, and/or publication of this article. This work was supported by the Science and Technology Research Foundation of Henan Province in China (No. 242301420093), Special Scientific Research of Chinese Medicine of Henan Province in China (Nos. 2023ZXZX1160 and 2022JDZY080) and Henan University of Traditional Chinese Medicine “double first-class” creation project (No. HSRP-DFCTCM-2023-4-01), National Natural Science Foundation of China (Nos. 81803953 and 82104559).
We acknowledge the NHANES database for providing their platform and contributors for sharing their valuable datasets. Additionally, we extend our gratitude to all participants involved in our current study.
The authors declare that the research was conducted in the absence of any commercial or financial relationships that could be construed as a potential conflict of interest.
The authors declare that no Gen AI was used in the creation of this manuscript.
All claims expressed in this article are solely those of the authors and do not necessarily represent those of their affiliated organizations, or those of the publisher, the editors and the reviewers. Any product that may be evaluated in this article, or claim that may be made by its manufacturer, is not guaranteed or endorsed by the publisher.
1. UNAIDS. Global AIDS update. The Joint United Nations Programme on HIV/AIDS. (2024). Available at: https://www.unaids.org/en/resources/fact-sheet
2. Li, CF, Yang, X, Yang, XX, Chen, YY, Zhang, X, Sun, Y, et al. Analysis of effects and influencing factors of antiviral therapy in HIV/AIDS patients of different ages in Zhengzhou. Chinese J AIDS STD. (2023) 29:1285–9. doi: 10.13419/j.cnki.aids.2023.12.013
3. Zhu, KY, Xu, QL, Li, PY, Jia, HC, Jiang, Q, Liu, YN, et al. Analysis of influential factors of viral inhibition failure in second-line antiviral treatment of AIDS in Henan Province from 2009 to 2018. Modern. Prev Med. (2023) 50:718-23+61. doi: 10.20043/j.cnki.MPM.202208048
4. Dumchev, K, Guo, X, Ha, TV, Djoerban, Z, Zeziulin, O, Go, VF, et al. Causes and risk factors of death among people who inject drugs in Indonesia, Ukraine and Vietnam: findings from HPTN 074 randomized trial. BMC Infect Dis. (2023) 23:319. doi: 10.1186/s12879-023-08201-3
5. Najafi Ghobadi, K, Mahjub, H, Poorolajal, J, Shakiba, E, Khassi, K, and Roshanaei, G. Joint modeling of longitudinal outcome and competing risks: application to HIV/AIDS data. J Res Health Sci. (2023) 23:e00571. doi: 10.34172/jrhs.2023.106
6. Desquilbet, L, and Mariotti, F. Dose-response analyses using restricted cubic spline functions in public health research. Stat Med. (2010) 29:1037–57. doi: 10.1002/sim.3841
7. Ma, XX, Xu, LR, Gui, HJ, Ma, YM, Xu, QL, and Jin, YT. Subgroup analysis of the effect of traditional Chinese medicine treatment on death of HIV/AIDS patients in Henan Province. Chinese J Dermatovenereol. (2024) 38:1–11. doi: 10.13735/j.cjdv.1001-7089.202402047
8. National Center for STD Control, China CDC. National free AIDS antiviral drug treatment manual. 4th ed. Beijing: People’s Medical Publishing House (2016).
9. Wagner, T, Levy, I, Elbirt, D, Shahar, E, Olshtain-Pops, K, Elinav, H, et al. Factors associated with Virological failure in first-line antiretroviral therapy in patients diagnosed with HIV-1 between 2010 and 2018 in Israel. Viruses. (2023) 15. doi: 10.3390/v15122439
10. Pantke, A, Kollan, C, Gunsenheimer-Bartmeyer, B, Jensen, BO, Stephan, C, Degen, O, et al. AIDS-defining events among people living with HIV who have been under continuous antiretroviral therapy for more than one year, a German cohort study 1999-2018. Infection. (2024) 52:637–48. doi: 10.1007/s15010-024-02188-y
11. Austin, PC, Fang, J, and Lee, DS. Using fractional polynomials and restricted cubic splines to model non-proportional hazards or time-varying covariate effects in the cox regression model. Stat Med. (2022) 41:612–24. doi: 10.1002/sim.9259
12. Zhou, Y, Yang, Z, Liu, M, Lu, Y, Qin, Y, He, X, et al. Independent risk factors for deaths due to AIDS in Chongqing, China does age matter? Front Med. (2021) 7:586390. doi: 10.3389/fmed.2020.586390
13. Zhu, Z, Xu, Y, Wu, S, Li, X, Shi, H, Dong, X, et al. Survival and risk factors associated with mortality in people living with HIV from 2005 to 2018 in Nanjing, China. Front Public Health. (2022) 10:989127. doi: 10.3389/fpubh.2022.989127
14. Yue, T, Zhang, P, Hao, Y, He, J, Zheng, J, de, E, et al. Epidemiology and clinical outcomes of HIV infection in south-Central China: a retrospective study from 2003 to 2018. Front Public Health. (2022) 10:902537. doi: 10.3389/fpubh.2022.902537
15. Tian, B, Jin, YM, Li, ZX, Fang, MQ, Xue, Q, and Liu, J. Cardiovascular risk assessment and analysis of influencing factors in AIDS patients treated with antiviral therapy. Chinese J AIDS STD. (2023) 29:1290–4. doi: 10.13419/j.cnki.aids.2023.12.02
16. Pu, JF, and Wu, J. Survival analysis of PLWHA undergoing combined antiretroviral therapy: exploring long-term prognosis and influencing factors. Front Public Health. (2024) 12:1327264. doi: 10.3389/fpubh.2024.1327264
17. Hua, SM. Application and development of "age-period-cohort" effect model. China CIO News. (2019) 9:73–4.
18. Walmsley, S, Smith, DE, Górgolas, M, Cahn, PE, Lutz, T, Lacombe, K, et al. Efficacy and safety of switching to dolutegravir/lamivudine in virologically suppressed people with HIV-1 aged ≥ 50 years: week 48 pooled results from the TANGO and SALSA studies. AIDS Res Ther. (2024) 21:17. doi: 10.1186/s12981-024-00604-9
19. Li, BL, Zhou, WM, Lu, XM, Yu, R, and Wang, M. Relationship between peripheral blood CD4~+T lymphocyte level, CD4+/CD8+ ratio and prognosis in AIDS patients with pulmonary tuberculosis before treatment. Chinese J Dermatovenereol. (2023) 37:449–53. doi: 10.13735/j.cjdv.1001-7089.202203074
20. Person, AK, Crabtree-Ramirez, B, Kim, A, Veloso, V, Maruri, F, Wandeler, G, et al. Cryptococcal meningitis and clinical outcomes in persons with human immunodeficiency virus: a global view. Clin Infect Dis. (2023) 76:2116–25. doi: 10.1093/cid/ciad076
21. Widiyanti, M, Adiningsih, S, Kridaningsih, TN, and Fitrianingtyas, R. Viral load and CD4(+) markers as determinants of tuberculosis coinfection among people living with HIV/AIDS in Papua Indonesia. Asia Pac J Public Health. (2023) 35:510–5. doi: 10.1177/10105395231199570
22. Srisopa, S, Pipatsatitpong, D, and Akekawatchai, C. Association of serum lipid profile with liver fibrosis in HCV-coinfected HIV patients on suppressive anti-retroviral therapy. Biomed Rep. (2024) 21:146. doi: 10.3892/br.2024.1834
23. Chammartin, F, Mocroft, A, Egle, A, Zangerle, R, Smith, C, Mussini, C, et al. Measures of longitudinal immune dysfunction and risk of AIDS and non-AIDS defining malignancies in antiretroviral-treated people with human immunodeficiency virus. Clin Infect Dis. (2024) 78:995–1004. doi: 10.1093/cid/ciad671
24. Wang, X, Zhang, Y, Xiao, J, Song, C, Liu, T, Liu, J, et al. Effect of vaginal microecological disorders on the increased risk of abnormal cervical cytology among women with human immunodeficiency virus in China. J Infect Dis. (2024) 230:61–6. doi: 10.1093/infdis/jiae058
25. Zhong, M, Chen, C, Hu, Y, Zou, M, Yan, L, Huang, J, et al. Efficacy and safety of a simplified lamivudine plus Dolutegravir dual therapy in HIV-1-infected patients: a multicenter cohort study in China. J Acquir Immune Defic Syndr. (2022) 91:S42–50. doi: 10.1097/QAI.0000000000003047
26. Pang, X, Huang, J, Tang, K, Ma, J, Fang, N, Xie, H, et al. Impact of HIV-1 genetic diversity on disease progression: a prospective cohort study in Guangxi. Front Cell Infect Microbiol. (2024) 14:1415123. doi: 10.3389/fcimb.2024.1415123
27. Domingues, R, Quintana, MSB, Coelho, LE, Friedman, RK, Rabello, A, Rocha, V, et al. Pregnancy incidence, outcomes and associated factors in a cohort of women living with HIV/AIDS in Rio de Janeiro, Brazil, 1996-2016. Cad Saude Publica. (2023) 39:e00232522. doi: 10.1590/0102-311xen232522
Keywords: non-linear associations, CD4+ T-cell count, mortality risk, Cox proportional hazards regression model, restricted cubic spline
Citation: Sun R, Jia H, Kang Q, Ma Y, He Z, Ma X, Yuan J, Guo H, Xu Q and Jin Y (2025) Non-linear association between CD4+ T-cell counts and mortality risk in people living with HIV: evidence from a 10-year cohort study. Front. Med. 12:1502804. doi: 10.3389/fmed.2025.1502804
Edited by:
Massimiliano Lanzafame, Santa Chiara Hospital, ItalyReviewed by:
Elisa De Lazzari, Hospital Clinic of Barcelona, SpainCopyright © 2025 Sun, Jia, Kang, Ma, He, Ma, Yuan, Guo, Xu and Jin. This is an open-access article distributed under the terms of the Creative Commons Attribution License (CC BY). The use, distribution or reproduction in other forums is permitted, provided the original author(s) and the copyright owner(s) are credited and that the original publication in this journal is cited, in accordance with accepted academic practice. No use, distribution or reproduction is permitted which does not comply with these terms.
*Correspondence: Qianlei Xu, eHVxaWFubGVpNjY2QDEyNi5jb20=; Yantao Jin, amVudHlraW5nQDEyNi5jb20=
†These authors have contributed equally to this work
Disclaimer: All claims expressed in this article are solely those of the authors and do not necessarily represent those of their affiliated organizations, or those of the publisher, the editors and the reviewers. Any product that may be evaluated in this article or claim that may be made by its manufacturer is not guaranteed or endorsed by the publisher.
Research integrity at Frontiers
Learn more about the work of our research integrity team to safeguard the quality of each article we publish.