 Martin Kužma1*
 Zuzana Kužmová1Ludovic Humbert2
 Mirella Lopez Picazo2Roman Králik1Jakub Falat1Juraj Smaha1Peter Jackuliak1Zdenko Killinger1
 Juraj Payer1
- 15th Department of Internal Medicine, Comenius University Faculty of Medicine, University Hospital Bratislava, Bratislava, Slovakia
- 23D-Shaper Medical, Barcelona, Spain
Introduction: Patients in later stages of chronic kidney disease (CKD) have a 2- to 14-fold increase in fracture risk. Bone mineral density (BMD) assessment is limited due to the inability to measure trabecular and cortical bone characteristics and the interference of aortic calcifications.
Study objective: This study aimed to assess the trabecular bone score (TBS) and three-dimensional dual-energy X-ray absorptiometry (3D-DXA) in participants across all CKD stages.
Patients and methods: In total, 64 CKD patients (consisting of 28 female participants and 36 male participants, with an average age of 69.5 years) were included. There were 9, 12, 8, 9, 11, and 15 participants in stages G1, G2, G3a, G3b, G4, and G5 of CKD, respectively. BMD at the lumbar spine (LS) and proximal femur, as well as the LS TBS, were analyzed. The proximal femur parameters such as cortical and trabecular volumetric (v)BMD, cortical thickness (CTh), and surface (s)BMD at the total hip (TH) and femoral neck (FN) were analyzed using 3D-Shaper software.
Results: Comparison between the earlier stages (G1-G3a) and the later CKD stages (G3b-G5) showed significant differences in carboxy terminal collagen crosslinks (CTx) (386 vs.1053 ng/L), TH areal bone mineral density (aBMD; 0.991 vs. 0.859 g/cm2), cortical TH vBMD (831 vs. 795 mg/cm3), FN (837 vs. 788 mg/cm3), TH cortical sBMD (170 mg/cm2), and TH Cth (2.03 vs. 1.92 mm; all p < 0.05). Cross-sectional comparisons between each CKD stage showed a gradual decrease in the LS BMD, TH cortical vBMD, sBMD (FN and TH), and TH Cth. Strong positive associations between the glomerular filtration rate (GFR) and cortical parameters (FN/TH vBMD and TH Cth) were observed (p < 0.01).
Conclusion: In conclusion, advanced stages of CKD (G3b–G5) were associated with lower cortical bone parameters. The majority of the cortical parameters were correlated with the GFR, demonstrating a direct relationship between the kidney function and bone structure.
Introduction
Chronic kidney disease (CKD) has been observed to have an increasing prevalence in recent years. One of the important CKD complications is fragility fractures, with a 2- to 14-fold increase in fracture risk depending on the CKD stage. Fractures in individuals with CKD are associated with increased morbidity and mortality (1). Although it is well established that end-stage renal disease (ESRD) is associated with an increased fracture risk (2, 3), earlier CKD stages also pose an increased risk of fractures (4, 5). The gold standard to measure bone mass and predict fracture risk in the general population is dual-energy X-ray absorptiometry (DXA). Some studies have shown that low areal bone mineral density (aBMD) is useful in predicting fractures in CKD stages 3–5 and after kidney transplantation (6–8). However, fractures cannot always be explained by decreased aBMD; they may also be caused by insufficient bone quality. Bone quality is defined by properties of bone material, including bone turnover, microarchitecture, mineralization, accumulation of microdamage, and collagen properties (9). In CKD, these changes in bone quality are called renal osteodystrophy. Several methods have been developed to assess bone quality. In CKD, methods such as high-resolution peripheral quantitative computed tomography (HR-pQCT) were used to assess three-dimensional bone density and structural changes. Additionally, tetracycline double-labeled trans-iliac crest bone biopsy and histomorphometry were peformed to quantify the volume and microarchitecture of cancellous and cortical compartments, microdamage, characteristics of mineralization, turnover, and collagen structure. In patients with CKD, it has been suggested that both aBMD and bone texture, as assessed using the trabecular bone score (TBS), should be evaluated to better estimate the risk of fractures (10). The trabecular bone score, an indirect measure of trabecular bone texture, is associated with a lower estimated glomerular filtration rate (eGFR). Patients with end-stage renal disease (ESRD) had lower TBS compared to healthy controls (11, 12) and these scores were predictive of prior vertebral fractures (13). In individuals with subsequent CKD, a typical finding using HR-pQCT revealed a decrease in cortical volumetric BMD (vBMD) but not in the trabecular bone. This decrease in cortical vBMD is primarily attributable to high levels of parathyroid hormone (14–17). A potentially practical tool for determining cortical and trabecular bone compartments is 3D modeling of the proximal femur DXA scan known as 3D-DXA (18). The accuracy of 3D-DXA structural parameters was evaluated by comparing them with QCT measurements. The results showed strong correlations, with correlation coefficients ranging from 0.86 to 0.96, between the geometric and volumetric structural parameters obtained from 3D-DXA and QCT (18–20). Several studies have revealed the usefulness of 3D-DXA in secondary osteoporosis conditions, including acromegaly (21), rheumatoid arthritis (22), Down syndrome (23), and psoriatic disease (24). In the context of bone changes in CKD, 3D-DXA revealed an impairment of the cortical bone in individuals with primary hyperparathyroidism (25, 26). Recently, in postmenopausal osteoporosis, significant improvements in 3D-DXA measurements, such as cortical thickness, cortical and trabecular volumetric BMD, and surface BMD, were observed in individuals treated with romosozumab followed by denosumab or alendronate (27). A study on denosumab treatment over 5 years in patients with dialyzed CKD (28) revealed lower integral and cortical vBMD values at baseline compared to year 1, with a predominant effect of denosumab on cortical parameters.
In light of these results, we performed a study to evaluate several non-invasive DXA-based methods used for the assessment of trabecular and cortical bone parameters, such as the trabecular bone score (TBS) and 3D-DXA parameters, in individuals across all CKD stages.
Patients and methods
Study participants
A single-center cross-sectional study was conducted at University Hospital Bratislava, involving Caucasian participants with chronic kidney disease (CKD) between July 2018 and July 2019. The study protocol was reviewed and approved by the local ethics committee, and informed consent was obtained from all participants prior to their inclusion in the research.
The study population consisted of participants diagnosed with CKD in accordance with the Kidney Disease: Improving Global Outcomes (KDIGO) guidelines, with no restrictions on sex, age, or the underlying etiology of CKD. According to the following KDIGO classifications, participants were categorized based on the estimated glomerular filtration rate (eGFR) as follows: G1 (≥90 ml/min/1.73 m2), G2 (60–89 ml/min/1.73 m2), G3a (45–59 ml/min/1.73 m2), G3b (30–44 ml/min/1.73 m2), G4 (15–29 ml/min/1.73 m2), and G5 (<15 ml/min/1.73 m2). To maintain the focus of the study, individuals with a history of specific osteoporosis treatments, apart from routine vitamin D or calcium supplementation, were excluded.
Additional exclusion criteria were applied to ensure the homogeneity and reliability of the data. These criteria included the presence of acute illnesses, such as infections, or acute exacerbations of chronic diseases, including CKD. In the case of CKD, an exacerbation is defined as an increase in serum creatinine levels exceeding 1.5 times the baseline value from prior examinations. Hospitalized and immobile individuals were also excluded from the study, along with those diagnosed with secondary osteoporosis caused by conditions such as glucocorticoid-induced osteoporosis, malabsorption syndromes, primary hyperparathyroidism, or rheumatoid arthritis.
This carefully selected cohort aimed to provide a clear and controlled analysis of CKD-related factors while minimizing potential confounding variables associated with osteoporosis and acute or secondary illnesses.
Methods
In all participants, laboratory parameters used to evaluate the stages of CKD (estimated glomerular filtration rate (eGFR) and the albumin/creatinine ratio from a single urine sample), calcium-phosphate metabolism (Ca, P, PTH), additional bone turnover parameters (25-OH-D3, CTx-C-terminal telopeptide fragment of collagen type I), and common biochemical parameters from serum samples were all assessed using electrochemiluminescence immunoassay (ECLIA) with Roche Elecsys 1010/2010 to evaluate the internal environment.
Bone measurements
Areal (a) BMD measurements in g/cm2 at the L1-4 spine (LS), femoral neck (FN), and total hip (TH) were performed using a Hologic Inc., Marlborough, MA, USA. The TBS was obtained from the DXA lumbar spine scans using TBS iNsight® (Medimaps SASU, Pessac, France), version 3.0.2.0. The vertebrae with more than one standard deviation (SD) difference in the BMD T-score compared to the adjacent vertebrae, fractured vertebrae, unreadable LS images, and vertebrae that underwent cementoplasty were excluded from the DXA and TBS analysis. 3D-Shaper-Research (version 2.12.1, 3D-Shaper Medical, Barcelona, Spain) was used to perform a 3D analysis (3D-DXA) from the hip DXA scans. The hip DXA scans were sent to 3D-Shaper Medical, where the analysis was performed by a specialist who was blinded to the CKD grade. 3D-Shaper software was used to assess the trabecular and cortical compartments of the proximal femur, represented by the volumetric (v) BMD in mg/cm3, cortical surface (s) BMD in mg/cm2, and cortical thickness (Cth) in mm. This 3D statistical model is aligned with the hip DXA scan to create a 3D QCT-like, patient-specific model of the proximal femur. The cortex is subsequently segmented by fitting a function to the density profile computed along the normal vector at each node of the proximal femur surface mesh (29). This fitting function depends on cortical thickness (Cth, in mm), cortical volumetric BMD (cortical vBMD, in mg/cm3), the location of the cortex, the density of surrounding tissues, and the imaging blur. Once the cortex is segmented, the trabecular bone part is extracted and characterized as its volumetric BMD (Trabecular vBMD, g/cm3). The cortical compartment is characterized by its thickness (Cth) and its volumetric BMD (Cortical vBMD). These two parameters can vary either in the same direction or in the opposite direction (e.g., with teriparatide treatment). To simplify the characterization of the cortical compartment, the cortical surface BMD (cortical sBMD, in mg/cm2) is calculated at each vertex of the femoral surface mesh. This is done by multiplying the cortical thickness (Cth in mm) by the cortical vBMD (in g/cm3) measured along this thickness. Although a novel approach in the DXA field, cortical sBMD has been previously introduced and used to characterize the cortical compartment of the proximal femur in QCT acquisitions (18, 27, 30–32).
Statistical methods
For statistical analysis, Analyze-it® version 6.15.4 (The Tannery, Leeds, United Kingdom) was used. Continuous variables were expressed as mean ± standard deviation (SD). Before the statistical analysis, values greater than or lesser than +/− 3 SD were excluded. The Shapiro–Francia test was used to assess the normality of the distribution of the monitored parameters. For individual comparisons between the groups, Student’s (independent sample) t-test and Mann–Whitney U test were performed, depending on the normality of the distribution of the specific data. ANCOVA was used to compare the bone measurements (DXA, TBS, and 3D-DXA parameters) between the individual groups. Correlation analysis was performed to determine the associations between the GFR and bone measurements.
Results
A total of 64 CKD participants (28 female individuals and 36 male individuals), with a mean age of 69.5 years, were included in the analysis. The participants were grouped across the six CKD stages based on the glomerular filtration rate (eGFR), with 9, 12, 8, 9, 11, and 15 participants in stages G1, G2, G3a, G3b, G4, and G5, respectively. To facilitate comparison, the cohort was divided into two groups: earlier CKD stages (G1–G3a) and later stages (G3b–G5).
Significant differences were observed between the two groups. The participants in the earlier CKD stages exhibited lower levels of creatinine, blood urea nitrogen, serum phosphorus, and CTx, as well as a higher GFR, areal bone mineral density (aBMD), cortical surface and volumetric bone mineral density (vBMD), and cortical thickness at the total hip region, compared to those in the later stages (all p < 0.05). However, no differences were observed in age, sex distribution, weight, BMI, albumin-to-creatinine ratio, serum calcium, or other bone measures (Table 1).
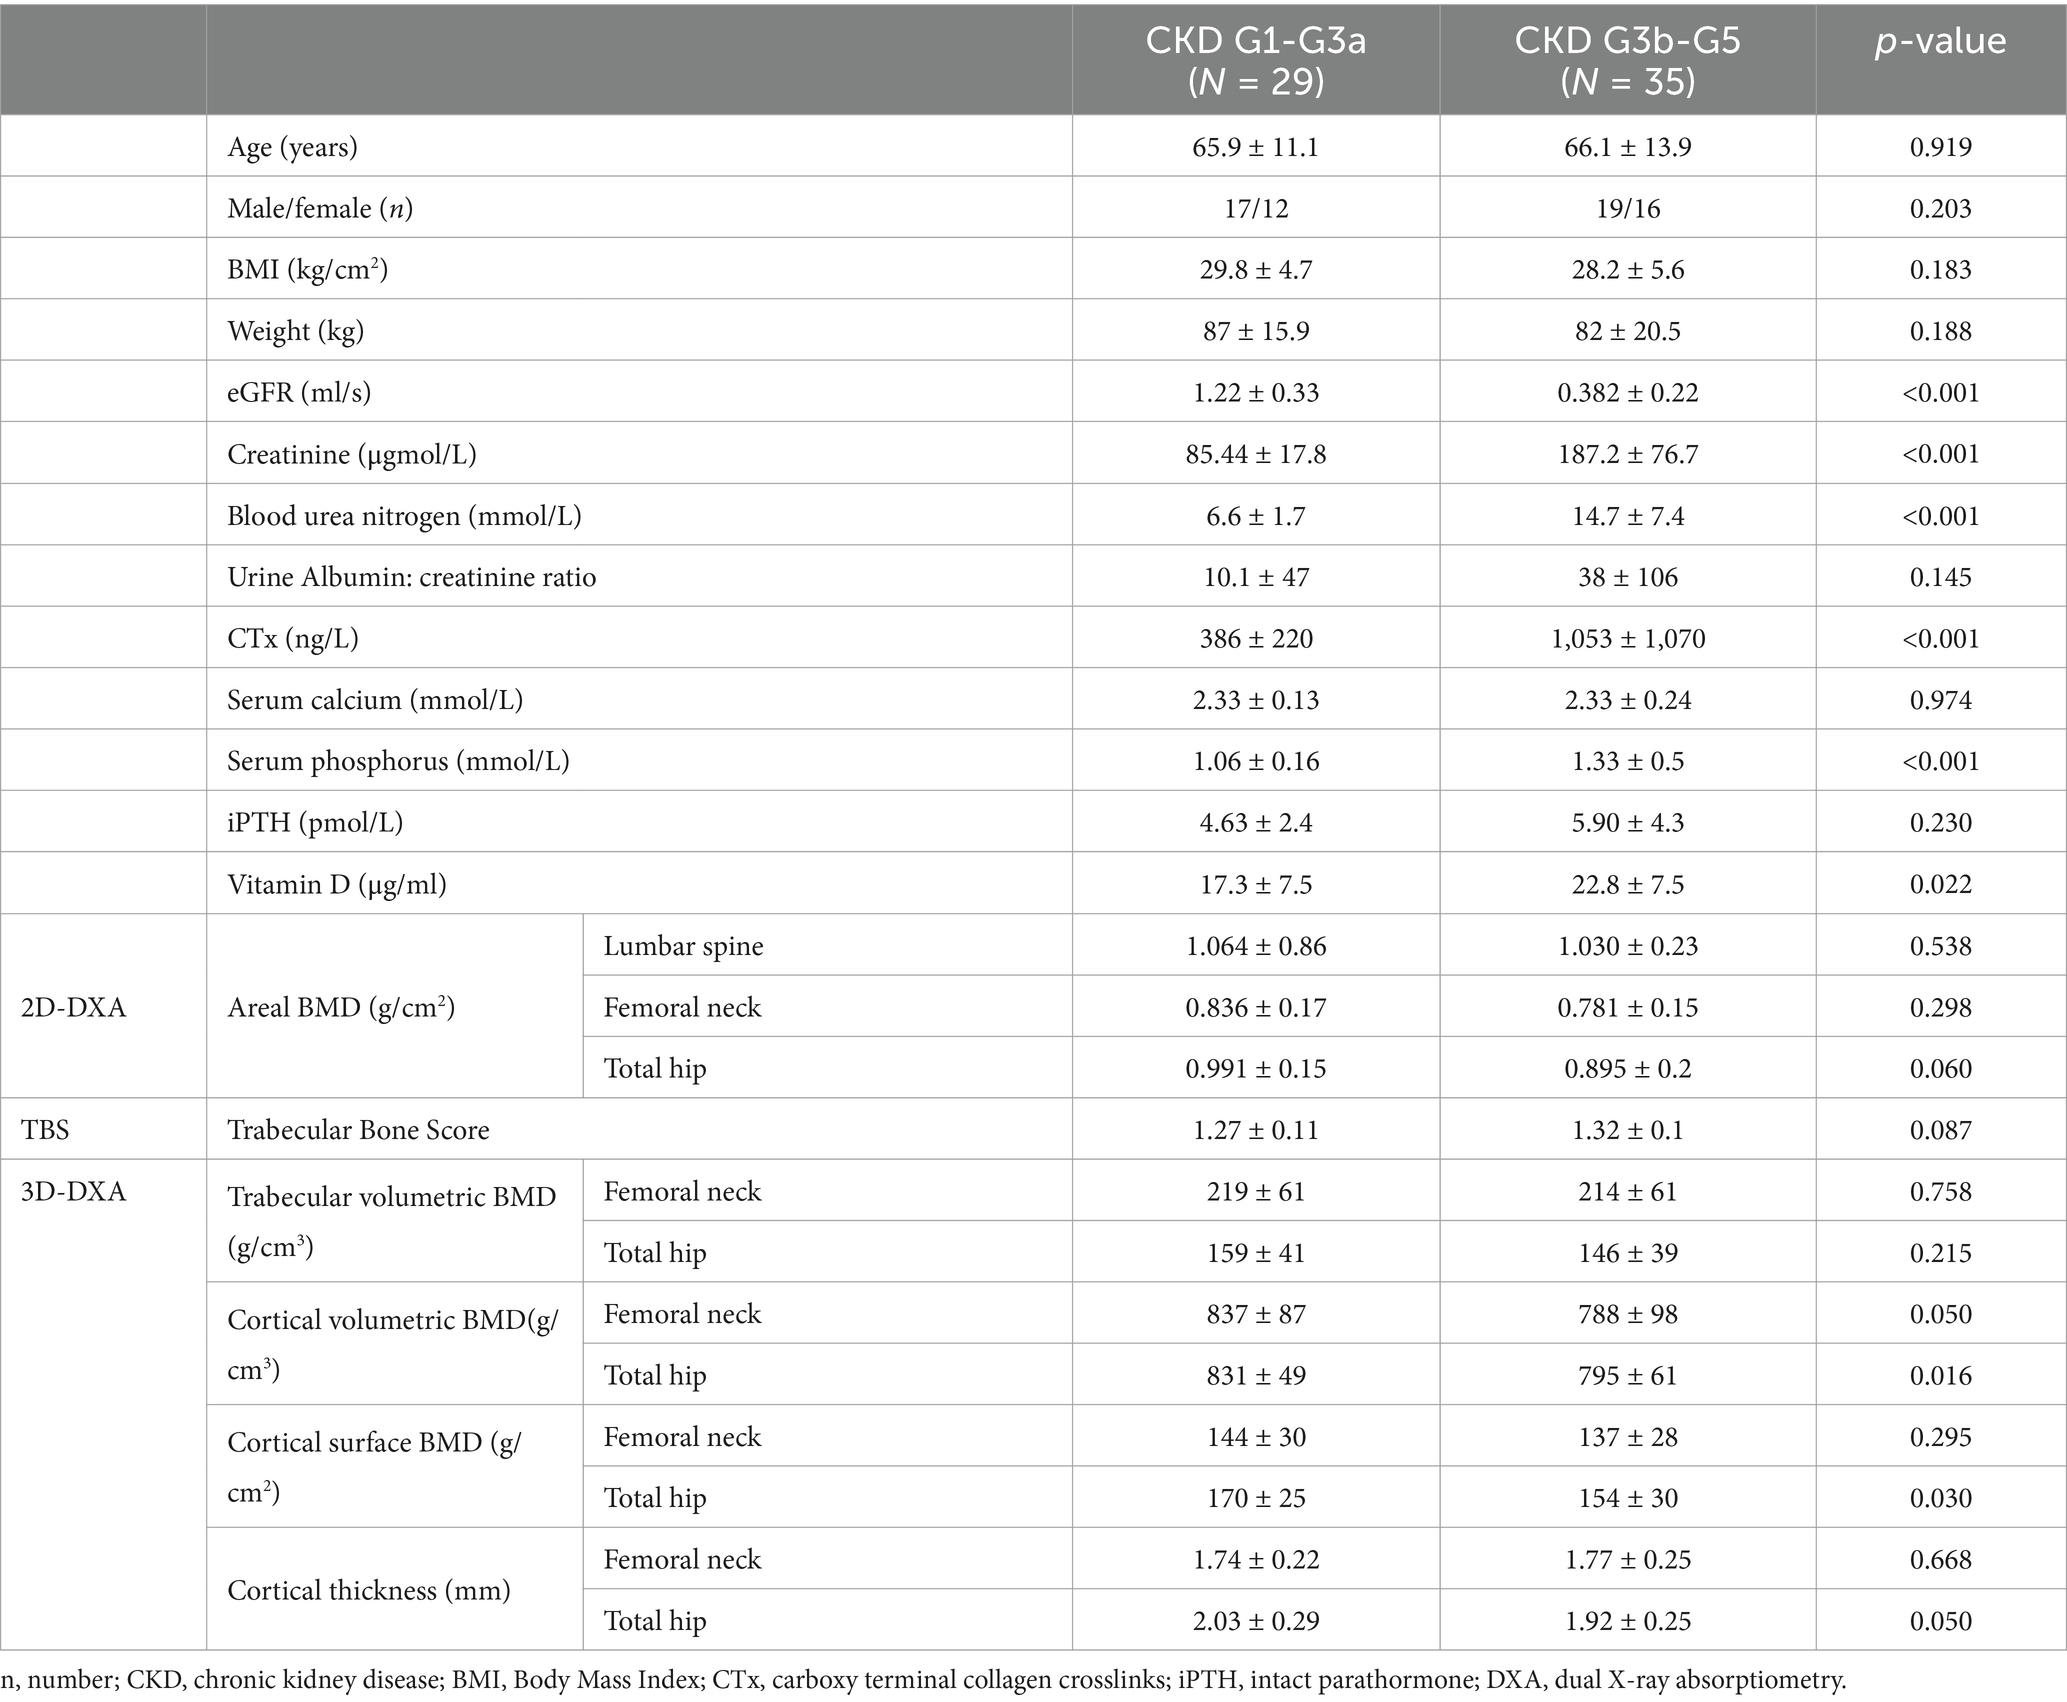
Table 1. Study group characteristics.
Bone measures across the CKD stages
Areal bone mineral density
Cross-sectional comparisons revealed stage-specific differences in the aBMD. At the lumbar spine, the participants in the CKD G3b stage had significantly lower aBMD compared to those in G5. At the femoral neck, the aBMD was higher in the participants in G1 compared to those in G3a. However, no significant differences in the aBMD at the total hip were identified between the stages (Figure 1).
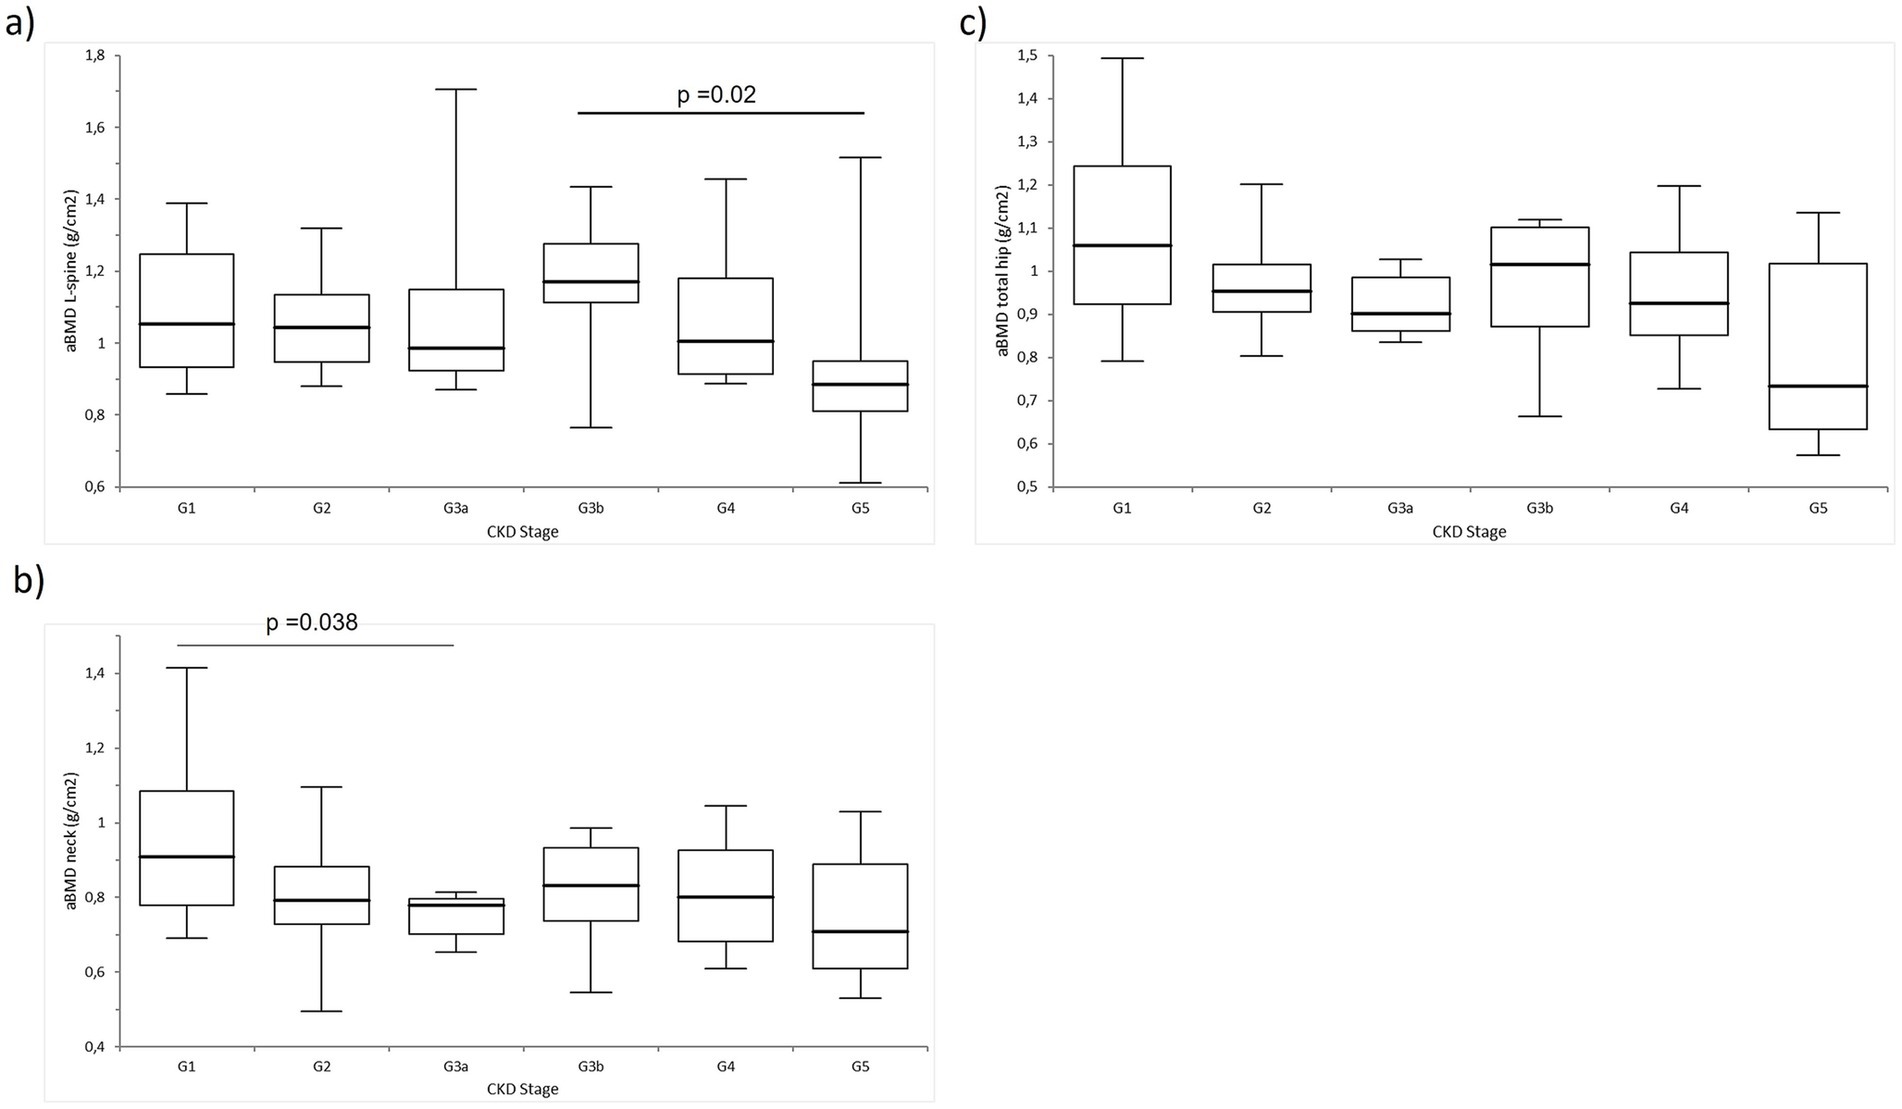
Figure 1. Comparison of the areal bone mineral density (aBMD; g/cm2) across the CKD stages G1-G5: (A) aBMD at the lumbar spine (L-spine), (B) aBMD at the femoral neck (neck), and (C) aBMD at the total hip.
Trabecular compartment
The trabecular volumetric BMD at the femoral neck was significantly higher in the participants in G1 compared to those in G5, G3a, and G2. No significant differences were observed in the trabecular volumetric BMD at the total hip or in the trabecular bone score (TBS) values across the CKD stages (Figure 2).
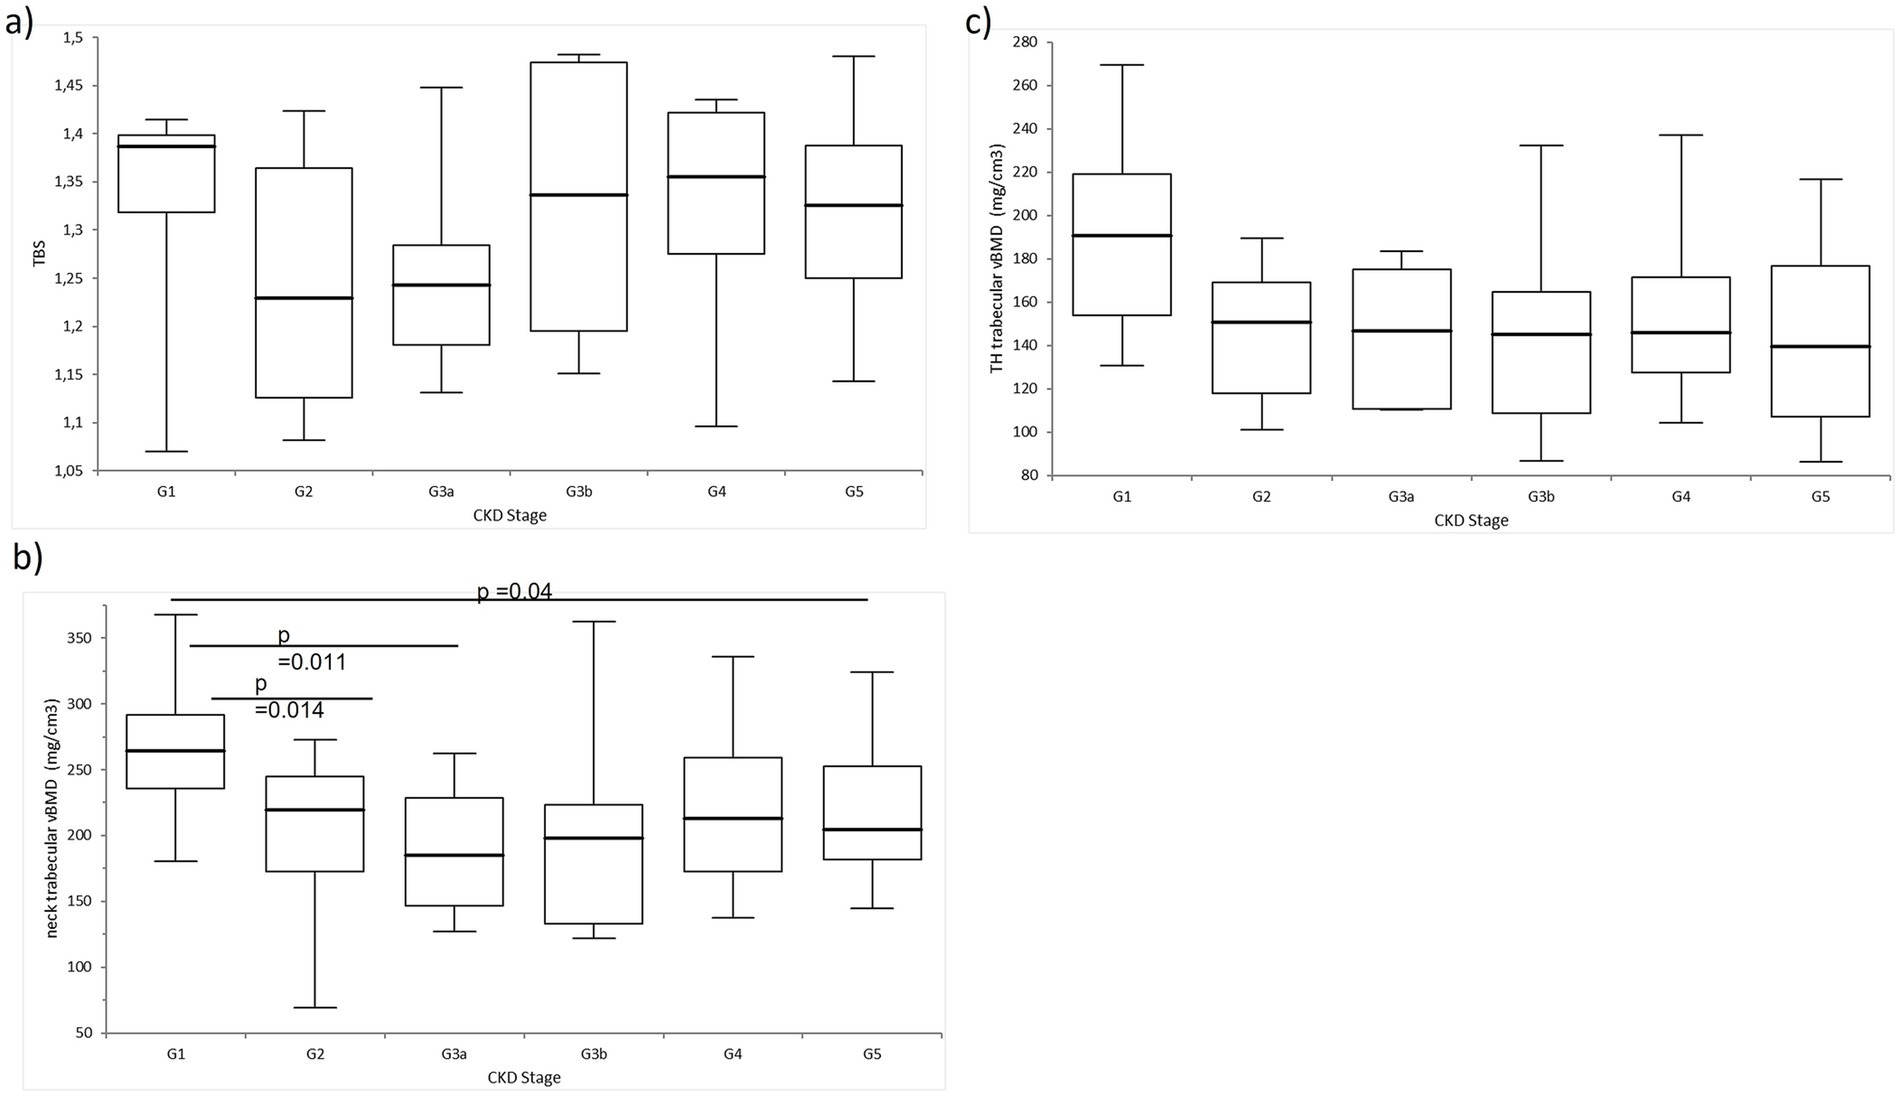
Figure 2. Comparison of the trabecular bone measurements in the study group. There was no difference in the (A) TBS and (C) trabecular volumetric BMD at the total hip. Significant differences were observed in the (B) trabecular volumetric BMD at the femoral neck.
Cortical compartment
The cortical measures demonstrated a declining trend with the advancing CKD stage. The cortical volumetric BMD at the total hip was significantly lower in the participants in the G5 stage compared to those in G3b, G3a, and G1 stages. Similarly, the cortical surface BMD at the total hip was significantly greater in the participants in G1 compared to those in G3b, G4, and G5. The cortical surface BMD at the femoral neck and cortical thickness at the total hip were also higher in the participants in G1 compared to those in G2, G4, and G5. In addition, the femoral neck cortical thickness in the participants in G1 was significantly greater than those in G2 and G3a. No other significant differences were observed (Figure 3).
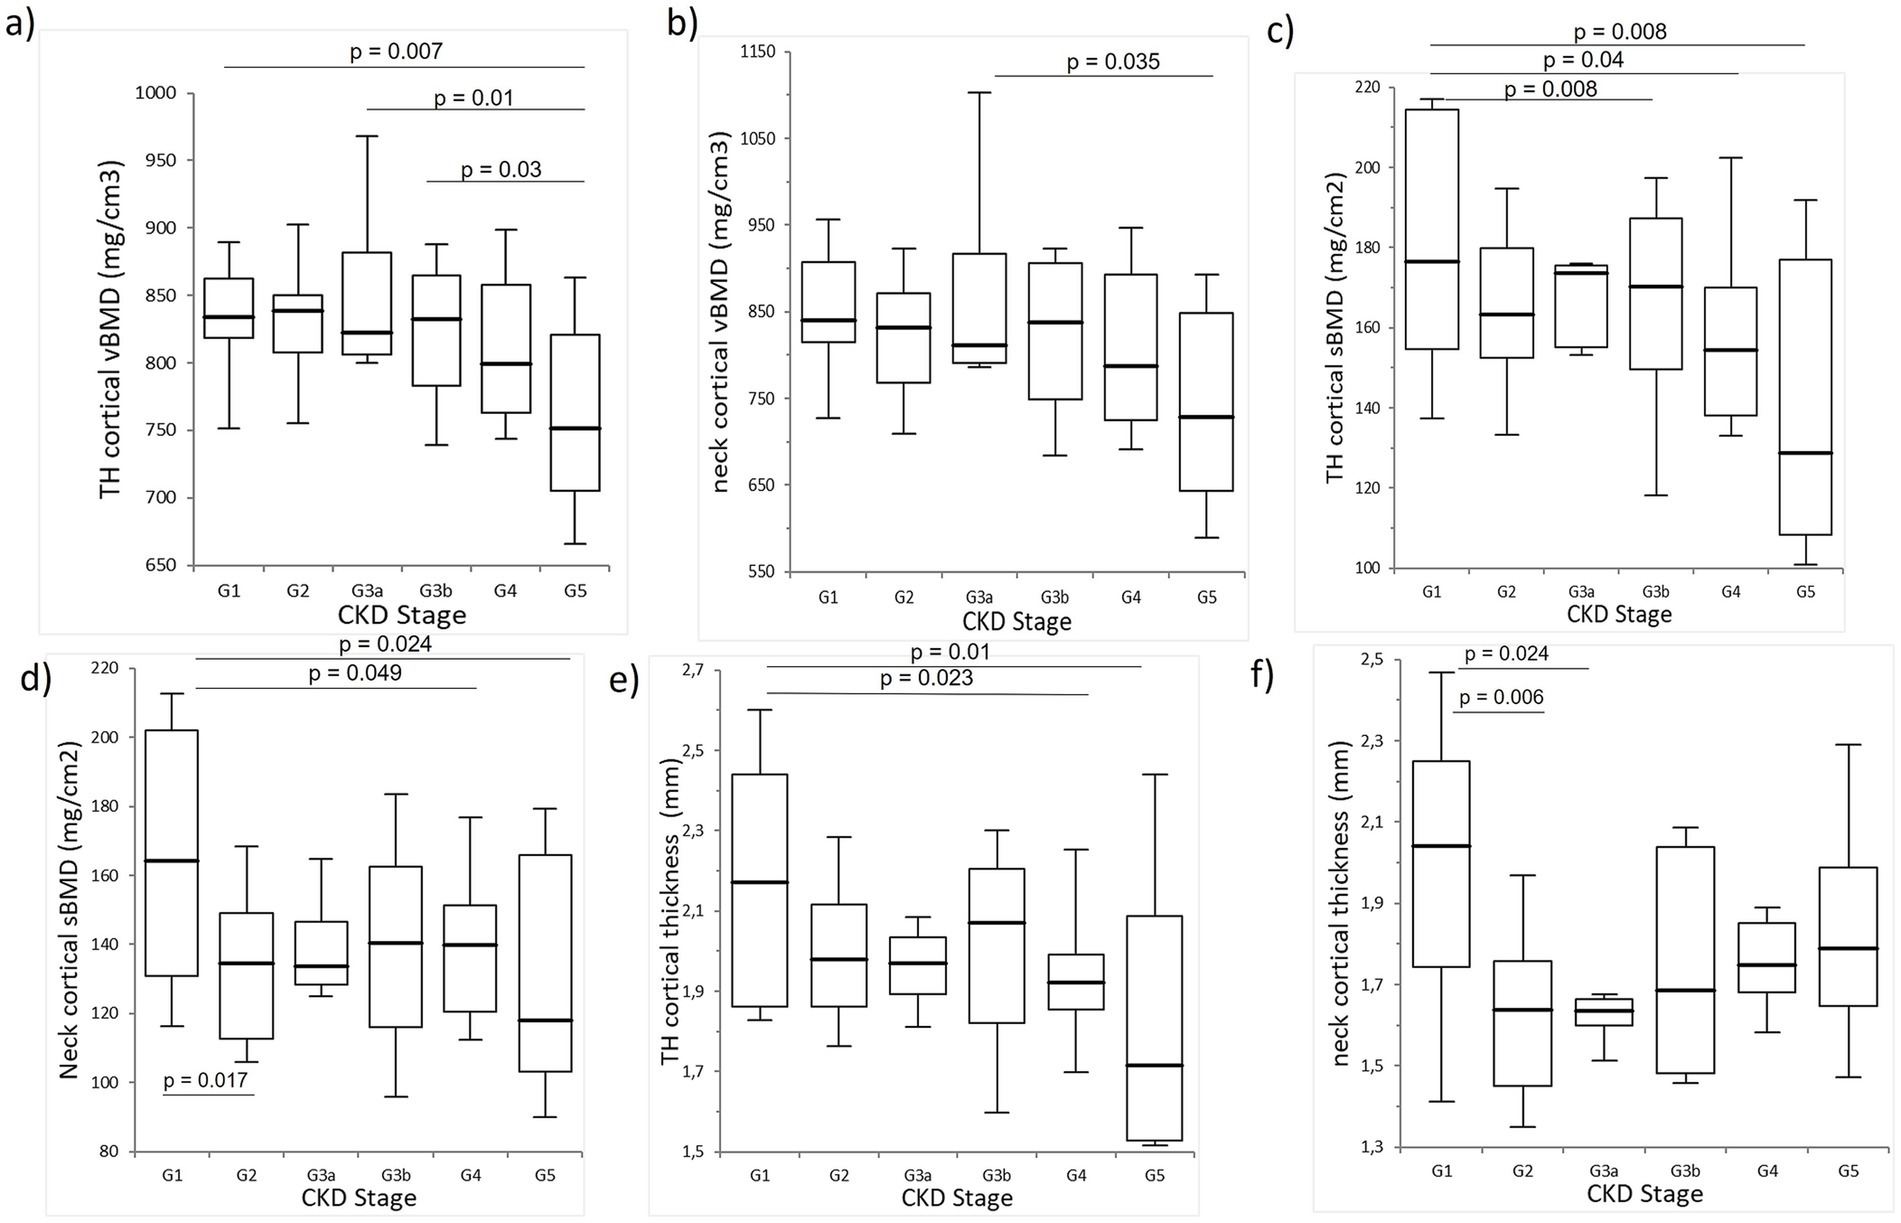
Figure 3. Comparison of the cortical bone measurements. A significant trend was observed with a gradual decrease in the cortical volumetric BMD at (A) the total hip and (B) the neck, (C) cortical surface BMD at the total hip, (D) cortical surface BMD at the femoral neck, and cortical thickness at the (E) total hip and (F) femoral neck.
Correlations between the GFR and bone measures
Across all the participants, the eGFR positively correlated with several bone parameters. Notable associations included the aBMD at the total hip (R = 0.42, p = 0.001), cortical volumetric BMD at the total hip (R = 0.38, p = 0.003) and femoral neck (R = 0.33, p = 0.01), cortical surface BMD at the total hip (R = 0.43, p = 0.0008) and femoral neck (R = 0.31, p = 0.015), and total hip cortical thickness (R = 0.41, p = 0.001). In contrast, no correlations were observed between the eGFR and trabecular volumetric BMD or TBS (Figures 4, 5).
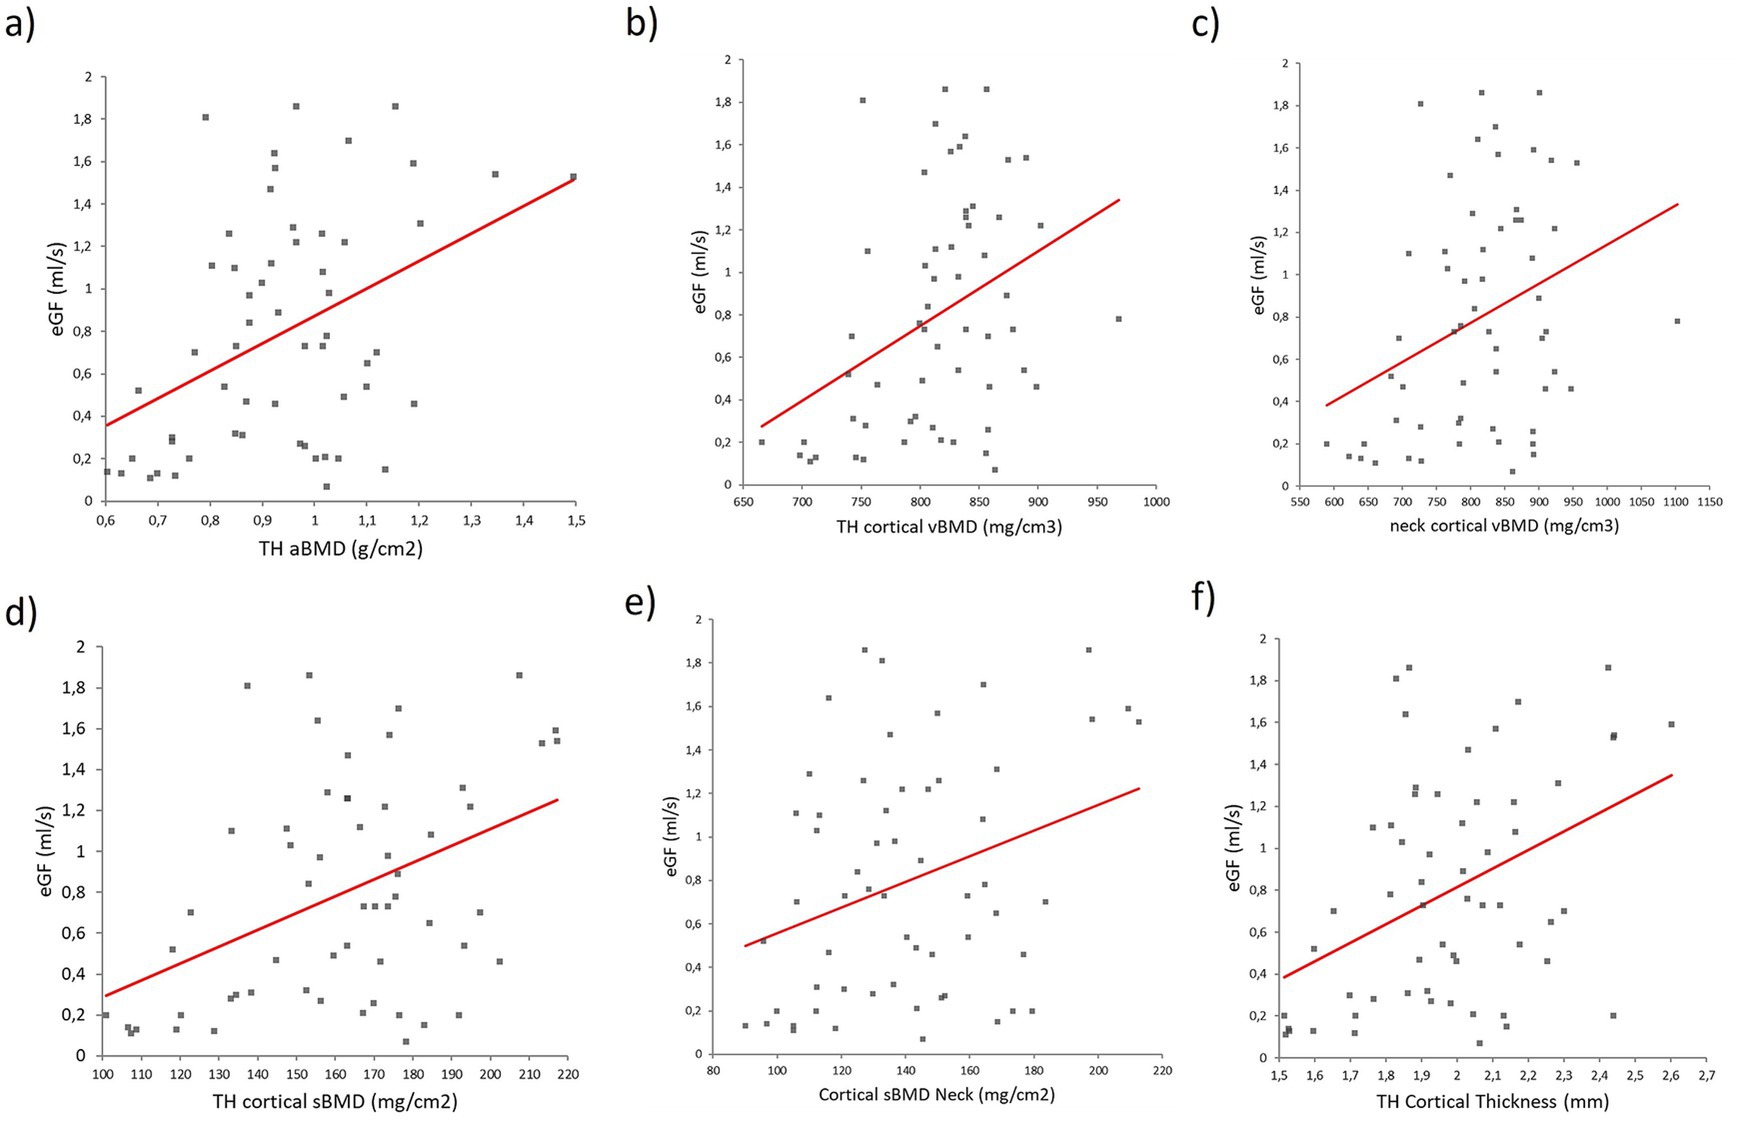
Figure 4. Regression analysis between the eGFR and (a) aBMD at the total hip, (B) cortical volumetric BMD at the total hip, (C) cortical volumetric BMD at the femoral neck, (D) cortical surface BMD at the total hip, (E) cortical sBMD at the femoral neck, and (F) total hip cortical thickness.
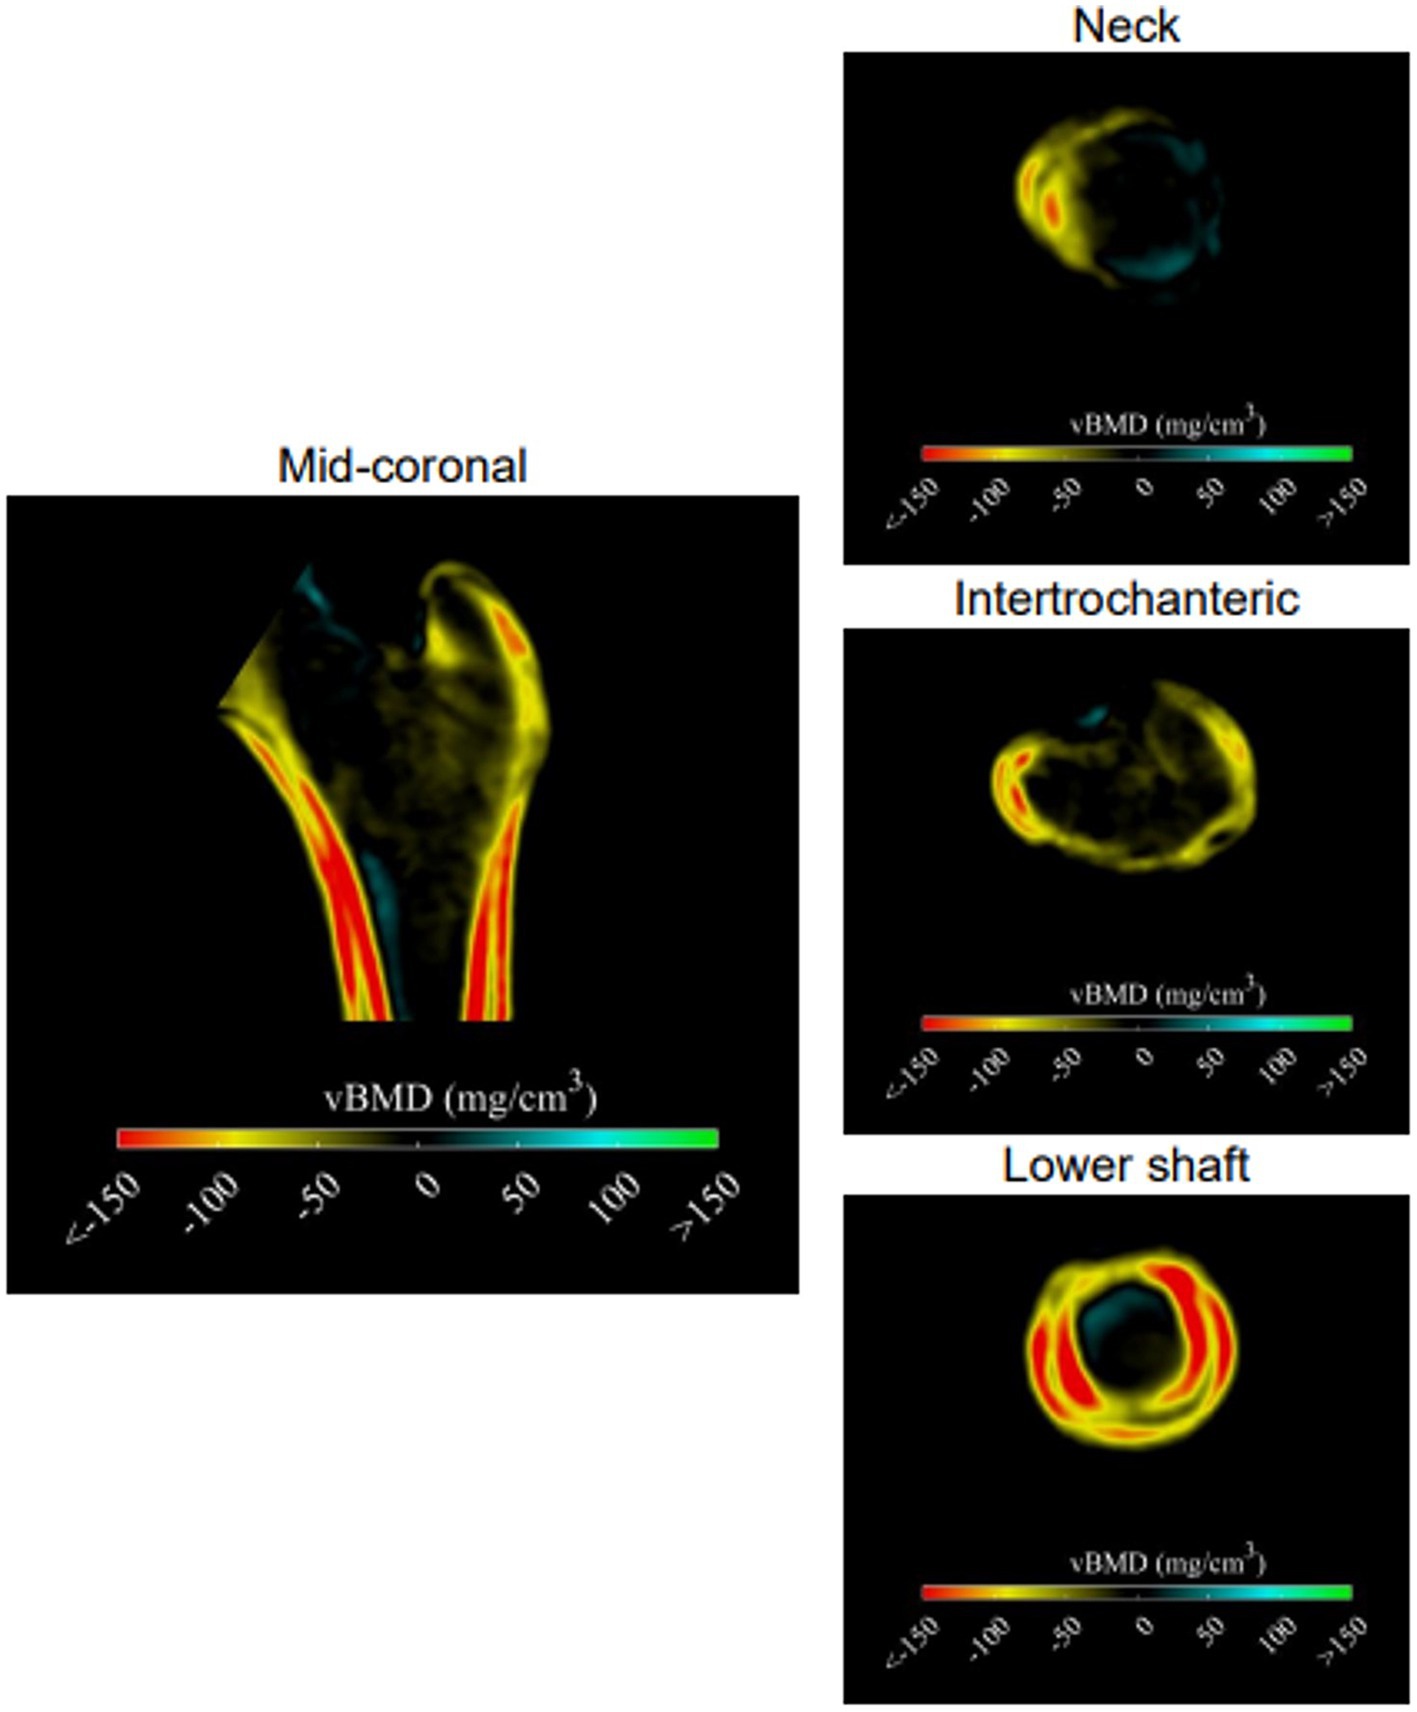
Figure 5. Anatomical distribution of the differences in the bone structure. Differences in the cortical and trabecular vBMD are displayed using cross-sectional images. The higher values in the case group compared to the control are presented in blue and green colors; the lower values in the case group compared to the control are presented in yellow and red colors.
Discussion
Every fragility fracture in patients with CKD leads to decreased quality of life and can even be life-threatening. Therefore, a simple and easy-to-use method for assessing fracture risk in patients with CKD is necessary. The gold standard in the general population is DXA. However, the use of DXA in CKD is ambiguous because it does not provide information about bone tissue quality or the type of renal osteodystrophy. Studies assessing bone quality have shown significant impairment of the cortical compartment, characterized by decreased cortical thickness and increased porosity, in patients with advanced CKD (14–17). In this study, we used DXA-based areal measurements of BMD, TBS, and 3D-DXA measurements to assess the bone structure of the participants with CKD. Lower aBMD, cortical surface BMD, volumetric BMD, and cortical thickness at the total hip were observed in participants in the G3b-G5 CKD stages compared to those in the G1-G3a stages. In addition, markedly decreased cortical parameters, but not trabecular parameters, as measured by 3D-DXA, were observed across all CKD stages. An association between the cortical bone measurements and eGFR was observed.
According to these results, cortical bone measurements by 3D-DXA could potentially be used in clinical practice as an alternative to HR-pQCT or bone biopsy for assessing bone structural changes in CKD patients. Differences in cortical parameters, especially between cortical sBMD and cortical thickness, highlight the potential of the 3D-DXA method to predict femoral neck fractures, which have the highest prevalence in the later stages of CKD (10). In a study comparing bone histomorphometry and micro-CT in patients with CKD G5 and 5D, it was found that cortical porosity and cortical thickness correlated with parathyroid hormone values (33).
In patients with CKD G5 on dialysis, an association between hip aBMD and cortical porosity from bone biopsy was observed (34), possibly due to the high volume of the cortical bone in the proximal hip region. In this study, the TH aBMD was lower in the later (G3b-5) CKD stages and was also associated with the eGFR, thereby supporting the findings of the above-mentioned study. aBMD has limited applicability in characterizing different types of bone disease in CKD-MBD, as all types of bone disease can exhibit a similarly reduced T-score. The interpretation of aBMD may be biased by the presence of extraosseous calcifications, which may overestimate the final values. In addition, DXA measures the density of bone minerals in a specific area and cannot distinguish between the cortical and cancellous bones.
Bone biopsy is an invasive method that requires special equipment and experienced staff, but it is also the most reliable test for diagnosing various forms of renal osteodystrophy (35). Although QCT was observed to correlate with histomorphometrically assessed trabecular bone volume, thickness, number, and separation were observed (36). Micro-CT was found to be less effective in distinguishing between normal bone or renal osteodystrophy (37). Correlations were found between cortical width and cortical thickness, as measured by HR-pQCT and bone biopsy, in participants with hyperparathyroidism or postmenopausal osteoporosis (38). In addition, geometric and volumetric bone measurements, as assessed by QCT, showed a significant correlation with 3D-DXA (20). In a study involving 70 participants with CKD stages 2–4, compared to healthy controls, significant trabecular impairment was observed in both genders, while cortical impairment was observed in men, as assessed by HR-pQCT (39). Pre-dialysis participants with CKD and fractures were reported to have lower aBMD, thinner cortex, and lower trabecular bone volume, as determined by HR-pQCT, compared to non-fractured pre-dialysis CKD participants (40, 41). In our previous study (42), a gradual decrease in the TBS was observed, but only in the G1-G3a stages of CKD. In this study, there was a marked decrease in the cortical vBMD, cortical sBMD, and cortical thickness in the later CKD stages. In addition, a significant correlation between the cortical parameters and eGFR was observed, demonstrating the relationship between the cortical bone and kidney function.
This study has several limitations, including its cross-sectional design, a small number of participants across the CKD stages, and the absence of a control group and fracture data. In addition, the distribution of the sample size among the CKD stages was insufficient. This imbalance might have affected the stability of the statistical results and the generalizability of the conclusions. The cross-sectional design did not allow us to establish causality; it only allowed us to identify associations between the parameters related to bone structure across different CKD stages.
However, we must emphasize that, to the best of our knowledge, this is the first study assessing the use of 3D-DXA modeling across all non-dialysis stages of CKD.
In conclusion, this study shows the use of the DXA-derived method, 3D-DXA, for the indirect assessment of bone microstructure in patients with CKD. Lower aBMD, cortical surface BMD, cortical volumetric BMD, and cortical thickness at the total hip were observed in patients with later CKD stages, compared to those in the earlier stages. Notably, a decreasing trend in the cortical, but not trabecular, parameters, as measured by 3D-DXA, was observed in the advanced CKD stages. In addition, a significant positive correlation between the GFR and cortical parameters was observed, showing an association between the cortical bone and kidney function. It is plausible that 3D-Shaper (former 3D-DXA) could be used in routine practice to better assess the bone quality, thereby contributing to improved fracture risk prediction. However, further longitudinal studies that include fracture assessments are needed.
Data availability statement
The raw data supporting the conclusions of this article will be made available by the authors, without undue reservation.
Ethics statement
The studies involving humans and animals were approved by Ethics Comittee of University Hospital Bratislava. The studies were conducted in accordance with the local legislation and institutional requirements. The participants provided their written informed consent to participate in this study.
Author contributions
MK: Conceptualization, Formal analysis, Methodology, Project administration, Supervision, Writing – original draft, Writing – review & editing. ZKu: Conceptualization, Investigation, Methodology, Project administration, Writing – review & editing. LH: Formal analysis, Software, Writing – review & editing. MP: Methodology, Software, Visualization, Writing – review & editing. RK: Investigation, Methodology, Project administration, Writing – original draft, Writing – review & editing. JF: Data curation, Formal analysis, Writing – original draft. JS: Data curation, Formal analysis, Investigation, Project administration, Writing – review & editing. PJ: Project administration, Supervision, Writing – original draft. ZKi: Project administration, Supervision, Validation, Visualization, Writing – review & editing. JP: Investigation, Supervision, Validation, Writing – review & editing.
Funding
The author(s) declare that financial support was received for the research, authorship, and/or publication of this article. Thanks to the Scientific Grant Agency of the Ministry of Education, Research, Development and Youth of the Slovak Republic and the Slovak Academy of Sciences for awarding the grant (VEGA 1/0378/21).
Conflict of interest
LH and MP were employed by 3D-Shaper Medical.
The remaining authors declare that the research was conducted in the absence of any commercial or financial relationships that could be construed as a potential conflict of interest.
Publisher’s note
All claims expressed in this article are solely those of the authors and do not necessarily represent those of their affiliated organizations, or those of the publisher, the editors and the reviewers. Any product that may be evaluated in this article, or claim that may be made by its manufacturer, is not guaranteed or endorsed by the publisher.
References
1. Nair, SS, Mitani, AA, Goldstein, BA, Chertow, GM, Lowenberg, DW, and Winkelmayer, WC. Temporal trends in the incidence, treatment, and outcomes of hip fracture in older patients initiating dialysis in the United States. Clin J Am Soc Nephrol. (2013) 8:1336–42. doi: 10.2215/CJN.10901012
2. Nickolas, TL, McMahon, DJ, and Shane, E. Relationship between moderate to severe kidney disease and hip fracture in the United States. J Am Soc Nephrol. (2006) 17:3223–32. doi: 10.1681/ASN.2005111194
3. Dooley, AC, Weiss, NS, and Kestenbaum, B. Increased risk of hip fracture among men with CKD. Am J Kidney Dis. (2008) 51:38–44. doi: 10.1053/j.ajkd.2007.08.019
4. Elliott, MJ, James, MT, Quinn, RR, Ravani, P, Tonelli, M, Palacios-Derflingher, L, et al. Estimated GFR and fracture risk: a population-based study. Clin J Am Soc Nephrol. (2013) 8:1367–76. doi: 10.2215/CJN.09130912
5. Kinsella, S, Chavrimootoo, S, Molloy, MG, and Eustace, JA. Moderate chronic kidney disease in women is associated with fracture occurrence independently of osteoporosis. Nephron Clin Pract. (2010) 116:c256–62. doi: 10.1159/000317207
6. Yenchek, RH, Ix, JH, Shlipak, MG, Bauer, DC, Rianon, NJ, Kritchevsky, SB, et al. Bone mineral density and fracture risk in older individuals with CKD. Clin J Am Soc Nephrol. (2012) 7:1130–6. doi: 10.2215/CJN.12871211
7. Iimori, S, Mori, Y, Akita, W, Kuyama, T, Takada, S, Asai, T, et al. Diagnostic usefulness of bone mineral density and biochemical markers of bone turnover in predicting fracture in CKD stage 5D patients--a single-center cohort study. Nephrol Dial Transplant. (2012) 27:345–51. doi: 10.1093/ndt/gfr317
8. Akaberi, S, Simonsen, O, Lindergård, B, and Nyberg, G. Can DXA predict fractures in renal transplant patients? Am J Transplant Off J Am Soc Transplant Am Soc Transplant Surg. (2008) 8:2647–51. doi: 10.1111/j.1600-6143.2008.02423.x
9. McNerny, EMB, and Nickolas, TL. Bone quality in chronic kidney disease: definitions and diagnostics. Curr Osteoporos Rep. (2017) 15:207–13. doi: 10.1007/s11914-017-0366-z
10. Pimentel, A, Urena-Torres, P, Zillikens, MC, Bover, J, and Cohen-Solal, M. Fractures in patients with CKD-diagnosis, treatment, and prevention: a review by members of the European calcified tissue society and the European renal Association of Nephrology Dialysis and Transplantation. Kidney Int. (2017) 92:1343–55. doi: 10.1016/j.kint.2017.07.021
11. Yavropoulou, MP, Vaios, V, Pikilidou, M, Chryssogonidis, I, Sachinidou, M, Tournis, S, et al. Bone quality assessment as measured by trabecular bone score in patients with end-stage renal disease on Dialysis. J Clin Densit. (2017) 20:490–7. doi: 10.1016/j.jocd.2016.11.002
12. Yoon, HE, Kim, Y, Shin, SJ, Hong, YS, and Kang, KY. Factors associated with low trabecular bone scores in patients with end-stage kidney disease. J Bone Miner Metab. (2019) 37:475–83. doi: 10.1007/s00774-018-0938-8
13. Aleksova, J, Kurniawan, S, and Elder, GJ. The trabecular bone score is associated with bone mineral density, markers of bone turnover and prevalent fracture in patients with end stage kidney disease. Osteoporos Int. (2018) 29:1447–55. doi: 10.1007/s00198-018-4468-y
14. Nickolas, TL, Stein, EM, Dworakowski, E, Nishiyama, KK, Komandah-Kosseh, M, Zhang, CA, et al. Rapid cortical bone loss in patients with chronic kidney disease. J Bone Miner Res. (2013) 28:1811–20. doi: 10.1002/jbmr.1916
15. Seeman, E. Overview of bone microstructure, and treatment of bone fragility in chronic kidney disease. Nephrology. (2017) 22:34–5. doi: 10.1111/nep.13024
16. Jamal, SA, Gilbert, J, Gordon, C, and Bauer, DC. Cortical pQCT measures are associated with fractures in dialysis patients. J Bone Miner Res. (2006) 21:543–8. doi: 10.1359/jbmr.060105
17. Denburg, MR, Tsampalieros, AK, de Boer, IH, Shults, J, Kalkwarf, HJ, Zemel, BS, et al. Mineral metabolism and cortical volumetric bone mineral density in childhood chronic kidney disease. J Clin Endocrinol Metab. (2013) 98:1930–8. doi: 10.1210/jc.2012-4188
18. Humbert, L, Martelli, Y, Fonollà, R, Steghöfer, M, Gregorio, SD, Malouf, J, et al. 3D-DXA: assessing the femoral shape, the trabecular macrostructure and the cortex in 3D from DXA images. IEEE Trans Med Imaging. (2017) 36:27–39. doi: 10.1109/TMI.2016.2593346
19. Qasim, M, López Picazo, M, Ruiz Wills, C, Noailly, J, Di Gregorio, S, Del Río Barquero, LM, et al. 3D-DXA based finite element modelling for femur strength prediction: evaluation against QCT. J Clin Densit. (2024) 27:101471. doi: 10.1016/j.jocd.2024.101471
20. Clotet, J, Martelli, Y, Di Gregorio, S, Del Río Barquero, LM, and Humbert, L. Structural parameters of the proximal femur by 3-dimensional dual-energy X-ray absorptiometry software: comparison with quantitative computed tomography. J Clin Densit. (2018) 21:550–62. doi: 10.1016/j.jocd.2017.05.002
21. Kužma, M, Vaňuga, P, Ságová, I, Pávai, D, Jackuliak, P, Killinger, Z, et al. Vertebral fractures occur despite control of acromegaly and are predicted by cortical volumetric bone mineral density. J Clin Endocrinol Metab. (2021) 106:e5088–96. doi: 10.1210/clinem/dgab259
22. Brance, ML, Pons-Estel, BA, Quagliato, NJ, Jorfen, M, Berbotto, G, Cortese, N, et al. Trabecular and cortical bone involvement in rheumatoid arthritis by DXA and DXA-based 3D modelling. Osteoporos Int. (2021) 32:705–14. doi: 10.1007/s00198-020-05641-4
23. Costa, R, de Asúa, DR, Gullón, A, De Miguel, R, Bautista, A, García, C, et al. Volumetric BMD by 3D-DXA and trabecular bone score in adults with down syndrome. J Clin Densit. (2021) 24:630–7. doi: 10.1016/j.jocd.2021.01.010
24. Toussirot, E, Winzenrieth, R, Aubin, F, Wendling, D, Vauchy, C, and Desmarets, M. Areal bone mineral density, trabecular bone score and 3D-DXA analysis of proximal femur in psoriatic disease. Front Med. (2024) 11:1341077. doi: 10.3389/fmed.2024.1341077
25. Gracia-Marco, L, García-Fontana, B, Ubago-Guisado, E, Vlachopoulos, D, García-Martín, A, and Muñoz-Torres, M. Analysis of bone impairment by 3D DXA hip measures in patients with primary hyperparathyroidism: a pilot study. J Clin Endocrinol Metab. (2020) 105:175–84. doi: 10.1210/clinem/dgz060
26. Arboiro-Pinel, R, Mahíllo-Fernández, I, and Díaz-Curiel, M. Bone analysis using trabecular bone score and dual-energy X-ray absorptiometry-based 3-dimensional modeling in postmenopausal women with primary hyperparathyroidism. Endocr Pract. (2022) 28:83–9. doi: 10.1016/j.eprac.2021.08.006
27. Lewiecki, EM, Betah, D, Humbert, L, Libanati, C, Oates, M, Shi, Y, et al. 3D-modeling from hip DXA shows improved bone structure with romosozumab followed by denosumab or alendronate. J Bone Miner Res. (2024) 39:473–83. doi: 10.1093/jbmr/zjae028
28. Iseri, K, Mizobuchi, M, Winzenrieth, R, Humbert, L, Saitou, T, Kato, T, et al. Long-term effect of Denosumab on bone disease in patients with CKD. Clin J Am Soc Nephrol. (2023) 18:1195–203. doi: 10.2215/CJN.0000000000000213
29. Humbert, L, Hazrati Marangalou, J, Del Rio Barquero, LM, van Lenthe, GH, and van Rietbergen, B. Technical note: cortical thickness and density estimation from clinical CT using a prior thickness-density relationship. Med Phys. (2016) 43:1945–54. doi: 10.1118/1.4944501
30. Treece, GM, and Gee, AH. Independent measurement of femoral cortical thickness and cortical bone density using clinical CT. Med Image Anal. (2015) 20:249–64. doi: 10.1016/j.media.2014.11.012
31. Poole, KE, Treece, GM, Gee, AH, Brown, JP, McClung, MR, Wang, A, et al. Denosumab rapidly increases cortical bone in key locations of the femur: a 3D bone mapping study in women with osteoporosis. J Bone Miner Res. (2015) 30:46–54. doi: 10.1002/jbmr.2325
32. Nicks, KM, Amin, S, Melton, LJ 3rd, Atkinson, EJ, McCready, LK, Riggs, BL, et al. Three-dimensional structural analysis of the proximal femur in an age-stratified sample of women. Bone. (2013) 55:179–88. doi: 10.1016/j.bone.2013.02.009
33. Sharma Ashish, K, Toussaint Nigel, D, Masterson, R, Holt Stephen, G, Rajapakse Chamith, S, Ebeling Peter, R, et al. Deterioration of cortical bone microarchitecture: critical component of renal osteodystrophy evaluation. Am J Nephrol. (2018) 47:376–84. doi: 10.1159/000489671
34. Adragao, T, Herberth, J, Monier-Faugere, MC, Branscum, AJ, Ferreira, A, Frazao, JM, et al. Low bone volume--a risk factor for coronary calcifications in hemodialysis patients. Clin J Am Soc Nephrol. (2009) 4:450–5. doi: 10.2215/CJN.01870408
35. Malluche, HH, Mawad, HW, and Monier-Faugere, MC. Renal osteodystrophy in the first decade of the new millennium: analysis of 630 bone biopsies in black and white patients. J Bone Miner Res. (2011) 26:1368–76. doi: 10.1002/jbmr.309
36. Carvalho, AB, Carneiro, R, Leme, GM, Rochitte, CE, Santos, RD, Miname, MH, et al. Vertebral bone density by quantitative computed tomography mirrors bone structure histomorphometric parameters in hemodialysis patients. J Bone Miner Metab. (2013) 31:551–5. doi: 10.1007/s00774-013-0442-0
37. Tamminen, IS, Isaksson, H, Aula, AS, Honkanen, E, Jurvelin, JS, and Kröger, H. Reproducibility and agreement of micro-CT and histomorphometry in human trabecular bone with different metabolic status. J Bone Miner Metab. (2011) 29:442–8. doi: 10.1007/s00774-010-0236-6
38. Cohen, A, Dempster, DW, Müller, R, Guo, XE, Nickolas, TL, Liu, XS, et al. Assessment of trabecular and cortical architecture and mechanical competence of bone by high-resolution peripheral computed tomography: comparison with transiliac bone biopsy. Osteoporos Int. (2010) 21:263–73. doi: 10.1007/s00198-009-0945-7
39. Bacchetta, J, Boutroy, S, Vilayphiou, N, Juillard, L, Guebre-Egziabher, F, Rognant, N, et al. Early impairment of trabecular microarchitecture assessed with HR-pQCT in patients with stage II-IV chronic kidney disease. J Bone Miner Res. (2010) 25:849–57. doi: 10.1359/jbmr.090831
40. Nickolas, TL, Stein, E, Cohen, A, Thomas, V, Staron, RB, McMahon, DJ, et al. Bone mass and microarchitecture in CKD patients with fracture. J Am Soc Nephrol. (2010) 21:1371–80. doi: 10.1681/ASN.2009121208
41. Nickolas, TL, Cremers, S, Zhang, A, Thomas, V, Stein, E, Cohen, A, et al. Discriminants of prevalent fractures in chronic kidney disease. J Am Soc Nephrol. (2011) 22:1560–72. doi: 10.1681/ASN.2010121275
42. Kužmová, Z, Kužma, M, Gažová, A, Kovářová, M, Jackuliak, P, Killinger, Z, et al. Fibroblast growth factor 23 and klotho are associated with trabecular bone score but not bone mineral density in the early stages of chronic kidney disease: results of the cross-sectional study. Physiol Res. (2021) 70:S43–s51. doi: 10.33549/physiolres.934773
Keywords: chronic kidney disease, bone quality, 3D-densitometry, cortical bone, bone mineral density
Citation: Kužma M, Kužmová Z, Humbert L, Picazo ML, Králik R, Falat J, Smaha J, Jackuliak P, Killinger Z and Payer J (2025) Use of 3D-DXA in the assessment of bone structure among patients with chronic kidney disease. Front. Med. 12:1471418. doi: 10.3389/fmed.2025.1471418
Edited by:
Yi-Chou Hou, Cardinal Tien Hospital, TaiwanReviewed by:
Ko-Lin Kuo, Taipei Tzu Chi Hospital, TaiwanWan Ji-Xiang, Affiliated Hospital of North Sichuan Medical College, China
Copyright © 2025 Kužma, Kužmová, Humbert, Picazo, Králik, Falat, Smaha, Jackuliak, Killinger and Payer. This is an open-access article distributed under the terms of the Creative Commons Attribution License (CC BY). The use, distribution or reproduction in other forums is permitted, provided the original author(s) and the copyright owner(s) are credited and that the original publication in this journal is cited, in accordance with accepted academic practice. No use, distribution or reproduction is permitted which does not comply with these terms.
*Correspondence: Martin Kužma, a3V6bWE0QHVuaWJhLnNr