 Hongyan Zhao1,2†
 Bo Ban
 Guanqi Gao
95% of researchers rate our articles as excellent or good
Learn more about the work of our research integrity team to safeguard the quality of each article we publish.
Find out more
ORIGINAL RESEARCH article
Front. Med. , 22 January 2025
Sec. Hepatobiliary Diseases
Volume 12 - 2025 | https://doi.org/10.3389/fmed.2025.1454938
This article is part of the Research Topic Is Insulin Resistance the Eminence Grise of Aging and Non-Communicable Chronic Diseases? View all 4 articles
Aims: Non-alcoholic fatty liver disease (NAFLD) is closely related to type 2 diabetes (T2D), with reduced insulin sensitivity being a key factor in their disrupted metabolic processes. The single point insulin sensitivity estimator (SPISE) is a novel index. This study aims to explore the association between SPISE and NAFLD in T2D population.
Methods: This study included a total of 2,459 patients with T2D. SPISE was calculated based on high density lipoprotein-cholesterol (HDL-c), triglycerides (TG), and body mass index (BMI). Participants were categorized into NAFLD and non-NAFLD groups based on the results of ultrasonographic diagnosis. The relationship between SPISE and NAFLD was analyzed separately for each gender.
Results: The overall prevalence of NAFLD is 38.5%. In females and males, the SPISE was significantly reduced in the NAFLD group compared to the non-NAFLD group (both P < 0.05). The prevalence of NAFLD showed a significant reduction across quartiles of the SPISE in both genders (both P < 0.05).
Additionally, univariate correlation analysis showed a negative correlation between SPISE and NAFLD (both P < 0.05). In multivariate regression analysis, a reduced SPISE was identified as an independent risk factor for NAFLD (odds ratios of 0.572 and 0.737, 95% CI of 0.477–0.687 and 0.587–0.926, respectively).
Moreover, the area under the receiver operating characteristic (ROC) curve for SPISE was 0.209 in females and 0.268 in males (95% CI of 0.175–0.244 and 0.216–0.320, respectively). These results are more meaningful than those of other variables.
Conclusion: SPISE is significantly reduced in NAFLD patients with T2D. Compared to other indicators, SPISE demonstrates superior predictive value in diagnosing NAFLD, and it is independent of gender.
Non-alcoholic fatty liver disease (NAFLD) is a widespread health issue, with a worldwide prevalence of 25% (1). It has become the primary cause of chronic liver disease under the influence of type 2 diabetes (T2D) and obesity (2). Reports indicate that NAFLD has become the fastest-growing cause of liver-related deaths globally (3). Moreover, it is closely associated with the progression of chronic kidney disease (CKD) and cardiovascular disease (CVD) (4, 5). Many metabolic disorders not only affect the incidence of NAFLD but also increase the risk of its progression to non-alcoholic steatohepatitis (NASH), cirrhosis, hepatocellular carcinoma, and even death (6). And the link between T2D and NAFLD is thoroughly documented (7). Research indicates that T2D is associated with more than double the risk of advanced hepatopathy (8). Furthermore, a meta-analysis reported that the prevalence of NASH with T2D patients was approximately 37.3%, significantly higher than the prevalence of progressive NAFLD in the general population (9). Therefore, in clinical practice, it would be valuable to have a simple and inexpensive index that could screen for NAFLD among T2D patients.
Numerous studies indicate that reduced insulin sensitivity (Si) or insulin resistance (IR) is one of the key pathophysiological factors in NAFLD (10–12). The gold standard for measuring insulin sensitivity is the hyperinsulinemic-euglycemic clamp (13); however, due to its cost, time consumption, and invasiveness, it is not widely used in clinical practice. The single point insulin sensitivity estimator (SPISE) is an alternative index of IR calculated from high density lipoprotein-cholesterol (HDL-c), triglycerides (TG), and body mass index (BMI) (14). Research indicates a strong correlation between SPISE and the hyperinsulinemic-euglycemic clamp (15). Additionally, the SPISE index is closely related to metabolic syndrome (MetS), cardiovascular metabolic risk in adolescents, and the cardiovascular prognosis of patients with T2D (16–18). It is also worth mentioning that SPISE is not only considered an effective indicator for predicting diabetes development in obese children (19), but SPISE-5.4 has also been proven to be a good predictor of diabetes development (20). Recent studies have reported a significant reduction in the SPISE among adolescents with obesity-related NAFLD (21). Additionally, research from Japan indicates that a reduction in SPISE is associated with an increased risk of NAFLD (22). Research also suggested an association between SPISE and pediatric NAFLD; however, after adjusting for confounding factors, this association is no longer significant (23). Currently, there is scarce research on the relationship between SPISE and NAFLD among T2D patients. This study aims to clarify the link between SPISE and NAFLD in T2D patients and assess SPISE’s predictive potential for NAFLD in this population.
During the period from February 2020 to March 2023, we collected clinical data from patients with T2D who were treated at the Department of Endocrinology of the Linyi People’s Hospital, Shandong Province, China. Exclusion criteria included: (1) patients under the age of 18; (2) patients with liver or kidney dysfunction; (3) evidence of autoimmune hepatitis, viral hepatitis, drug-induced fatty liver, or other chronic liver diseases; (4) habitual drinkers who consume alcohol more than 5 days per week, equivalent to an average daily intake of 38 grams for males and 26 grams for females (24); (5) patients with incomplete clinical data. Ultimately, 2,459 eligible patients were included in the study.
Participant demographic information and clinical baseline data were collected, such as age, gender, duration of diabetes, and smoking and drinking habits. Height, weight, systolic blood pressure (SBP), and diastolic blood pressure (DBP) were measured and recorded. Morning fasting venous blood samples were collected to determine levels of alanine aminotransferase (ALT), aspartate aminotransferase (AST), gamma-glutamyl transferase (GGT), total cholesterol (TC), triglycerides (TG), high-density lipoprotein cholesterol (HDL-c), low-density lipoprotein cholesterol (LDL-c), serum creatinine (Scr), uric acid (UA), fasting plasma glucose (FBG); glycated hemoglobin (HbA1c, high performance liquid chromatography) and hemoglobin (Hb), were measured using a biochemical analyzer (Cobas c 702, Roche, Germany). Urinary albumin to creatinine ratio (UACR) was tested by an autoanalyzer (Beckman Coulter AU5821). Fasting insulin (FINS, direct chemiluminescence method) was measured by the fully automated sample processing system (Aptio Automation, SIEMENS, USA).
Bioelectrical impedance analysis (Omron DUALSCAN HDS-2000, Kyoto, Japan) was employed to assess visceral fat area (VFA) and subcutaneous fat area (SFA).
Fatty liver diagnosis begins with ultrasound imaging and is supplemented by clinical evaluation, including medical history and physical examination, with specific attention to alcohol intake. Additional factors such as viral hepatitis and medication use are assessed. Laboratory tests, particularly liver function tests, help rule out other fatty liver conditions, culminating in a definitive diagnosis of NAFLD.
Parameter calculations
1. Body mass index (BMI) = weight (kg) / height (m)2
2. TG/HDL-c = TG (mmol/l) / HDL-c (mmol/l)
3. SPISE index = (600 × HDL-c [mg/dL]0.185) / (TG [mg/dL]0.2 × BMI [kg/m2]1.338) (14)
4. HOMA-IR = FPG (mmol/L) × FINS (IU/mL)/22.5 (25).
Statistical analyses were performed using SPSS 22.0 (SPSS Inc, Chicago, IL, USA). Normally distributed variables were described using mean ± SD and analyzed with independent samples T-tests. Non-normally distributed variables were described using medians (interquartile ranges) and analyzed with Mann-Whitney U tests. Analysis of variance (ANOVA) and Student–Newman–Keuls tests were performed for multiple and pairwise comparisons of normally distributed data, and Kruskal-Wallis 1-way ANOVA test for abnormal distributions. Categorical variables were presented as percentage (%) and assessed using chi-square tests. Independent factors influencing NAFLD were identified using Spearman’s correlation and logistic regression analyses. Significance was set at P < 0.05 (two-tailed). The SPISE index’s ability to predict NAFLD was evaluated via the receiver operating characteristic (ROC) curve analysis.
As shown in Table 1, this study included 2459 patients with T2D, with a mean age of 57.10 ± 13.4 years. The overall incidence of NAFLD was 38.5%, with rates of 36.1% in females and 41.8% in males. Compared to males, females had higher levels of age, SBP, TC, LDL-c, HDL-c and SPISE, but lower proportion of smokers, BMI, VFA, SFA, DBP, TG/HDL-c ratio, ALT, AST, GGT, UA, Scr, and Hb (all P < 0.05). There were no significant differences in diabetes duration, TG, HbA1c, FPG, UACR, HOMA-IR and FINS between the two groups (all P > 0.05).
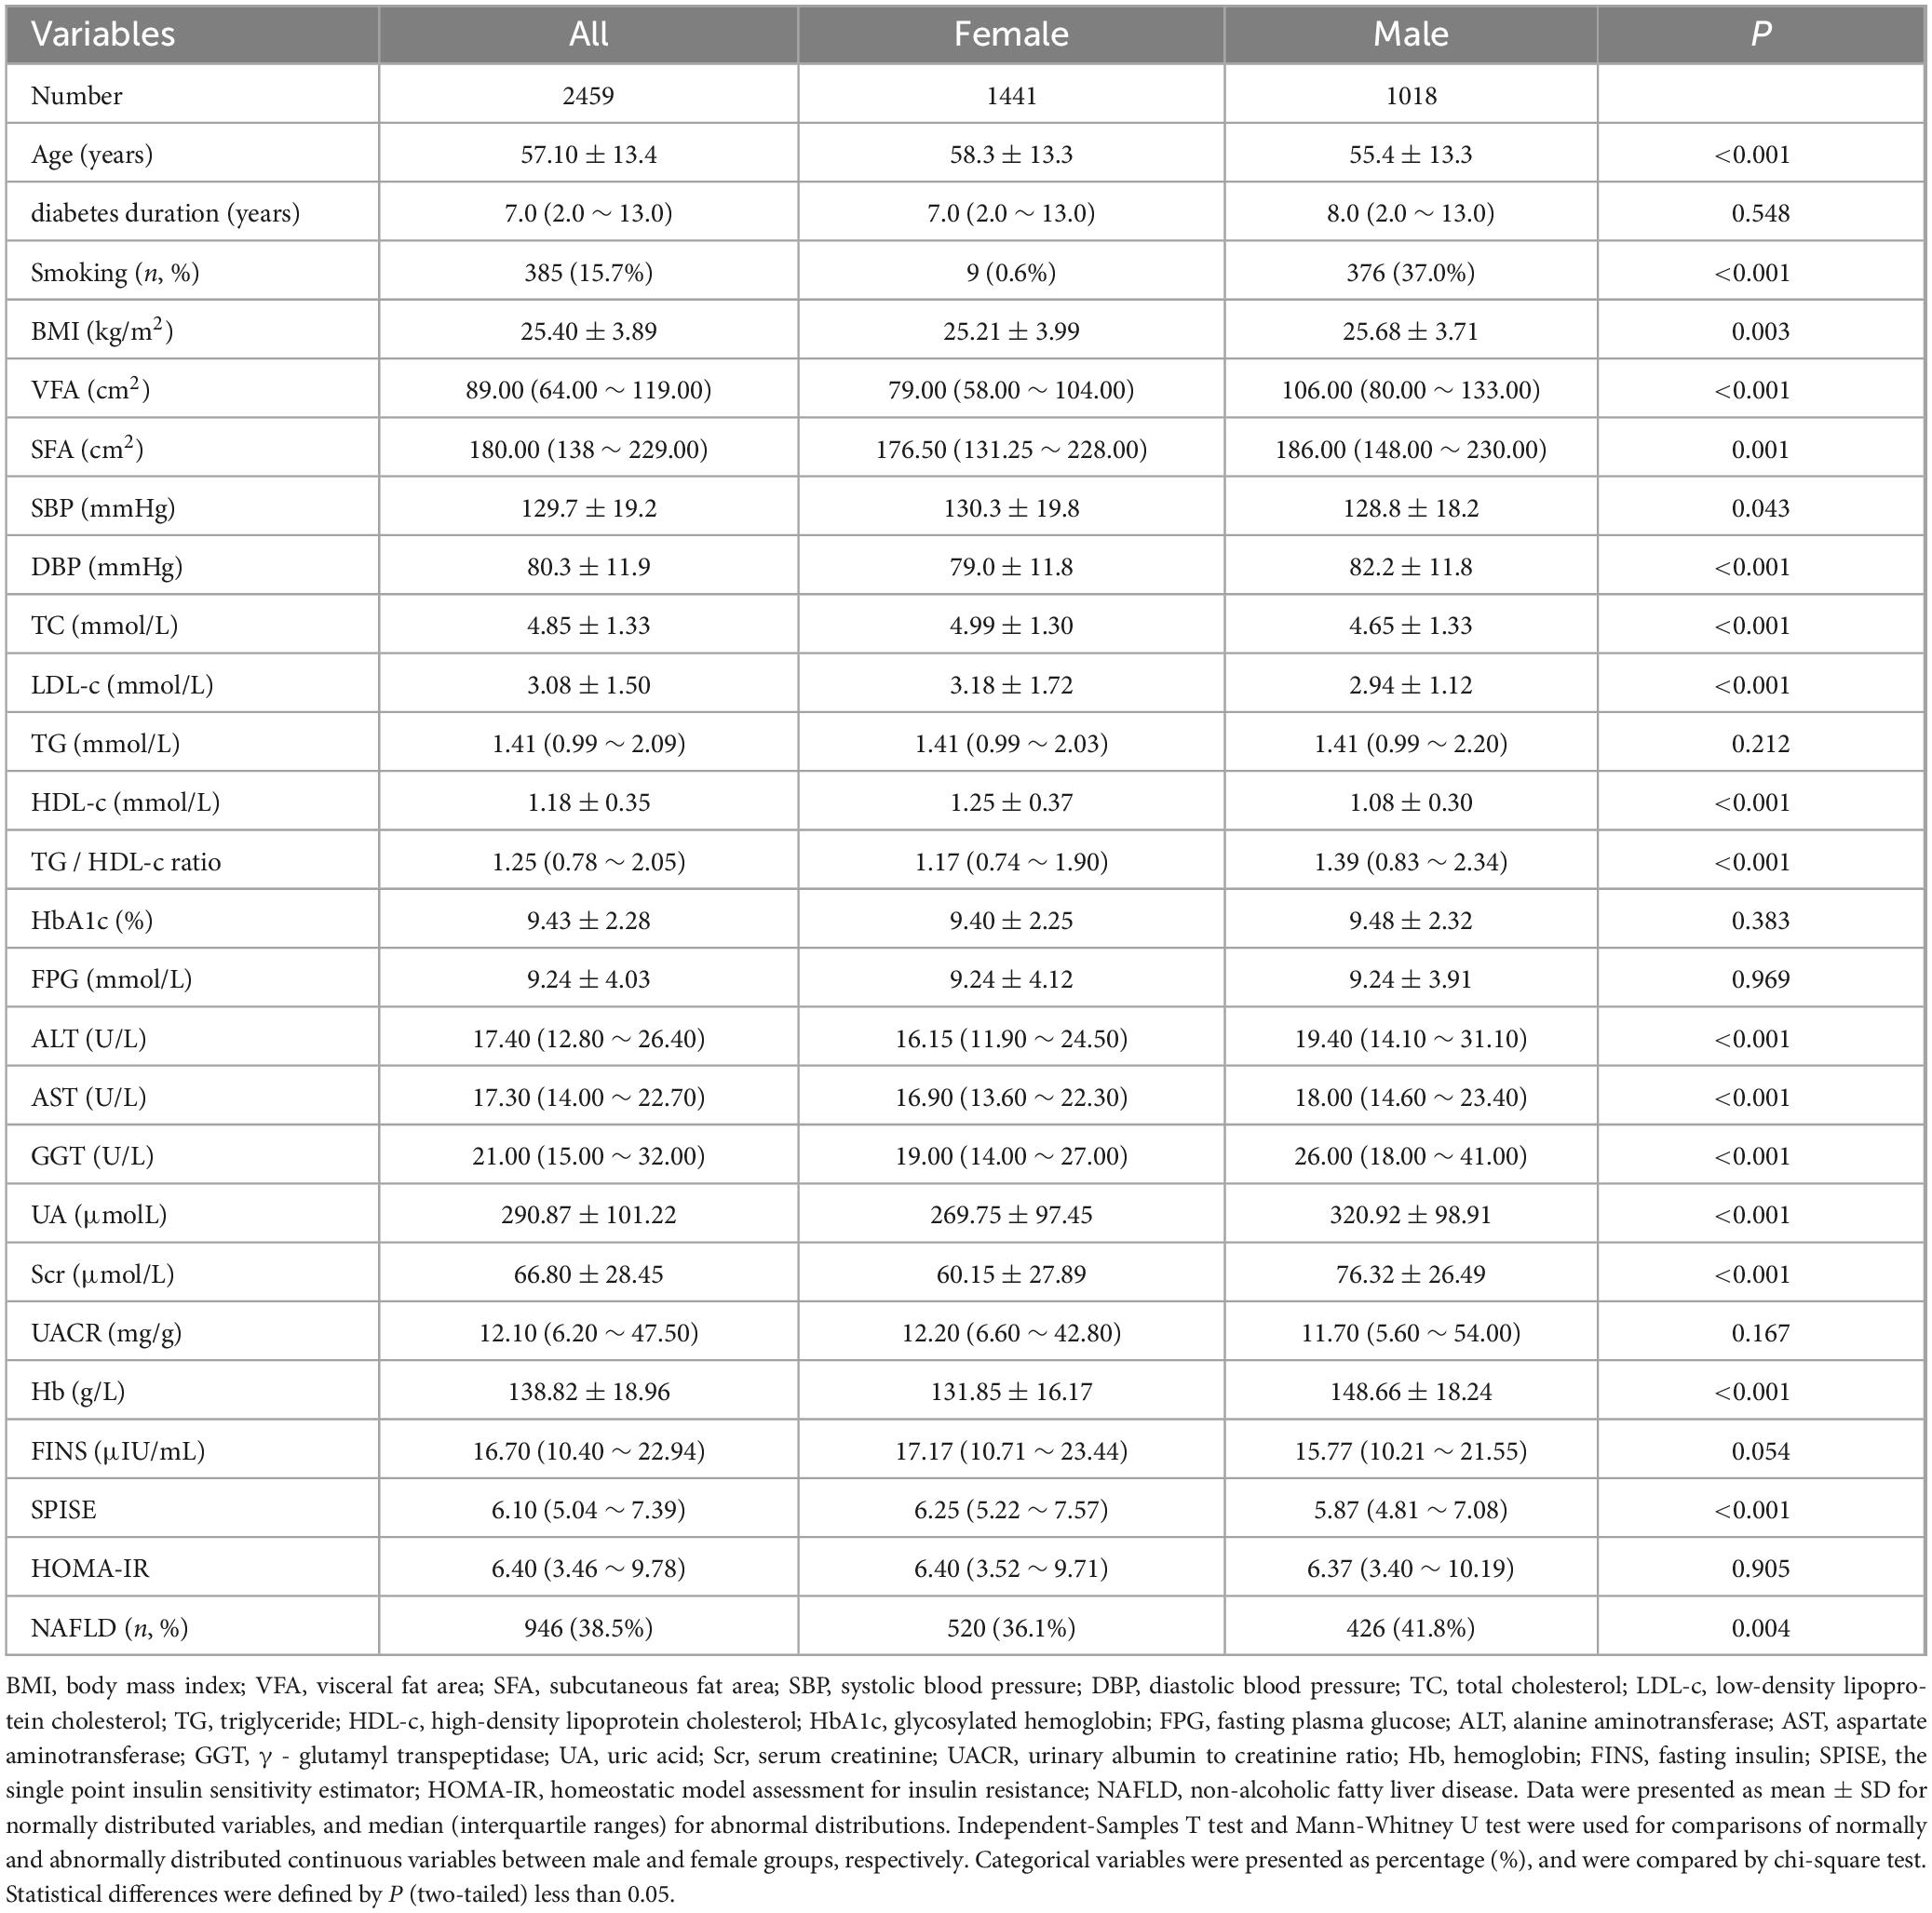
Table 1. Clinical and biochemical characteristics stratified by gender.
As shown in Table 2, for each gender, subjects were divided into two groups, including non-NAFLD and NAFLD groups, and the levels of each variable were compared. For females, compared to the non-NAFLD group, the NAFLD group showed significantly increased BMI, VFA, SFA, SBP, DBP, TC, LDL-c, TG, TG/HDL-c ratio, FPG, ALT, AST, GGT, UA, Hb, FINS and HOMA-IR (all P < 0.05), while age, diabetes duration, HDL-c, Scr, UACR and SPISE were significantly decreased (all P < 0.05). For males, the proportion of smokers and the levels of BMI, VFA, SFA, SBP, DBP, TC, LDL-c, TG, TG/HDL-c ratio, FBG, ALT, AST, GGT, UA, Hb and HOMA-IR were higher in the NAFLD group compared to the non-NAFLD group (all P < 0.05), while age, diabetes duration, HDL-c, Scr, UACR and SPISE were lower (all P < 0.05).
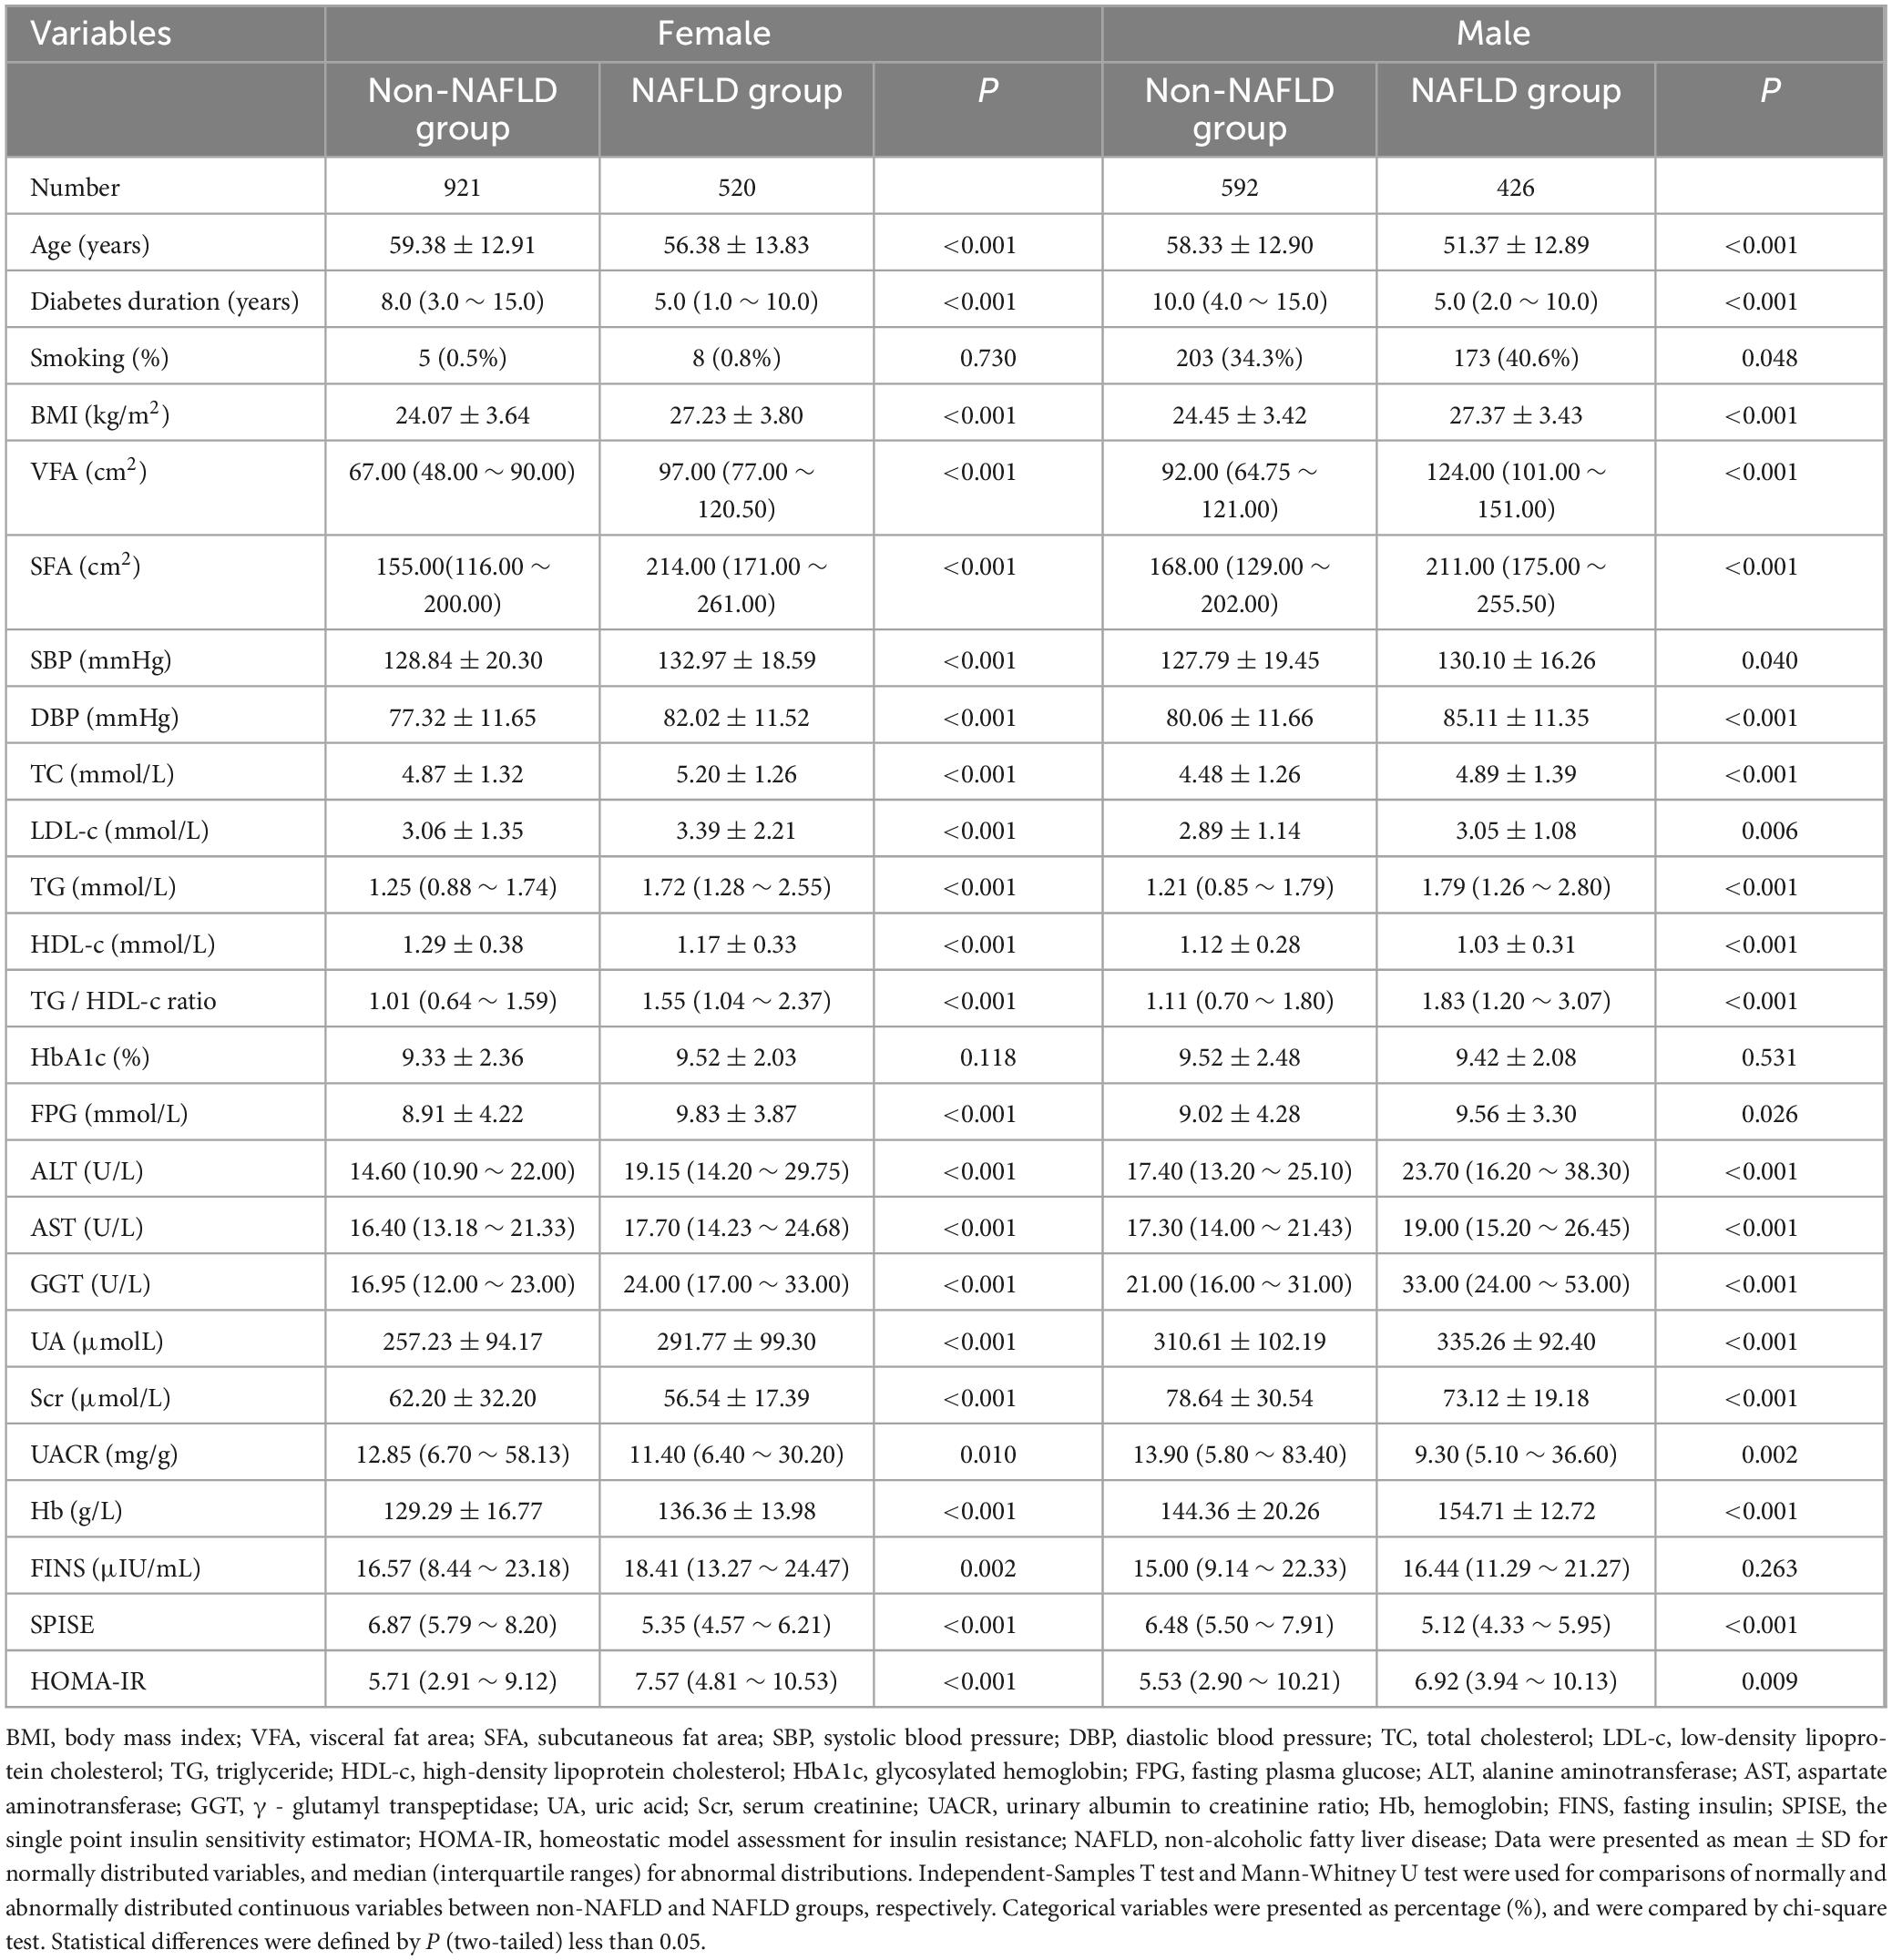
Table 2. Comparison of clinical and biochemical characteristics between non-NAFLD and NAFLD groups.
As shown in Table 3, male and female patients were separately divided into four groups according to the quartiles of the SPISE: Q1 group (female: 2.58–5.22; male: 2.25–4.81), Q2 group (female: 5.22–6.25; male: 4.81–5.87), Q3 group (female: 6.25–7.57; male: 5.87–7.08), and Q4 group (female: 7.57–14.52; male: 7.08–15.05). For the females, as the quartiles of SPISE increased, the duration of diabetes, HDL-c showed a gradual increased, while the age, BMI, VFA, SFA, SBP, DBP, TC, LDL-c, TG, TG/HDL-c, FPG, ALT, AST, GGT, UA, Hb, FINS, HOMA-IR and the incidence of NAFLD exhibited a gradual decreased (all P < 0.05). There was no statistically significant difference in the proportion of smokers, HbA1c, Scr and UACR among the four groups (all P > 0.05). For the males, as the quartiles of SPISE increased, the age, duration of diabetes, HDL-c showed a gradual increased, while the proportion of smokers, BMI, VFA, SFA, SBP, DBP, TC, LDL-c, TG, TG/HDL-c, HbA1c, FPG, ALT, AST, GGT, UA, UACR, Hb, HOMA-IR and the incidence of NAFLD exhibited a gradual decreased (all P < 0.05). There was no statistically significant difference in Scr and FINS among the four groups (all P > 0.05).
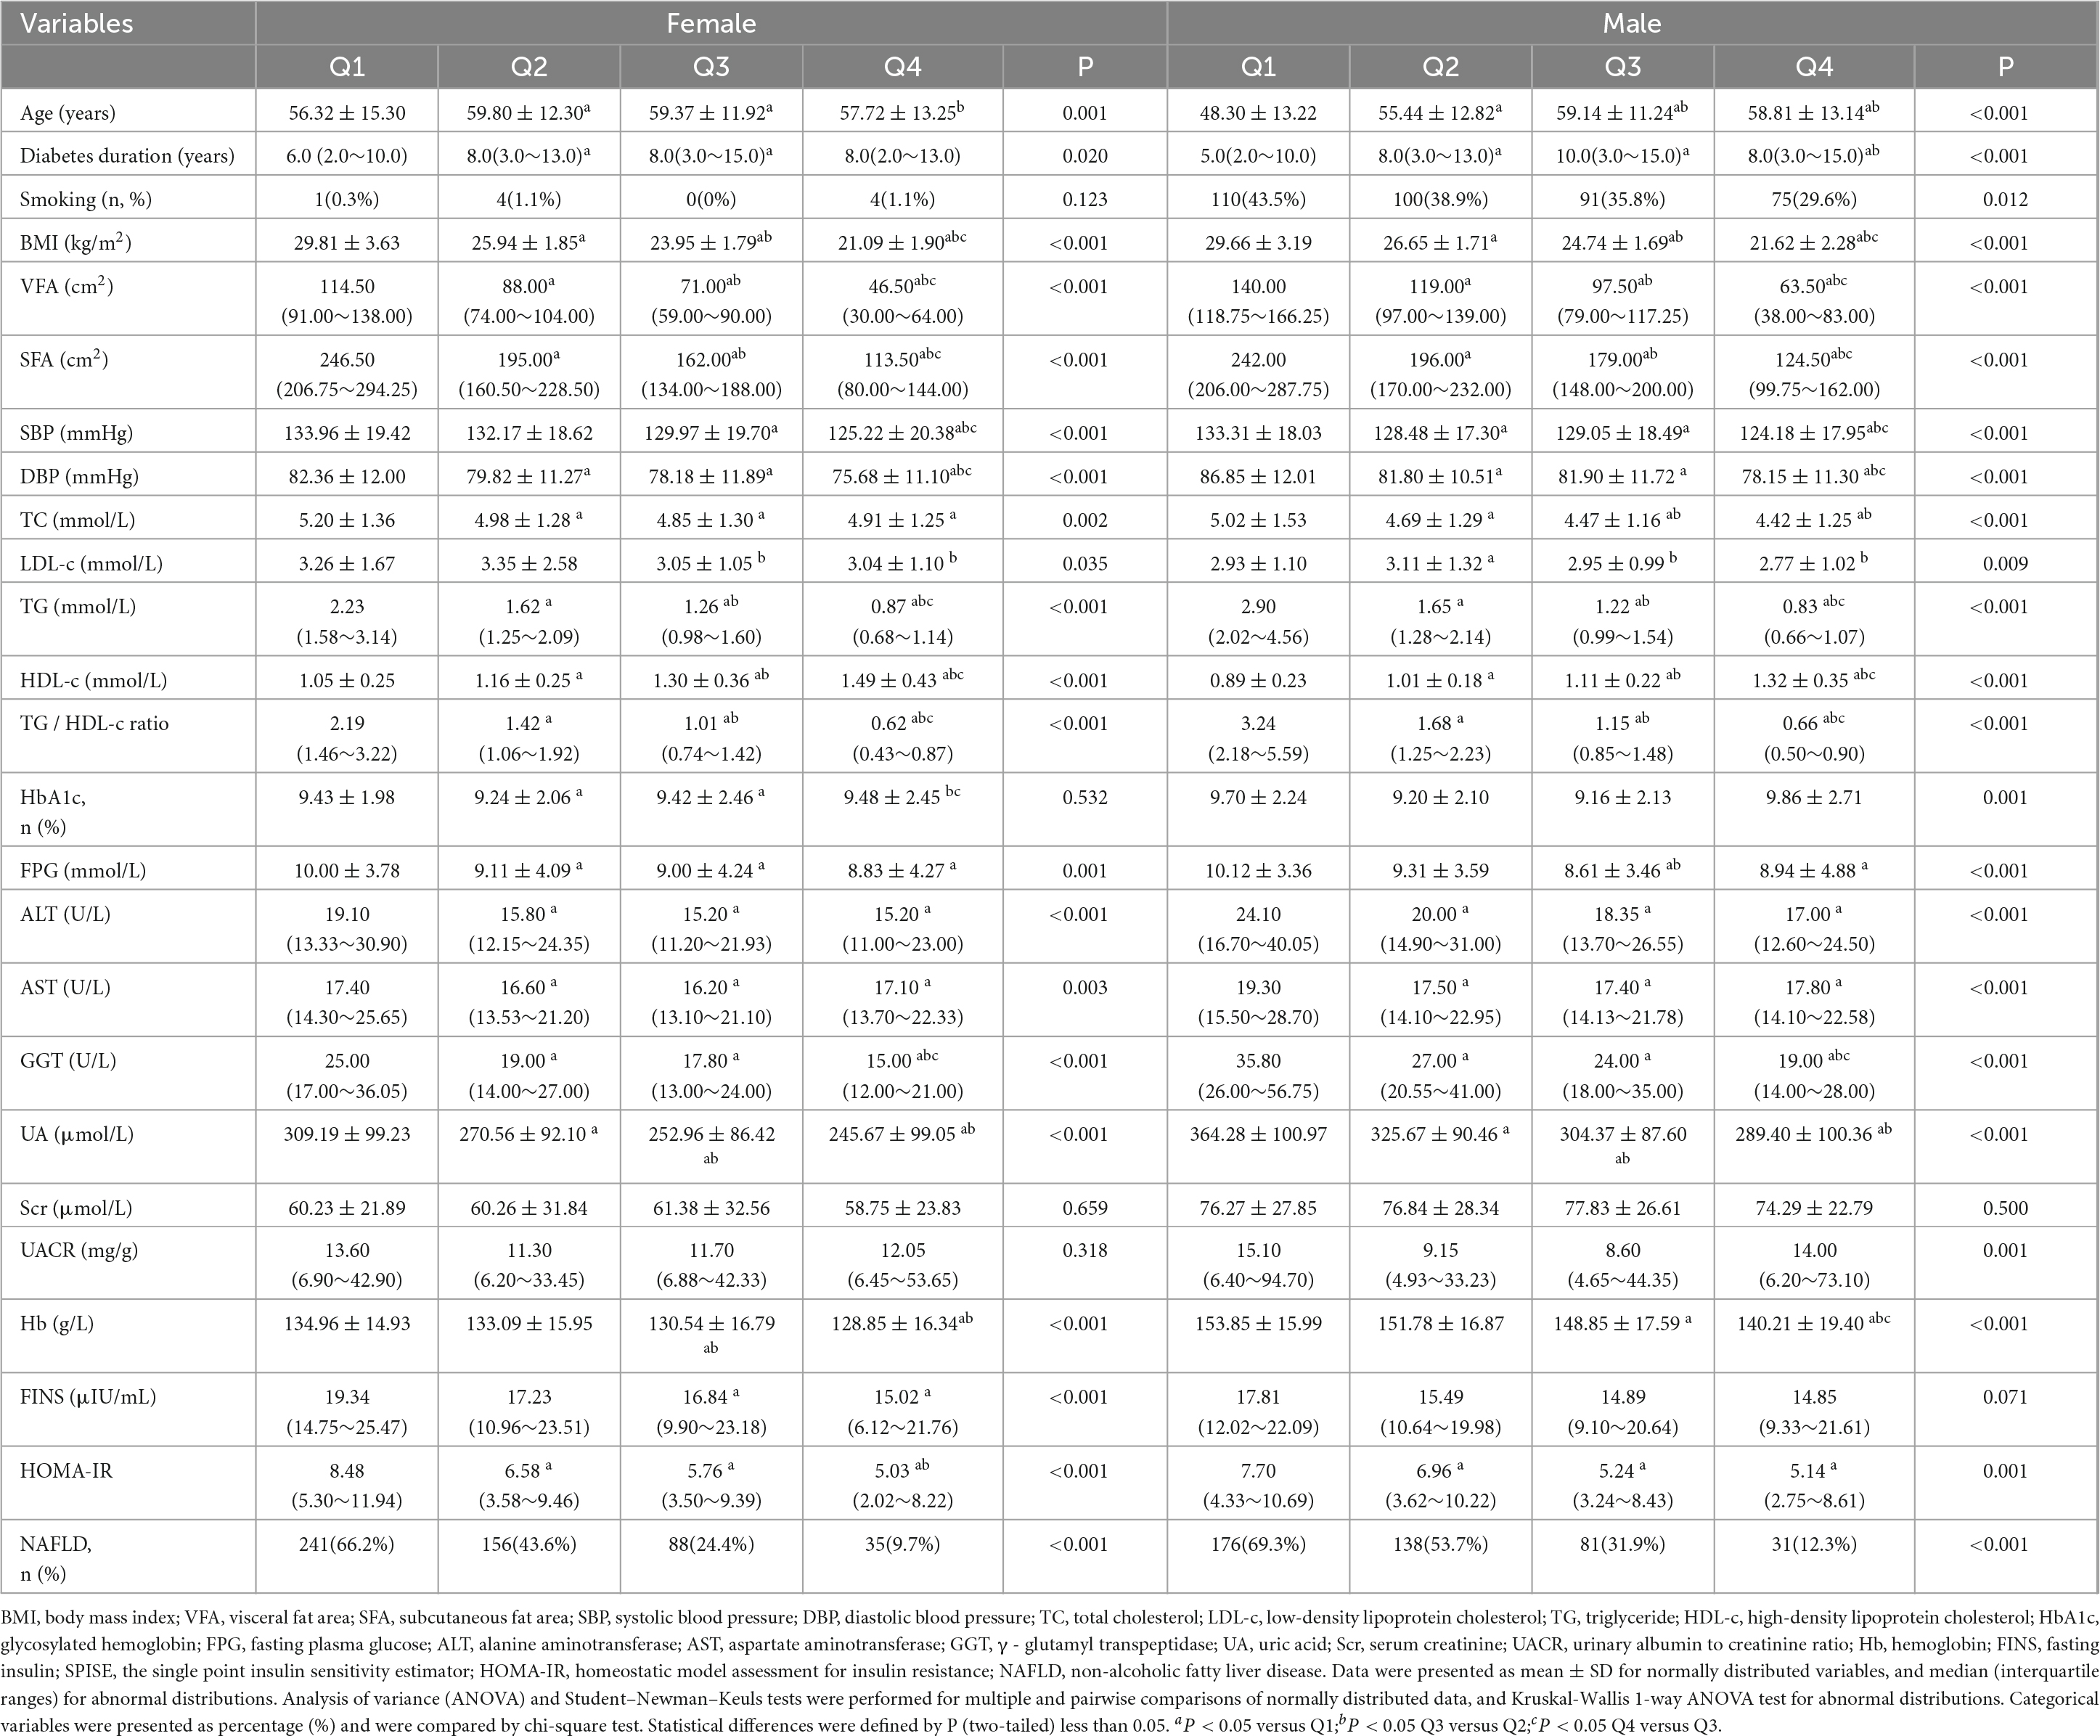
Table 3. Comparison of variables according to the categories of the SPISE.
As shown in Table 4, the relationship between NAFLD and each variable was analyzed using Spearman’s correlation analysis. In females, the results indicated that NAFLD was positively correlated with BMI, VFA, SFA, SBP, DBP, TC, LDL-c, TG, TG/HDL-c, HbA1c, FBG, ALT, AST, GGT, UA, Hb, FINS and HOMA-IR (all P < 0.05), and negatively correlated with age, duration of diabetes, HDL-c, Scr, UACR, and SPISE (all P < 0.05). In males, the proportion of smokers, BMI, VFA, SFA, SBP, DBP, TC, LDL-c, TG, TG/HDL-c, FBG, ALT, AST, GGT, UA, Hb and HOMA-IR were positively correlated with NAFLD, while age, duration of diabetes, HDL-c, UACR and SPISE were negatively correlated (all P < 0.05). In females, there was no significant relationship between NAFLD and the proportion of smokers (all P > 0.05), and in males, there was no apparent relationship between NAFLD and HbA1c, Scr and FINS (all P > 0.05).
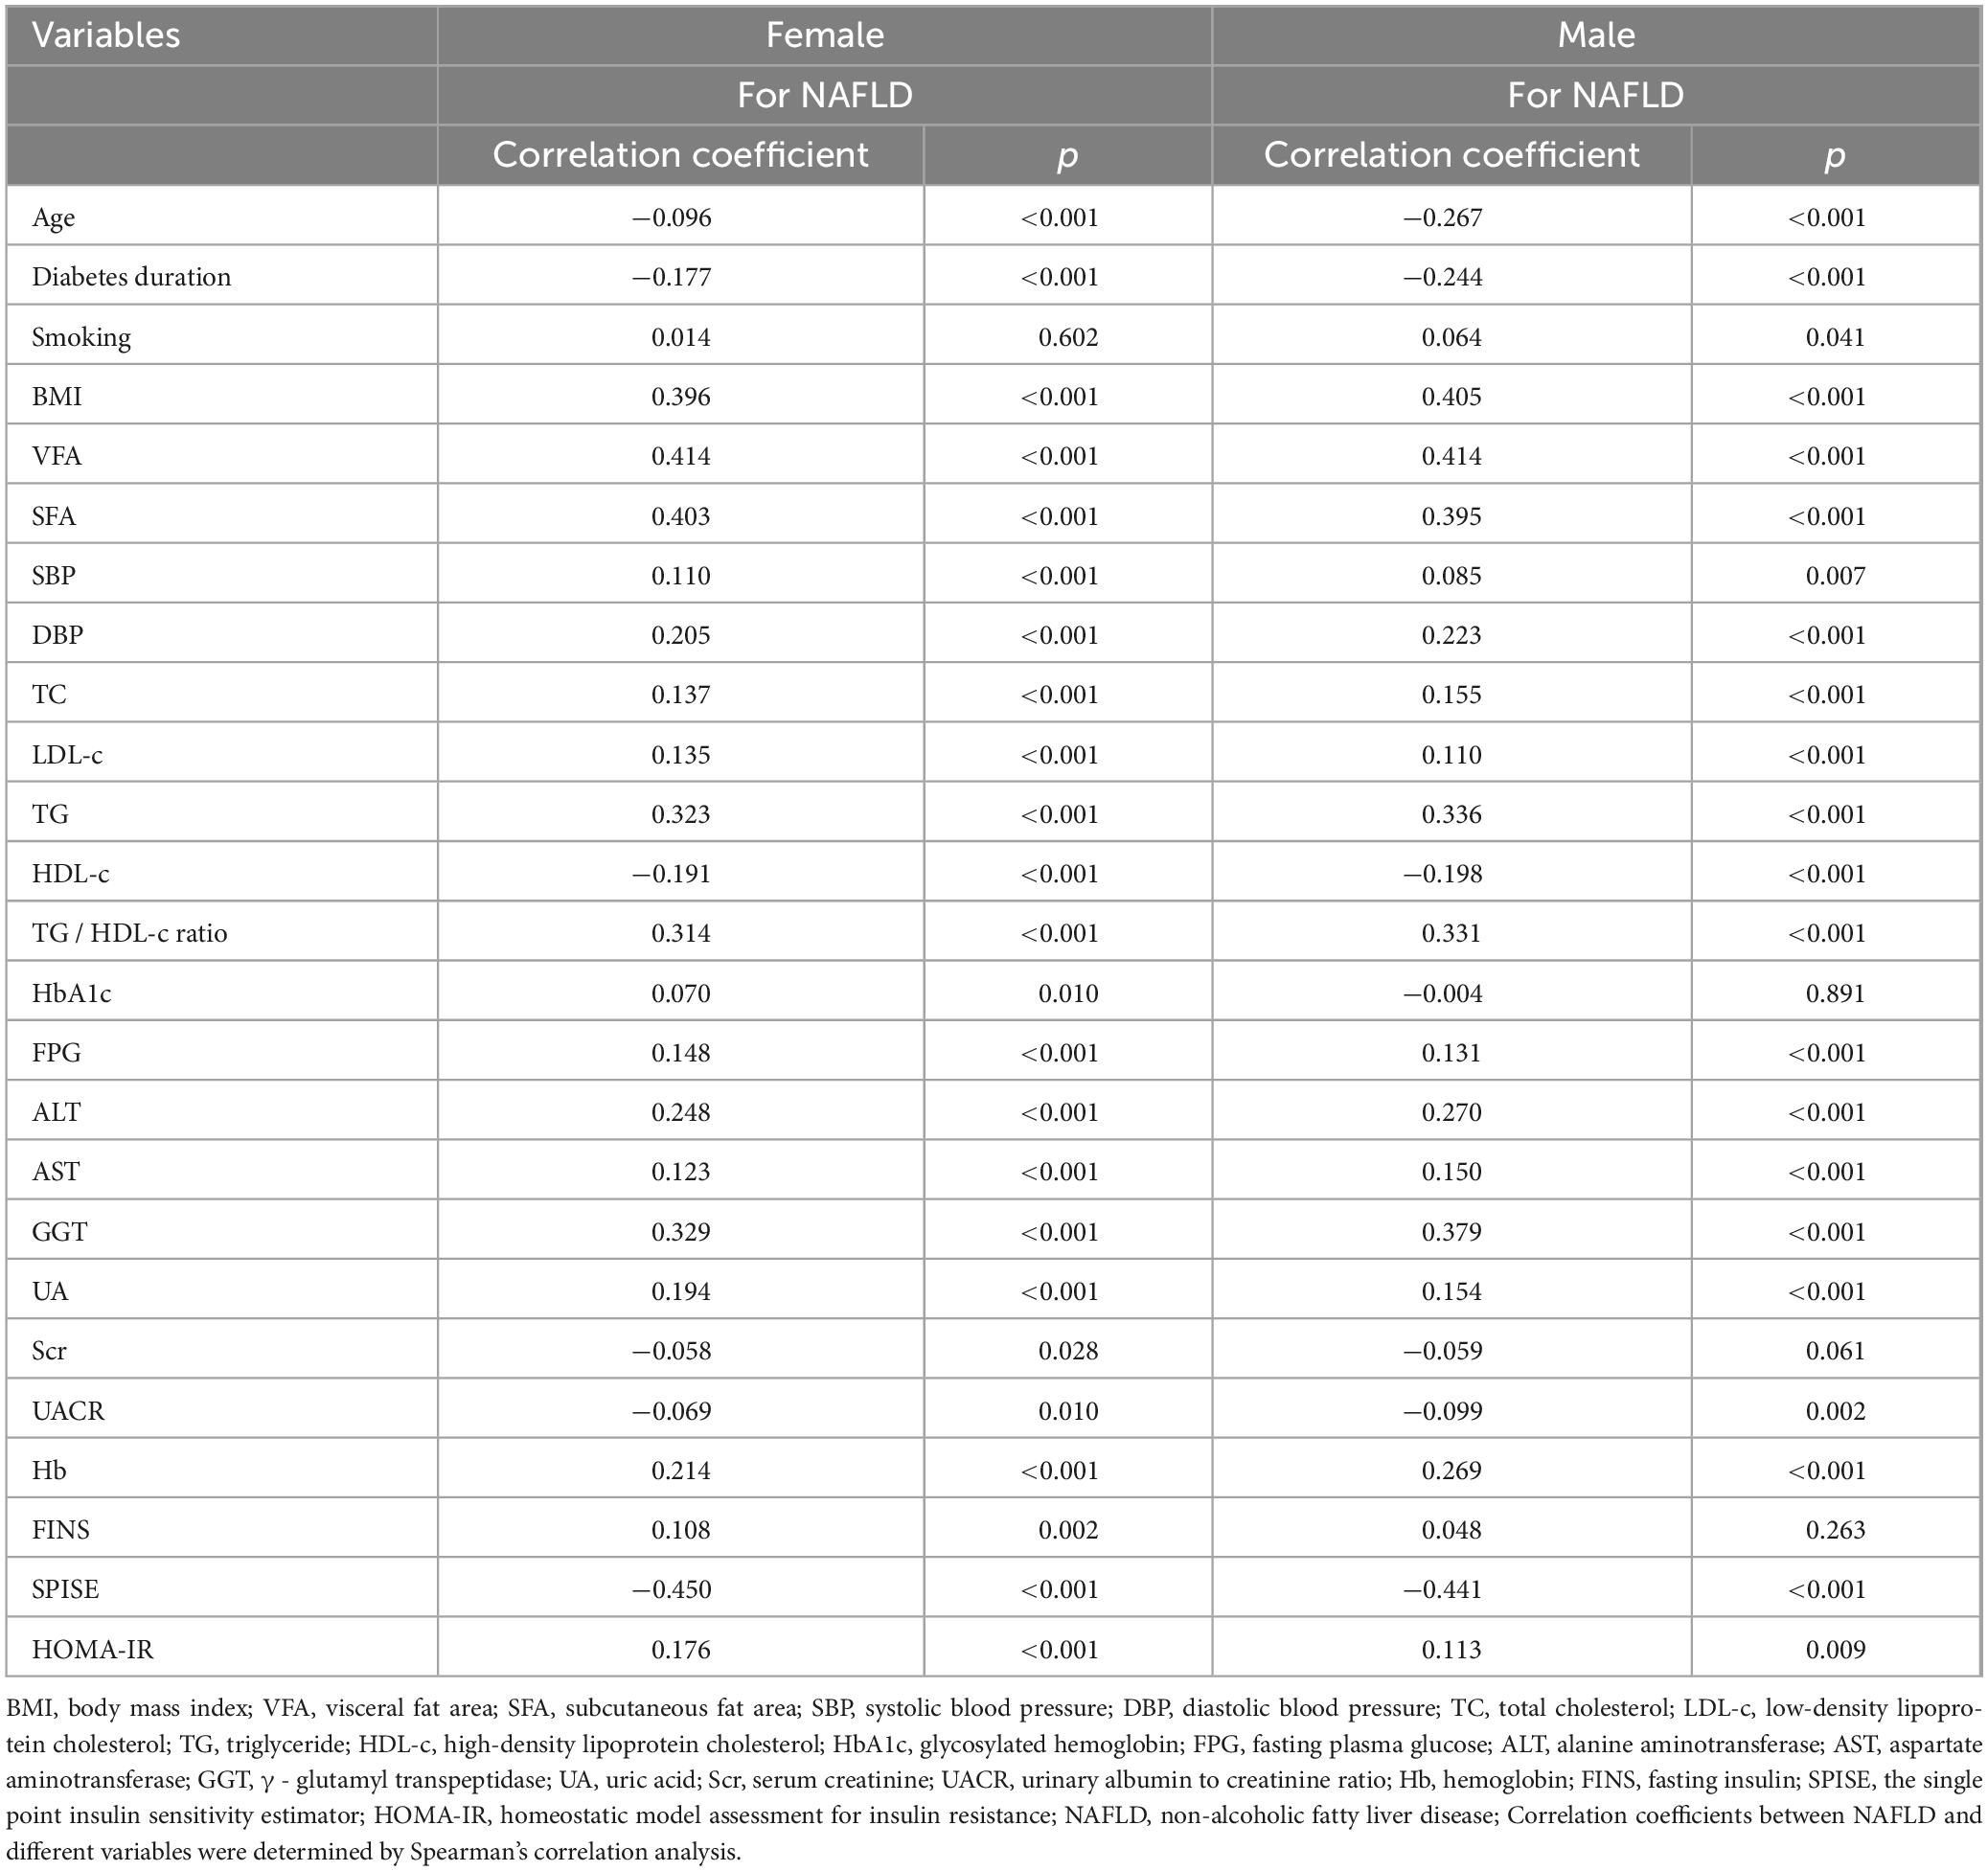
Table 4. The correlation between NAFLD and different variables by univariate analysis.
Using NAFLD as the dependent variable, based on the results of Spearman’s correlation analysis, the independent variables included age, diabetes duration, HDL-c, Scr, UACR, SPISE, BMI, VFA, SFA, SBP, DBP, TC, LDL-c, TG, TG/HDL-c, HbA1c, FBG, ALT, AST, GGT, UA, Hb, FINS and HOMA-IR for females, and the proportion of smokers, age, diabetes duration, HDL-c, UACR, SPISE, BMI, VFA, SFA, SBP, DBP, TC, LDL-c, TG, TG/HDL-c, FBG, ALT, AST, GGT, UA, Hb and HOMA-IR for males. A binary logistic regression analysis was conducted to identify the independent correlates of NAFLD (Table 5). The results indicated that in females, SPISE (OR: 0.572, 95% CI 0.477–0.687), VFA (OR: 1.009, 95% CI 1.001–1.017), FPG (OR: 1.059, 95% CI 1.002–1.120), DBP (OR: 1.026, 95% CI 1.006–1.046), UA (OR: 1.005, 95% CI 1.002–1.008), TC (OR: 1.236, 95% CI 1.036–1.475), and Scr (OR: 0.973, 95% CI 0.958–0.988) were independently associated with NAFLD, while in males, SPISE (OR: 0.737, 95% CI 0.587–0.926), VFA (OR: 1.013, 95% CI 1.005–1.021), diabetes duration (OR: 0.940, 95% CI 0.903–0.978), Hb (OR: 1.030, 95% CI 1.013–1.047), and GGT (OR: 1.009, 95% CI 1.002–1.016) were independently related to NAFLD.
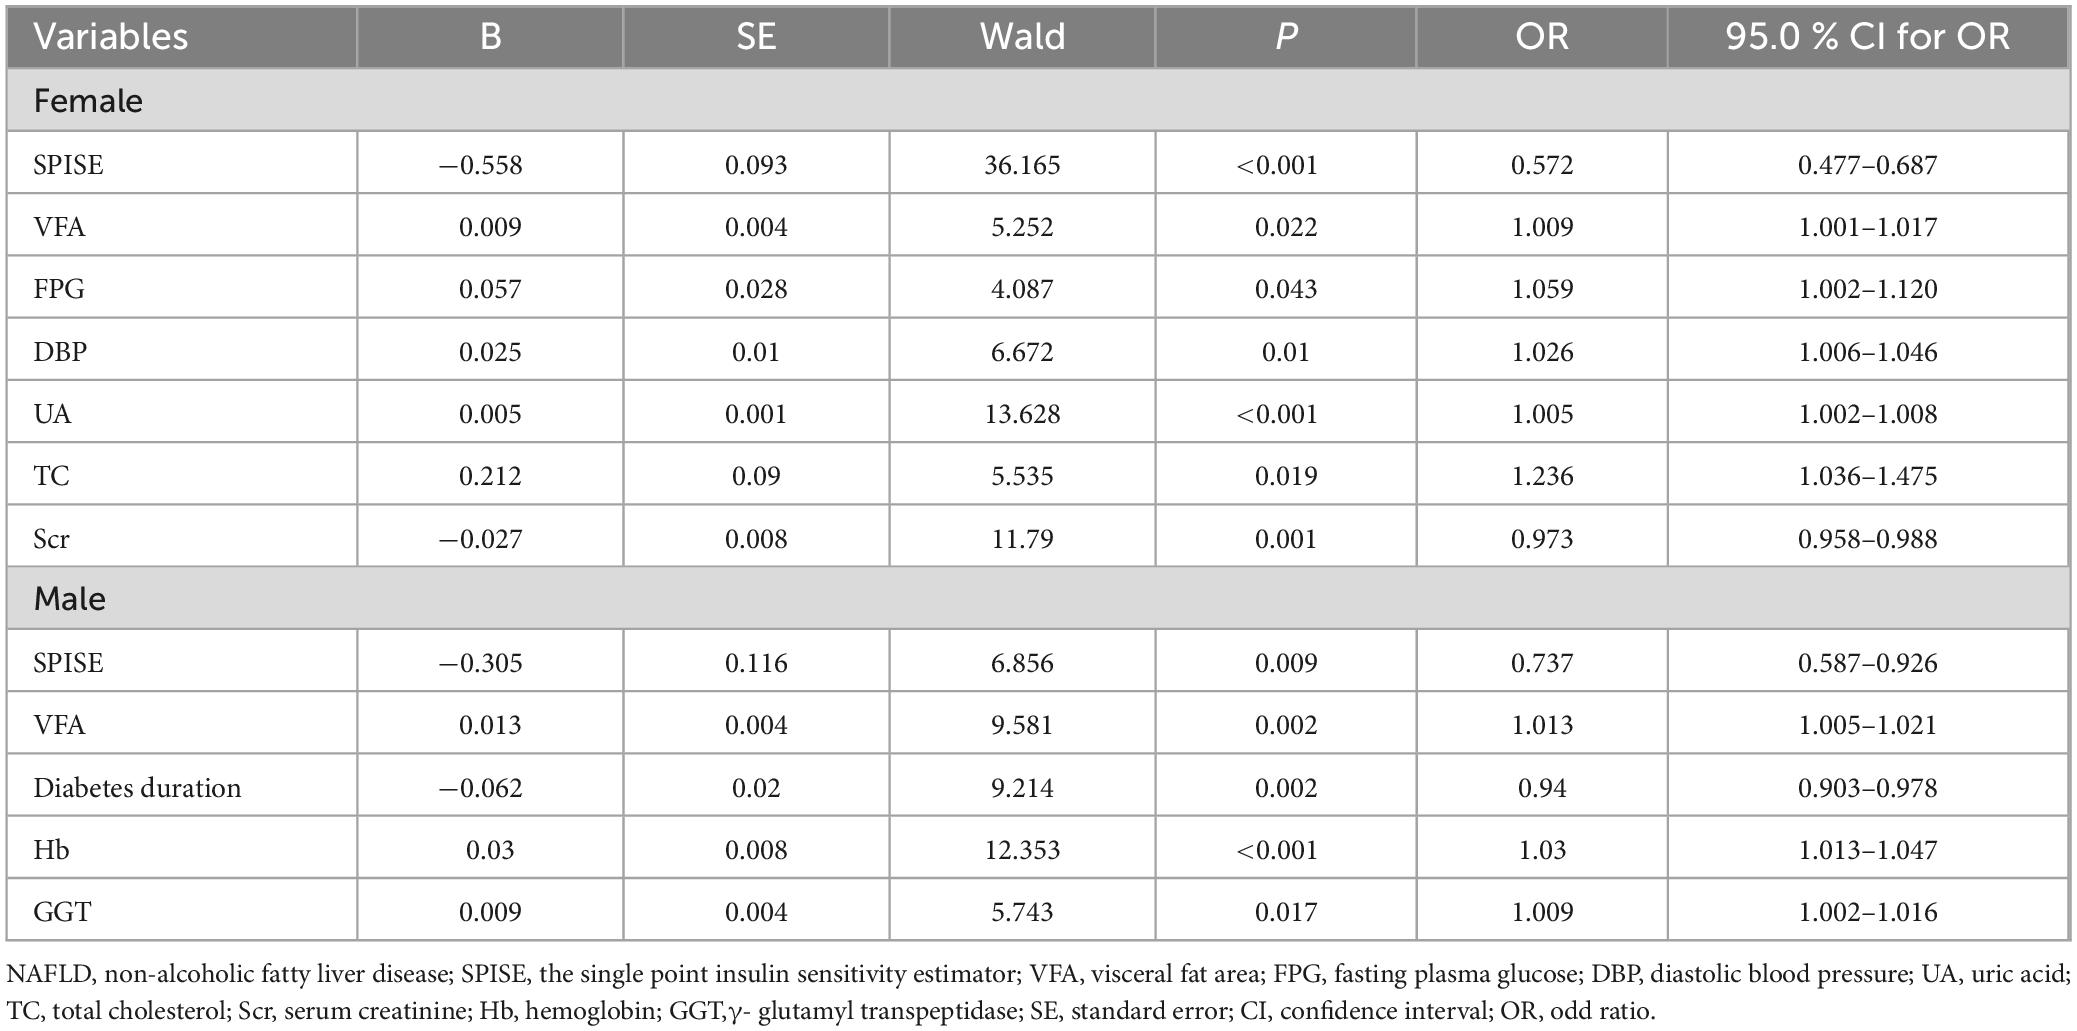
Table 5. The relative risk for NAFLD by logistic regression analysis.
Finally, based on the variables that entered the model last, the formula used to calculate SPISE and the insulin resistance-related indicators, the predictive capabilities of SPISE, HDL-c, diabetes duration, Scr, VFA, BMI, GGT, ALT, TG, TG/HDL-c ratio, HOMA-IR, Hb, UA, and TC for NAFLD were evaluated separately for different genders (Table 6). The results showed that in females, the area under the ROC curve for SPISE was 0.209 (95% CI 0.175–0.244, P < 0.001), and in males, it was 0.268 (95% CI 0.216–0.320, P < 0.001), both of which were superior to the other variables.
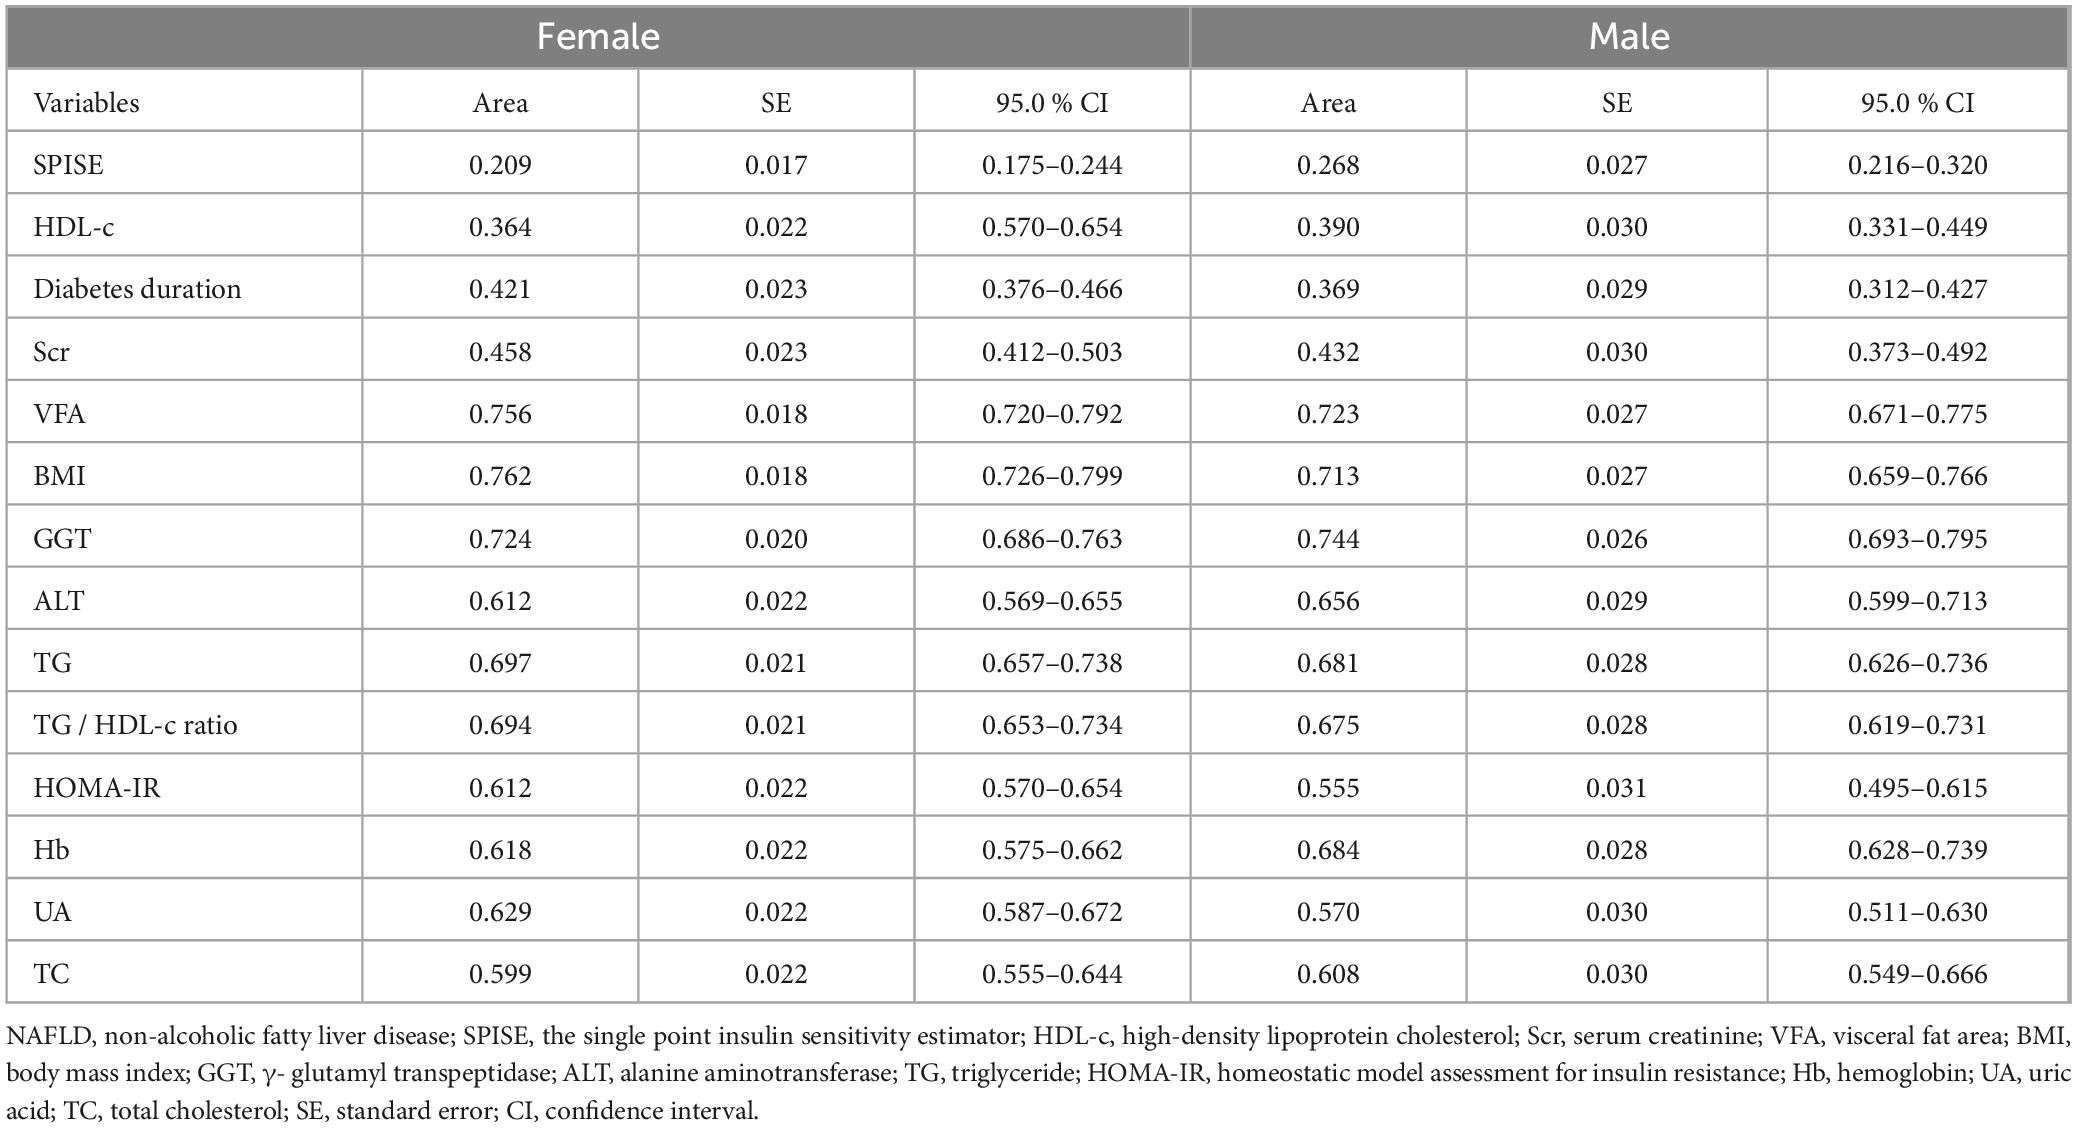
Table 6. Analysis of areas under the ROC curves for predicting NAFLD.
This study found that SPISE was independently associated with NAFLD in T2D population, with no gender differences observed. Additionally, SPISE demonstrated a clear advantage in predicting NAFLD within this population.
NAFLD as the most prevalent liver disease, exhibits an increasing trend in incidence (26). Reports indicated a strong correlation between T2D and NAFLD: the incidence of NAFLD and NASH was particularly pronounced in individuals diagnosed with T2D (9); the existence of NAFLD raised the risk of T2D development by five times (27). In this study, the overall incidence of NAFLD was 38.5%, which is higher than the global incidence rate, further validating the aforementioned perspective (1). Therefore, the high prevalence of NAFLD in T2D population warrants attention. Currently, the routine method for diagnosing NAFLD in clinical practice is through ultrasound. However, due to its time-consuming and labor-intensive nature, it is not suitable for large-scale epidemiological studies. SPISE is an insulin sensitivity index based on lipids and BMI, our study found that it is closely related to traditional IR indicators, including HOMA-IR and the TG/HDL-c ratio. As the SPISE quartiles increased, both HOMA-IR and the TG/HDL-c ratio were gradually decreased. Additionally, some studies had found that the SPISE demonstrated higher accuracy in predicting MetS and IR compared to other measures such as the TG/HDL-c ratio and HOMA-IR (14, 28). Extensive research had confirmed that NAFLD was closely associated with insulin resistance and metabolic syndrome (10, 11, 29, 30). Recent studies have reported that SPISE was closely associated with NAFLD related to adolescent obesity and NAFLD in healthy screening participants (21, 22). However, there is currently a lack of evidence for SPISE as a predictor of NAFLD in T2D population.
Our study corroborated the capability of SPISE to predict NAFLD among T2D population. HOMA-IR and the TG/HDL-c ratio were also closely related to NAFLD (31, 32), and therefore we included these IR-related indicators in our study. The results showed that they did not enter the regression model, and compared to SPISE, their area under the ROC curve was significantly smaller. A Japanese study similarly found that a 1.8-fold increased risk of concurrent NAFLD and T2D was associated with SPISE, aligning with our findings (22). However, that study included only 58 patients with both NAFLD and T2D, whereas our study involved 2,459 T2D patients with NAFLD. Additionally, we conducted gender-stratified analyses, which yielded consistent results, further substantiating the predictive power of SPISE in this group. Beyond IR, dyslipidemia and obesity are also significant factors related to NAFLD (33). SPISE, as a comprehensive indicator that includes metrics related to lipids and obesity, is convenient, accessible and low-cost, making it highly suitable for large-scale clinical application.
In addition, the results of this study indicated that NAFLD was closely associated with VFA in both males and females. This is generally consistent with previous research findings (34). GGT, ALT and AST are liver enzymes closely associated with NAFLD and NASH (35–37). In our analysis of female samples using Spearman’s correlation, AST, GGT, and ALT all showed positive correlations with NAFLD, yet these variables were not included in the final binary logistic regression model. In contrast, in male samples, GGT was incorporated into the regression model. However, the predictive power of the liver enzyme included in the final regression model, as indicated by the area under the ROC curve, remained inferior to that of the SPISE index. This gender discrepancy may stem from differences in research methodologies and sample selection criteria.
This study faces several limitations. Firstly, due to its cross-sectional design, we cannot establish a causal relationship between the SPISE index and NAFLD. Secondly, the diagnosis of NAFLD was not made using the gold standard of liver biopsy, which may lead to diagnostic bias. Lastly, as this study was conducted at a single center, future research should be multi-center in order to further validate our findings and the replication of the study.
This study demonstrated that SPISE may have potential advantages over other commonly used biomarkers in identifying NAFLD among T2D patients. As a simple insulin sensitivity index, the specific utility of SPISE in predicting NAFLD among T2D patients remains to be further investigated.
The original contributions presented in this study are included in this article/supplementary material, further inquiries can be directed to the corresponding authors.
The studies involving humans were approved by Ethics Committee of Linyi People’s Hospital. The studies were conducted in accordance with the local legislation and institutional requirements. The participants provided their written informed consent to participate in this study. Written informed consent was obtained from the individual(s) for the publication of any potentially identifiable images or data included in this article.
HZ: Conceptualization, Data curation, Methodology, Software, Visualization, Writing – original draft, Writing – review and editing. BJ: Methodology, Software, Visualization, Writing – original draft, Writing – review and editing. XW: Investigation, Writing – review and editing. SS: Writing – review and editing. JS: Writing – review and editing. XM: Data curation, Writing – review and editing. GG: Funding acquisition, Visualization, Writing – review and editing. BB: Funding acquisition, Visualization, Writing – review and editing.
The author(s) declare that financial support was received for the research, authorship, and/or publication of this article. Funding for this study was provided by grants from the Postdoctoral Program of the Affiliated Hospital of Jining Medical University (grant no. JYFY322152).
The authors declare that the research was conducted in the absence of any commercial or financial relationships that could be construed as a potential conflict of interest.
All claims expressed in this article are solely those of the authors and do not necessarily represent those of their affiliated organizations, or those of the publisher, the editors and the reviewers. Any product that may be evaluated in this article, or claim that may be made by its manufacturer, is not guaranteed or endorsed by the publisher.
1. Younossi ZM, Koenig AB, Abdelatif D, Fazel Y, Henry L, Wymer M. Global epidemiology of nonalcoholic fatty liver disease-Meta-analytic assessment of prevalence, incidence, and outcomes. Hepatology. (2016) 64(1):73–84. doi: 10.1002/hep.28431
2. Younossi ZM, Golabi P, Paik JM, Henry A, Van Dongen C, Henry L. The global epidemiology of nonalcoholic fatty liver disease (NAFLD) and nonalcoholic steatohepatitis (NASH): A systematic review. Hepatology. (2023) 77(4):1335–47. doi: 10.1097/hep.0000000000000004
3. Paik JM, Golabi P, Younossi Y, Mishra A, Younossi ZM. Changes in the global burden of chronic liver diseases from 2012 to 2017: The growing impact of NAFLD. Hepatology. (2020) 72(5):1605–16. doi: 10.1002/hep.31173
4. Byrne CD, Targher G. NAFLD as a driver of chronic kidney disease. J Hepatol. (2020) 72(4):785–801. doi: 10.1016/j.jhep.2020.01.013
5. Targher G, Byrne CD, Tilg H. NAFLD and increased risk of cardiovascular disease: Clinical associations, pathophysiological mechanisms and pharmacological implications. Gut. (2020) 69(9):1691–705. doi: 10.1136/gutjnl-2020-320622
6. Golabi P, Otgonsuren M, de Avila L, Sayiner M, Rafiq N, Younossi ZM. Components of metabolic syndrome increase the risk of mortality in nonalcoholic fatty liver disease (NAFLD). Medicine (Baltimore). (13) 97:e0214. doi: 10.1097/MD.0000000000010214
7. Basu R, Noureddin M, Clark JM. Nonalcoholic fatty liver disease: Review of management for primary care providers. Mayo Clin Proc. (2022) 97(9):1700–16. doi: 10.1016/j.mayocp.2022.04.005
8. Singal A, Jarvis H, Craig D, Barker R, Spiers G, Stow D, et al. Metabolic risk factors and incident advanced liver disease in non-alcoholic fatty liver disease (NAFLD): A systematic review and meta-analysis of population-based observational studies. PLoS Med. (2020) 17(4): doi: 10.1371/journal.pmed.1003100
9. Younossi ZM, Golabi P, de Avila L, Paik JM, Srishord M, Fukui N, et al. The global epidemiology of NAFLD and NASH in patients with type 2 diabetes: A systematic review and meta-analysis. J Hepatol. (2019) 71(4):793–801. doi: 10.1016/j.jhep.2019.06.021
10. Khan RS, Bril F, Cusi K, Newsome PN. Modulation of insulin resistance in nonalcoholic fatty liver disease. Hepatology. (2019) 70(2):711–24. doi: 10.1002/hep.30429
11. Fujii H, Kawada N, Japan Study Group of NAFLD The role of insulin resistance and diabetes in nonalcoholic fatty liver disease. Int J Mol Sci. (2020) 21(11): doi: 10.3390/ijms21113863
12. Muzurović E, Mikhailidis DP, Mantzoros C. Non-alcoholic fatty liver disease, insulin resistance, metabolic syndrome and their association with vascular risk. Metabolism. (2021) 119:154770. doi: 10.1016/j.metabol.2021.154770
13. DeFronzo RA, Tobin JD, Andres R. Glucose clamp technique: A method for quantifying insulin secretion and resistance. Am J Physiol. (1979) 237(3):E214–23. doi: 10.1152/ajpendo.1979.237.3.E214
14. Paulmichl K, Hatunic M, Højlund K, Jotic A, Krebs M, Mitrakou A, et al. Modification and validation of the Triglyceride-to-HDL cholesterol ratio as a surrogate of insulin sensitivity in white juveniles and adults without diabetes mellitus: The single point insulin sensitivity estimator (SPISE). Clin Chem. (2016) 62(9):1211–9. doi: 10.1373/clinchem.2016.257436
15. Sagesaka H, Sato Y, Someya Y, Tamura Y, Shimodaira M, Miyakoshi T, et al. Type 2 diabetes: When does it start? J Endocr Soc. (2018) 2(5):476–84. doi: 10.1210/js.2018-00071
16. Seo MW, Cho W, Kim JY. The single point insulin sensitivity estimator (SPISE) index as a predictor of metabolic syndrome in Korean adults. Obes Res Clin Pract. (2023) 17(3):198–202. doi: 10.1016/j.orcp.2023.05.001
17. Correa-Burrows P, Blanco E, Gahagan S, Burrows R. Validity assessment of the single-point insulin sensitivity estimator (spise) for diagnosis of cardiometabolic risk in post-pubertal hispanic adolescents. Sci Rep. (2020) 10(1):14399. doi: 10.1038/s41598-020-71074-y
18. Deng S, Hu X, Zhang X. Association of single-point insulin sensitivity estimator index (SPISE) with future cardiovascular outcomes in patients with type 2 diabetes. Diabetes Obes Metab. (2024): doi: 10.1111/dom.15600
19. Barchetta I, Dule S, Bertoccini L, Cimini FA, Sentinelli F, Bailetti D, et al. The single-point insulin sensitivity estimator (SPISE) index is a strong predictor of abnormal glucose metabolism in overweight/obese children: A long-term follow-up study. J Endocrinol Invest. (2022) 45(1):43–51. doi: 10.1007/s40618-021-01612-6
20. Correa-Burrows P, Matamoros M, de Toro V, Zepeda D, Arriaza M, Burrows R. A Single-point insulin sensitivity estimator (SPISE) of 5.4 is a good predictor of both metabolic syndrome and insulin resistance in adolescents with obesity. Front Endocrinol (Lausanne). (2023) 14:1078949. doi: 10.3389/fendo.2023.1078949
21. Furthner D, Anderwald CH, Bergsten P, Forslund A, Kullberg J, Ahlström H, et al. Single point insulin sensitivity estimator in pediatric non-alcoholic fatty liver disease. Front Endocrinol (Lausanne). (2022) 13:830012. doi: 10.3389/fendo.2022.830012
22. Miyakoshi T, Sagesaka H, Sato Y, Hirbayashi K, Koike H, Yamashita K, et al. Reappraisal of attenuated insulin sensitivity in the evolution of non-alcoholic fatty liver disease. Eur J Clin Nutr. (2019) 73(5):770–5. doi: 10.1038/s41430-018-0246-3
23. Ting YW, Jalaludin MY, Zaini AA, Mohamed R. Triglyceride to high-density lipoprotein cholesterol ratio is an independent predictor of liver fibrosis among pediatrics non-alcoholic fatty liver disease. Front Endocrinol (Lausanne). (2022) 13:1071350. doi: 10.3389/fendo.2022.1071350
24. Marugame T, Yamamoto S, Yoshimi I, Sobue T, Inoue M. Tsugane: Patterns of alcohol drinking and all-cause mortality: Results from a large-scale population-based cohort study in Japan. Am J Epidemiol. (2007) 165(9):1039–46. doi: 10.1093/aje/kwk112
25. Matthews DR, Hosker JP, Rudenski AS, Naylor BA, Treacher DF, Turner RC. Homeostasis model assessment: Insulin resistance and beta-cell function from fasting plasma glucose and insulin concentrations in man. Diabetologia. (1985) 28(7):412–9. doi: 10.1007/bf00280883
26. Fazel Y, Koenig AB, Sayiner M, Goodman ZD, Younossi ZM. Epidemiology and natural history of non-alcoholic fatty liver disease. Metabolism. (2016) 65(8):1017–25. doi: 10.1016/j.metabol.2016.01.012
27. Shibata M, Kihara Y, Taguchi M, Tashiro M, Otsuki M. Nonalcoholic fatty liver disease is a risk factor for type 2 diabetes in middle-aged Japanese men. Diabetes Care. (2007) 30(11):2940–4. doi: 10.2337/dc07-0792
28. Rabari K, Naithani M, Patra P, Sonagara N, Dudi P, Goyal B, et al. Single-point insulin sensitivity estimator (SPISE) as a feasible marker of insulin resistance in adult metabolic syndrome: Evaluated in a hospital based cross-sectional pilot study at tertiary care centre of Uttarakhand. Indian J Clin Biochem. (2021) 37(3):356–60. doi: 10.1007/s12291-021-00992-z
29. Yki-Järvinen H. Non-alcoholic fatty liver disease as a cause and a consequence of metabolic syndrome. Lancet Diabetes Endocrinol. (2014) 2(11):901–10. doi: 10.1016/s2213-8587(14)70032-4
30. Yip TC, Wong GL, Wong VW, Goh GB, Chan WK. Nonalcoholic fatty liver disease: A unique entity or part of the metabolic syndrome or both. Med Clin North Am. (2023) 107(3):449–63. doi: 10.1016/j.mcna.2022.12.003
31. Gutierrez-Buey G, úñez-Córdoba JMN, Llavero-Valero M, Gargallo J, Salvador J, Escalada J. Is HOMA-IR a potential screening test for non-alcoholic fatty liver disease in adults with type 2 diabetes? Eur J Intern Med. (2017) 41:74–8. doi: 10.1016/j.ejim.2017.03.006
32. Catanzaro R, Selvaggio F, Sciuto M, Zanoli L, Yazdani A, He F, et al. Triglycerides to high-density lipoprotein cholesterol ratio for diagnosing nonalcoholic fatty liver disease. Minerva Gastroenterol (Torino). (2022) 68(3):261–8. doi: 10.23736/s2724-5985.21.02818-x
33. Cotter TG, Rinella M. Nonalcoholic fatty liver disease 2020: the state of the disease. Gastroenterology. (2020) 158(7):1851–64. doi: 10.1053/j.gastro.2020.01.052
34. Ha Y, Seo N, Shim JH, Kim SY, Park JA, Han S, et al. Intimate association of visceral obesity with non-alcoholic fatty liver disease in healthy Asians: A case-control study. J Gastroenterol Hepatol. (2015) 30(11):1666–72. doi: 10.1111/jgh.12996
35. Ha Y, Chon YE, Kim MN, Lee JH, Hwang SG. Gamma-glutamyl transpeptidase dynamics as a biomarker for advanced fibrosis in non-alcoholic fatty liver disease. J Gastroenterol Hepatol. (2022) 37(8):1624–32. doi: 10.1111/jgh.15871
36. Schindhelm RK, Diamant M, Dekker JM, Tushuizen ME, Teerlink T, Heine RJ. Alanine aminotransferase as a marker of non-alcoholic fatty liver disease in relation to type 2 diabetes mellitus and cardiovascular disease. Diabetes Metab Res Rev. (2006) 22(6):437–43. doi: 10.1002/dmrr.666
Keywords: type 2 diabetes, SPISE, NAFLD, insulin sensitivity, insulin resistance
Citation: Zhao H, Ji B, Wang X, Shi S, Sheng J, Ma X, Ban B and Gao G (2025) Association between SPISE and NAFLD in patients with type 2 diabetes. Front. Med. 12:1454938. doi: 10.3389/fmed.2025.1454938
Received: 26 June 2024; Accepted: 06 January 2025;
Published: 22 January 2025.
Edited by:
Aivaras Ratkevicius, Queen Mary University of London, United KingdomReviewed by:
Kulvinder Kochar Kaur, Kulvinder Kaur Centre For Human Reproduction, IndiaCopyright © 2025 Zhao, Ji, Wang, Shi, Sheng, Ma, Ban and Gao. This is an open-access article distributed under the terms of the Creative Commons Attribution License (CC BY). The use, distribution or reproduction in other forums is permitted, provided the original author(s) and the copyright owner(s) are credited and that the original publication in this journal is cited, in accordance with accepted academic practice. No use, distribution or reproduction is permitted which does not comply with these terms.
*Correspondence: Guanqi Gao, Z3VhbnFpX2dhb0B5ZWFoLm5ldA==; Bo Ban, YmFuYm8yMDExQDE2My5jb20=
†These authors have contributed equally to this work and share first authorship
Disclaimer: All claims expressed in this article are solely those of the authors and do not necessarily represent those of their affiliated organizations, or those of the publisher, the editors and the reviewers. Any product that may be evaluated in this article or claim that may be made by its manufacturer is not guaranteed or endorsed by the publisher.
Research integrity at Frontiers
Learn more about the work of our research integrity team to safeguard the quality of each article we publish.